Embed Size (px)
Citation preview
Contents lists available at ScienceDirect
Materials Science in Semiconductor Processing
Materials Science in Semiconductor Processing 30 (2015) 625–630
http://d1369-80(http://c
n CorrE-m
journal homepage: www.elsevier.com/locate/mssp
Short Communication
Fabrication of a novel graphene nano-sheet electrodeembedded with nano-particles of zirconium dioxidefor electrochemical capacitors: Ions-redeposition on thesurface of nanoporous electrode
Mahdi Nasibi a,b, Mohammad Reza Shishesaz a, Mahdi Robat Sarpoushi a,n,Mohammad Reza Borhani c, Zaki Ahmad d,e
a Technical Inspection Engineering Department, Petroleum University of Technology, Abadan, Iranb Health, Safety and Environment (HSE) Engineering Office, NIOPDC, Yazd Region, Yazd 89167-84395, Iranc Department of Materials Engineering, Malek Ashtar University of Technology, ShahinShahr, Isfahan, Irand Adjunct Professor, COMSATS University, Lahore, Pakistane Prof Emeritus, KFUPM, Dhahran, Saudi Arabia
a r t i c l e i n f o
Keywords:Electrode materialElectrochemical capacitorsMicrostructureEnergy storage and conversion
x.doi.org/10.1016/j.mssp.2014.11.00701/& 2014 The Authors. Published by Elsevireativecommons.org/licenses/by-nc-nd/3.0/)
esponding author.ail address: [email protected] (M
a b s t r a c t
In this paper, the effect of charge/discharge cycles on the electrode containing nano-zirconium oxide, nanoporous carbon black and graphene nanosheets in electrochemicalcapacitors has been described. Surface morphology and electrochemical performance ofthe prepared electrode have also been conducted. The electrode prepared from graphenenanosheets (GNS), nanoporous carbon black (NCB), zirconium oxide (ZrO2), and poly-tetrafluoroethylene (PTFE) in molar ratio of 54:09:27:10 respectively showed a maximumspecific capacitance as high as 11.84 F g�1 in the potential range between �0.45 and0.35 V (V vs. SCE) at a scan rate of 10 mV s�1 in a 3 M NaCl electrolyte. The electro-chemical results show the low ratio of the outer to total charge (qnO/qnT) which confirms thelow current response and higher voltage reversal at the end potentials. SEM imagesconfirms the ions re-deposit as agglomerates and accompanied by a drastic decrease inthe surface area on the surface of the electrode after one charge/discharge cycle.& 2014 The Authors. Published by Elsevier Ltd. This is an open access article under the CC
BY-NC-ND license (http://creativecommons.org/licenses/by-nc-nd/3.0/).
1. Introduction
Electrochemical capacitors also known as supercapaci-tors in recent terminology although known since 1957[1–3] have undergone a dramatic transformation in recentyears because of their promising potential to deliver morepower than batteries and store more energy than conven-tional capacitors. An understanding of the greater chargemechanism role of nano-materials, dissolution kinetics of
er Ltd. This is an open acces.
.R. Sarpoushi).
solvated ions in the pores has led to the higher capacitanceof electrochemical capacitors by using carbon electrodesand opened the door for high energy devices. Nano-materials provide high electrical conductivity, short iondiffusion pathways, and can provide an excellent inter-facial integrity to the system. Currently, many laboratoriesare actively engaged in the development of new types ofelectrode materials, and most of the research has beenfocused on the development of nanoporous materials forelectrochemical capacitors [4,5]. Although the demand fordeveloping new porous electrode materials with higherspecific surface area is increasing, the problem of electro-lyte ions re-deposition on the pore walls and blocking
s article under the CC BY-NC-ND license
M. Nasibi et al. / Materials Science in Semiconductor Processing 30 (2015) 625–630626
them is very challenging. Re-deposition of electrolyte ionsand active materials on the electrode decreases the activespecific surface area and the charge stored on the elec-trode. Transition metal oxides are considered to be themost suitable candidate materials for electrochemicalcapacitors. This stems from the high specific capacitancecoupled with very low resistance resulting in a highspecific power which makes them suitable for commercialapplications. As investigated by Nasibi et al. zirconiumoxide demonstrate capacitive behavior in 2 M KCl electro-lyte [6].
The aim of this paper is to investigate the charge distribu-tion ability of nanoporous NCB/GNS/ZrO2 electrode and theeffect of electrolyte ions and active material re-deposition onthis electrode. Mechanical pressing was used as a fast andeasy method to fabricate the electrode. The products werethen evaluated as possible candidate electrode materials forelectrochemical capacitors using techniques including cyclicvoltammetry, electrochemical impedance spectroscopy andscanning electron microscopy.
2. Experimental
2.1. Materials
Nanoporous (o10 nm in diameter) carbon black (NCB)micro-sized particles (o2 μm) were purchased from
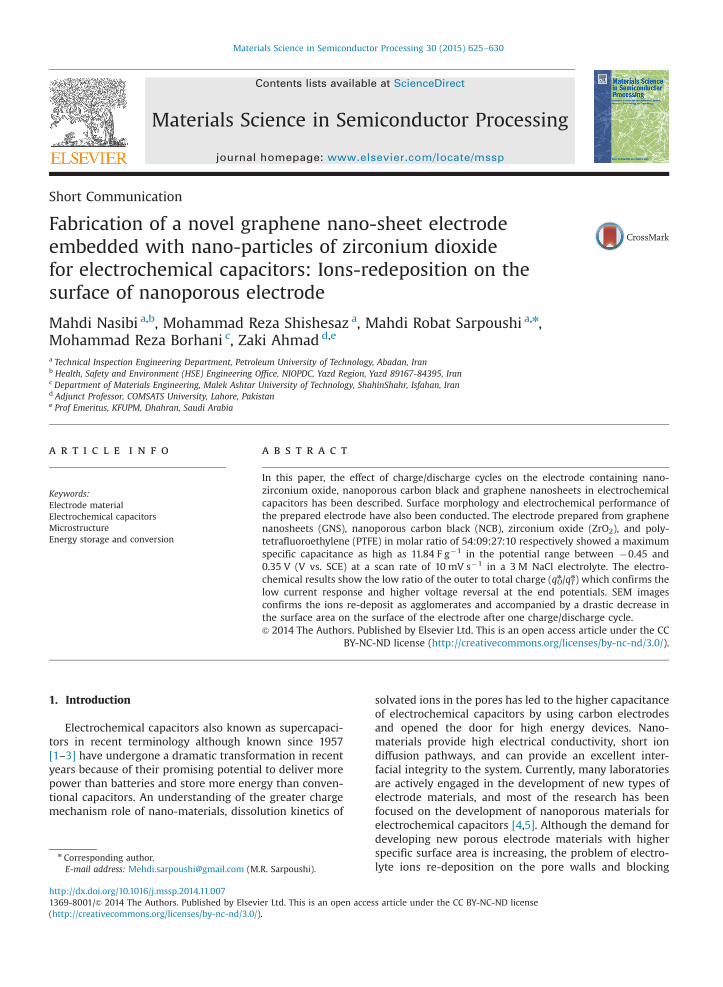
Fig. 1. SEM images obtained from 54:09:27:10 electrode befo
Degussa, Germany. Graphene nanosheets (GNS) (60 nmFlakes, multi-layered) with the specific surface area of15 m2/g and a purity of 98.5% were purchased fromGraphene Supermarket, USA. Polytetrafluoroethylene(PTFE) micro-sized powder (o2 μm) and high-purity(499%) nano-sized zirconium oxide (ZrO2) particles(o100 nm) were purchased from Aldrich, Germany. Allof the other chemicals used were purchased fromGermany (to purchase these materials, visit the websiteswww.graphenesupermarket.com, http://www.sigmaaldrich.com and www.merckgroup.com(. In order to preparethe electrode, a mixture containing 54 wt% of GNS, 9 wt%NCB, 27 wt% ZrO2 nanoparticles and 10 wt% PTFE wasmixed well in ethanol to form a paste and then waspressed (at 50 MPa pressure) onto the 316 L stainless steelsubstrate, which served as a current collector (having asurface area of 1.4 cm2). The typical mass of electrodematerial was 45 mg. The electrolyte used was 3 M NaCl.
2.2. Characterization
The electrochemical behavior of the prepared electrodewas characterized using cyclic voltammetry (CV) andelectrochemical impedance spectroscopy (EIS) tests. Theelectrochemical measurements were conducted using anAutolab (Netherlands) potentiostat Model PGSTAT 302N.CV tests were carried out within the range of �0.45 to
re (up) and after (down) charging/discharging cycles.
M. Nasibi et al. / Materials Science in Semiconductor Processing 30 (2015) 625–630 627
þ0.35 V (V vs. SCE), using scan rates of 10, 20, 50, 100 and200 mV s�1. EIS measurements were carried out in afrequency range of 0.010 Hz–100 kHz at OCP with an ACamplitude of 10 mV.
The specific capacitance can be estimated from thevoltammetric charge surrounded by the CV curve accord-ing to the following formula [7,8]:
C ¼ qaþjqcj2mΔV
ð1Þ
where, qa, qc are the sum of anodic and cathodic voltam-metric charges on positive and negative sweeps, respec-tively, m is the mass of active material (regardless of themass of PTFE) and ΔV is the potential window of CV. Themorphology and nature of the porous electrode werestudied using scanning electron microscopy (TESCAN,USA). Also the real (C0) and imaginary (C″) capacitancesof the electrode are calculated using the following equa-tion [9,10]:
C0 ¼ Z″ðωÞωjZðωÞj2 ð2Þ
C″¼ Z0ðωÞωjZðωÞj2 ð3Þ
where Z0(ω) and Z″ (ω) are the respective real andimaginary parts of the complex impedance Z (ω), ω isthe angular frequency and it is given by ω¼2πf.
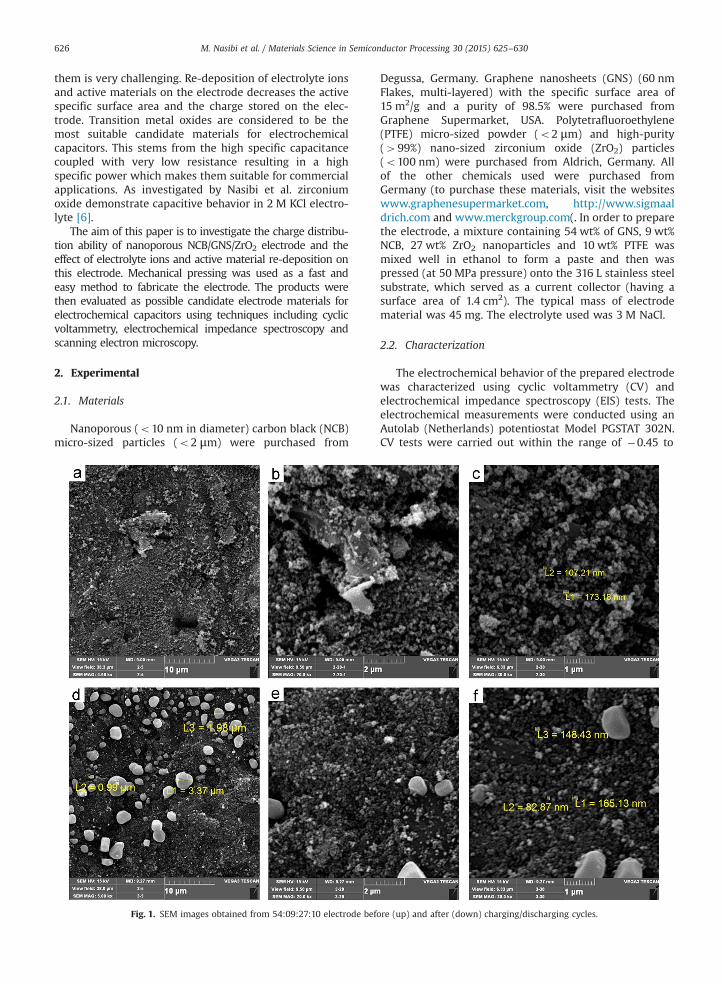
Fig. 2. (a) CV curve and (b) Nyquist diagram obtained
3. Results and discussion
Electrodes which contain carbon base materials andmetal oxides store the electrical charges through twomechanisms: (a) double layer formation on carbon basematerials and (b) Faradic redox reactions of transitionmetal oxides. Transition metal oxides are the best elec-trode materials for redox pseudocapacitors, whereas elec-trical double layer capacitors mainly focusing on carbonmaterials [11,12]. The principal redox reaction involved incharging and discharging processes of zirconium dioxideparticles in an aqueous electrolyte can be described by thefollowing equation:
ZrIVO2þλþ þe�2ZrIIIOOλ ð4Þ
where λ denotes Naþ or Hþ . Two mechanisms can beproposed for charge storage in the presence of ZrO2
particles. The first mechanism is based on the intercala-tion/extraction of protons or alkali cations into/from theoxide particles (reaction (5)), whereas the second mechan-ism probably involves the surface adsorption/desorption ofprotons or alkali cations (reaction (6))
ZrO2þMþþe�2ZrOOM (5)
(ZrO2)surfaceþMþþe�2(ZrOOM)surface (6)
from prepared electrode in 3 M NaCl electrolyte.
M. Nasibi et al. / Materials Science in Semiconductor Processing 30 (2015) 625–630628
where Mþ denotes as Naþ or Hþ . Re-deposition ofdissolved ions on the surface of the electrodes may blocka part of the active surface of carbon base materials anddecrease the charge storage ability of the prepared elec-trodes. The SEM images of the 54:09:27:10 (GNS/NCB/ZrO2/PTFE) electrode with different magnifications areshown in Fig. 1. The uniform distribution of NCB andZrO2 particles over the whole area of GNSs suggestsuniform distribution of properties such as conductivity,electroactivity, etc. Addition of ZrO2 nanoparticles and NCBparticles to graphene can increase the distance betweengraphene layers and it also makes the surface of theelectrodes porous. Addition of NCB particles into the
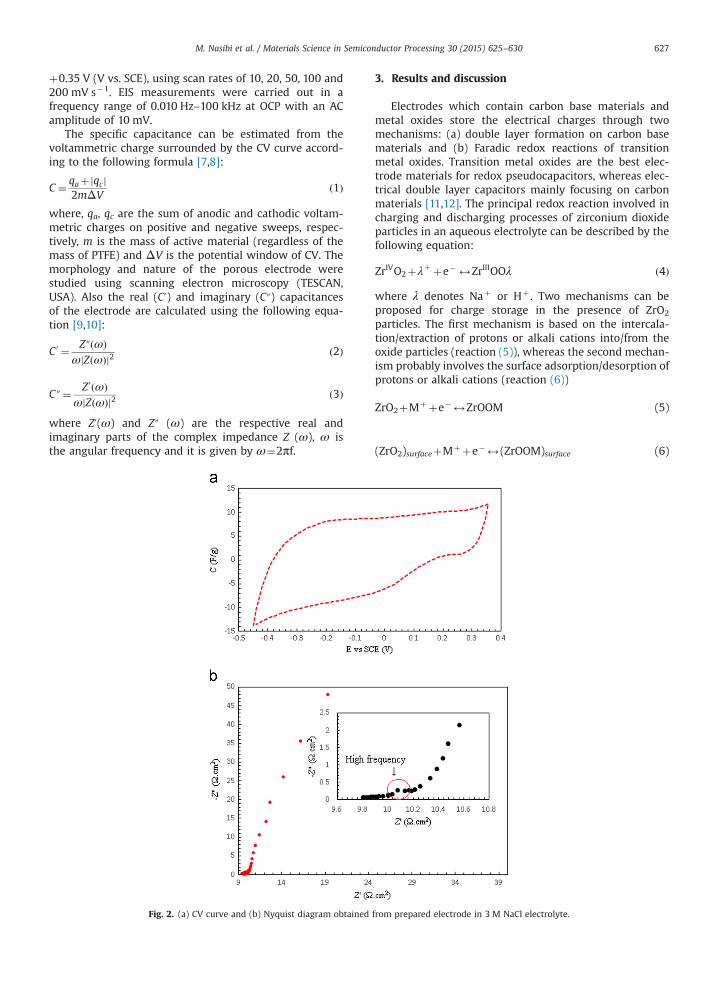
Fig. 3. Equivalent circuit of NCB/GNS/ZrO2 electrode in 3 M NaCl electro-lyte at OCP.
Table 1Electrochemical parameters obtained from electrochemical impedancespectroscopy measurement from GNS/NCB/ZrO2 electrode.
Parameters Rs (Ω) Cdl (F/g) Rct (Ω) CF (F/g) Rl (Ω)
Value 9.93 2.39 0.69 6.80 223.4Errors (%) 0.5037 31.46 13.18 1.06 8.062
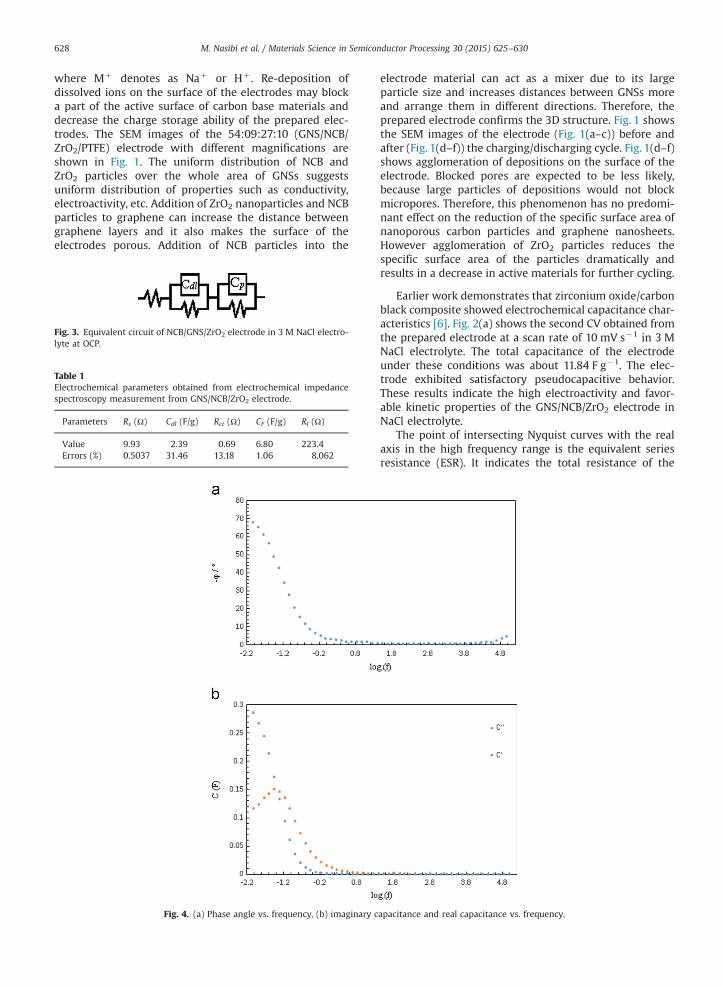
Fig. 4. (a) Phase angle vs. frequency, (b) imaginary c
electrode material can act as a mixer due to its largeparticle size and increases distances between GNSs moreand arrange them in different directions. Therefore, theprepared electrode confirms the 3D structure. Fig. 1 showsthe SEM images of the electrode (Fig. 1(a–c)) before andafter (Fig. 1(d–f)) the charging/discharging cycle. Fig. 1(d–f)shows agglomeration of depositions on the surface of theelectrode. Blocked pores are expected to be less likely,because large particles of depositions would not blockmicropores. Therefore, this phenomenon has no predomi-nant effect on the reduction of the specific surface area ofnanoporous carbon particles and graphene nanosheets.However agglomeration of ZrO2 particles reduces thespecific surface area of the particles dramatically andresults in a decrease in active materials for further cycling.
Earlier work demonstrates that zirconium oxide/carbonblack composite showed electrochemical capacitance char-acteristics [6]. Fig. 2(a) shows the second CV obtained fromthe prepared electrode at a scan rate of 10 mV s�1 in 3 MNaCl electrolyte. The total capacitance of the electrodeunder these conditions was about 11.84 F g�1. The elec-trode exhibited satisfactory pseudocapacitive behavior.These results indicate the high electroactivity and favor-able kinetic properties of the GNS/NCB/ZrO2 electrode inNaCl electrolyte.
The point of intersecting Nyquist curves with the realaxis in the high frequency range is the equivalent seriesresistance (ESR). It indicates the total resistance of the
apacitance and real capacitance vs. frequency.
M. Nasibi et al. / Materials Science in Semiconductor Processing 30 (2015) 625–630 629
electrode, the bulk electrolyte resistance and the resis-tance at the electrolyte/electrode interface. As shown inFig. 2(b), it could be obviously seen that the impedancespectra are almost similar in form, composed of onesemicircle at the high frequency end followed by a nearlyvertical line at the low frequency end. The radius of thesemicircle in the high frequency region reflects the impe-dance on the electrode/electrolyte interface [9]. Theequivalent circuit of the GNS/NCB/ZrO2 electrode is shownin Fig. 3. The equivalent circuit contains the bulk solutionresistance element (Rs), the double layer capacitance (Cdl)which is parallel with the charge transfer resistance (Rct),the Faradaic capacitance (CF) and leakage current (Rl).Table 1 shows numerical values for the equivalent circuit
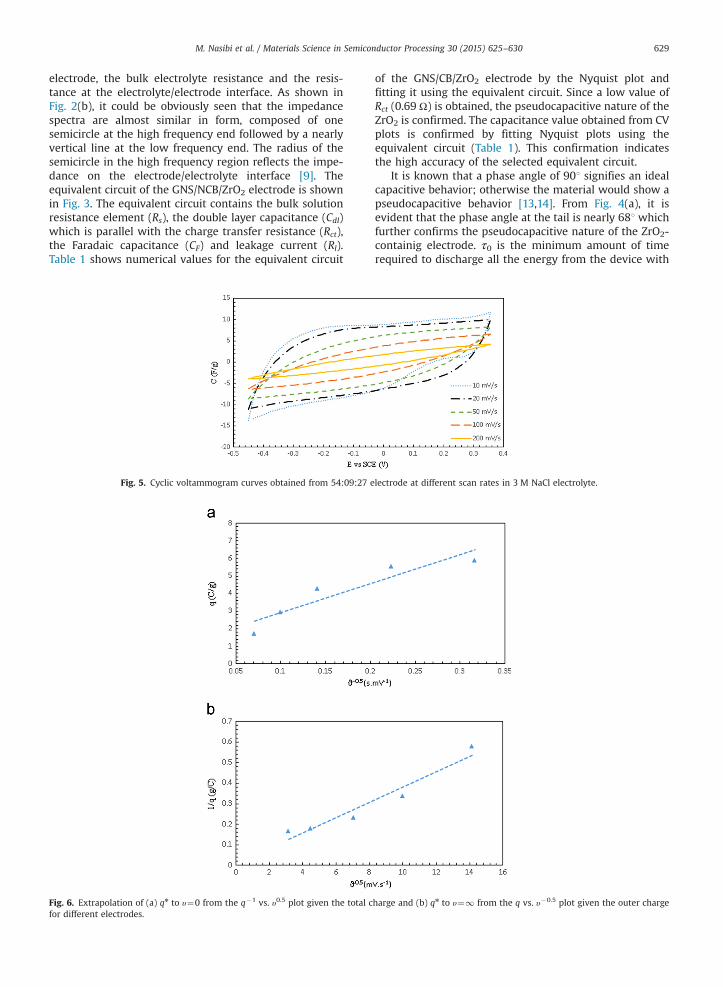
Fig. 5. Cyclic voltammogram curves obtained from 54:09:27 e
Fig. 6. Extrapolation of (a) qn to υ¼0 from the q�1 vs. υ0.5 plot given the total cfor different electrodes.
of the GNS/CB/ZrO2 electrode by the Nyquist plot andfitting it using the equivalent circuit. Since a low value ofRct (0.69 Ω) is obtained, the pseudocapacitive nature of theZrO2 is confirmed. The capacitance value obtained from CVplots is confirmed by fitting Nyquist plots using theequivalent circuit (Table 1). This confirmation indicatesthe high accuracy of the selected equivalent circuit.
It is known that a phase angle of 901 signifies an idealcapacitive behavior; otherwise the material would show apseudocapacitive behavior [13,14]. From Fig. 4(a), it isevident that the phase angle at the tail is nearly 681 whichfurther confirms the pseudocapacitive nature of the ZrO2-containig electrode. τ0 is the minimum amount of timerequired to discharge all the energy from the device with
lectrode at different scan rates in 3 M NaCl electrolyte.
harge and (b) qn to υ¼1 from the q vs. υ�0.5 plot given the outer charge
M. Nasibi et al. / Materials Science in Semiconductor Processing 30 (2015) 625–630630
an efficiency of more than 50% of its maximum value, andit can be derived from the frequency at maximum C″ [9]. τ0for the electrode in NaCl electrolyte is 26.88 s (Fig. 4(b)).The low ion diffusion in NaCl electrolyte was confirmed bythe corresponding large relaxation time constant (τ0).
The CV curves obtained at scan rates of 100 and200 mV s-1 deviated from the classical square waveform,expected for pure capacitance, due to a marked decrease inthe accessible surface area at such a high scan rates [15](Fig. 5). It was found that the redox current progressivelyincreased by increasing scan rate [16]. As shown in Fig. 5,at high scan rates, the shape of the CVs is ellipticwhich indicates that the capacitance was mainly due topseudocapacitance.
Total charge (qt) stored on the electrodes can be dividedinto two parts: outer charges (qO) and inner charges (qI).Outer charges are stored on the external surface of theelectrode but inner charges need to diffuse through thepores which open on the surface. Therefore, blocking poreswill decrease some of the charge storage ability of theelectrodes. In order to obtain quantitative informationabout the charge distribution on the proposed electrodesduring charging, voltammograms were analyzed as afunction of scan rate (Fig. 6), according to the procedurereported by Ardizzone et al. [13]. Extrapolation of q toυ¼1 (υ�1/2¼0) from the q vs. υ�1/2 plot (Fig. 6(a)) givesthe outer charge, qO, of 1.29 for 54:09:27:10 electrode,which corresponds to charges on the most accessibleactive surface of the electrode. Besides, extrapolation of qto υ¼0 from 1/q vs. υ1/2 plot (Fig. 6(b)) gives the totalcharge, qT, of 90.90 C g�1 cm�2, which corresponds tocharges related to the entire active surface of the electrode.This confirms that about 98% of charges are stored oninner pore walls of the electrode.
4. Conclusion
SEM images confirmed the redox reactions involved incharging and discharging processes of zirconium dioxideparticles in an aqueous electrolyte caused agglomeration
of ZrO2 particles, which caused a dramatic decrease in thespecific surface area of the particles and a consequentdecrease in the amount active materials available forfurther cycling. The proposed electrode from a combina-tion of GNS, NCB, ZrO2, and PTFE showed a maximumcapacitance of as high as 11.84 F g�1 at 10 mV s�1 in 3 MNaCl electrolyte. The electrode also showed a low ratio ofthe outer charge to total charge (qO/qT) of 0.014 whichconfirms the low current response on voltage reversal andless accessibility to the electrolyte for internal surfaceadsorption. As expected, data obtained from electrodematerial confirmed both double layer capacitance andpseudocapacitance. The investigations presented aboveshow an easy method to fabricate electrodes for electro-chemical capacitors with embedded nano-materials.
References
[1] I. Hadjipaschalis, A. Poullikkas, V. Efthimiou, Renew. Sustain. EnergyRev. 13 (2009) 1513–1522.
[2] P. Sharma, T.S. Bhatti, Energy Convers. Manag. 51 (2010) 2901–2912.[3] R. Kotz, M. Carlen, Electrochim. Acta 45 (2000) 2483–2498.[4] Y. Zhang, H. Feng, X. Wu, L. Wang, A. Zhang, T. Xia, et al., Int. J.
Hydrog. Energy 34 (2009) 4889–4899.[5] Conway B.E., Electrochemical Supercapacitors: Scientific Fundamen-
tals and Technological Applications, New York, Kluwer Academic/Plenum, 1999, 105–124.
[6] Mahdi Nasibi, Mohammad Ali Golozar, Gholamreza Rashed, J. PowerSources 206 (2012) 108–110.
[7] C.C. Hu, C.C. Wang, Electrochem. Commun. 4 (2002) 554.[8] X.Y. Wang, X.Y. Wang, W.G. Huang, P.J. Sebastian, S. Gamboa, J. Power
Sources 140 (2005) 211.[9] J.M. Soon, K.P. Loh, Electrochem. Solid-State Lett. 10 (2007) A250.
[10] V. Ganesh, S. Pitchumani, V. Lakshminarayanan, J. Power Sources158 (2006) 1523.
[11] Elzbieta Frackowiaka, François Béguin, Carbon 39 (2001) 937–950.[12] Hongtao Liu, Ping He, Zhiying Li, Yang Liu, Jinghong Li, Electrochim.
Acta 51 (2006) 1925–1931.[13] L. Yuan, X.H. Lu, X. Xiao, T. Zhai, J. Dai, F. Zhang, et al., ACS Nano 6
(2012) 656–661.[14] K. Krishnamoorthy, G. Veerasubramani, S. Radhakrishnan, S.J. Kim,
Mater. Res. Bull. 50 (2014) 499–502.[15] B.E. Conway, W.G. Pell, J. Power Sources 105 (2002) 169–181.[16] Ming-Tsung Lee, Yun-Shan Li, I.-Wen Sun, Jeng-Kuei Chang, J. Power
Sources 246 (2014) 269–276.


