Embed Size (px)
DESCRIPTION
52613006409-main
Citation preview
lable at ScienceDirect
Journal of Cleaner Production 65 (2014) 389e396
Contents lists avai
Journal of Cleaner Production
journal homepage: www.elsevier .com/locate/ jc lepro
Durability performance of concrete incorporating coarse aggregatesfrom marble industry waste
António André, Jorge de Brito*, Alexandra Rosa, Diogo PedroDepartment of Civil Engineering, Architecture, and Geo-resources, Instituto Superior Técnico, Technical University of Lisbon, Av. Rovisco Pais, 1049-001Lisbon, Portugal
a r t i c l e i n f o
Article history:Received 18 March 2013Received in revised form21 August 2013Accepted 21 September 2013Available online 1 October 2013
Keywords:Coarse marble aggregatesRecycled aggregate concreteDurabilityQuarrying industry waste
Abbreviations: PA, Primary aggregates; CMA, CoReference concrete; BRC, Basalt reference concrete;crete; LRC, Limestone reference concrete; MRC, MarBasalt coarse aggregates; GCA, Granite coarse aggregaggregates.* Corresponding author. Tel.: þ351 218443659; fax
E-mail addresses: [email protected], [email protected]
0959-6526/$ e see front matter � 2013 Elsevier Ltd.http://dx.doi.org/10.1016/j.jclepro.2013.09.037
a b s t r a c t
The quarrying of marble, a well-known ornamental stone, has a substantial positive impact on Portugal’seconomy, but it also generates large environmental impacts. The amount of waste produced duringquarrying can be as much as 80% of all stone/soil extracted. That waste is then dumped near the quarry,where it accumulates indiscriminately because a viable alternative for its disposal has not yet beenfound. In this context, solutions must be found that can transform this waste into a by-product andrestore some of its economic value.
The main goal of this study was to evaluate the influence of the replacement of primary aggregates(PA) with marble aggregates. No additions or admixtures were used, as those could change the fresh orhardened properties of the resulting concrete and disguise the influence of the replacement under study.This evaluation required the production of three concrete families. The conventional primary aggregates(PA; basalt, granite and limestone) were replaced in the three families by coarse marble aggregates(CMA) at ratios of 20%, 50% and 100% of the total volume of aggregates. These mixes were tested in theconcrete’s fresh state for workability and density and in its hardened state for compressive strength,water absorption by capillarity and immersion, carbonation and chloride penetration. The results indi-cate that there are no significant differences between a concrete produced using CMA and one made withPA in terms of durability, making the use of this waste as concrete aggregate perfectly feasible.
The mechanical properties of the concrete made with CMA were assessed in the scope of concurrentwork also performed at the Instituto Superior Técnico (Lisbon, Portugal).
� 2013 Elsevier Ltd. All rights reserved.
1. Introduction
The stone industry is of major importance to the Portugueseeconomy and to that of the world. However, by its very nature, thisindustry frequently has significant environmental impacts. Ad-vances in the exploitation of quarries have led to the extraction ofblocks containing more impurities and of worse quality, whichlowers the productivity of ornamental stone. The waste producedduring the extraction process can amount to as much as 80% of thetotal volume of stone extracted (Hebhoub et al., 2011). Bulkierwaste is disposed of at sites located far from the excavation front,
arse marble aggregates; RC,GRC, Granite reference con-ble reference concrete; BCA,ates; LCA, Limestone coarse
: þ351 218443071..utl.pt (J. de Brito).
All rights reserved.
contributing to the degradation of the environment and the naturallandscape by occupying the land indiscriminately.
The construction industry can use marble waste for purposesother than as ornamental stone. Marble dust (also called sludge, anagglomeration of water and very fine particles produced by cuttingthe stone) is the most widely studied alternative, primarily becauseit is quite versatile. According to Saboya et al. (2007), marble dustcan enhance the properties of ceramic bricks. Aruntas et al. (2010)studied the effects of addingmarble dust to cement, whereas Ergün(2011) evaluated the effect of replacing cement with diatomite andmarble dust on the mechanical properties of concrete. Marble dustcan also be used as filler for road construction and asphalt mixes(Karasahin and Terz1, 2005). Binici et al. (2007) showed that usingup to 15% marble dust as an additive may result in more durableconcrete. It is also possible to improve all of the properties of a self-consolidating concrete by adding 200 kg/m3 of marble dust, asshown by Topçu et al. (2009). Finally, Corinaldesi et al. (2010) re-ported that when 10% of sand is replaced with marble dust and
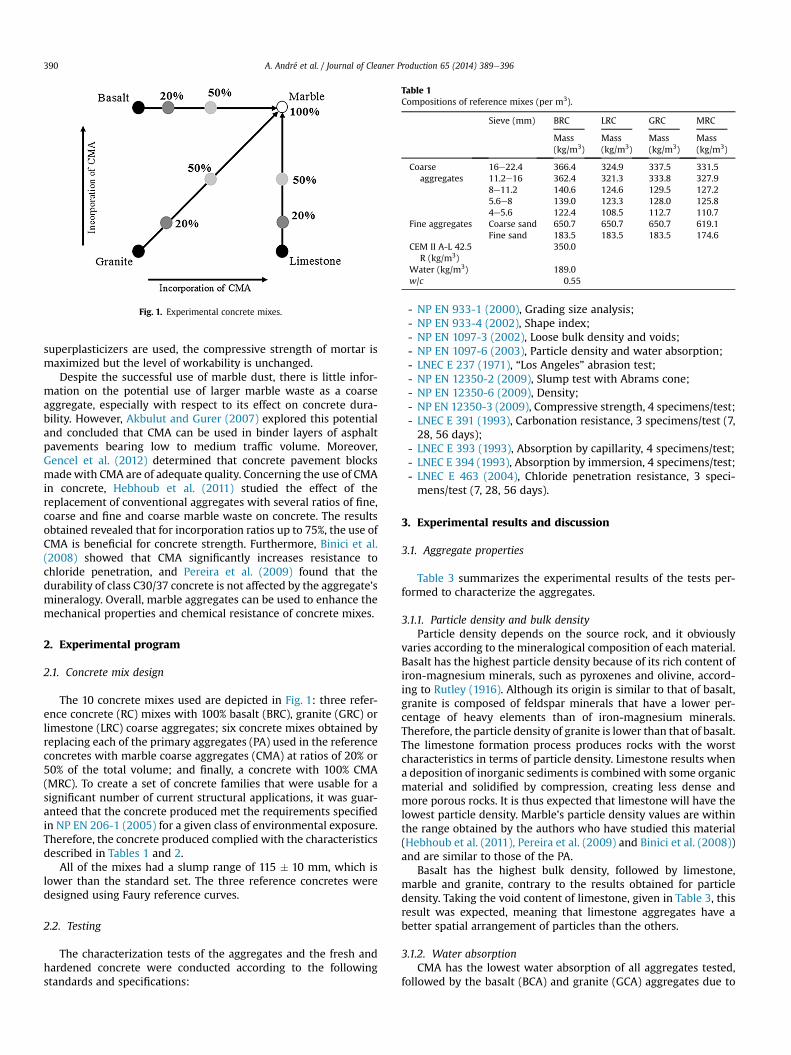
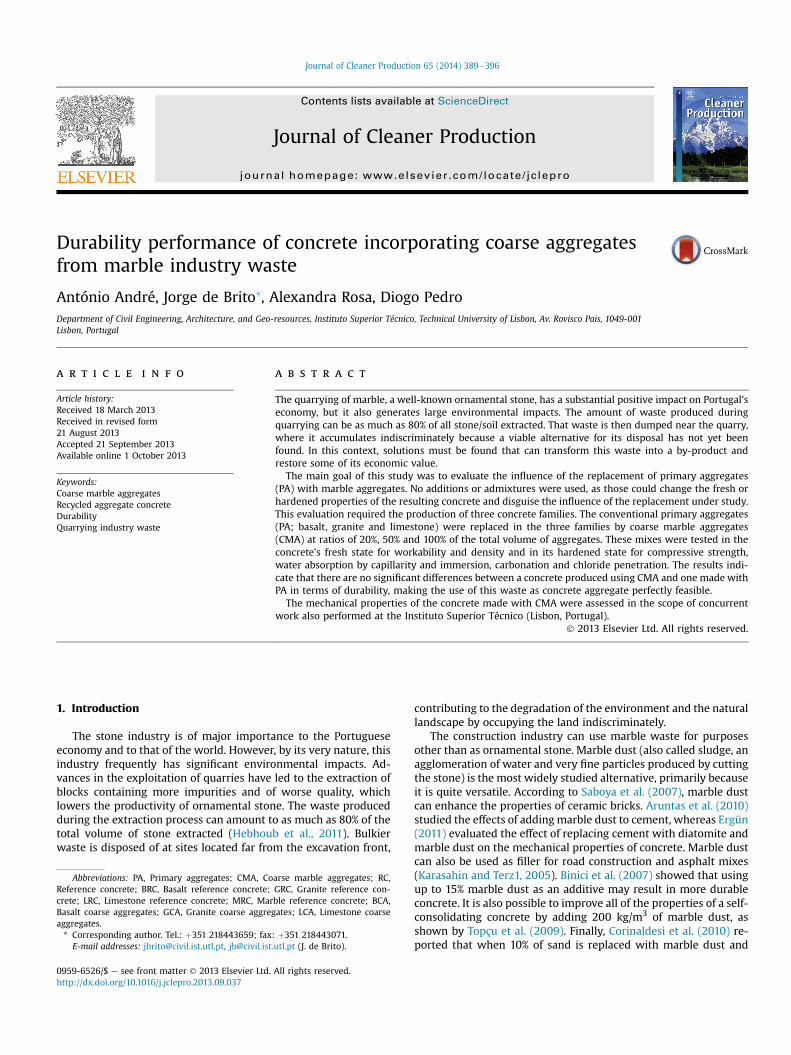
Fig. 1. Experimental concrete mixes.
Table 1Compositions of reference mixes (per m3).
Sieve (mm) BRC LRC GRC MRC
Mass(kg/m3)
Mass(kg/m3)
Mass(kg/m3)
Mass(kg/m3)
Coarseaggregates
16e22.4 366.4 324.9 337.5 331.511.2e16 362.4 321.3 333.8 327.98e11.2 140.6 124.6 129.5 127.25.6e8 139.0 123.3 128.0 125.84e5.6 122.4 108.5 112.7 110.7
Fine aggregates Coarse sand 650.7 650.7 650.7 619.1Fine sand 183.5 183.5 183.5 174.6
CEM II A-L 42.5R (kg/m3)
350.0
Water (kg/m3) 189.0w/c 0.55
A. André et al. / Journal of Cleaner Production 65 (2014) 389e396390
superplasticizers are used, the compressive strength of mortar ismaximized but the level of workability is unchanged.
Despite the successful use of marble dust, there is little infor-mation on the potential use of larger marble waste as a coarseaggregate, especially with respect to its effect on concrete dura-bility. However, Akbulut and Gurer (2007) explored this potentialand concluded that CMA can be used in binder layers of asphaltpavements bearing low to medium traffic volume. Moreover,Gencel et al. (2012) determined that concrete pavement blocksmadewith CMA are of adequate quality. Concerning the use of CMAin concrete, Hebhoub et al. (2011) studied the effect of thereplacement of conventional aggregates with several ratios of fine,coarse and fine and coarse marble waste on concrete. The resultsobtained revealed that for incorporation ratios up to 75%, the use ofCMA is beneficial for concrete strength. Furthermore, Binici et al.(2008) showed that CMA significantly increases resistance tochloride penetration, and Pereira et al. (2009) found that thedurability of class C30/37 concrete is not affected by the aggregate’smineralogy. Overall, marble aggregates can be used to enhance themechanical properties and chemical resistance of concrete mixes.
2. Experimental program
2.1. Concrete mix design
The 10 concrete mixes used are depicted in Fig. 1: three refer-ence concrete (RC) mixes with 100% basalt (BRC), granite (GRC) orlimestone (LRC) coarse aggregates; six concrete mixes obtained byreplacing each of the primary aggregates (PA) used in the referenceconcretes with marble coarse aggregates (CMA) at ratios of 20% or50% of the total volume; and finally, a concrete with 100% CMA(MRC). To create a set of concrete families that were usable for asignificant number of current structural applications, it was guar-anteed that the concrete produced met the requirements specifiedin NP EN 206-1 (2005) for a given class of environmental exposure.Therefore, the concrete produced complied with the characteristicsdescribed in Tables 1 and 2.
All of the mixes had a slump range of 115 � 10 mm, which islower than the standard set. The three reference concretes weredesigned using Faury reference curves.
2.2. Testing
The characterization tests of the aggregates and the fresh andhardened concrete were conducted according to the followingstandards and specifications:
- NP EN 933-1 (2000), Grading size analysis;- NP EN 933-4 (2002), Shape index;- NP EN 1097-3 (2002), Loose bulk density and voids;- NP EN 1097-6 (2003), Particle density and water absorption;- LNEC E 237 (1971), “Los Angeles” abrasion test;- NP EN 12350-2 (2009), Slump test with Abrams cone;- NP EN 12350-6 (2009), Density;- NP EN 12350-3 (2009), Compressive strength, 4 specimens/test;- LNEC E 391 (1993), Carbonation resistance, 3 specimens/test (7,28, 56 days);
- LNEC E 393 (1993), Absorption by capillarity, 4 specimens/test;- LNEC E 394 (1993), Absorption by immersion, 4 specimens/test;- LNEC E 463 (2004), Chloride penetration resistance, 3 speci-mens/test (7, 28, 56 days).
3. Experimental results and discussion
3.1. Aggregate properties
Table 3 summarizes the experimental results of the tests per-formed to characterize the aggregates.
3.1.1. Particle density and bulk densityParticle density depends on the source rock, and it obviously
varies according to the mineralogical composition of each material.Basalt has the highest particle density because of its rich content ofiron-magnesium minerals, such as pyroxenes and olivine, accord-ing to Rutley (1916). Although its origin is similar to that of basalt,granite is composed of feldspar minerals that have a lower per-centage of heavy elements than of iron-magnesium minerals.Therefore, the particle density of granite is lower than that of basalt.The limestone formation process produces rocks with the worstcharacteristics in terms of particle density. Limestone results whena deposition of inorganic sediments is combined with some organicmaterial and solidified by compression, creating less dense andmore porous rocks. It is thus expected that limestone will have thelowest particle density. Marble’s particle density values are withinthe range obtained by the authors who have studied this material(Hebhoub et al. (2011), Pereira et al. (2009) and Binici et al. (2008))and are similar to those of the PA.
Basalt has the highest bulk density, followed by limestone,marble and granite, contrary to the results obtained for particledensity. Taking the void content of limestone, given in Table 3, thisresult was expected, meaning that limestone aggregates have abetter spatial arrangement of particles than the others.
3.1.2. Water absorptionCMA has the lowest water absorption of all aggregates tested,
followed by the basalt (BCA) and granite (GCA) aggregates due to
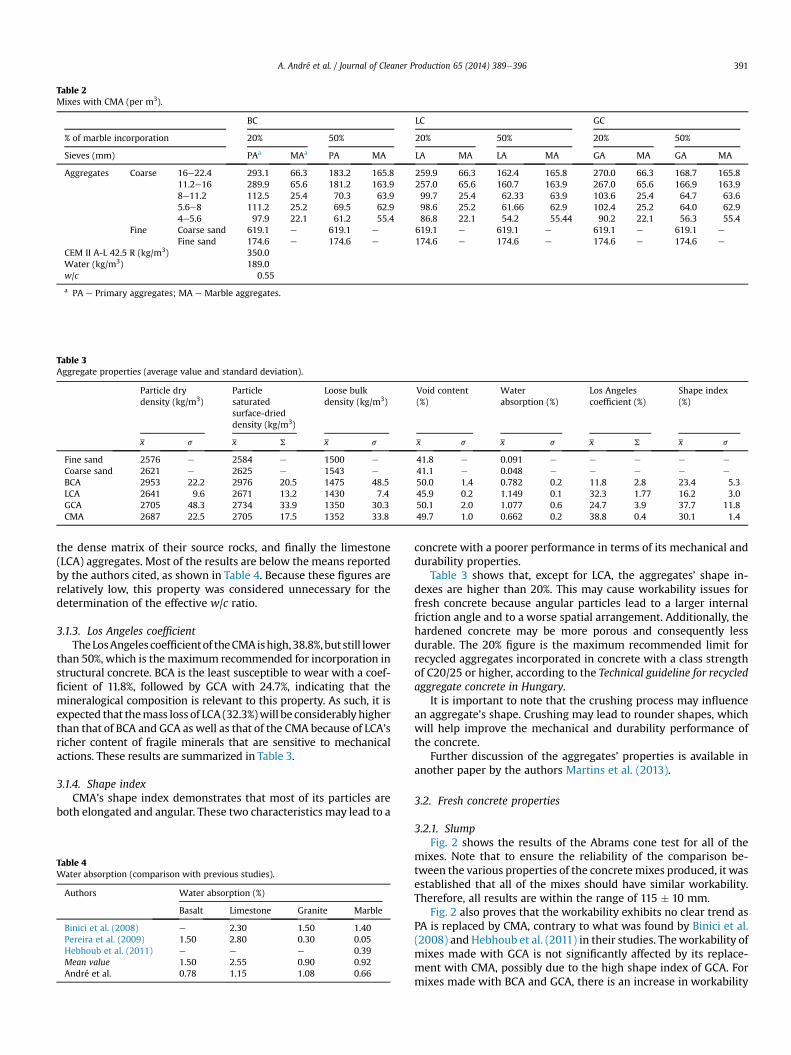
Table 2Mixes with CMA (per m3).
BC LC GC
% of marble incorporation 20% 50% 20% 50% 20% 50%
Sieves (mm) PAa MAa PA MA LA MA LA MA GA MA GA MA
Aggregates Coarse 16e22.4 293.1 66.3 183.2 165.8 259.9 66.3 162.4 165.8 270.0 66.3 168.7 165.811.2e16 289.9 65.6 181.2 163.9 257.0 65.6 160.7 163.9 267.0 65.6 166.9 163.98e11.2 112.5 25.4 70.3 63.9 99.7 25.4 62.33 63.9 103.6 25.4 64.7 63.65.6e8 111.2 25.2 69.5 62.9 98.6 25.2 61.66 62.9 102.4 25.2 64.0 62.94e5.6 97.9 22.1 61.2 55.4 86.8 22.1 54.2 55.44 90.2 22.1 56.3 55.4
Fine Coarse sand 619.1 e 619.1 e 619.1 e 619.1 e 619.1 e 619.1 e
Fine sand 174.6 e 174.6 e 174.6 e 174.6 e 174.6 e 174.6 e
CEM II A-L 42.5 R (kg/m3) 350.0Water (kg/m3) 189.0w/c 0.55
a PA e Primary aggregates; MA e Marble aggregates.
Table 3Aggregate properties (average value and standard deviation).
Particle drydensity (kg/m3)
Particlesaturatedsurface-drieddensity (kg/m3)
Loose bulkdensity (kg/m3)
Void content(%)
Waterabsorption (%)
Los Angelescoefficient (%)
Shape index(%)
x s x S x s x s x s x S x s
Fine sand 2576 e 2584 e 1500 e 41.8 e 0.091 e e e e e
Coarse sand 2621 e 2625 e 1543 e 41.1 e 0.048 e e e e e
BCA 2953 22.2 2976 20.5 1475 48.5 50.0 1.4 0.782 0.2 11.8 2.8 23.4 5.3LCA 2641 9.6 2671 13.2 1430 7.4 45.9 0.2 1.149 0.1 32.3 1.77 16.2 3.0GCA 2705 48.3 2734 33.9 1350 30.3 50.1 2.0 1.077 0.6 24.7 3.9 37.7 11.8CMA 2687 22.5 2705 17.5 1352 33.8 49.7 1.0 0.662 0.2 38.8 0.4 30.1 1.4
A. André et al. / Journal of Cleaner Production 65 (2014) 389e396 391
the dense matrix of their source rocks, and finally the limestone(LCA) aggregates. Most of the results are below the means reportedby the authors cited, as shown in Table 4. Because these figures arerelatively low, this property was considered unnecessary for thedetermination of the effective w/c ratio.
3.1.3. Los Angeles coefficientTheLosAngeles coefficientof theCMAishigh,38.8%,but still lower
than 50%, which is the maximum recommended for incorporation instructural concrete. BCA is the least susceptible to wear with a coef-ficient of 11.8%, followed by GCA with 24.7%, indicating that themineralogical composition is relevant to this property. As such, it isexpected that themass loss of LCA (32.3%)will be considerably higherthan that of BCA and GCA aswell as that of the CMA because of LCA’sricher content of fragile minerals that are sensitive to mechanicalactions. These results are summarized in Table 3.
3.1.4. Shape indexCMA’s shape index demonstrates that most of its particles are
both elongated and angular. These two characteristics may lead to a
Table 4Water absorption (comparison with previous studies).
Authors Water absorption (%)
Basalt Limestone Granite Marble
Binici et al. (2008) e 2.30 1.50 1.40Pereira et al. (2009) 1.50 2.80 0.30 0.05Hebhoub et al. (2011) e e e 0.39Mean value 1.50 2.55 0.90 0.92André et al. 0.78 1.15 1.08 0.66
concrete with a poorer performance in terms of its mechanical anddurability properties.
Table 3 shows that, except for LCA, the aggregates’ shape in-dexes are higher than 20%. This may cause workability issues forfresh concrete because angular particles lead to a larger internalfriction angle and to a worse spatial arrangement. Additionally, thehardened concrete may be more porous and consequently lessdurable. The 20% figure is the maximum recommended limit forrecycled aggregates incorporated in concrete with a class strengthof C20/25 or higher, according to the Technical guideline for recycledaggregate concrete in Hungary.
It is important to note that the crushing process may influencean aggregate’s shape. Crushing may lead to rounder shapes, whichwill help improve the mechanical and durability performance ofthe concrete.
Further discussion of the aggregates’ properties is available inanother paper by the authors Martins et al. (2013).
3.2. Fresh concrete properties
3.2.1. SlumpFig. 2 shows the results of the Abrams cone test for all of the
mixes. Note that to ensure the reliability of the comparison be-tween the various properties of the concretemixes produced, it wasestablished that all of the mixes should have similar workability.Therefore, all results are within the range of 115 � 10 mm.
Fig. 2 also proves that the workability exhibits no clear trend asPA is replaced by CMA, contrary to what was found by Binici et al.(2008) and Hebhoub et al. (2011) in their studies. Theworkability ofmixes made with GCA is not significantly affected by its replace-ment with CMA, possibly due to the high shape index of GCA. Formixes made with BCA and GCA, there is an increase in workability
105
110
115
120
125
130
0 (RC) 20 50 100
Slum
p (m
m)
Incorporation ratio of CMA (%)
BCA
LCA
GCA
Fig. 2. Slump.
2360
2380
2400
2420
2440
2460
2480
2500
0 (RC) 20 50 100
Fre
sh c
oncr
ete
dens
ity
(kg/
m3 )
Incorporation ratio of CMA (%)
BCA
LCA
GCA
Fig. 3. Fresh concrete density.
-14.0
-12.0
-10.0
-8.0
-6.0
-4.0
-2.0
0.0
2.0
4.0
0 (RC) 20 50 100
f cm
, 28d
ays/f
cmR
C, 2
8day
s(%
)
Incorporation ratio of CMA (%)
BCA
LCA
GCA
Fig. 4. Compressive strength relative to that of the reference concrete mixes.
Table 6Water absorption by immersion (average, standard deviation and difference fromthe reference mix).
x (%) s (%) D (%) x (%) s (%) D (%) x (%) s (%) D (%)
BRC 13.6 0.3 0 LRC 14.1 0.3 0 GRC 13.8 0.44 0BC20 14.4 5.8 5.8 LC20 13.8 0.5 �2.3 GC20 13.6 0.2 �1.6BC50 14.4 5.8 5.8 LC50 13.3 0.3 �5.4 GC50 14.0 0.2 1.9MRC 14.0 3.0 3.0 MRC 14.0 0.4 �0.8 MRC 14.0 0.4 1.5
A. André et al. / Journal of Cleaner Production 65 (2014) 389e396392
for the 20% incorporation ratio, most likely because of the CMA’splain surface and low absorption. However, the results show a lossof workability for the 50% replacement ratio, most likely becausethe shape index has more influence than the flow increaseobserved for the 20% replacement ratio.
3.2.2. DensityFig. 3 presents the density results for the mixes. The results
show that the density of the concrete made with BCA decreaseswith higher incorporation ratios of CMA, but it is still higher thanthose of the LCA and GCA mixes. This result was expected becausethe aggregates have similar densities, the concretes were producedwith the same workability, and no extra water was needed. Theslight increase observed in the 20% replacement ratio mix in theGCA and LCA families may be due to an improved spatialarrangement of the particles provided by the compacted mixes, asobserved in the slump test results.
3.3. Hardened concrete properties
3.3.1. Compressive strengthAlthough concrete durability cannot be directly characterized
by compressive strength, that parameter is still frequently used to
Table 5Compressive strength at 28 days (average, standard deviation and difference from the re
fcm, 28 (MPa) s (MPa) D (%) fcm, 28 (MPa)
BRC 45.9 0.62 0 LRC 43.4BC20 44.0 0.91 �4.1 LC20 43.2BC50 44.1 0.57 �3.9 LC50 44.2MRC 41.8 1.28 �8.9 MRC 41.8
assess concrete’s quality and thus indirectly reveals its durability.As such, the results obtained by Martins et al. (2013) in theirconcurrent research work were analyzed, and the meancompressive strength at 28 days is presented in Table 5. AlthoughFig. 4 indicates a general downward trend of the mean compres-sive strength at 28 days with increasing incorporation ratio, thisdecrease may be considered almost insignificant with variationsup to 10.3% (for the granite concrete mix). Hebhoub et al. (2011)obtained identical results for the difference between the refer-ence concrete and the one produced with 100% marble aggregates.However, the concrete strength improved for the 25%, 50% and70% incorporation ratios. Binici et al. (2008) concluded that theuse of marble and granite improves the flexural and splittingtensile strengths of concrete.
3.3.2. Water absorption by immersionThe results from the water absorption by immersion test are
presented in Table 6. This property characterizes the open porosityof the cement matrix at 28 days. Open porosity is due to eitherexcess water in the mix that is neither consumed in the cementhydration reactions nor absorbed by the aggregates or to air that isstill trapped after the vibration process.
From Fig. 5, it can be concluded that although there is an upwardlinear trend (R2 ¼ 0.93), the introduction of CMA does not signifi-cantly influence water absorption. All mixes exhibited very similarabsorption values with variations of between �5.4% and 5.8%. Thiscan be explained both by the weak absorption of the aggregates inthe mix and by the (expected) similarity of the concretes’ micro-structure. These results are in agreement with those obtained byPereira et al. (2009).
ference mix).
s (MPa) D (%) fcm, 28 (MPa) s (MPa) D (%)
1.89 0 GRC 46.6 0.34 01.48 �4.1 GC20 43.7 1.24 �4.11.10 �3.9 GC50 41.3 3.81 �3.91.28 �8.9 MRC 41.8 1.28 �8.9
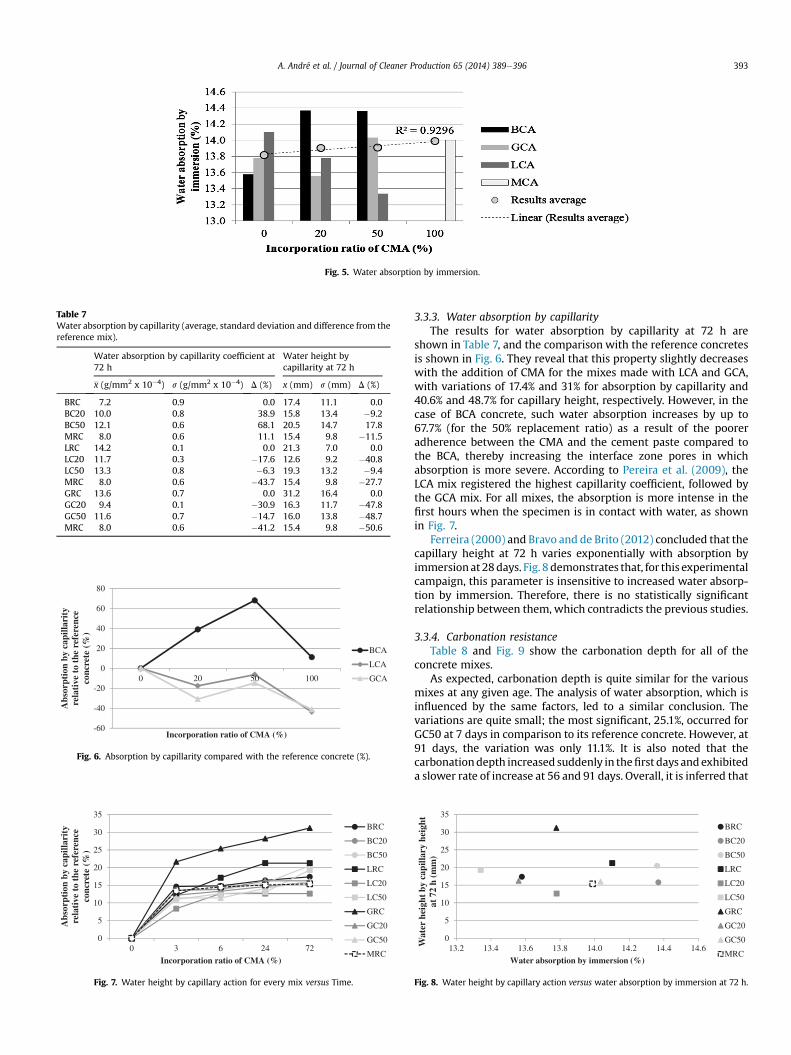
Fig. 5. Water absorption by immersion.
Table 7Water absorption by capillarity (average, standard deviation and difference from thereference mix).
Water absorption by capillarity coefficient at72 h
Water height bycapillarity at 72 h
x (g/mm2 x 10�4) s (g/mm2 x 10�4) D (%) x (mm) s (mm) D (%)
BRC 7.2 0.9 0.0 17.4 11.1 0.0BC20 10.0 0.8 38.9 15.8 13.4 �9.2BC50 12.1 0.6 68.1 20.5 14.7 17.8MRC 8.0 0.6 11.1 15.4 9.8 �11.5LRC 14.2 0.1 0.0 21.3 7.0 0.0LC20 11.7 0.3 �17.6 12.6 9.2 �40.8LC50 13.3 0.8 �6.3 19.3 13.2 �9.4MRC 8.0 0.6 �43.7 15.4 9.8 �27.7GRC 13.6 0.7 0.0 31.2 16.4 0.0GC20 9.4 0.1 �30.9 16.3 11.7 �47.8GC50 11.6 0.7 �14.7 16.0 13.8 �48.7MRC 8.0 0.6 �41.2 15.4 9.8 �50.6
-60
-40
-20
0
20
40
60
80
0 20 50 100
Abs
orpt
ion
by c
apill
arit
y re
lati
ve t
o th
e re
fere
nce
conc
rete
(%
)
Incorporation ratio of CMA (%)
BCA
LCA
GCA
Fig. 6. Absorption by capillarity compared with the reference concrete (%).
0
5
10
15
20
25
30
35
0 3 6 24 72
Abs
orpt
ion
by c
apill
arit
y re
lati
ve t
o th
e re
fere
nce
conc
rete
(%
)
Incorporation ratio of CMA (%)
BRC
BC20
BC50
LRC
LC20
LC50
GRC
GC20
GC50
MRC
Fig. 7. Water height by capillary action for every mix versus Time.
A. André et al. / Journal of Cleaner Production 65 (2014) 389e396 393
3.3.3. Water absorption by capillarityThe results for water absorption by capillarity at 72 h are
shown in Table 7, and the comparison with the reference concretesis shown in Fig. 6. They reveal that this property slightly decreaseswith the addition of CMA for the mixes made with LCA and GCA,with variations of 17.4% and 31% for absorption by capillarity and40.6% and 48.7% for capillary height, respectively. However, in thecase of BCA concrete, such water absorption increases by up to67.7% (for the 50% replacement ratio) as a result of the pooreradherence between the CMA and the cement paste compared tothe BCA, thereby increasing the interface zone pores in whichabsorption is more severe. According to Pereira et al. (2009), theLCA mix registered the highest capillarity coefficient, followed bythe GCA mix. For all mixes, the absorption is more intense in thefirst hours when the specimen is in contact with water, as shownin Fig. 7.
Ferreira (2000) and Bravo and de Brito (2012) concluded that thecapillary height at 72 h varies exponentially with absorption byimmersionat 28days. Fig. 8 demonstrates that, for this experimentalcampaign, this parameter is insensitive to increased water absorp-tion by immersion. Therefore, there is no statistically significantrelationship between them, which contradicts the previous studies.
3.3.4. Carbonation resistanceTable 8 and Fig. 9 show the carbonation depth for all of the
concrete mixes.As expected, carbonation depth is quite similar for the various
mixes at any given age. The analysis of water absorption, which isinfluenced by the same factors, led to a similar conclusion. Thevariations are quite small; the most significant, 25.1%, occurred forGC50 at 7 days in comparison to its reference concrete. However, at91 days, the variation was only 11.1%. It is also noted that thecarbonationdepth increased suddenly in thefirst days andexhibiteda slower rate of increase at 56 and 91 days. Overall, it is inferred that
0
5
10
15
20
25
30
35
13.2 13.4 13.6 13.8 14.0 14.2 14.4 14.6Wat
er h
eigh
t by
capi
llary
hei
ght
at 7
2 h
(mm
)
Water absorption by immersion (%)
BRC
BC20
BC50
LRC
LC20
LC50
GRC
GC20
GC50
MRC
Fig. 8. Water height by capillary action versus water absorption by immersion at 72 h.
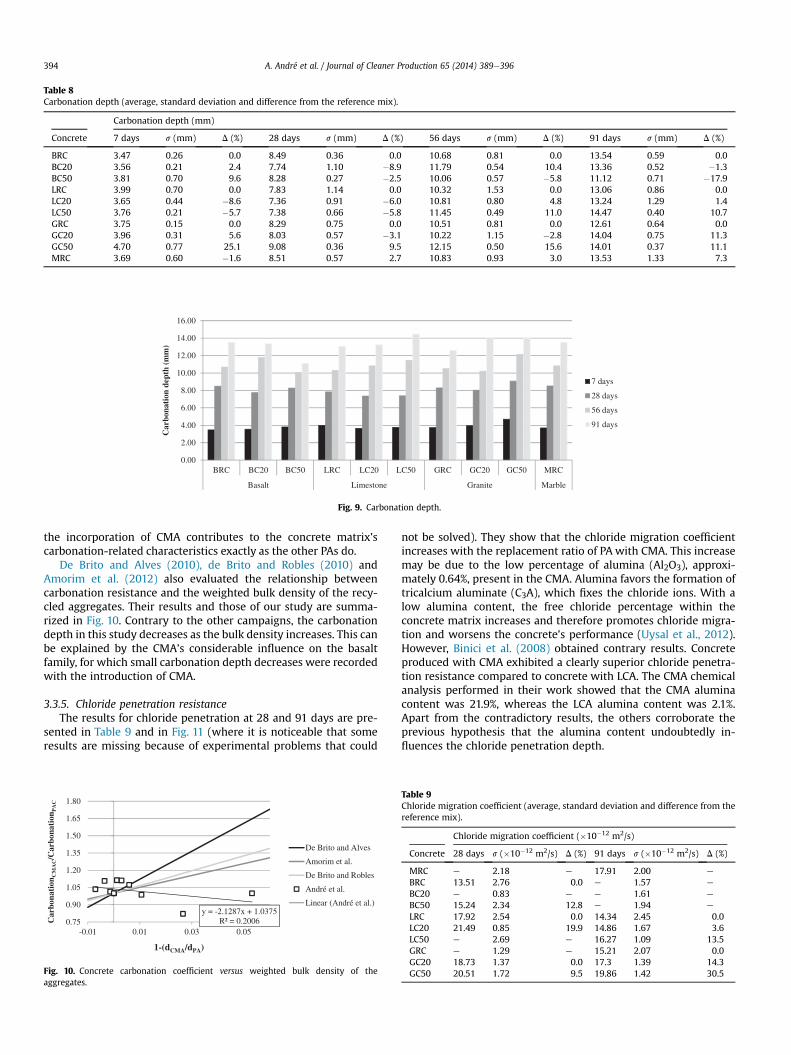
Table 8Carbonation depth (average, standard deviation and difference from the reference mix).
Carbonation depth (mm)
Concrete 7 days s (mm) D (%) 28 days s (mm) D (%) 56 days s (mm) D (%) 91 days s (mm) D (%)
BRC 3.47 0.26 0.0 8.49 0.36 0.0 10.68 0.81 0.0 13.54 0.59 0.0BC20 3.56 0.21 2.4 7.74 1.10 �8.9 11.79 0.54 10.4 13.36 0.52 �1.3BC50 3.81 0.70 9.6 8.28 0.27 �2.5 10.06 0.57 �5.8 11.12 0.71 �17.9LRC 3.99 0.70 0.0 7.83 1.14 0.0 10.32 1.53 0.0 13.06 0.86 0.0LC20 3.65 0.44 �8.6 7.36 0.91 �6.0 10.81 0.80 4.8 13.24 1.29 1.4LC50 3.76 0.21 �5.7 7.38 0.66 �5.8 11.45 0.49 11.0 14.47 0.40 10.7GRC 3.75 0.15 0.0 8.29 0.75 0.0 10.51 0.81 0.0 12.61 0.64 0.0GC20 3.96 0.31 5.6 8.03 0.57 �3.1 10.22 1.15 �2.8 14.04 0.75 11.3GC50 4.70 0.77 25.1 9.08 0.36 9.5 12.15 0.50 15.6 14.01 0.37 11.1MRC 3.69 0.60 �1.6 8.51 0.57 2.7 10.83 0.93 3.0 13.53 1.33 7.3
0.00
2.00
4.00
6.00
8.00
10.00
12.00
14.00
16.00
BRC BC20 BC50 LRC LC20 LC50 GRC GC20 GC50 MRC
Basalt Limestone Granite Marble
Car
bona
tion
dep
th (
mm
)
7 days
28 days
56 days
91 days
Fig. 9. Carbonation depth.
A. André et al. / Journal of Cleaner Production 65 (2014) 389e396394
the incorporation of CMA contributes to the concrete matrix’scarbonation-related characteristics exactly as the other PAs do.
De Brito and Alves (2010), de Brito and Robles (2010) andAmorim et al. (2012) also evaluated the relationship betweencarbonation resistance and the weighted bulk density of the recy-cled aggregates. Their results and those of our study are summa-rized in Fig. 10. Contrary to the other campaigns, the carbonationdepth in this study decreases as the bulk density increases. This canbe explained by the CMA’s considerable influence on the basaltfamily, for which small carbonation depth decreases were recordedwith the introduction of CMA.
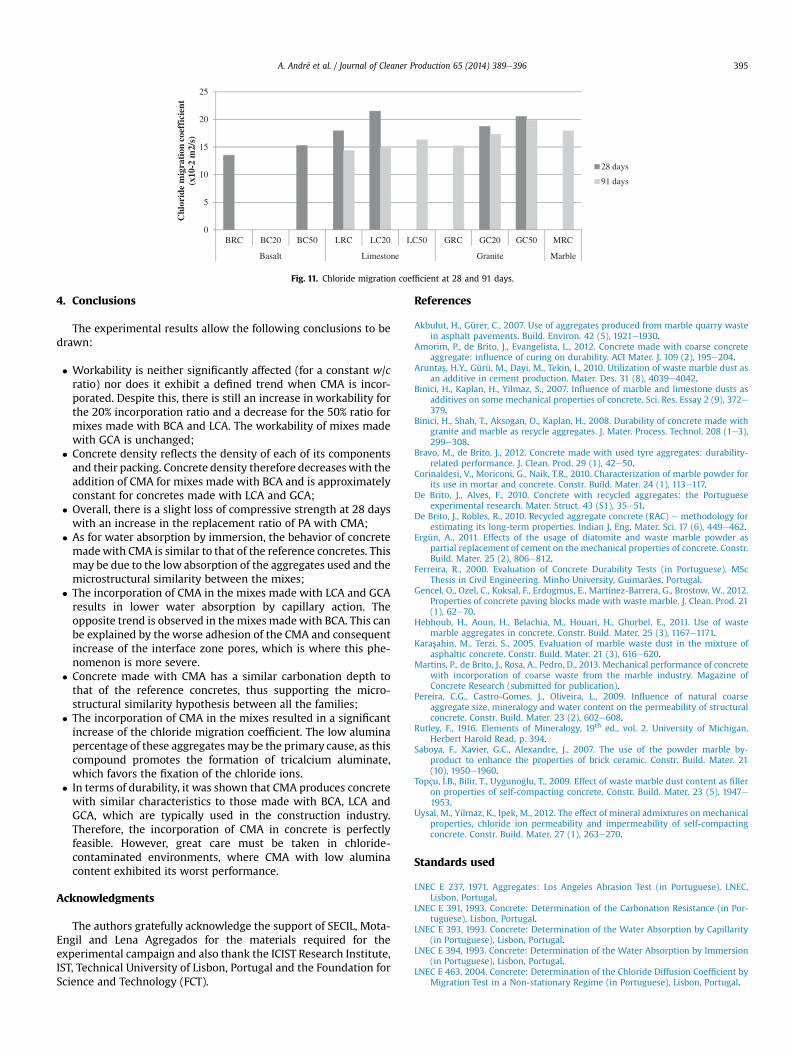
3.3.5. Chloride penetration resistanceThe results for chloride penetration at 28 and 91 days are pre-
sented in Table 9 and in Fig. 11 (where it is noticeable that someresults are missing because of experimental problems that could
y = -2.1287x + 1.0375R² = 0.20060.75
0.90
1.05
1.20
1.35
1.50
1.65
1.80
-0.01 0.01 0.03 0.05
Car
bona
tion
CM
AC/C
arbo
nati
onP
AC
1-(dCMA/dPA)
De Brito and Alves
Amorim et al.
De Brito and Robles
André et al.
Linear (André et al.)
Fig. 10. Concrete carbonation coefficient versus weighted bulk density of theaggregates.
not be solved). They show that the chloride migration coefficientincreases with the replacement ratio of PA with CMA. This increasemay be due to the low percentage of alumina (Al2O3), approxi-mately 0.64%, present in the CMA. Alumina favors the formation oftricalcium aluminate (C3A), which fixes the chloride ions. With alow alumina content, the free chloride percentage within theconcrete matrix increases and therefore promotes chloride migra-tion and worsens the concrete’s performance (Uysal et al., 2012).However, Binici et al. (2008) obtained contrary results. Concreteproduced with CMA exhibited a clearly superior chloride penetra-tion resistance compared to concrete with LCA. The CMA chemicalanalysis performed in their work showed that the CMA aluminacontent was 21.9%, whereas the LCA alumina content was 2.1%.Apart from the contradictory results, the others corroborate theprevious hypothesis that the alumina content undoubtedly in-fluences the chloride penetration depth.
Table 9Chloride migration coefficient (average, standard deviation and difference from thereference mix).
Chloride migration coefficient (�10�12 m2/s)
Concrete 28 days s (�10�12 m2/s) D (%) 91 days s (�10�12 m2/s) D (%)
MRC e 2.18 e 17.91 2.00 e
BRC 13.51 2.76 0.0 e 1.57 e
BC20 e 0.83 e e 1.61 e
BC50 15.24 2.34 12.8 e 1.94 e
LRC 17.92 2.54 0.0 14.34 2.45 0.0LC20 21.49 0.85 19.9 14.86 1.67 3.6LC50 e 2.69 e 16.27 1.09 13.5GRC e 1.29 e 15.21 2.07 0.0GC20 18.73 1.37 0.0 17.3 1.39 14.3GC50 20.51 1.72 9.5 19.86 1.42 30.5
0
5
10
15
20
25
BRC BC20 BC50 LRC LC20 LC50 GRC GC20 GC50 MRC
Basalt Limestone Granite Marble
Chl
orid
e m
igra
tion
coe
ffic
ient
(x
10-2
m2/
s)
28 days
91 days
Fig. 11. Chloride migration coefficient at 28 and 91 days.
A. André et al. / Journal of Cleaner Production 65 (2014) 389e396 395
4. Conclusions
The experimental results allow the following conclusions to bedrawn:
� Workability is neither significantly affected (for a constant w/cratio) nor does it exhibit a defined trend when CMA is incor-porated. Despite this, there is still an increase in workability forthe 20% incorporation ratio and a decrease for the 50% ratio formixes made with BCA and LCA. The workability of mixes madewith GCA is unchanged;
� Concrete density reflects the density of each of its componentsand their packing. Concrete density therefore decreases with theaddition of CMA for mixes made with BCA and is approximatelyconstant for concretes made with LCA and GCA;
� Overall, there is a slight loss of compressive strength at 28 dayswith an increase in the replacement ratio of PA with CMA;
� As for water absorption by immersion, the behavior of concretemadewith CMA is similar to that of the reference concretes. Thismay be due to the low absorption of the aggregates used and themicrostructural similarity between the mixes;
� The incorporation of CMA in the mixes made with LCA and GCAresults in lower water absorption by capillary action. Theopposite trend is observed in themixes madewith BCA. This canbe explained by the worse adhesion of the CMA and consequentincrease of the interface zone pores, which is where this phe-nomenon is more severe.
� Concrete made with CMA has a similar carbonation depth tothat of the reference concretes, thus supporting the micro-structural similarity hypothesis between all the families;
� The incorporation of CMA in the mixes resulted in a significantincrease of the chloride migration coefficient. The low aluminapercentage of these aggregatesmay be the primary cause, as thiscompound promotes the formation of tricalcium aluminate,which favors the fixation of the chloride ions.
� In terms of durability, it was shown that CMA produces concretewith similar characteristics to those made with BCA, LCA andGCA, which are typically used in the construction industry.Therefore, the incorporation of CMA in concrete is perfectlyfeasible. However, great care must be taken in chloride-contaminated environments, where CMA with low aluminacontent exhibited its worst performance.
Acknowledgments
The authors gratefully acknowledge the support of SECIL, Mota-Engil and Lena Agregados for the materials required for theexperimental campaign and also thank the ICIST Research Institute,IST, Technical University of Lisbon, Portugal and the Foundation forScience and Technology (FCT).
References
Akbulut, H., Gürer, C., 2007. Use of aggregates produced from marble quarry wastein asphalt pavements. Build. Environ. 42 (5), 1921e1930.
Amorim, P., de Brito, J., Evangelista, L., 2012. Concrete made with coarse concreteaggregate: influence of curing on durability. ACI Mater. J. 109 (2), 195e204.
Aruntas, H.Y., Gürü, M., Dayi, M., Tekin, I., 2010. Utilization of waste marble dust asan additive in cement production. Mater. Des. 31 (8), 4039e4042.
Binici, H., Kaplan, H., Yilmaz, S., 2007. Influence of marble and limestone dusts asadditives on some mechanical properties of concrete. Sci. Res. Essay 2 (9), 372e379.
Binici, H., Shah, T., Aksogan, O., Kaplan, H., 2008. Durability of concrete made withgranite and marble as recycle aggregates. J. Mater. Process. Technol. 208 (1e3),299e308.
Bravo, M., de Brito, J., 2012. Concrete made with used tyre aggregates: durability-related performance. J. Clean. Prod. 29 (1), 42e50.
Corinaldesi, V., Moriconi, G., Naik, T.R., 2010. Characterization of marble powder forits use in mortar and concrete. Constr. Build. Mater. 24 (1), 113e117.
De Brito, J., Alves, F., 2010. Concrete with recycled aggregates: the Portugueseexperimental research. Mater. Struct. 43 (S1), 35e51.
De Brito, J., Robles, R., 2010. Recycled aggregate concrete (RAC) e methodology forestimating its long-term properties. Indian J. Eng. Mater. Sci. 17 (6), 449e462.
Ergün, A., 2011. Effects of the usage of diatomite and waste marble powder aspartial replacement of cement on the mechanical properties of concrete. Constr.Build. Mater. 25 (2), 806e812.
Ferreira, R., 2000. Evaluation of Concrete Durability Tests (in Portuguese). MScThesis in Civil Engineering. Minho University, Guimarães, Portugal.
Gencel, O., Ozel, C., Koksal, F., Erdogmus, E., Martínez-Barrera, G., Brostow, W., 2012.Properties of concrete paving blocks made with waste marble. J. Clean. Prod. 21(1), 62e70.
Hebhoub, H., Aoun, H., Belachia, M., Houari, H., Ghorbel, E., 2011. Use of wastemarble aggregates in concrete. Constr. Build. Mater. 25 (3), 1167e1171.
Karasahin, M., Terzi, S., 2005. Evaluation of marble waste dust in the mixture ofasphaltic concrete. Constr. Build. Mater. 21 (3), 616e620.
Martins, P., de Brito, J., Rosa, A., Pedro, D., 2013. Mechanical performance of concretewith incorporation of coarse waste from the marble industry. Magazine ofConcrete Research (submitted for publication).
Pereira, C.G., Castro-Gomes, J., Oliveira, L., 2009. Influence of natural coarseaggregate size, mineralogy and water content on the permeability of structuralconcrete. Constr. Build. Mater. 23 (2), 602e608.
Rutley, F., 1916. Elements of Mineralogy, 19th ed., vol. 2. University of Michigan,Herbert Harold Read, p. 394.
Saboya, F., Xavier, G.C., Alexandre, J., 2007. The use of the powder marble by-product to enhance the properties of brick ceramic. Constr. Build. Mater. 21(10), 1950e1960.
Topçu, _I.B., Bilir, T., Uyguno�glu, T., 2009. Effect of waste marble dust content as filleron properties of self-compacting concrete. Constr. Build. Mater. 23 (5), 1947e1953.
Uysal, M., Yilmaz, K., Ipek, M., 2012. The effect of mineral admixtures on mechanicalproperties, chloride ion permeability and impermeability of self-compactingconcrete. Constr. Build. Mater. 27 (1), 263e270.
Standards used
LNEC E 237, 1971. Aggregates: Los Angeles Abrasion Test (in Portuguese). LNEC,Lisbon, Portugal.
LNEC E 391, 1993. Concrete: Determination of the Carbonation Resistance (in Por-tuguese), Lisbon, Portugal.
LNEC E 393, 1993. Concrete: Determination of the Water Absorption by Capillarity(in Portuguese), Lisbon, Portugal.
LNEC E 394, 1993. Concrete: Determination of the Water Absorption by Immersion(in Portuguese), Lisbon, Portugal.
LNEC E 463, 2004. Concrete: Determination of the Chloride Diffusion Coefficient byMigration Test in a Non-stationary Regime (in Portuguese), Lisbon, Portugal.

A. André et al. / Journal of Cleaner Production 65 (2014) 389e396396
NP EN 206e1, 2005. Concrete e Part 1: Specification, Performance, Production andConformity. IPQ, Lisbon, Portugal.
NP EN 933e1, 2000. Tests for Geometrical Properties of Aggregates e Part 1:Determination of Particle Size Distribution e Sieving Method. IPQ, Lisbon,Portugal.
NP EN 933e4, 2002. Tests for Geometrical Properties of Aggregates e Part 4:Determination of Particle Shape e Shape Index. IPQ, Lisbon, Portugal.
NP EN 1097e3, 2002. Tests for Mechanical and Physical Properties of Aggregates ePart 3: Determination of Loose Bulk Density and Voids. IPQ, Lisbon, Portugal.
NP EN 1097e6, 2003. Tests for Mechanical and Physical Properties of Aggregates ePart 6: Determination of Particle Density and Water Absorption. IPQ, Lisbon,Portugal.
NP EN 12350e2, 2009. Testing Fresh Concrete. Part 2: Slump-test. IPQ, Lisbon,Portugal.
NP EN 12350e6, 2009. Testing Fresh Concrete. Part 6: Density. IPQ, Lisbon, Portugal.NP EN 12390e3, 2009. Testing Hardened Concrete. Part 3: Compressive Strength of
Test Specimens. IPQ, Lisbon, Portugal.


