Embed Size (px)
DESCRIPTION
journal
Citation preview
~ P .... ,.," Minerais Engineering, Vol. 14, No. 10, pp. 1237-1246,2001
© 200 1 Elsevier Science Ud Ali rights reserved
0892-6875(01)00140-6 0892-6875/01/$ - see front matter
MODEL-BASED PROCEDURE FOR SCALE-UP OF WET, OVERFLOW BALL MILLS*
PART 1: OUTLINE OF THE METHODOLOGY
Y.T.MAN
PO Box 226, Mount Isa, Queensland, 4825, Australia E-mail: [email protected]
(Received 5 July 2000; accepted 30 Apri1200l)
ABSTRACT
Bond's methodfor ball mill scale-up only gives the mill power draw for a given duty. This method is incompatible with computer modelling and simulation techniques. It might not be applicable for the design of fine grinding ball mills and ball mills preceded by autogenous and semi-autogenous grinding mills. Model-based ball mill scale-up methods have not been validated using a wide range offull-scale circuit data. Their accuracy is therefore questionable. Some ofthese methods also need expensive pilot testing. A new ball mill scale-up procedure is deve!oped which does not have these limitations. This procedure uses data from two laboratory tests to determine the parameters of a ball mill mode!. A set of scale-up criteria then scales-up these parameters. The procedure uses the scaled-up parameters to simulate the steady state performance of full-scale mill circuits. At the end of the simulation, the scale-up procedure gives the size distribution, the volumetrie flowrate and the mass flowrate of all the streams in the circuit, and the mill power draw. @ 2001 Elsevier Science Ltd. Ali rights reserved.
Keywords Comminution; grinding; modelling; simulation
INTRODUCTION
Currently, there are two types of bail mill scale-up methods-power based methods and model-based methods.
Bond's method (Bond 1952, 1961), which is a power-based method, is still the principal way for bail mill scale-up. It is the most popular and successful of the power-based methods for bail mill scale-up. It calculates the mill power required to grind a specified throughput rate of ore from a given feed 80% passing size (p80) to a given product p80. This calculation needs the Bond Work Index. This Index represents the ore hardness. The Bond Work Index is determined from a laboratory locked-cycie rnilling test-the Bond test. This test requires a small amount of sample (about 6kg) and has a simple test procedure. These two conditions make the Bond test, and consequently Bond's method, cheap to carry out.
• Presented at Comminution '01, Brisbane, Australia, March 2001
1237
1238 Y. T.Man
However, Bond's method has a number of shortcomings:-
1. It only calculates the mill power required to grind a specified throughput rate of ore from a given feed p80 to a given product p80. It does not give the size distributions, mass and water flowrates of the streams in the circuit. Mill designers require these information for circuit designs.
2. It assumes the classifier classifies perfectly. It does not account for the influence of the classifier efficiency on the operating work index and size distribution of the streams.
3. It assumes that the baIl mill circuit feed and the baIl mill circuit product size distributions are parallel on a log-log scale. This assumption may be true for baIl mills preceded by crushers or rod mills (Morrell and Man, 1997). However, this assumption is not necessarily true for baIl mills preceded by autogenous (AG) or semi-autogenous (SAG) mills (Morrell and Man, 1997). Under these circumstances, Bond's method might not be suitable. Sorne designers recognised this situation and modify the AG/SAG mill product size distribution before applying Bond's method (Napier-Munn et al., 1996).
4. Shelton (1985) stated that Bond's method is not suitable for the design of fine grinding baIl mills. 5. The precision of Bond's method is not weIl established in the literature. Smith (1959) and Blaskett
(1969) found that Bond's method could give a design risk of about ±20%. There is no recent published data which compare the actual circuit performance with the design. Although many installations have been designed using Bond's method, these designs often contained contingencies which could have masked the imprecision of Bond's method.
6. Bond's method is not compatible with model/simulation based design techniques. This weakens simulation's ability to accurately predict, in details, the response of the entire comminution circuit to changes in equipment type, size and configuration.
Sorne researchers, such as Austin and WeIler (1982), Herbst and Fuerstenau (1980) and WeIler et al. (1988) proposed model/simulation based design techniques for baIl mills. AlI these techniques use the population balance ball mill model, a set of scale-up criteria, and laboratory or pilot tests results. Being model/simulation based, such techniques can determine the interaction between the various equipment in the circuit. These techniques can also give full details of stream flowrates and size distributions.
However, despite the versatility of model/simulation based techniques, they are still not widely accepted in the design of ball mill circuits. This is partly because of the extended use of Bond's method. This is also because their accuracy is not weIl established. There is little published data on the accuracy of these techniques. In sorne cases, what data are available are inconclusive. In addition, sorne of the se techniques need time consuming, and therefore expensive, testwork.
THE PROCEDURE
The new scale-up procedure has six components: (l) two laboratory tests, (2) a baIl mill model, (3) a set of scale-up criteria, (4) a classifier model, (5) a simulation programme, and (6) a mill power model.
The two laboratory tests give the data for the fitting of the baIl mill model parameters. The set of scale-up criteria scales-up the fitted parameters. The simulation programme links the baIl mill model (which has the scaled-up parameters) with the classifier model. The simulation programme simulates the interaction between the baIl mill and the classifier (when the baIl mill is in closed circuit). At the end, the simulation gives the steady state performance of the whole circuit, including the flowrate and the size distribution of the streams. The mill power model (Morrell, 1996) predicts the power draw of the full-sc ale mills.
Bali mill model
The baIl mill model is Whiten's Perfect Mixing Model (Whiten, 1974). This model is a variation of the population balanced model. Equation 1 gives this model in its matrix form:-
o = ( -1 -1) AR<l> -R<l> -1 p+f (1)
where: -
f = 1 = P = R = <l> = A =
Model-based procedure for scale-up of wet, overflow baIl mills. Part 1: OutIine of the methodology
the feed size distribution a unit matrix the product size distribution the breakage rate distribution the discharge function (the material transport function) the appearance function
1239
This model has a simple structure and the model assumes that the mill is a single perfectly mixed reactor. The assumption of a single perfectly mixed reactor can be criticised because results from liquid tracer tests show that a series of unequal reactors more closely fits experimental residence time data. For example, Weiler (1980) found that residence time distribution could be fitted weil by a series of perfectly mixed reactors. Weiler et al. (1988) also found that the number of reactors in series which fitted their residence time data varied from 3 to 5,-with the largest reactor accounting for 0.2 to 0.95 of the total residence time. Unfortunately, the literature does not suggest what the relationship is between mill design, and the number and size of reactors. The number and the size of reactors can be determined from data from an existing fullscale bail mil!. However, in a greenfield design study, no such data are available. In the absence of a relationship which relates mill design to the reactor configuration, the assumption of a single perfectly mixed reactor is an obvious choice.
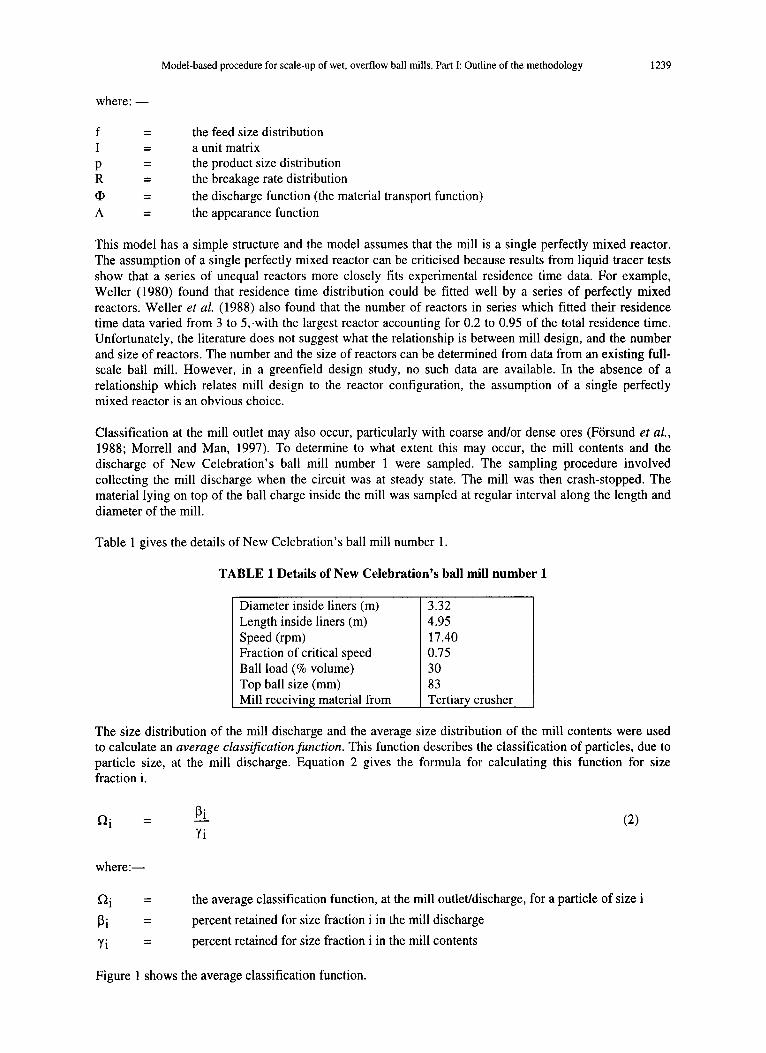
Classification at the mill outlet may also occur, particularly with coarse and/or dense ores (Fors und et al., 1988; Morrell and Man, 1997). To determine to what extent this may occur, the mill contents and the discharge of New Celebration's bail mill number 1 were sampled. The sampling procedure involved collecting the mill discharge when the circuit was at steady state. The mill was then crash-stopped. The materiallying on top of the bail charge inside the mill was sampled at regular interval along the length and diameter of the mil!.
Table 1 gives the details of New Celebration's bail mill number 1.
TABLE 1 Details of New Celebration's bail mill number 1
Diameter inside liners (m) Length inside liners (m) Speed (rpm) Fraction of critical speed Ballioad (% volume) Top bail size (mm) Mill receiving material from
3.32 4.95 17.40 0.75 30 83 Tertiary crusher
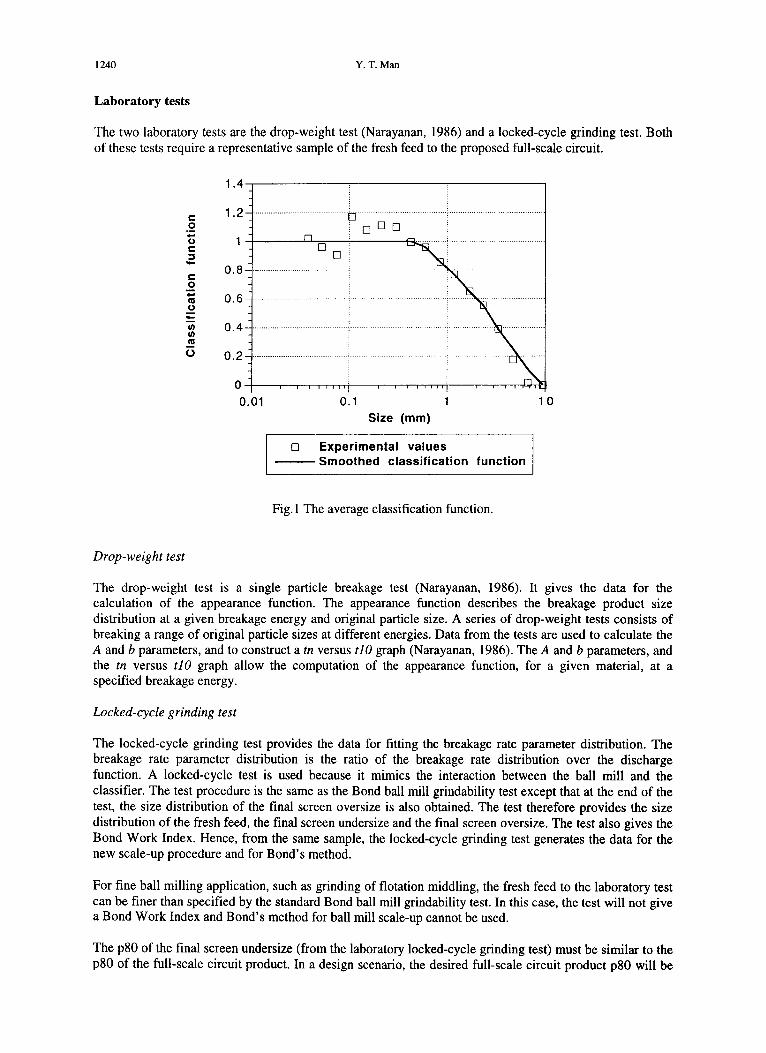
The size distribution of the mill discharge and the average size distribution of the mill contents were used to calculate an average classification function. This function describes the classification of particles, due to particle size, at the mill discharge. Equation 2 gives the formula for calculating this function for size fraction i.
Q. 1 =
where:-
Q' 1 =
Pi =
Yi =
~ (2) Yi
the average classification function, at the mill outletldischarge, for a particle of size i
percent retained for size fraction i in the mill discharge
percent retained for size fraction i in the mill contents
Figure 1 shows the average classification function.
1240 Y. T.Man
Laboratory tests
The two laboratory tests are the drop-weight test (Narayanan, 1986) and a locked-cycle grinding test. Both of these tests require a representative sample of the fresh feed to the proposed full-sc ale circuit.
Drop-weight test
1.4.-----------~----------~--------_,
c o -(J
c j -c o
1. 2 -j ........................... .
0.8
ai 0.6 (J -~ 0.4 -j ........................ .
CIl
o 0.2-; ........................ ·
04---.-,,~~~-,-,~~~--,-~~~6
0.01 0.1 10 Size (mm)
o Experimental values ---- Smoothed classification function
Fig.l The average classification function.
The drop-weight test is a single particle breakage test (Narayanan, 1986). It gives the data for the ca1culation of the appearance function. The appearance function de scribes the breakage product size distribution at a given breakage energy and original particle size. A series of drop-weight tests consists of breaking a range of original particle sizes at different energies. Data from the tests are used to ca1culate the A and b parameters, and to construct a tn versus tJO graph (Narayanan, 1986). The A and b parameters, and the tn versus tJO graph allow the computation of the appearance function, for a given material, at a specified breakage energy.
Locked-cycle grinding test
The locked-cycle grinding test pro vides the data for fitting the breakage rate parameter distribution. The breakage rate parameter distribution is the ratio of the breakage rate distribution over the discharge function. A locked-cycle test is used because it mimi cs the interaction between the ball mill and the classifier. The test procedure is the same as the Bond bail mill grindability test except that at the end of the test, the size distribution of the final screen oversize is also obtained. The test therefore provides the size distribution of the fresh feed, the final screen undersize and the final screen oversize. The test also gives the Bond Work Index. Hence, from the same sample, the locked-cycle grinding test generates the data for the new scale-up procedure and for Bond's method.
For fine bail milling application, such as grinding of flotation middling, the fresh feed to the laboratory test can be finer than specified by the standard Bond bail mill grindability test. In this case, the test will not give a Bond Work Index and Bond's method for bail mill scale-up cannot be used.
The p80 of the final screen undersize (from the laboratory locked-cycle grinding test) must be similar to the p80 of the full-scale circuit product. In a design scenario, the desired full-sc ale circuit product p80 will be
~ 1
Model-based procedure for scale-up of wet, overflow bail mills. Part 1: Outline of the methodology 1241
given. A laboratory screen with an appropriate aperture size will produce the desired p80. Using the data from 66 laboratory locked-cycle tests, it was found that:-
p80lab :::::: Screen aperture size (Jlm)
li (3)
where:-
p80lab = the p80 of the final screen undersize of the laboratory test, Jlm
Scale-up criteria
In a design scenario, the feed size distribution and the product size distribution cannot be scaled-up. This is because the feed size distribution is given and this is the size distribution of material one has to break. The product size distribution can be predicted using the baIl mill model. In sorne cases, the product size distribution is given (for example the p80) because the downstream process needs a certain particle size in order to operate properly. Therefore the only components in the baIl mill model that can be scaled-up are: the appearance function, the breakage rate distribution and the discharge function. The scale-up criteria scale-up these components according to the variables whose values change from a laboratory mill to a fullscale mill.
Appearance function
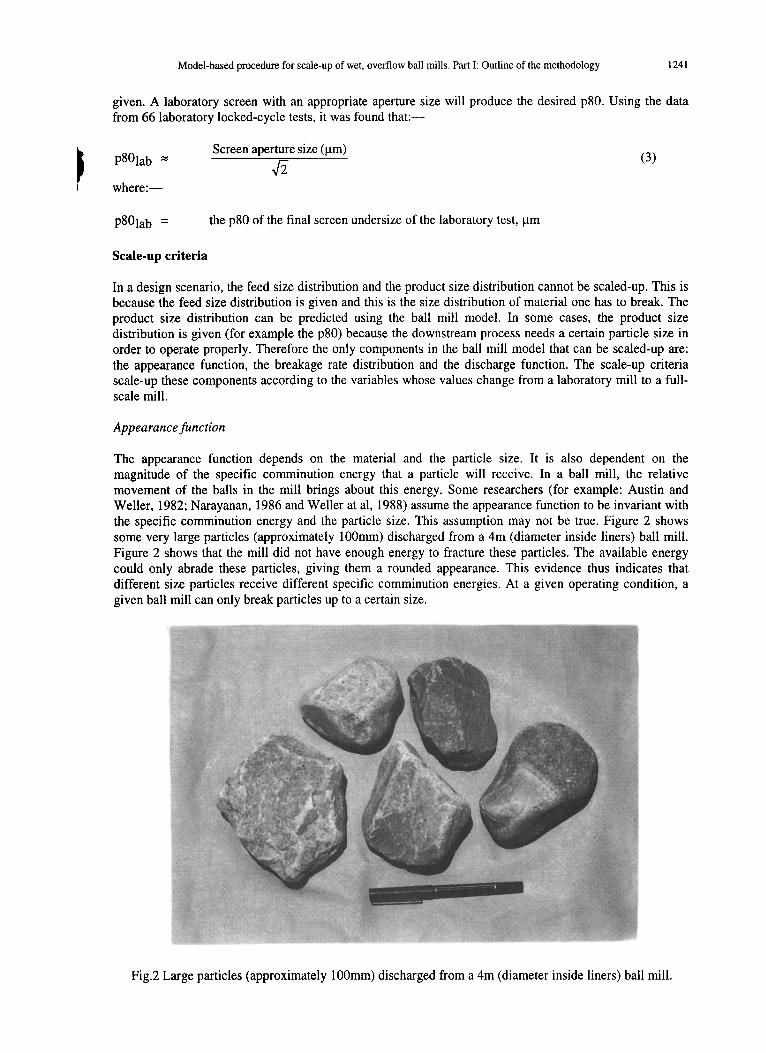
The appearance function depends on the material and the particle size. It is also dependent on the magnitude of the specifie comminution energy that a particle will receive. In a baIl mill, the relative movement of the balls in the mill brings about this energy. Sorne researchers (for example: Austin and WeIler, 1982; Narayanan, 1986 and WeIler at al, 1988) assume the appearance function to be invariant with the specifie comminution energy and the partie le size. This assumption may not be true. Figure 2 shows sorne very large particles (approximately l00mm) discharged from a 4m (diameter inside liners) baIl mill. Figure 2 shows that the mill did not have enough energy to fracture these particles. The available energy could only abrade these particles, giving them a rounded appearance. This evidence thus indicates that different size particles receive different specifie comminution energies. At a given operating condition, a given baIl mill can only break particles up to a certain size.
Fig.2 Large particles (approximately 100mm) discharged from a 4m (diameter inside liners) baIl mill.
1242 y. T. Man
The new baIl mill scale-up procedure contains a model which estimates the comminution energy for each particle size (Man, 2000). This model relates the comminution energy with the mill operating condition, thus the calculated comminution energy should be appropriate for baIl mill scale-up. Hence:-
A' 1
where:-
oc Ecs,i (4)
Ecs,i = the specifie comminution energy for a given particle in size fraction i, kWh/tonne
appearance function for particles in size fraction i
It can be shown that Ecs,i is directly proportion al to the mill diameter (Man, 2000). Therefore equation 4
may be re-wriUen as: -
A' 1
where:-
oc
=
Breakage rate
(5)
mill diameter (inside liners), m
The breakage rate can be defined as the number of breakage collision per particle per unit time (Morrell, 1989), ie. it describes how often a particle of a given size will be hit by a baIl. It is hypothesised that the breakage rate depends on:-
• the surface area of the balls in the mill • the mill speed • the size distribution of the particles in the mill
How the breakage rate varies with the size distribution of the particles in the mill is not weIl understood. There is no published mathematical relationship which relates these two quantities. To overcome this problem the laboratory grinding test should mimic, as far as practicable, the condition of the full-scale circuit. Hence the locked-cycle grinding test requires an appropriate screen aperture size. An appropriate aperture size ensures that the size distribution of the product and the recycle streams are as near as possible to that expected in the full-scale circuit.
The surface area of the balls affects the amount of grinding surface between which particle breakage can occur. The mill speed affects the relative movement of the balls in the mill - particle breakage occurs when balls are moving relative to each other. Thus, for a given total charge volume, the breakage rate is assumed to be related to the surface area of the balls and the mill speed in the following way: -
R' 1
where:-
= =
= = =
mean baIl size, m
fraction of mill volume occupied by balls (including voids)
rotational rate of the mill, revolutions per second
the breakage rate of particles in size fraction i
mill volume inside liners, m3
(6)
Model-based procedure for scale-up of wet, overflow bail mills. Part 1: Outline of the methodology 1243
= fraction of voids in the ball charge
Mass transport
The discharge function, <1>, describes how particles are discharged out of the mill. If there is no particle classification at the mil! discharge, then particles will behave like water and the discharge function will be invariant with particle size. When this occurs, the discharge function is proportional to the volumetric flowrate of the slurry through the mill (Morrell and Man, 1997).
For mil! scale-up, the volumetric flowrate through the full-scale mill is predicted during simulation, whilst the effective volumetric flowrate through the laboratory mill is estimated using equation 7: -
Q pulp(Laboratory) = Volume ground
(7) Duration of the last cycle
where:-
Qpulp(Laboratory) = the volumetric flowrate of the laboratory mill, m3/hour
The mill used in the laboratory locked-cycle grinding test grinds a constant 0.0007m3 of material (ie. 700rnl), therefore the nominator in equation 7 is 0.0007.
The laboratory mil! discharges all the particles at the end of each grinding cycle, hence classification (due to particle size) does not happen at the outletldischarge of the laboratory mil!. The value of the classification function for the laboratory mil! is therefore 1 for all particle sizes. In continuous full-scale mills however, larger and/or denser particle might be classified. The average classification function (see figure 1) accounts for this effect. Thus the discharge of particles out of a mil! is proportional to the volumetric flowrate through the mill and the average classification function:-
<1>' 1 oc
where:-
Qpulp =
Q' 1 =
<1>' 1 =
Impact breakage
volumetric flowrate of slurry through the mill, m3/hour
the average classification function for particles in size fraction i
the discharge function of particles in size fraction i
(8)
It is generally accepted that both impact and attrition breakages occur within baIl mil!s (Kelly and Spottiswood, 1990; Radziszewski, 1991). Attrition breakage occurs within the shearing layers of balls in the ball bed. The pressure generated within the bed produces the force required to break particles, whilst the shearing layers of balls provide the surface where particle breakage occurs. Impact breakage however, depends on the mass of the individual ball. The kinetic energy of the ball is transmitted to ore particles and breaks them. Impact breakage also depends on the baIl surface area. Hence it is hypothesised that impact breakage is dependent on the total mass of balls in a mil! and the surface area of the balls. Thus: -
Impact breakage oc nM ball A ball
where:-
Aball =
Mball =
surface area of a baIl, m2
mass of a baIl, kg
(9)
1244 y. T. Man
n = the total number of balls in the mill
The total number of balls in the mill is inversely proportional to cube of the ball diameter, the mass of a baIl is proportional to the cube of the baIl diameter, and the surface area of a baIl is proportional to the square of the baIl diameter, therefore proportionality 9 may be re-wriUen as:-
Impact breakage oc (10)
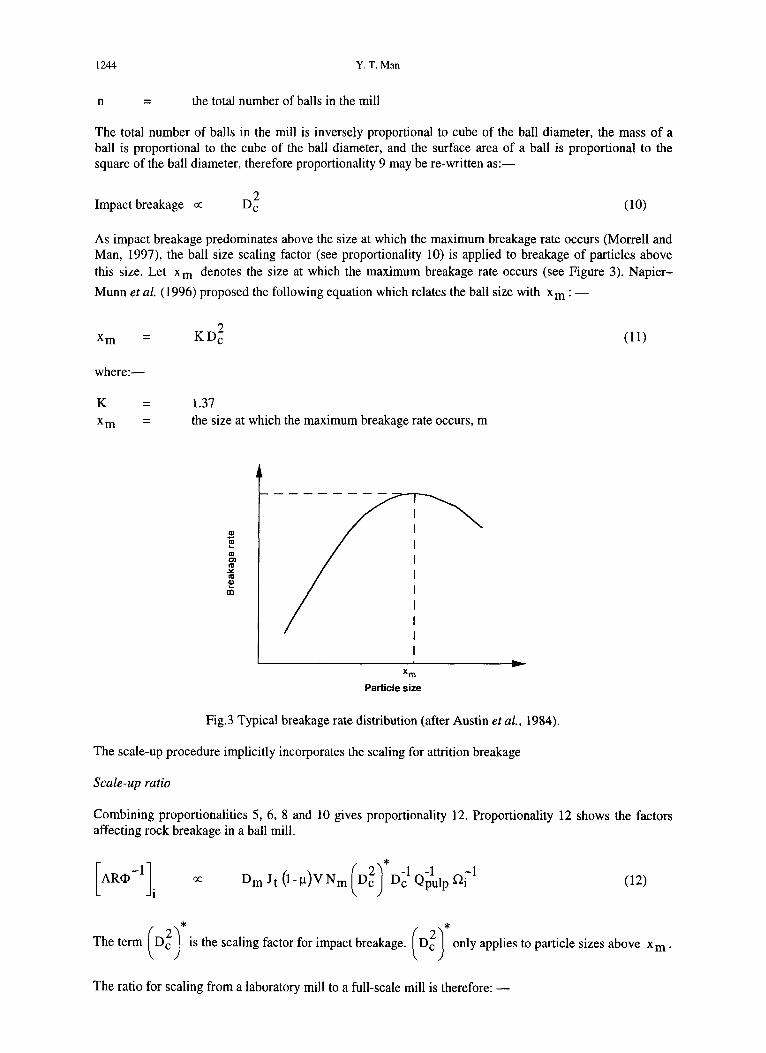
As impact breakage predominates above the size at which the maximum breakage rate occurs (Morrell and Man, 1997), the baIl size scaling factor (see proportionality 10) is applied to breakage of particles above this size. Let xm den otes the size at which the maximum breakage rate occurs (see Figure 3). Napier-
Munn et al. (1996) proposed the following equation which relates the baIl size with xm :-
=
where:-
K = =
1.37 the size at which the maximum breakage rate occurs, m
CIl
'§ CIl CI .,
.>< ., <II
ài
--------=--r-~
Xm Particle size
Fig.3 Typical breakage rate distribution (after Austin et al., 1984).
The scale-up procedure implicitly incorporates the scaling for attrition breakage
Scale-up ratio
(11)
Combining proportionalities 5, 6, 8 and 10 gives proportionality 12. Proportionality 12 shows the factors affecting rock breakage in a baIl mi Il.
[ AR<l> -11 oc (12)
* * The term ( D~) is the scaling factor for impact breakage. (D~) only applies to particle sizes above xm .
The ratio for scaling from a laboratory mill to a full-scale mill is therefore: -
Model-based procedure for scale-up of wet, overflow bail mills. Part 1: Outline of the methodology 1245
[AR<l> -1] i,Full-scale
[ * 1 2 -1 -1 -1 Dm J t (I-Il)VN m (Dc ) Dc QpulpOi
Full-scale (13)
[AR<l> -1] i, Laboratory [ * 1 2 -1 -1 -1
DmJt(1-Il)VNm(Dc) Dc QpulpOi
Laboratory
Vis proportional to [D~ L]. Therefore the term [DmJ t VNm ] can be re-wriUen as [D~LNmJ t] which
is directly related to the net mill power draw (Morrell, 1996). The procedure is therefore consistent with the mill power draw.
Classifier model
This scale-up procedure uses the efficiency curve to model the classifier. The efficiency curve is simple and versatile. It can model all the popular classifiers, including hydrocyclones and screens.
Powerdraw
The scale-up procedure needs accurate prediction of the mill power draw. Morrell (1996) developed a power model which uses a simplified description of the grinding charge motion. The model incorporates the effects of the slurry pool which forms in all overflow mills.
The mill power model has equations which de scribe the position of the shoulder and toe of the charge and how they (the position ofthe shoulder and the toe) vary with the mill speed and the volumetric loading. The model uses these calculations in an energy balance and determines the mill power drawn at the mill shell. A separate equation estimates the motor, the gearbox and the bearing losses. These losses are added to the power drawn at the mill shell to give the gross power.
CONCLUSIONS
This paper outlined a new ball mill scale-up procedure. This procedure relies on data from two laboratory tests, and these laboratory tests need about 20 kg of sample only. The procedure is therefore cost effective and is particularly useful at the early stage of plant development when there is liule material available for testing.
The scale-up criteria, used in this procedure, are mechanistic. They scale-up the laboratory test data according to the variables whose values change from a laboratory mill to a full-scale mill.
The new ball mill scale-up procedure provides much more information about the full-scale circuit compares to Bond's method. This is because the new procedure is model-based. The procedure can predict the size distribution and flowrate of all the streams within the full-scale circuit. It can also predict the power draw of the full-scale mill.
Part II of this series of papers will show how this scale-up procedure is executed. And Part III will give the results from the calibration and validation of the procedure.
ACKNOWLEDGMENT
1 thank the following people and organisations for their help in this research: -
• The financial support of the sponsors of the AMIRA-JKMRC projects P9K and P9L.
1 246 Y. T. Man
• Newcrest Mining Limited for access to New Celebration and for permission to publish their data. • S. Morrell for his advice on comminution. • WJ. Whiten for his ad vice on computer programming.
REFERENCES
Austin L.G. and Weiler K.R., 1982. Simulation and Scale-Up of Wet Bali Mills. XIV International Mineral Processing Congress, Toronto, Canada, pp 8.1-8.24.
Austin L.G., Klimpel R.R. and Luckie P.T., 1984. Pro cess Engineering of Size Reduction: Ball Milling. American Institute of Mining, Metallurgical and Petroleum Engineers Inc., New Jersey.
Blaskett K.S., 1969. Estimation of the Power Consumption in Grinding Mills. Proceeding of the Ninth Commonwealth Min. Metall., 3, pp 631-649.
Bond F.C., 1952. The Third Theory of Comminution. Transaction AIME (Mining), Vol. 193, pp 484-494. Bond F.C., 1961. Crushing and Grinding Calculations. Allis-Chaimers Publication, No. 07R9235B,
revised. Forsund B., Norkyn 1., Sankvik K.L. and Winther K., 1988. Sydarangers 6.5m Diameter x 9.65m Bali Mill.
XVI International Mineral Processing Congress [Editor: Forssberg E.], pp 171-183. Kelly E.G. and Spottiswood DJ., 1990. The Breakage Function; What Is It Really? Minerais Engineering,
Vol. 3 No.5, pp 405-414. Herbst J.A. and Fuerstenau D.W., 1980. Scale-Up Procedure for Continuous Grinding Mill Design Using
Population Balance Models. International Journal of Mineral Processing, Vol. 7, pp 1-31. Man Y.T., 2000. A Model-Based Scale-Up Procedure for Wet, Overjlow Ball Mills. PhD thesis, The
University of Queensland, Brisbane, Australia. Morrell S., 1996. Power Draw of Wet Tumbling Mills and its Relationship to Charge Dynamics - Part l:a
Continuum Approach to Mathematical Modelling of Mill Power Draw. Transaction of the Institution of Mining and Metallurgy (Section C: Mineral Processing and Extractive Metallurgy), Vol. 105, pp C42-C53.
Morrell S., 1989. Simulation of Bauxite Grinding in a Semi-Autogenous Mill and DSM Circuit, MEng thesis, The University of Queensland, Brisbane, Australia.
Morrell S. and Man Y.T., 1997. Using Modelling and Simulation for the Design of Full Scale Bali Mill Circuits. Minerais Engineering, Vol. 10 No. 12, pp 1311-1327.
Napier-Munn T.J., Morrell S., Morrision RD. and Kojovic T., 1996. Mineral Comminution Circuits: Their Operation and Optimisation. JKMRC Monograph Series in Mining and Mineral Processing 2, The University of Queensland, Brisbane, Australia.
Narayanan S.S., 1986. Development of a Laboratory Single Particle Breakage Technique and its Application to Bail Mill Modelling and Scale-Up. PhD thesis, The University of Queensland, Brisbane, Australia.
Radziszewski P., 1991. Etude de l'Automatisation du Procédé de la Comminution dans un Broyeur à Boulets. Doctorat thesis, Laval University, Québec City, Canada.
Shelton D.C., 1985. Regrind Mill Sizing. Proceeding of the XVth International Mineral Processing Congress, Vol. 1, Cannes, France, pp 188-200.
Smith R, 1959. Power Survey. Portland Cern. Assoc. Rep., MP-73. Weiler K.R, 1980. Hold-Up and Residence Time Characteristics of Full-Scale Grinding Circuits, IFAC
Mining, Mineral and Metal Processing, Montreal, Canada, pp 303-309. Weiler K.R., Sterns UJ., Arton E. and Bruckard WJ., 1988. Multicomponent Models of Grinding for
Scale-Up from Continuous Small or Pilot Scale Circuit. International Journal of Mineral Processing, Vol. 22, pp 119-147.
Whiten W.J., 1974. A Matrix Theory of Comminution Machines. Chemical Engineering Science, Vol. 20, pp 589-599.
Correspondence on papers published III MineraIs Engineering lS invited bye-mail to [email protected]


