Embed Size (px)
Citation preview
8/13/2019 1-s2.0-S0361368213000676-main
http://slidepdf.com/reader/full/1-s20-s0361368213000676-main 1/23
How arbitrary are international accounting classifications?
Lessons from centuries of classifying in many disciplines,
and experiments with IFRS data
Christopher Nobes a,b,⇑, Christian Stadler c,1
a School of Management, Royal Holloway, University of London, Egham, Surrey TW20 0EX, UK b Discipline of Accounting, University of Sydney, Australiac Department of Accounting and Finance, Lancaster University Management School, Lancaster, Lancashire LA1 4YX, UK
Keywords:
Accounting choiceMeta-analysisSensitivity
a b s t r a c t
The process of classification is central to the daily task of doctors and librarians; and it isthe foundation of study and research in chemistry and biology. Double-entry bookkeepingand the preparation of financial statements are classification activities of accounting prac-
tice. Classifying national accounting systems has long been an aspect of accountingresearch. This paper seeks to extract lessons for accounting researchers from anthropology,biology, chemistry, cosmology and medicine. In particular, we examine how the classifiersthemselves and the characteristics that they choose can affect classification. We observethat objectivity is neither possible nor desirable in classification. Despite the arbitrariness,some classifications can be more reasonable or more useful than others. For previousaccounting classifications, we analyze the classifiers, the scope, the characteristics used,
the data and the classification techniques. We report various problems. We then empiri-cally investigate the sensitivity of classifications to such issues as the characteristics cho-sen, and the countries and sectors included. For this, we hand pick data on the practices of large listed companies from 12 jurisdictions relating to 14 accounting topics under Inter-national Financial Reporting Standards. We show how different researchers could producedifferent classifications, particularly depending on which accounting topics are used to rep-resent the countries.
2013 Elsevier Ltd. All rights reserved.
Introduction
Classification is a fundamental part of many disciplines.The classifications of diseases and books are vital in thedaily tasks of medical practitioners and librarians, respec-tively. The Linnaean and Mendeleev classifications are cen-tral to learning and research in biology and chemistry.Classifications have also been made in many other fields;
for example, languages (Ruhlen, 1991), economies(Neuberger & Duffy, 1976), political systems (Shils, 1966),and legal systems (David & Brierley, 1985). Members of society are also put into classes, e.g. recently in the UK (Sa-vage et al., 2013). In all cases, the fundamental purpose of the classification is to simplify (Rudner, 1966).
The everyday work of accountants involves recordingtransactions in the classification system that is double-en-try bookkeeping. The financial statements which result arealso classifications: for example, assets are classed asnon-current or current; the former are then sub-classedas tangible, intangible or financial (Gröjer, 2001). Theclassifications are debatable: in the income statement,should expenses be classified by nature or by function?
0361-3682/$ - see front matter 2013 Elsevier Ltd. All rights reserved.http://dx.doi.org/10.1016/j.aos.2013.10.001
⇑ Corresponding author at: School of Management, Royal Holloway,University of London, Egham, Surrey TW20 0EX, UK. Tel.: +44 1784414120.
E-mail addresses: [email protected](C.Nobes),[email protected] (C. Stadler).
1 Tel.: +44 1524 592221.
Accounting, Organizations and Society 38 (2013) 573–595
Contents lists available at ScienceDirect
Accounting, Organizations and Society
j o u r n a l h o m e p a g e : w w w . e l s e v i e r . c o m / l o c a t e/ a o s

8/13/2019 1-s2.0-S0361368213000676-main
http://slidepdf.com/reader/full/1-s20-s0361368213000676-main 2/23
Some classifications are metaphysical: the split of equityfinancial assets into trading or available-for-sale rests2
not on any observable characteristic, nor even on the real
intentions of managers, but on the declared intentions of
managers.
Classification has also been applied in the field of inter-national accounting. Just as in other fields, classificationhas been used to assist understanding of how the manydifferent objects (in this case, accounting systems) are re-lated. We explain in more detail below how classificationof accounting systems can be relevant to accounting prac-tice and research. We use the term ‘accounting system’ torefer to a set of accounting practices, i.e. policies on recog-nition, measurement and presentation as used in a com-pany’s published financial statements. For example, eachindividual listed company in the USA has its own account-ing practices. However, the accounting of all the companieshas many shared characteristics, imposed and enforced bythe Securities and Exchange Commission. The individualexamples of US accounting share so much in common thatthey could be said to comprise a ‘system’: the US GAAPaccounting system. Another precise, but quite different,system is French GAAP as used for unconsolidated financialstatements in France. A country can exhibit more than onesystem. For example, although a national GAAP (such asFrench GAAP) is still used for unconsolidated financialstatements in most EU countries, the consolidated state-ments of listed companies are now prepared using Interna-tional Financial Reporting Standards (IFRS).
The US and French ‘systems’ contain few overt3 options.
However, partly because of international political negotia-
tions (Camfferman & Zeff, 2007, chap. 5), many options were
included in IFRS; although these are gradually being re-
moved. Therefore, transition from French (or German etc.)
GAAP to IFRS has increased the variation in accounting prac-
tices within a country. Even so, when considering the op-
tions, national factors (including such matters as tax and
legal systems) can still affect a company’s choice. Ball
(2006, p. 15) explains how, even if all entities are complying
with IFRS, the incentives of preparers and enforcers remain
‘primarily local’. As a result, one can discern national pat-
terns of IFRS practice (Kvaal & Nobes, 2010). These could
be seen as different ‘systems’ of generic IFRS. We classify
such systems in the empirical part of this paper.
Many international classifications of accounting sys-tems have been proposed, beginning more than a centuryago. An examination of other fields (see below) suggeststhat a classification might reflect its classifier, and thatthe process of classification is awash with judgements of various kinds. Few accounting classifiers have even dis-
cussed, let alone investigated, the sensitivity of classifica-tions to changes in the nature of the classifiers, thenumber of objects being classified (countries or accountingsystems), the nature and number of characteristics used tomeasure the objects, or the type of companies (e.g. corpo-rate sectors) included. This paper discusses and empiricallyinvestigates these issues.
Our first objective is to investigate the ways in whichclassifications in fields other than accounting (i.e. anthro-pology, biology, chemistry, cosmology and medicine) havebeen affected by issues analogous to those in the previousparagraph and how classifications have changed dramati-cally over time. We seek lessons for assessing the robust-ness of accounting classifications.
Our second objective is to apply these lessons. Weexamine previous accounting classifications, especially torecord the number of countries classified, the numberand type of characteristics used to classify them, andwhether industry sectors were discussed or excluded. Wefind that the early classifications reflect the classifiers; inparticular, they vary by the national backgrounds of theclassifiers. We then find that some classifiers apparentlyused no data, and most of the rest used data collected byothers for other purposes. Few classifiers specified the dateor the scope of their classifications (e.g. was it limited tolisted companies or to non-financial companies?), andfew specified a clear purpose.
Our final objective is to investigate empirically whetheraccounting classifications are anything other than arbi-trary; whether they can easily be manipulated to back upparticular arguments. To do this, we hand pick data onthe practices in 2011, under International Financial Report-ing Standards (IFRS), of a large sample of listed companiesfrom 12 jurisdictions. For these companies, we examinethe observable accounting policy choices on 14 topics,including presentation issues (e.g. choice of format forthe income statement) and measurement issues (e.g. useof cost or fair value for investment property). Our analysesare based on a total of 5689 choices of 514 companies. Wefind that our classifications are highly sensitive to changesin the set of characteristics measured (i.e. the IFRS policytopics, in our case), and this is a feature common to classi-fications in other fields such as biology. However, certainaspects of the classifications are remarkably stable, e.g.Italy and Spain are always in the same group, and neverwith the UK. Furthermore, with minor exceptions, the clas-sifications are much more robust to the exclusion of indi-vidual countries or sectors. We therefore conclude thatour classifications based on IFRS choices are not essentiallyarbitrary. Nevertheless, our classifications could be used tosupport or refute the influence on accounting of the code/common legal dichotomy.
The advantage of using the above policy topics is thatIFRS specifically allows management to choose amongthe options.4 There is therefore scope for country and indus-
try influences to lead to varied practice, unlike the setting of
previous studies of pre-IFRS accounting where management
is constrained by national rules, which can also vary by
industry. Our experiments deal with the accounting policy
choices of actual companies but, for the purposes of other
accounting research, different objects should be classified.
For example, in an analysis of corporate reporting regula-
tion, Leuz (2010) classifies countries on the basis of facts
and impressions about legal systems and securities laws.
2 As under IAS 39, para. 9.3
As explained later, we use this term to describe policy options that havebeen deliberately inserted into accounting rules.
4
Some caveats will be entered later, but our policy topics are presentedin the IFRS documents as free choices.
574 C. Nobes, C. Stadler / Accounting, Organizations and Society 38 (2013) 573–595

8/13/2019 1-s2.0-S0361368213000676-main
http://slidepdf.com/reader/full/1-s20-s0361368213000676-main 3/23
The purpose of a study should guide the choice of character-
istics measured (Roberts, 1995); different accounting classi-
fications are suitable for different purposes.
The paper contributes by drawing together relevant les-sons on classification from fields other than accounting; byconducting the first meta-analysis of accounting classifica-tions; by applying the lessons from other fields when ana-lyzing the accounting classification literature with a newfocus on the nature of the classifiers and of the character-istics, sectors and countries included; and by assessing thereliability of previous classifications through empiricalinvestigation of the sensitivity of classification to varia-tions in such factors, thereby revealing the dramatic effectof inclusions/exclusions on classifications. Our purpose isnot to present a classification but, as a by-product of ourwork, we provide data on IFRS practices for the first timefor several jurisdictions (i.e. China, Hong Kong, South Afri-ca, South Korea and Switzerland), and we provide classifi-cations which include these countries (and Canada) for thefirst time.
Our findings on the reliability of classifications areimportant because hundreds5 of academic papers refer to
the classifications as part of motivating research (Ball,
Kothari, & Robin, 2000; Gray, 1988; O’Donnell & Prather-
Kinsey, 2010; Saudagaran & Biddle, 1995) or to justify an
independent variable (type of accounting system) which is
expected to influence issues such as value relevance (e.g.
Ali & Hwang, 2000). Then, there are new uses for classifica-
tions, as explanations of which companies volunteer to
adopt IFRS (Tarca, Morris, & Moy, 2013), how jurisdictions
respond to IFRS (Sellhorn & Gornik-Tomaszewski, 2006;
Tyrrall, Woodward, & Rakhimbekova, 2007), how countries
change from one class to another (Xiao, Weetman, & Sun,
2004), how practices on major topics vary over time ( Ding,
Richard, & Stolowy, 2008), how companies respond to the
choices available in IFRS (Nobes, 2011), why the amount of
lobbying on IFRS varies by country (Orens, Jorissen, Lybaert,
& van der Tas, 2011), by how much various countries’
domestic accounting requirements vary from IFRS (Ding,
Hope, Jeanjean, & Stolowy, 2007), or how to identify coun-
tries with similar backgrounds when selecting countries
for study (Delvaille, Ebbers, & Saccon, 2005). If the classifica-
tions are inappropriate, the research setting or the variables
will be questionable.
For financial analysts, students and policy makers, theclassifications are a convenient way of simplifying andsummarizing. So, again, inappropriate classifications arelikely to be misleading. For instance, much of the argumen-tation on the development of new standards is political(Harrison & McKinnon, 1986), and is now often expressedin terms of resisting ‘Anglo-American’ accounting. As anexample, German writers have seen the international stan-dard-setters as a Trojan horse which conceals Anglo-Amer-ican accounting (Kleekämper, 2000) or as ‘the unknownenemy from London’6 (Hennes & Metzger, 2010). Botzem
and Quack (2009) believe that the history of the Interna-
tional Accounting Standards Committee has been wrongly
reported as ‘an Anglo-American success story’ (p. 991). How-
ever, as will be shown, some classifiers deny the existence of
Anglo-American accounting.
Power (2009) warns researchers not to exaggerate theinternational differences (p. 325) and to be wary of resort-ing to cultural variables to explain them (p. 331). On thefirst point, Power notes that we can only talk of differentarrangements of balance sheets because all companiespresent balance sheets and show very similar things inthem. This paper reinforces those warnings by showingthat some findings about international differences areunreliable and that classification could be used to proveor disprove the importance of one commonly used culturalvariable: the legal system. Further, although classificationsdo identify countries which are different, their main pur-pose is to group together countries on the basis of theirsimilarities.
The paper proceeds as follows. The next section showshow classification in various fields can depend on who isdoing the classifying. Then we examine the degree towhich classification depends upon the characteristics cho-sen to measure the objects being classified, and upon thedefinition of the characteristics. After that, we perform ameta-analysis of previous accounting classifications, andwe analyze them in order to reveal the apparent effectson classifications of the classifiers and the potential effectsof various other factors, such as the countries/systems in-cluded and the characteristics chosen to represent them.The next four sections report on our empirical investiga-tions: the data, the findings on policy choice, the analysisof sensitivity of classification to the manipulation of vari-ous factors, and the presentation of some new classifica-tions. Then, there are conclusions.
Goldilocks and the forebears
This section examines the degree to which classificationis determined by who is classifying. Bloor (1982, p. 268)found new support for the claim of Durkheim and Mauss(1903) that the classification of things reproduces a patternof social arrangementsmorethan a pattern of the things. Heargued that even such renowned scientists as Newton andBoyle were affected by their religious and political idealsand ‘were arranging the fundamental laws and classifica-tions of their natural knowledge in a way that artfullyaligned them with their social goals’ (p. 290). The fields of
cosmology and anthropology are used as examples below.
Cosmology
Throughout most of recorded history, man7 saw himself
as the unique peak of creation (see below). He lived in a
world which was also in a class of its own, being fixed and
at the center of the universe. The Copernican revolution,
set in motion in 1543 by the publication of the book
commonly known as the ‘Revolutions’,8 spread slowly. For
5 As examples from Table 1, Nair and Frank (1980) has 228 citations and
Nobes (1983) has 390 (according to Google Scholar, accessed on 15.4.2013).6 ‘Der unbekannte Feind aus London’.
7 We use the term ‘man’ when discussing authors who did so (i.e. those
until the late twentieth century).8
De revolutionibus orbium coelestium (On the revolutions of the heavenlyspheres).
C. Nobes, C. Stadler / Accounting, Organizations and Society 38 (2013) 573–595 575

8/13/2019 1-s2.0-S0361368213000676-main
http://slidepdf.com/reader/full/1-s20-s0361368213000676-main 4/23
espousing it, Galileo was held under house arrest from 1633
to his death in 1642. Even in unorthodox Amsterdam, Joan
Blaeu’s ‘New and very accurate map of the whole world’ of
1662 still gave equal status to Ptolemy’s geocentric beliefs
and heliocentrism (Brotton, 2012, p. 288). However, enlight-
enment eventually reduced anthropocentrism: the earth is
now classified as a planet (i.e. something that moves) orbit-
ing a star which is rather far from the middle of one of many
galaxies. The planet is fairly small, but happens to be in the
Goldilocks zone: at the right distance from its star to be at a
congenial temperature for water-based life forms.
Anthropology
The ‘great chain of being’, derived from Aristotle andconventional for millennia, is a six-group classification9
(Lovejoy, 1964). Man is not classified as an animal at all
but as a special creation which is a little lower than the an-
gels. They had spirit only, animals had body only, but man
had both. Man saw himself as unique: not just sui generis
but hors de catégorie. In the eighteenth century, Linnaeustook homo sapiens down a rung by placing him in the animal
kingdom, though he remained sui generis. The descent of
man continued in the nineteenth century when Darwin out-
rageously suggested evolution from more ‘primitive’ prima-
tes, presumably without spirits; and other types of humans
joined his genus, such as homo neanderthalensis. In the twen-
tieth century, the genus got more crowded, for example with
the arrival of homo floresiensis. In the twenty-first century,
Wildman, Uddin, Liu, Grossman, and Goodman (2003) went
yet further by proposing10 that, since modern humans share
99.4% of non-synonymous DNA with chimpanzees, homo
sapiens is a parvenu member of their genus.
Classification and standards
The previous section showed how classification can de-pend on the mindsets of those doing the classifying, andhow classification can therefore change dramatically overtime without the objects changing. This section examinesthe degree to which classification depends upon the char-acteristics chosen to measure the objects being classified,and on the definition of the characteristics. Foucault(1970, p. 125) suggested that modernity in science beginswith privileging observation, starting with Roger Bacon.
Sight must replace reliance on ‘self-evident’ axioms. It alsoreplaces hearsay evidence about sightings, and it is givengreater weight than the less reliable senses of taste, smelland touch (p. 132). The invention of the telescope andthe microscope helped greatly. It is observation whichguided Copernicus and Galileo, and Linnaeus and Darwin.However, not even everything visible is relevant and reli-able: color is not (p. 133). When Linnaeus classified plants,he used only four observable features: the shape of elements, the quantity of the elements, their arrangementrelated to each other, and their relative magnitudes.
However, there was still much scope in deciding which ele-ments to observe, as will be explained below. In a bookwhose title could be translated11 as ‘To Think, to Classify’,
Perec (1985) discusses how books can be classified by, inter
alia, alphabetical order of author or title, country of author
or publication, color, date of publication or acquisition, lan-
guage, priority for reading, and so on (p. 39). The fields of
cosmology, chemistry, biology and medicine are now used
as examples.
Cosmology
Whether or not a celestial body is classed as a planetdepends, like any classification, on definitions (Gröjer,2001) or standards.12 The ‘standard’ for a planet was revised
by the International Astronomical Union in 2006 (IAU,
2006), with the result that Pluto (which had only become
a planet, as far as we were concerned, on its discovery in
1930) ceased to be one. The revision was caused by the dis-
covery of bodies larger than Pluto with orbits further from
the sun. The re-definition of a planet and the re-classifica-tion of Pluto has both scientific and cultural implications
(Basri & Brown, 2006), though not as large as those that
led to the arrest of Galileo for professing the planetary status
of the earth. An important implication for other classifica-
tions (e.g. in accounting) is that an object’s place in a classi-
fication can depend on the range of objects being classified.
Chemistry
Some alchemists had classified elements into solids,liquids and gases, but this is now seen to produce anunhelpful classification of such liquids as mercury, molten
lead and liquid nitrogen. So, chemists moved onto observ-ing various behaviors of elements (e.g. reaction to oxy-gen), leading to Mendeleev’s periodic table (Aldersley-Williams, 2011). This approach was later confirmed by amore fundamental one (called ‘natural’ in the next para-graph) when it became possible to count protons, neu-trons and electrons.
Biology
Linnaeus started his classifying with plants, perhaps be-cause their characteristics are more easily observable thansuch things as the structure of the inner ear of animals
(Foucault, 1970, p. 137). However, he chose to ignore dif-ferences in leaves, stems and roots, such that the ‘primaryarrangement of the vegetables13 is to be taken from the
9 God, angels, man, animals, plants and minerals.10
This proposal has not been generally accepted. For example, Steiper andYoung (2006, p.385) still treat homo and pan as different genera.
11 A translation of ‘Penser/Classer’ was published in 2009 by Godine Press
of Boston under the less literal title of ‘Thoughts of Sorts’.12 At first sight, the word ‘standard’ has a different meaning in financial
reporting from that used here. It appears to refer to a type of regulation.
Elsewhere in accounting, a ‘standard cost’ fits more obviously into the
normal scientific meaning. However, the documents issued by the Inter-
national Accounting Standards Board (IASB), for example, are not in
themselves requirements. The IASB is a private sector standard setter. A
regulator such as the European Union can choose to require certain
companies to comply with a standard.13
That is, plants; Linnaeus classified all things on earth as animal,vegetable or mineral.
576 C. Nobes, C. Stadler / Accounting, Organizations and Society 38 (2013) 573–595
8/13/2019 1-s2.0-S0361368213000676-main
http://slidepdf.com/reader/full/1-s20-s0361368213000676-main 5/23
fruit-body14 alone’ (Linnaeus, 1751, section 164). In other
words, his system was essentially arbitrary. Whereas the
features of living plants were easy to observe, plants lacked
a fossil record on which to base the evolutionary approach
that was adopted fairly early on for animal classification.
However, analysis of plant DNA has recently solved this
problem and led to a transformation of the botanical classi-
fication to something ‘natural’, i.e. related to the thing caus-
ing the variation (e.g. Duff & Nickrent, 1999).
Classification of animals has a long history. Socratesclassified man as a ‘featherless biped’, but his pupil Platowas mocked by Diogenes for repeating it. Ironically, biolo-gistsstillinclude humans and birdsin a super-class of tetra-poda.However,atamoredetailedlevel,humansarenotnowclassedwith birds butwith dogs anddolphins(whichosten-sibly have four feet and no feet, respectively). Lookingmoredeeply, one can observe five fingers not only on a humanhandbutalsoonadog’sfrontpawandinsideadolphin’sflip-per. Several other mammalian shared characteristics can beidentified, such as giving birth to live young.
As with plants, Linnaeus classified animals by observingshared characteristics, but the result again depends uponwhich characteristics are chosen. As a result, many of Lin-naeus’ animal classificationshave alsobeenoverturned.Clas-sification now rests on a search for homologs, which areshared characteristics inherited from a common ancestor,such as seen in thehand, pawand flipper. In effect, zoologicalclassificationis now entirely about descent. For this purpose,the analysis of DNA became a powerful tool as a supplementto,andsometimesas a contradiction of,thereceivedfossil re-cord(Stringer, 2011, chap. 1).Again, thezoological classifica-tion is now regarded as ‘natural’ (i.e. less arbitrary, beingbased on evolutionary relationships as evidencedby DNA).
However, a caveat should be entered. The biologists’classifications take no account of different possible pur-poses. For example, if the purpose were to help in planningthe habitats or menus for a new zoological park, it might bemore useful to classify a dolphin with a shark even thoughthe dolphin is much more closely related to a dog, a humanor even a pterodactyl.15
Diseases
Medicine is a practical activity, which relies heavily onthe International Classification of Diseases (ICD). This hasbeen in operation for a centurybut is revisedapproximatelyeverydecade(Bowker& Star,2000, p.136).TheICDisaprag-matic tool with a clear purpose: it helps doctors to identifydiseases and then to record information about patients.Whereas biologists nowclassify in a monothetic way, usingbinary characteristics (e.g. backbone or not), the ICD looksfor a numberof sharedcharacteristics(a polythetic system).Further, whereas chemical elements do not change,16 and
animal species change very slowly, diseases change rapidly.
Lastly, the ICD sometimes needs to be dramatically expanded.
It beganamong sixEuropean countries, buthad to be adjusted
when African and Asian diseases were included (Bowker &
Star, 2000, p. 151). Many of these features remind one of clas-
sifications of accounting systems:they are polythetic, the sys-
tems change rapidly, and the classifications started with
Europe and North America only.
What’s in a name?
A more alarmingpoint must also be made: no classifica-tions are ‘real’. As Buffon pointed out in 1749:
The more weincrease thenumber of divisions inthepro-duction of nature, the closer we shall approach to thetrue, since nothing really exists in nature except individ-uals,andsincegenera,ordersandclassesexistonlyinourimagination [as cited in Foucault, 1970, p. 146].
We noted earlier that the definition of a planet is a mat-ter of opinion. In biology, it is notable that neither Darwinnor any follower has set out a definition of ‘species’ whichhas gained general acceptance. Linnaeus thought that spe-cies were fixed in number, immutable in nature anddivinelycreated. Darwin showed that the first two points were er-rors, and drew a polite veil over the third. However, wecan now put another interpretation on the origin of species:they evolved in the brain of homo sapiens. The lack of defini-tions explains why there is debate about whether Neander-thals and modern humans are part of the same species(given that they have successfully interbred),17 and whether
humans are part of the chimpanzee genus. Buffon’s insight
has not yet been taken to its logical conclusion, but the com-
plete abandonment of the apparatus of species, genera, etc. is
being contemplated by biologists (Mishler, 2009, p. 65).
Nevertheless, it seems unlikely that biologists or anyother humans will be able to give up classifying: ‘to classifyis human’ (Bowker & Star, 2000, p. 1). Lévi-Strauss (1958)suggests that we inevitably perceive the world in termsof binary opposites, and he encourages a search for under-lying structures. For example, when discussing the contentof myths, Lévi-Strauss notes that ‘this apparent arbitrari-ness is belied by the astounding similarity between mythscollected from widely different regions’ (p. 208). Further-more, the fact that no classifications are real does not meanthat classification cannot be useful. For librarians or doc-tors, various competing classification systems could be al-most as useful as each other. For example, the DeweyDecimal system and the Library of Congress system bothwork satisfactorily in libraries. Linnaeus’ initial botanicalclassification was also of practical use in organizinginformation, even though it was arbitrary. However, someclassifications might be more useful than others. For exam-ple, Mendeleev’s classification in chemistry was muchmore useful than some earlier classifications because itidentified ‘missing’ elements and predicted what theywould be like.
14 That is, the reproductive system.15 The four types of animal in this sentence other than the shark are all in
the tetrapod clade.16 Elements cannot be changed by chemical reactions. They can be
changed by (and indeed were formed by) nuclear reactions. Thus, gold is
created from other elements such as base metals (ultimately from
hydrogen) and it could be used to create even heavier elements, but thisdoes not change the nature, definition or ‘standard’ of gold.
17
Modern humans, except for sub-Saharan Africans, contain traces of Neanderthal DNA; up to 4% in some cases (Green et al., 2010).
C. Nobes, C. Stadler / Accounting, Organizations and Society 38 (2013) 573–595 577

8/13/2019 1-s2.0-S0361368213000676-main
http://slidepdf.com/reader/full/1-s20-s0361368213000676-main 6/23
Accounting classifiers can learn from these fields. Onerelevant lesson from above is the need for detailed per-sonal observation. Another is that the purposes of a classi-fication should be considered. Further, classifiers should bedeliberate about the characteristics measured; Roberts(1995, p. 641) shows ‘the incoherence of taxonomieswhich rely upon appeals to objectivity’. We apply theselessons below, while analyzing past accountingclassifications.
Analysis of previous accounting classifications
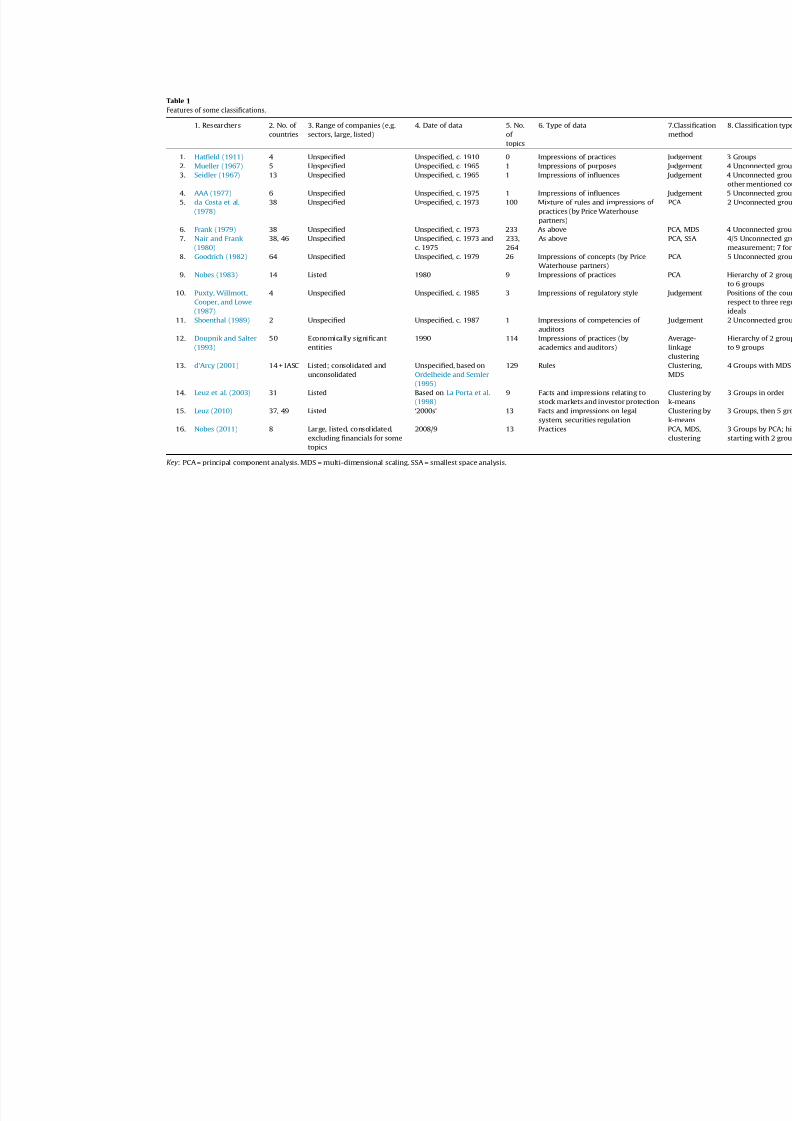
There have been many international classifications of accounting, as summarized in Table 1.18 Several (i.e. items
2, 3, 4, 10, 14 and 15 of Table 1) relate to influences on
accounting rather than to accounting itself. Roberts (1995)
calls the former ‘extrinsic’ and the latter ‘intrinsic’; or they
could be called deductive and inductive. This section first
performs a meta-analysis on these classifications and then
examines the apparent effects on classification of the classi-
fiers, and the potential effects of various other factors, suchas the countries/systems included and the characteristics
chosen to represent them.
A meta-analysis
Meta-analysis is a procedure which mathematicallyintegrates the results of previous independent studies. Itcan reduce the importance of unbiased errors in the dataor the procedures of particular individual studies. Meta-analysis is frequently used in medical research, in whichcontext Egger, Smith, and Phillips (1997) note that atten-tion must be paid to the selection and weighting of previ-
ous studies. For our meta-analysis of accountingclassifications, we include all the studies of Table 1 withequal weights, in the absence of any objective alternative.Our analysis covers the 15 countries which host theworld’s largest economies and which have been includedin previous classifications. The countries included arethose for which we collect IFRS data for our experimentsbelow (except China), plus the largest remaining countries:Brazil, India, Japan and the United States. Russia is ex-cluded because it was only found in two previous classifi-cations, and not in terms of published financial reporting.China is excluded because it was not in any of the formerclassifications. As will be explained in the next paragraph,
ours is not a traditional meta-analysis which combinesstudies by significance levels (see e.g. Christie, 1990), be-cause the results of classification studies are the groupingsof countries and not significance levels.
Table 2 shows the meta-analysis: the bottom-left trian-gle relates to all the classifications, the top-right triangle to
the intrinsic ones only. For each pair of countries, the figureshown is the percentage of the classifications which placedthat pair in the same group. The bracketed number showshow many classifications included the pair. For example,the bottom-left pairing of Japan and the US shows thatthose countries were together for 40% of the ten classifica-tions which included them both. Scores of 0% or 100% re-veal consensus among the classifications. The table alsoshows which percentages for country-pairs are signifi-cantly different from 50%, based on a test of proportion(two-sided). A significant result indicates a high degree of confidence that the relationship of the countries in the pair(either being or not being grouped together) is not arbi-trary. Although the various classifications consider differ-ent numbers of countries and result in different numbersof groups,19 our method of analyzing country-pairs allows
the combination of these different classifications into a
meta-analysis.
The meta-analysis can be summarized as showing twomain features. First, most of the percentages for the coun-try-pairs are not significantly different from 50%,20 which
suggests a high degree of arbitrariness in the classifications;
however, many relationships are not arbitrary. Similar con-
clusions can be drawn from observing that there are many
scores from 33% to 67%. For example, the results for Italy
in the bottom-left triangle reveal that there is little consen-
sus concerning which countries it should be classified with
(because there are no percentages above 50% which are sta-
tistically significant). On the other hand, there is strong con-
sensus that Italy should not be classified with ‘Anglo’
countries (see the six percentages below 50% which are sta-
tistically significant). Similar remarks apply to France, Spain
and Germany. Secondly, a British group can be identified,
which includes Australia and Hong Kong (see the UK column
and row in the bottom-left triangle). However, North Amer-
ica is not included in that group: the first column of Table 2
shows that only Canada has usually been classified with the
United States. The first row (intrinsic classifications only)
shows an even lower tendency for there to be an ‘Anglo-
American’ group.
Several caveats must be entered about this meta-analy-sis. First, it uses data (i.e. the classifications) spanning sev-eral decades, during which countries might have changedtheir relationships. This andother reasons might mean thatthe various results should not have been combined. Never-theless, to the extent that certain pairs of countries retaintheir relative positions over many decades (even survivinga move to IFRS) suggests that the classifications are picking
18 d’Arcy (2001) lists some further papers, which we exclude on the
grounds that they replicate or overlap previous papers (e.g. Mueller (1968)
overlaps Mueller (1967), Nair (1982) replicates Nair and Frank (1980), and
Salter and Doupnik (1992) overlaps Doupnik and Salter (1993)); or they are
about the style of rule-making (e.g. Daley and Mueller (1982, for which
d’Arcy references its 1989 re-printing) and AlNajjar (1986)); or their
purpose is not to present a classification (e.g. Previts (1975) provides
criteria, Gray (1988) builds a theory, and Cooke and Wallace (1990) test adeveloped/developing country hypothesis).
19 In two of the classifications (Nobes (1983) and Doupnik and Salter
(1993)), countries were first divided into two groups, and those were sub-
divided further. For the meta-analysis, we used the two-group classifica-
tions (see the footnote of Table 2), which stress similarities rather than
differences. Compared to using the multi-group classifications, this
increases the scores in Table 2 for several country-pairs.20 61% of the scores in the bottom-left triangle and 75% in the top-right
triangle (64 out of 105 country-pairs and 76 out of 101 country-pairs,
respectively; only 101 country-pairs are considered for the top-right
triangle because there are four cases where the country-pair is only
included in one classification but the test requires at least two observa-
tions). The main reason for the lower frequency of significant scores in the
top-right triangle is the reduced power of the tests due to considering fewerclassifications.
578 C. Nobes, C. Stadler / Accounting, Organizations and Society 38 (2013) 573–595
8/13/2019 1-s2.0-S0361368213000676-main
http://slidepdf.com/reader/full/1-s20-s0361368213000676-main 7/23
Table 1
Features of some classifications.
1. Researchers 2. No. of countries
3. Range of companies (e.g.sectors, large, listed)
4. Date of data 5. No.of
topics
6. Type of data 7.Cme
1. Hatfield (1911) 4 Unspecified Unspecified, c. 1910 0 Impressions of practices Jud2. Mueller (1967) 5 Unspecified Unspecified, c. 1965 1 Impressions of purposes Jud3. Seidler (1967) 13 Unspecified Unspecified, c. 1965 1 Impressions of influences Jud
4. AAA (1977) 6 Unspecified Unspecified, c. 1975 1 Impressions of influences Jud5. da Costa et al.
(1978)38 Unspecified Unspecified, c. 1973 100 Mixture of rules and impressions of
practices (by Price Waterhousepartners)
PCA
6. Frank (1979) 38 Unspecified Unspecified, c. 1973 233 As above PCA7. Nair and Frank
(1980)38, 46 Unspecified Unspecified, c. 1973 and
c. 1975233,264
As above PCA
8. Goodrich (1982) 64 Unspecified Unspecified, c. 1979 26 Impressions of concepts (by PriceWaterhouse partners)
PCA
9. Nobes (1983) 14 Listed 1980 9 Impressions of practices PCA
10. Puxty, Willmott,Cooper, and Lowe(1987)
4 Unspecified Unspecified, c. 1985 3 Impressions of regulatory style Jud
11. Shoenthal (1989) 2 Unspecified Unspecified, c. 1987 1 Impressions of competencies of auditors
Jud
12. Doupnik and Salter(1993)
50 Economically significantentities
1990 114 Impressions of practices (byacademics and auditors)
Avelinkclu
13. d’Arcy (2001) 14 + IASC Listed; consolidated andunconsolidated
Unspecified, based onOrdelheide and Semler(1995)
129 Rules CluMD
14. Leuz et al. (2003) 31 Listed Based on La Porta et al.(1998)
9 Facts and impressions relating tostock markets and investor protection
Cluk-m
15. Leuz (2010) 37, 49 Listed ‘2000s’ 13 Facts and impressions on legalsystem, securities regulation
Cluk-m
16. Nobes (2011) 8 Large, listed, consolidated,excluding financials for sometopics
2008/9 13 Practices PCAclu
Key: PCA = principal component analysis. MDS = multi-dimensional scaling. SSA = smallest space analysis.

8/13/2019 1-s2.0-S0361368213000676-main
http://slidepdf.com/reader/full/1-s20-s0361368213000676-main 8/23
8/13/2019 1-s2.0-S0361368213000676-main
http://slidepdf.com/reader/full/1-s20-s0361368213000676-main 9/23
up something fundamental. However, whether the insightsfrom this analysis can be relied upon at all depends greatlyon whether there are biased errors in the data or the meth-ods used by the previous classifiers. This is a central issueof this paper, so we return to the worth of Table 2 after wehave examined that issue.
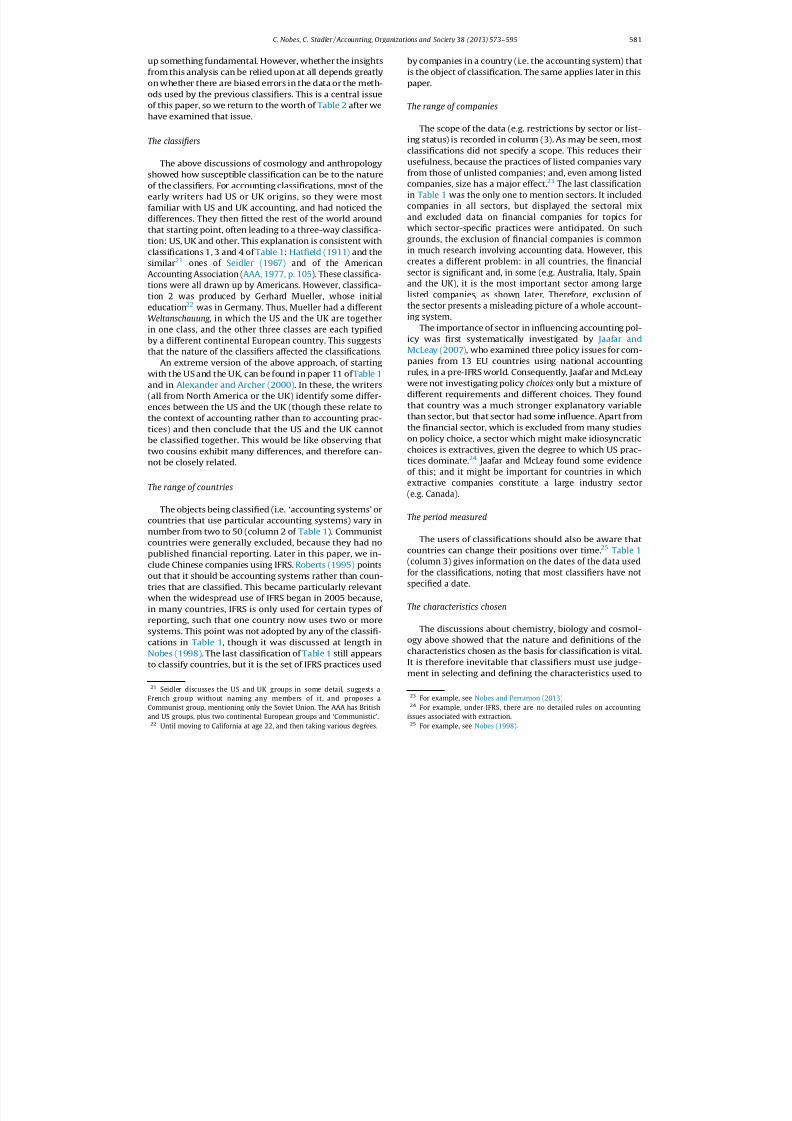
The classifiers
The above discussions of cosmology and anthropologyshowed how susceptible classification can be to the natureof the classifiers. For accounting classifications, most of theearly writers had US or UK origins, so they were mostfamiliar with US and UK accounting, and had noticed thedifferences. They then fitted the rest of the world aroundthat starting point, often leading to a three-way classifica-tion: US, UK and other. This explanation is consistent withclassifications 1, 3 and 4 of Table 1: Hatfield (1911) and thesimilar21 ones of Seidler (1967) and of the American
Accounting Association (AAA, 1977, p. 105). These classifica-
tions were all drawn up by Americans. However, classifica-tion 2 was produced by Gerhard Mueller, whose initial
education22 was in Germany. Thus, Mueller had a different
Weltanschauung , in which the US and the UK are together
in one class, and the other three classes are each typified
by a different continental European country. This suggests
that the nature of the classifiers affected the classifications.
An extreme version of the above approach, of startingwith the US and the UK, can be found in paper 11 of Table 1and in Alexander and Archer (2000). In these, the writers(all from North America or the UK) identify some differ-ences between the US and the UK (though these relate tothe context of accounting rather than to accounting prac-
tices) and then conclude that the US and the UK cannotbe classified together. This would be like observing thattwo cousins exhibit many differences, and therefore can-not be closely related.
The range of countries
The objects being classified (i.e. ‘accounting systems’ orcountries that use particular accounting systems) vary innumber from two to 50 (column 2 of Table 1). Communistcountries were generally excluded, because they had nopublished financial reporting. Later in this paper, we in-clude Chinese companies using IFRS. Roberts (1995) points
out that it should be accounting systems rather than coun-tries that are classified. This became particularly relevantwhen the widespread use of IFRS began in 2005 because,in many countries, IFRS is only used for certain types of reporting, such that one country now uses two or moresystems. This point was not adopted by any of the classifi-cations in Table 1, though it was discussed at length inNobes (1998). The last classification of Table 1 still appearsto classify countries, but it is the set of IFRS practices used
by companies in a country (i.e. the accounting system) thatis the object of classification. The same applies later in thispaper.
The range of companies
The scope of the data (e.g. restrictions by sector or list-
ing status) is recorded in column (3). As may be seen, mostclassifications did not specify a scope. This reduces theirusefulness, because the practices of listed companies varyfrom those of unlisted companies; and, even among listedcompanies, size has a major effect.23 The last classification
in Table 1 was the only one to mention sectors. It included
companies in all sectors, but displayed the sectoral mix
and excluded data on financial companies for topics for
which sector-specific practices were anticipated. On such
grounds, the exclusion of financial companies is common
in much research involving accounting data. However, this
creates a different problem: in all countries, the financial
sector is significant and, in some (e.g. Australia, Italy, Spain
and the UK), it is the most important sector among largelisted companies, as shown later. Therefore, exclusion of
the sector presents a misleading picture of a whole account-
ing system.
The importance of sector in influencing accounting pol-icy was first systematically investigated by Jaafar andMcLeay (2007), who examined three policy issues for com-panies from 13 EU countries using national accountingrules, in a pre-IFRS world. Consequently, Jaafar and McLeaywere not investigating policy choices only but a mixture of different requirements and different choices. They foundthat country was a much stronger explanatory variablethan sector, but that sector had some influence. Apart from
the financial sector, which is excluded from many studieson policy choice, a sector which might make idiosyncraticchoices is extractives, given the degree to which US prac-tices dominate.24 Jaafar and McLeay found some evidence
of this; and it might be important for countries in which
extractive companies constitute a large industry sector
(e.g. Canada).
The period measured
The users of classifications should also be aware thatcountries can change their positions over time.25 Table 1
(column 3) gives information on the dates of the data used
for the classifications, noting that most classifiers have notspecified a date.
The characteristics chosen
The discussions about chemistry, biology and cosmol-ogy above showed that the nature and definitions of thecharacteristics chosen as the basis for classification is vital.It is therefore inevitable that classifiers must use judge-ment in selecting and defining the characteristics used to
21 Seidler discusses the US and UK groups in some detail, suggests a
French group without naming any members of it, and proposes a
Communist group, mentioning only the Soviet Union. The AAA has British
and US groups, plus two continental European groups and ‘Communistic’.22 Until moving to California at age 22, and then taking various degrees.
23 For example, see Nobes and Perramon (2013).24 For example, under IFRS, there are no detailed rules on accounting
issues associated with extraction.25 For example, see Nobes (1998).
C. Nobes, C. Stadler / Accounting, Organizations and Society 38 (2013) 573–595 581
8/13/2019 1-s2.0-S0361368213000676-main
http://slidepdf.com/reader/full/1-s20-s0361368213000676-main 10/23
represent the objects to be classified. We now examine thisaspect for the ‘intrinsic’ classifications of Table 1, i.e. thosethat classify countries by their accounting rules/practicesrather than by influences on the accounting.
The number of specified characteristics per system/country (column 5 of Table 1) varies from zero to 264.Classifications 5 to 8 were all26 based on the surveys of Price
Waterhouse (PW) (1973, 1976, 1979) which had begun as a
list of detailed differences between US and UK accounting.
They therefore did not ask (about a country) such important
questionsas: (i) aredepreciation expenses determined by taxrules? or (ii) is deferred tax accounted for? They asked in-
stead such peripheral questions as whether or not self-insur-
ance provisions were maintained in an internal account by
systematic charges to income (PW, 1973, Question 124),
which was known to be a topic of US/UK difference.
Not surprisingly, the PW data showed that the US andthe UK were the most different27 of any pairing of the 36
countries examined for 1973. Consequently, by using these
data, da Costa, Bourgeois and Lawson (1978) found again
that the world had three types of country: US-led (contain-
ing most of continental Europe), UK-led, and unclassifiable
(i.e. Canada and the Netherlands). Frank (1979) and Nair
and Frank (1980) identified four groups from the same data,two of which were those dominated by the US and UK,
respectively. Goodrich (1982) used the 1979 PW data and
identified five groups, two of which were headed by the
US and the UK, though there is another headed by Jersey
which (remarkably) also contains Guatemala, Germany,
Italy, the Netherlands and Zaire.
Doupnik and Salter (1993) started with PW’s list of characteristics but report an attempt to eliminate those
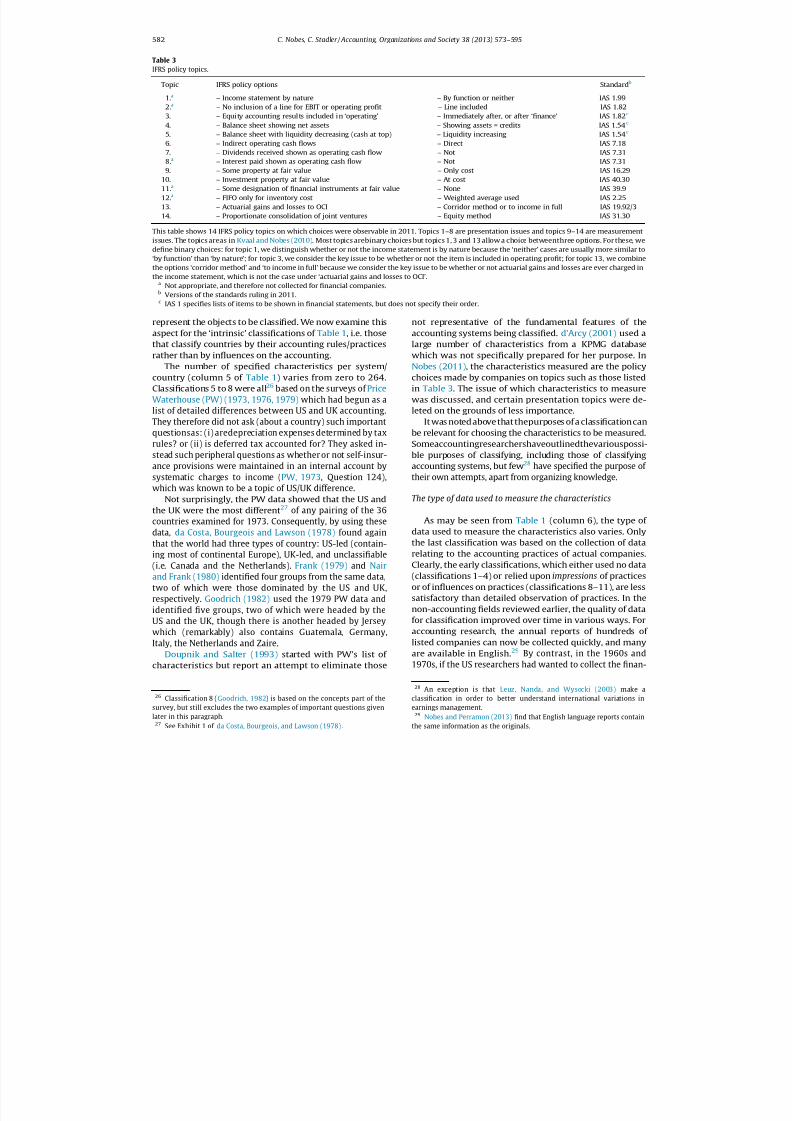
not representative of the fundamental features of theaccounting systems being classified. d’Arcy (2001) used alarge number of characteristics from a KPMG databasewhich was not specifically prepared for her purpose. InNobes (2011), the characteristics measured are the policychoices made by companies on topics such as those listedin Table 3. The issue of which characteristics to measurewas discussed, and certain presentation topics were de-leted on the grounds of less importance.
It was notedabovethatthepurposes ofa classificationcan
be relevant for choosing the characteristics to be measured.Someaccountingresearchershaveoutlinedthevariouspossi-ble purposes of classifying, including those of classifyingaccounting systems, but few28 have specified the purpose of
their own attempts, apart from organizing knowledge.
The type of data used to measure the characteristics
As may be seen from Table 1 (column 6), the type of data used to measure the characteristics also varies. Onlythe last classification was based on the collection of datarelating to the accounting practices of actual companies.Clearly, the early classifications, which either used no data
(classifications 1–4) or relied upon impressions of practicesor of influences on practices (classifications 8–11), are lesssatisfactory than detailed observation of practices. In thenon-accounting fields reviewed earlier, the quality of datafor classification improved over time in various ways. Foraccounting research, the annual reports of hundreds of listed companies can now be collected quickly, and manyare available in English.29 By contrast, in the 1960s and
1970s, if the US researchers had wanted to collect the finan-
Table 3
IFRS policy topics.
Topic IFRS policy options Standardb
1.a – Income statement by nature – By function or neither IAS 1.992.a – No inclusion of a line for EBIT or operating profit – Line included IAS 1.823. – Equity accounting results included in ‘operating’ – Immediately after, or after ‘finance’ IAS 1.82c
4. – Balance sheet showing net assets – Showing assets = credits IAS 1.54c
5. – Balance sheet with liquidity decreasing (cash at top) – Liquidity increasing IAS 1.54c
6. – Indirect operating cash flows – Direct IAS 7.187. – Dividends received shown as operating cash flow – Not IAS 7.318.a – Interest paid shown as operating cash flow – Not IAS 7.319. – Some property at fair value – Only cost IAS 16.29
10. – Investment property at fair value – At cost IAS 40.3011.a – Some designation of financial instruments at fair value – None IAS 39.912.a – FIFO only for inventory cost – Weighted average used IAS 2.2513. – Actuarial gains and losses to OCI – Corridor method or to income in full IAS 19.92/314. – Proportionate consolidation of joint ventures – Equity method IAS 31.30
This table shows 14 IFRS policy topics on which choices were observable in 2011. Topics 1–8 are presentation issues and topics 9–14 are measurementissues. The topics areas in Kvaal and Nobes (2010). Most topics arebinary choices but topics 1, 3 and 13 allow a choice betweenthree options. For these, wedefine binary choices: for topic 1, we distinguish whether or not the income statement is by nature because the ‘neither’ cases are usually more similar to‘by function’ than ‘by nature’; for topic 3, we consider the key issue to be whether or not the item is included in operating profit; for topic 13, we combinethe options ‘corridor method’ and ‘to income in full’ because we consider the key issue to be whether or not actuarial gains and losses are ever charged inthe income statement, which is not the case under ‘actuarial gains and losses to OCI’.
a
Not appropriate, and therefore not collected for financial companies.b Versions of the standards ruling in 2011.c IAS 1 specifies lists of items to be shown in financial statements, but does not specify their order.
26 Classification 8 (Goodrich, 1982) is based on the concepts part of the
survey, but still excludes the two examples of important questions given
later in this paragraph.27 See Exhibit 1 of da Costa, Bourgeois, and Lawson (1978).
28 An exception is that Leuz, Nanda, and Wysocki (2003) make a
classification in order to better understand international variations in
earnings management.29
Nobes and Perramon (2013) find that English language reports containthe same information as the originals.
582 C. Nobes, C. Stadler / Accounting, Organizations and Society 38 (2013) 573–595
8/13/2019 1-s2.0-S0361368213000676-main
http://slidepdf.com/reader/full/1-s20-s0361368213000676-main 11/23
cial statements of all the members of the main French stock
market index (for example), that would have proved very
difficult, and many of the reports would not have been in
English. This might be what held back researchers from de-
tailed observation, but a more likely explanation is that
accounting researchers were not yet accustomed to an
empirical approach (Watts & Zimmerman, 1979).
Data which mix rules and impressions of practices(classifications 5–7 and 12) are incoherent. The usefulnessof data relating to rules alone (e.g. classification 13) canalso be questioned. For example, IFRS (IAS 38, para. 72) al-lows certain intangible assets to be measured at fair valuerather than on a cost basis, whereas German and US GAAPsrequire a cost basis. However, this difference in rules is of doubtful significance if no IFRS companies choose fair va-lue to measure intangibles, which is the case in the sampleof German and UK companies of Christensen and Nikolaev(2013). It is surely more significant, for example, that themajority of IFRS-using UK companies choose fair valuefor investment properties whereas it is very rare for IFRS-using German companies to do so,30 even though all the
companies from both countries are using identical rules.
The quality of data
Anyof themethods of measuringthecharacteristicscho-sen for classification caninvolve error. The PWdataused forclassifications 5 to 7 of Table 1 certainly containerrors. Sim-ple examples31 are that the UK is scored as not allowing
weighted average cost for inventory valuation which was
not (and never has been) the case; and that, on several topics,
the UK has different scores from Ireland, even though they
shared the same accounting rules. The data based on KPMG
information (used for classification 13) also produces errone-ous scores. For example,32 the KPMG topics related to ‘provi-
sions’ were interpreted for most countries as referring to
provisions as defined in IAS37 (i.e. liabilities of uncertaintim-
ing or amount), but the scoring for Australia was based on the
rules foritemssuch as ‘bad debt provisions’ (i.e. impairments,
in current IFRS terminology). The last classification (Nobes,
2011), in common with most others, did not provide specific
information about how the data were collected and coded.
This makes it difficult to replicate the studies.
The techniques of classification
Table 1 (column 7) also shows the techniques used forclassification. These range from qualitative assessmentsto several different statistical methods. The resulting clas-sifications range (see column 8) from apparently unrelatedgroups of countries to hierarchies (family trees or dendro-grams) of related countries. Roberts (1995, p. 649) warnsagainst pushing the evolutionary analogies of the familytrees too far, and points out that dendrograms can summa-rize similarities and differences without invoking evolu-tion. Following from this, Roberts (1995, p. 656) also
criticizes the use of the term ‘species’ in an accountingclassification, as in Nobes (1983). We use ‘system’ for aset of objects with important characteristics in common,although the apparently scientific word ‘species’ mightnot be entirely out of place, given the discussion aboveabout the vagueness of the term in biology.
Roberts (p. 652) convincingly suggests that analogieswith the classification of languages might be more appro-priate, given that languages both converge (they interbreed)and diverge, whereas species only diverge. Even so, as dis-cussed earlier, the Linnaean system did not begin as evolu-tionary but was based on assessing shared characteristics.When evolution was added in (greatly aided later by theanalysis of DNA), the broad outline of the animal classifica-tion survived although many details were revised. The samemight apply to the hierarchical accounting classifications.That is, although they were prepared by assessing commoncharacteristics, the inclusion of evolution might not upsetthe results. For example, the common ancestor of UK andUS accounting could perhaps be traced to nineteenth cen-tury UK practice. By contrast, the common ancestor of French and UK accounting lies much further in the past, per-haps in the middle of the 16th century.33
The statistical methods of classification employed inour subsequent empirical analyses are outlined in Appen-dix A. In principle, they are sensitive to which countriesare included. For example, a clustering program starts byfinding the two nearest countries, showing them togetherand then treating the average of them as a ‘country’ forthe next stage of clustering. So, exclusion of one countrycan affect the ‘seeding’ of the first cluster, which can thenaffect the position of many other countries.
Summary of factors affecting classification
In sum, early accounting classifications seem tohave been affected by the national backgrounds of theclassifiers or of the data gatherers. We have suggested,above, ways in which classification has also been affectedby the data used. First, the choice of which characteristicsto measure has a profound effect on the results. Once cho-sen, the way of measuring the characteristics has var-ied: several classifiers apparently used no data, someused incoherent data (mixtures of rules and impressionsof practices); and others used data which are arguably of limited practical relevance (differences in rules).Many classifiers did not specify the scope of the objects
being classified (e.g. large or listed companies) or the date.However, some classifiers have entered caveats. Frank
(1979, p. 596) notes that the topics included in his PW datavary in importance. Frank does not make a selection orcomment on the mixture of rules and impressions of practices in the data, but warns that the coding schemewhich turns that mixture into data for classification mightintroduce errors. Nair and Frank (1980) note that the clas-
30 In the companies comprising the main German and UK stock market
indices (Kvaal & Nobes, 2010).31
Several examples are given in Nobes (1981).32 These examples are discussed in Nobes (2004).
33 The earliest double-entry bookkeeping records in France and England
date from 1299 and 1305, respectively. However, both were isolated
examples kept by Italian firms of merchants in versions of Italian. Domestic
practice might instead be traced to translations of Pacioli’s tractatus on
bookkeeping, which were produced in France and England in the middle of the 16th century (Coomber, 1956; Yamey, 1997).
C. Nobes, C. Stadler / Accounting, Organizations and Society 38 (2013) 573–595 583
8/13/2019 1-s2.0-S0361368213000676-main
http://slidepdf.com/reader/full/1-s20-s0361368213000676-main 12/23
sifications differ if based on presentation topics rather thanon measurement topics. d’Arcy (2001, p. 333) points outthat different topics would lead to different classifications,and notes the inherent problem of using data on rules in-stead of practices. Nobes (2011) mentions the need for judgement in identifying important characteristics, and ex-cludes some characteristics on these grounds.
We can now return to the meta-analysis of Table 2. Wehave noted above that the early classifiers might have beenparticularly aware of US and UK differences, and that manysubsequent classifications were based on PW data whichhadbeen originally designed to reveal such differences.Thiscouldexplainwhy no ‘Anglo-American’ groupwasgenerallyfound.
The lessons of this section for accounting researchersare that (i) a classification should be based on detailedobservation of characteristics, (ii) the characteristics cho-sen should ideally be informed by the purpose of the clas-sification, and at least be deliberately chosen and overt,(iii) related to this, any claims of objectivity are incoherent,(iv) accounting practices are a better representation of an‘accounting system’ than rules are, and (v) the set of com-panies included in the accounting ‘system’ and the periodof the data should be specified. It is further clear from thissurvey that the effect of inclusions or exclusions of coun-tries, sectors (especially financial and extractive) and char-acteristics needs to be empirically investigated in order tosee whether classification is robust to manipulation of these issues or whether it is instead essentially arbitrary.We now proceed with that.
Data
Our sample34 includes companies from the world’slargest economies which use IFRS, as follows: (i) the
countries with the six largest stock markets where IFRS
was required from 2005 (i.e. Australia, France, Germany,
Italy, Spain and the UK), (ii) the two other countries with
large stock markets with a longer history of IFRS usage:
South Africa and Switzerland, (iii) Canada and South Kor-
ea, where IFRS has been recently adopted, and (iv) Hong
Kong and companies from China which use IFRS.35 In or-
der to include Canada and South Korea, we use financial
statements from 2011 onwards. In particular, we use
company reports for years ended 31 December 2011 (or
latest before) for 12 countries.36 Our sample includes
the largest37 listed companies in each of these jurisdic-
tions, which comprise 65%38 of the total market capitali-
zation of these countries. Companies with foreign
influence or which are subsidiaries are excluded. In total,
we examine the IFRS practices of 514 companies. Details
of the sample are provided in Appendix B.
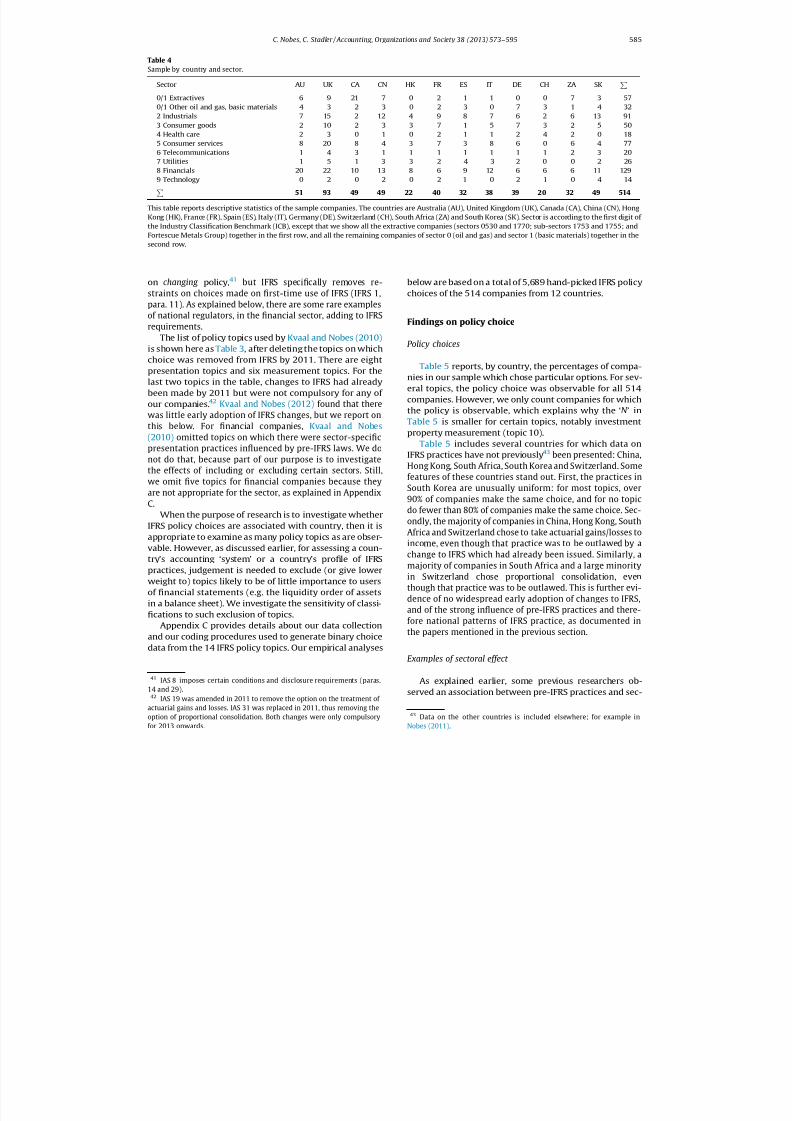
Table 4 shows the sample by country and sector. As ex-plained, we wish to investigate whether exclusion of cer-tain sectors might affect classification. Prior literatureindicates that the financial and extractive sectors have idi-osyncratic policies.39 Given the topic of this paper, we
should admit that the classification of companies by sector
exhibits the difficulties typical of classification. There are
several accepted versions. We have chosen the ‘Industry
Classification Benchmark’ (ICB) of the index company FTSE.
The corresponding data are from Worldscope (data code
WC07040). Consistently with our recommended approach,
we have used judgement to adjust it for our purposes, in
particular to calculate country totals for extractive
companies.40
We concluded above that practices are the bestrepresentation of an accounting system. We record theIFRS practices of companies and use them as the character-istics to be measured in order to classify a country. Even forcompanies which are fully complying with IFRS, there isconsiderable scope for varied practice because, forexample: (i) the recognition of expenses (e.g. impairments)or assets (e.g. development projects) relies on the exerciseof judgement against somewhat vague criteria, (ii) themeasurement of liabilities (e.g. provisions) or assets (e.g.the fair value of investment properties) involves estima-tion, and (iii) many standards offer choices to companies.The first two of these are hard to assess (although, see anattempt by Wehrfritz, Haller, & Walton, 2012), but dataon the third can be hand-picked from the annual reportsof companies. These data provide a good indication of theinfluence of factors such as country and sector becausethe differences in practices are caused by managementchoices and not by regulations. There is some constraint
34 Our results show that the inclusion or exclusion of particular countries
generally does not affect how the remaining countries are classified.35 Although China has not fully adopted IFRS, the majority of the largest
listed Chinese companies prepares IFRS financial statements, because they
are listed on the Hong Kong Stock Exchange (HKEx), which required IFRS
from 2005. Consequently, Chinese companies with a listing in Hong Kong
and Mainland China prepared two sets of financial statements (IFRS and
Chinese GAAP). However, from 2010, HKEx accepts Chinese GAAP financial
statements, and six companies in our sample have stopped preparing IFRS
financial statements.36 The one exception to this is that we include the first available IFRS
financial statements for ten Canadian and four South Korean companies
which have year-ends other than 31 December 2011. This enables the
inclusion of six Canadian and four South Korean financial companies; in
particular, our Canadian sample would otherwise not include any bankbecause all Canadian banks in our sample have 31 October year-ends.
37 Findings of country influence would probably be even stronger for
smaller companies because of less international influence (Nobes &
Perramon, 2013).38 According to Worldscope data for 2011 (Worldscope code: WC07210).39 Christensen and Nikolaev (2013) show that real-estate firms (which are
part of the financial sector) choose to use fair value for investment property
more frequently than other firms. Jaafar and McLeay (2007, p. 180) refer to
special practices in the extractive industries.40 We define extractive companies as those in sector 0530 (oil and gas
producers), sector 1770 (mining), sub-sector 1753 (aluminum) and sub-
sector 1755 (non-ferrous metals); additionally, we classify Fortescue
Metals Group of sub-sector 1757 (iron and steel) as an extractive company.
We believe that using ICB codes results in a better industry classification
than using primary SIC codes (Worldscope data code WC07021). If using
SIC codes, we would identify extractive companies as ‘mining’ (SIC codes
starting with the digits 10, 12, 13 or 14) and financial companies as
‘finance, insurance and real estate’ (SIC codes starting with the digit 6).
Using ICB codes, we classify 57 (129) companies as extractive (financial),
and using SIC codes we would have classified 79% (94%) in the same way.
The main difference is that many integrated oil and gas companies (e.g. BP)
are not classified as extractive but as ‘manufacturing’ using SIC codes due to
their petroleum refining businesses. Additionally, the classification of some
companies using SIC codes is unsuitable for our purposes: e.g. China Oilfield
Services is classified as an extractive company even though it does noextraction.
584 C. Nobes, C. Stadler / Accounting, Organizations and Society 38 (2013) 573–595
8/13/2019 1-s2.0-S0361368213000676-main
http://slidepdf.com/reader/full/1-s20-s0361368213000676-main 13/23
on changing policy,41 but IFRS specifically removes re-
straints on choices made on first-time use of IFRS (IFRS 1,
para. 11). As explained below, there are some rare examples
of national regulators, in the financial sector, adding to IFRS
requirements.
The list of policy topics used by Kvaal and Nobes (2010)is shown here as Table 3, after deleting the topics on whichchoice was removed from IFRS by 2011. There are eightpresentation topics and six measurement topics. For thelast two topics in the table, changes to IFRS had alreadybeen made by 2011 but were not compulsory for any of our companies.42 Kvaal and Nobes (2012) found that there
was little early adoption of IFRS changes, but we report on
this below. For financial companies, Kvaal and Nobes
(2010) omitted topics on which there were sector-specific
presentation practices influenced by pre-IFRS laws. We do
not do that, because part of our purpose is to investigate
the effects of including or excluding certain sectors. Still,
we omit five topics for financial companies because they
are not appropriate for the sector, as explained in Appendix
C.
When the purpose of research is to investigate whetherIFRS policy choices are associated with country, then it isappropriate to examine as many policy topics as are obser-vable. However, as discussed earlier, for assessing a coun-try’s accounting ‘system’ or a country’s profile of IFRSpractices, judgement is needed to exclude (or give lowerweight to) topics likely to be of little importance to usersof financial statements (e.g. the liquidity order of assetsin a balance sheet). We investigate the sensitivity of classi-fications to such exclusion of topics.
Appendix C provides details about our data collectionand our coding procedures used to generate binary choicedata from the 14 IFRS policy topics. Our empirical analyses
below are based on a total of 5,689 hand-picked IFRS policychoices of the 514 companies from 12 countries.
Findings on policy choice
Policy choices
Table 5 reports, by country, the percentages of compa-nies in our sample which chose particular options. For sev-eral topics, the policy choice was observable for all 514companies. However, we only count companies for whichthe policy is observable, which explains why the ‘N ’ inTable 5 is smaller for certain topics, notably investment
property measurement (topic 10).Table 5 includes several countries for which data on
IFRS practices have not previously43 been presented: China,
Hong Kong, South Africa, South Korea and Switzerland. Some
features of these countries stand out. First, the practices in
South Korea are unusually uniform: for most topics, over
90% of companies make the same choice, and for no topic
do fewer than 80% of companies make the same choice. Sec-
ondly, the majority of companies in China, Hong Kong, South
Africa and Switzerland chose to take actuarial gains/losses to
income, even though that practice was to be outlawed by a
change to IFRS which had already been issued. Similarly, a
majority of companies in South Africa and a large minority
in Switzerland chose proportional consolidation, eventhough that practice was to be outlawed. This is further evi-
dence of no widespread early adoption of changes to IFRS,
and of the strong influence of pre-IFRS practices and there-
fore national patterns of IFRS practice, as documented in
the papers mentioned in the previous section.
Examples of sectoral effect
As explained earlier, some previous researchers ob-served an association between pre-IFRS practices and sec-
Table 4
Sample by country and sector.
Sector AU UK CA CN HK FR ES IT DE CH ZA SK P
0/1 Extractives 6 9 21 7 0 2 1 1 0 0 7 3 570/1 Other oil and gas, basic materials 4 3 2 3 0 2 3 0 7 3 1 4 322 Industrials 7 15 2 12 4 9 8 7 6 2 6 13 913 Consumer goods 2 10 2 3 3 7 1 5 7 3 2 5 504 Health care 2 3 0 1 0 2 1 1 2 4 2 0 18
5 Consumer services 8 20 8 4 3 7 3 8 6 0 6 4 776 Telecommunications 1 4 3 1 1 1 1 1 1 1 2 3 207 Utilities 1 5 1 3 3 2 4 3 2 0 0 2 268 Financials 20 22 10 13 8 6 9 12 6 6 6 11 1299 Technology 0 2 0 2 0 2 1 0 2 1 0 4 14P
51 93 49 49 22 40 32 38 39 20 32 49 514
This table reports descriptive statistics of the sample companies. The countries are Australia (AU), United Kingdom (UK), Canada (CA), China (CN), HongKong (HK), France (FR), Spain (ES), Italy (IT), Germany (DE), Switzerland (CH), South Africa (ZA) and South Korea (SK). Sector is according to the first digit of the Industry Classification Benchmark (ICB), except that we show all the extractive companies (sectors 0530 and 1770; sub-sectors 1753 and 1755; andFortescue Metals Group) together in the first row, and all the remaining companies of sector 0 (oil and gas) and sector 1 (basic materials) together in thesecond row.
41 IAS 8 imposes certain conditions and disclosure requirements (paras.
14 and 29).42 IAS 19 was amended in 2011 to remove the option on the treatment of
actuarial gains and losses. IAS 31 was replaced in 2011, thus removing the
option of proportional consolidation. Both changes were only compulsoryfor 2013 onwards.
43
Data on the other countries is included elsewhere; for example inNobes (2011).
C. Nobes, C. Stadler / Accounting, Organizations and Society 38 (2013) 573–595 585
8/13/2019 1-s2.0-S0361368213000676-main
http://slidepdf.com/reader/full/1-s20-s0361368213000676-main 14/23
tor. In some cases, this was driven by sectors having differ-ent accounting rules.44 By contrast, apart from a few iso-
lated examples of additional jurisdiction-based rules,45
there are no sector-specific accounting requirements in IFRS.
Even so, significant differences in IFRS choices between sec-
tors are evident when we split our entire sample into three
sectors: financial, extractive and other. Table 6 shows partic-
ularly clear examples from our data. More importantly for
this paper, there are also significant differences between
the sectors within countries. As may be seen, compared to
other companies in their countries, Australian financial com-
panies prefer fair value for investment properties, Canadian
financial companies prefer not to recognize actuarial gains/losses as OCI (they prefer the corridor method), Canadian
extractive companies prefer to proportionally consolidate
joint ventures, and British financial companies are less likely
to show net assets but more likely to start the balance sheet
with cash. In all these cases, av2 test of independence shows
that a null hypothesis of no association with sector can be
rejected at the 1% level. These are examples of how a coun-
try’s sectoral mix might affect its mean scores on topics,
which might then affect classification, as examined in the
next section.
Sensitivity of classifications
Introduction
We have suggested above how the accounting classifi-cations, particularly the early ones, appear to have beensensitive to the nature of the classifiers. In this section,we empirically investigate how sensitive classificationscan be to various aspects of the data used.
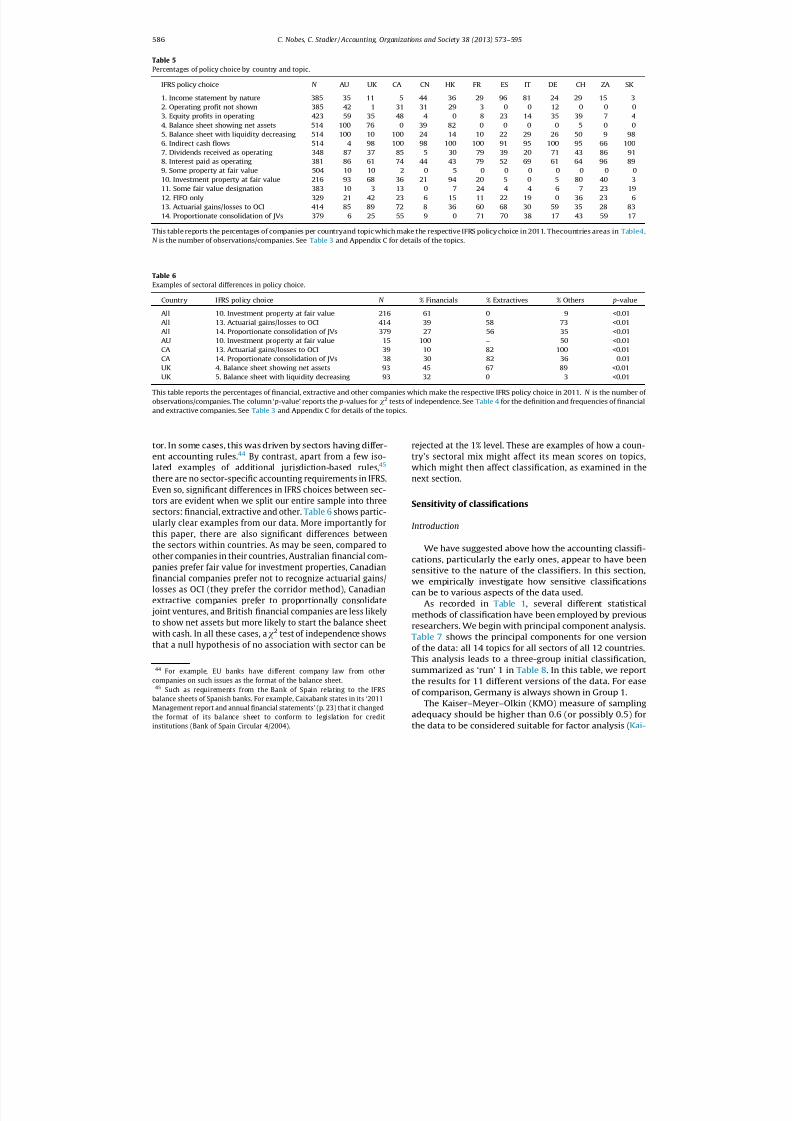
As recorded in Table 1, several different statisticalmethods of classification have been employed by previousresearchers. We begin with principal component analysis.Table 7 shows the principal components for one versionof the data: all 14 topics for all sectors of all 12 countries.This analysis leads to a three-group initial classification,summarized as ‘run’ 1 in Table 8. In this table, we reportthe results for 11 different versions of the data. For easeof comparison, Germany is always shown in Group 1.
The Kaiser–Meyer–Olkin (KMO) measure of samplingadequacy should be higher than 0.6 (or possibly 0.5) forthe data to be considered suitable for factor analysis (Kai-
Table 5
Percentages of policy choice by country and topic.
IFRS policy choice N AU UK CA CN HK FR ES IT DE CH ZA SK
1. Income statement by nature 385 35 11 5 44 36 29 96 81 24 29 15 32. Operating profit not shown 385 42 1 31 31 29 3 0 0 12 0 0 03. Equity profits in operating 423 59 35 48 4 0 8 23 14 35 39 7 44. Balance sheet showing net assets 514 100 76 0 39 82 0 0 0 0 5 0 05. Balance sheet with liquidity decreasing 514 100 10 100 24 14 10 22 29 26 50 9 98
6. Indirect cash flows 514 4 98 100 98 100 100 91 95 100 95 66 1007. Dividends received as operating 348 87 37 85 5 30 79 39 20 71 43 86 918. Interest paid as operating 381 86 61 74 44 43 79 52 69 61 64 96 899. Some property at fair value 504 10 10 2 0 5 0 0 0 0 0 0 010. Investment property at fair value 216 93 68 36 21 94 20 5 0 5 80 40 311. Some fair value designation 383 10 3 13 0 7 24 4 4 6 7 23 1912. FIFO only 329 21 42 23 6 15 11 22 19 0 36 23 613. Actuarial gains/losses to OCI 414 85 89 72 8 36 60 68 30 59 35 28 8314. Proportionate consolidation of JVs 379 6 25 55 9 0 71 70 38 17 43 59 17
This table reports the percentages of companies per countryand topic which make the respective IFRS policy choice in 2011. Thecountries areas in Table4.N is the number of observations/companies. See Table 3 and Appendix C for details of the topics.
Table 6
Examples of sectoral differences in policy choice.
Country IFRS policy choice N % Financials % Extractives % Others p-value
All 10. Investment property at fair value 216 61 0 9 <0.01All 13. Actuarial gains/losses to OCI 414 39 58 73 <0.01All 14. Proportionate consolidation of JVs 379 27 56 35 <0.01AU 10. Investment property at fair value 15 100 – 50 <0.01CA 13. Actuarial gains/losses to OCI 39 10 82 100 <0.01CA 14. Proportionate consolidation of JVs 38 30 82 36 0.01UK 4. Balance sheet showing net assets 93 45 67 89 <0.01UK 5. Balance sheet with liquidity decreasing 93 32 0 3 <0.01
This table reports the percentages of financial, extractive and other companies which make the respective IFRS policy choice in 2011. N is the number of observations/companies. The column ‘ p-value’ reports the p-values for v2 tests of independence. See Table 4 for the definition and frequencies of financialand extractive companies. See Table 3 and Appendix C for details of the topics.
44 For example, EU banks have different company law from other
companies on such issues as the format of the balance sheet.45 Such as requirements from the Bank of Spain relating to the IFRS
balance sheets of Spanish banks. For example, Caixabank states in its ‘2011
Management report and annual financial statements’ (p. 23) that it changed
the format of its balance sheet to conform to legislation for creditinstitutions (Bank of Spain Circular 4/2004).
586 C. Nobes, C. Stadler / Accounting, Organizations and Society 38 (2013) 573–595
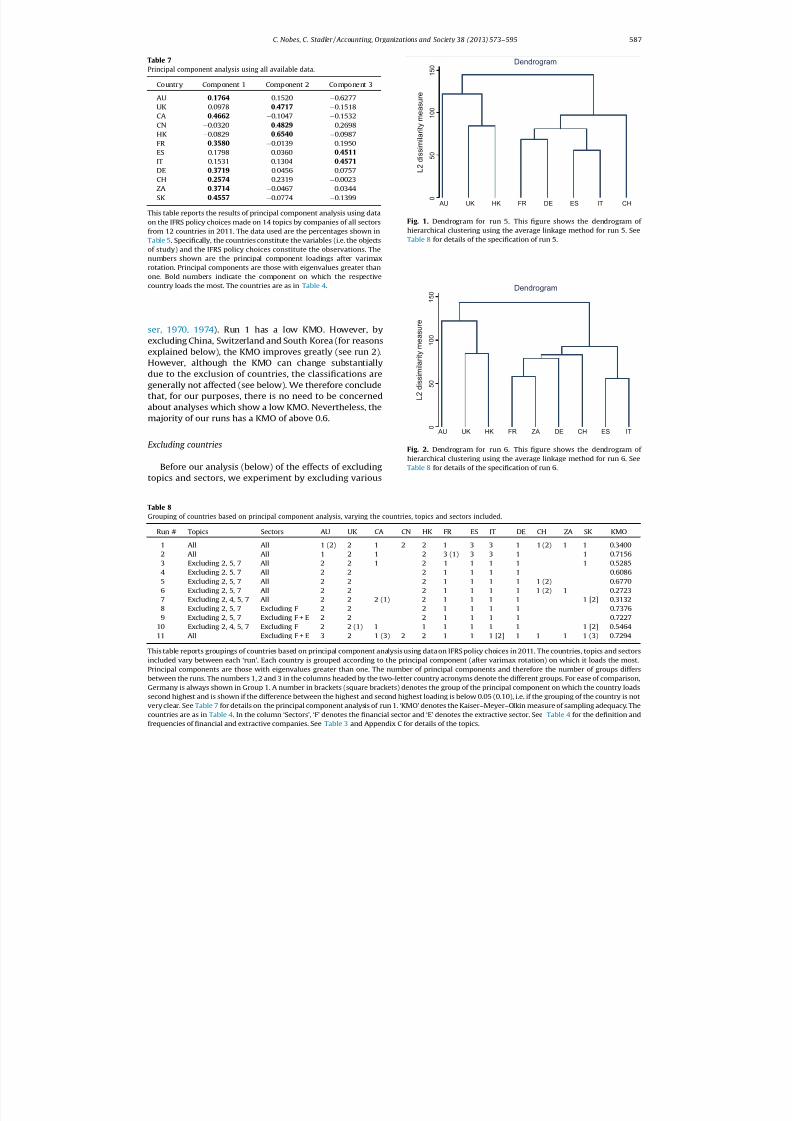
8/13/2019 1-s2.0-S0361368213000676-main
http://slidepdf.com/reader/full/1-s20-s0361368213000676-main 15/23
ser, 1970, 1974). Run 1 has a low KMO. However, byexcluding China, Switzerland and South Korea (for reasonsexplained below), the KMO improves greatly (see run 2).However, although the KMO can change substantiallydue to the exclusion of countries, the classifications aregenerally not affected (see below). We therefore concludethat, for our purposes, there is no need to be concernedabout analyses which show a low KMO. Nevertheless, themajority of our runs has a KMO of above 0.6.
Excluding countries
Before our analysis (below) of the effects of excludingtopics and sectors, we experiment by excluding various
Table 7
Principal component analysis using all available data.
Country Component 1 Component 2 Component 3
AU 0.1764 0.1520 0.6277UK 0.0978 0.4717 0.1518CA 0.4662 0.1047 0.1532CN 0.0320 0.4829 0.2698HK 0.0829 0.6540 0.0987
FR 0.3580 0.0139 0.1950ES 0.1798 0.0360 0.4511
IT 0.1531 0.1304 0.4571
DE 0.3719 0.0456 0.0757CH 0.2574 0.2319 0.0023ZA 0.3714 0.0467 0.0344SK 0.4557 0.0774 0.1399
This table reports the results of principal component analysis using dataon the IFRS policy choices made on 14 topics by companies of all sectorsfrom 12 countries in 2011. The data used are the percentages shown inTable 5. Specifically, the countries constitute the variables (i.e. the objectsof study) and the IFRS policy choices constitute the observations. Thenumbers shown are the principal component loadings after varimaxrotation. Principal components are those with eigenvalues greater thanone. Bold numbers indicate the component on which the respective
country loads the most. The countries are as in Table 4.
Table 8
Grouping of countries based on principal component analysis, varying the countries, topics and sectors included.
Run # Topics Sectors AU UK CA CN HK FR ES IT DE CH ZA SK KMO
1 All All 1 (2) 2 1 2 2 1 3 3 1 1 (2) 1 1 0.34002 All All 1 2 1 2 3 (1) 3 3 1 1 0.71563 Excluding 2, 5, 7 All 2 2 1 2 1 1 1 1 1 0.5285
4 Excluding 2, 5, 7 All 2 2 2 1 1 1 1 0.60865 Excluding 2, 5, 7 All 2 2 2 1 1 1 1 1 (2) 0.67706 Excluding 2, 5, 7 All 2 2 2 1 1 1 1 1 (2) 1 0.27237 Excluding 2, 4, 5, 7 All 2 2 2 (1) 2 1 1 1 1 1 [2] 0.31328 Excluding 2, 5, 7 Excluding F 2 2 2 1 1 1 1 0.73769 Excluding 2, 5, 7 Excluding F + E 2 2 2 1 1 1 1 0.7227
10 Excluding 2, 4, 5, 7 Excluding F 2 2 (1) 1 1 1 1 1 1 1 [2] 0.546411 All Excluding F + E 3 2 1 (3) 2 2 1 1 1 [2] 1 1 1 1 (3) 0.7294
This table reports groupings of countries based on principal component analysis using data on IFRS policy choices in 2011. The countries, topics and sectorsincluded vary between each ‘run’. Each country is grouped according to the principal component (after varimax rotation) on which it loads the most.Principal components are those with eigenvalues greater than one. The number of principal components and therefore the number of groups differsbetween the runs. The numbers 1, 2 and 3 in the columns headed by the two-letter country acronyms denote the different groups. For ease of comparison,Germany is always shown in Group 1. A number in brackets (square brackets) denotes the group of the principal component on which the country loadssecond highest and is shown if the difference between the highest and second highest loading is below 0.05 (0.10), i.e. if the grouping of the country is notvery clear. See Table 7 for details on the principal component analysis of run 1. ‘KMO’ denotes the Kaiser–Meyer–Olkin measure of sampling adequacy. Thecountries are as in Table 4. In the column ‘Sectors’, ‘F’ denotes the financial sector and ‘E’ denotes the extractive sector. See Table 4 for the definition andfrequencies of financial and extractive companies. See Table 3 and Appendix C for details of the topics.
0
5 0
1 0 0
1 5 0
L 2 d i s s i m
i l a r i t y m e a s u r e
AU UK HK FR DE ES IT CH
Dendrogram
Fig. 1. Dendrogram for run 5. This figure shows the dendrogram of hierarchical clustering using the average linkage method for run 5. SeeTable 8 for details of the specification of run 5.
0
5 0
1 0 0
1 5 0
L 2 d i s s i m i l a r i t y m e a s u r e
AU UK HK FR ZA DE CH ES IT
Dendrogram
Fig. 2. Dendrogram for run 6. This figure shows the dendrogram of hierarchical clustering using the average linkage method for run 6. SeeTable 8 for details of the specification of run 6.
C. Nobes, C. Stadler / Accounting, Organizations and Society 38 (2013) 573–595 587
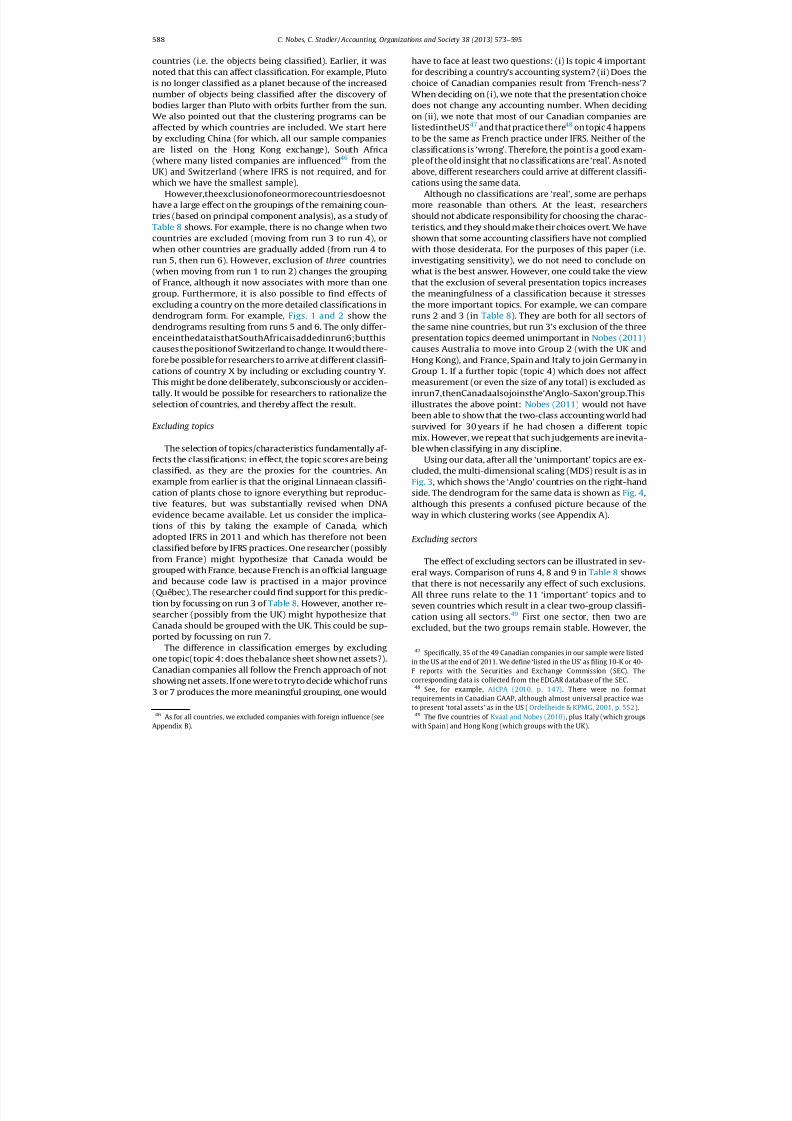
8/13/2019 1-s2.0-S0361368213000676-main
http://slidepdf.com/reader/full/1-s20-s0361368213000676-main 16/23
countries (i.e. the objects being classified). Earlier, it wasnoted that this can affect classification. For example, Plutois no longer classified as a planet because of the increasednumber of objects being classified after the discovery of bodies larger than Pluto with orbits further from the sun.We also pointed out that the clustering programs can beaffected by which countries are included. We start hereby excluding China (for which, all our sample companiesare listed on the Hong Kong exchange), South Africa(where many listed companies are influenced46 from the
UK) and Switzerland (where IFRS is not required, and for
which we have the smallest sample).
However,theexclusionofoneormorecountriesdoesnothave a large effect on the groupings of the remaining coun-tries (based on principal component analysis), as a study of Table 8 shows. For example, there is no change when twocountries are excluded (moving from run 3 to run 4), orwhen other countries are gradually added (from run 4 torun 5, then run 6). However, exclusion of three countries(when moving from run 1 to run 2) changes the groupingof France, although it now associates with more than onegroup. Furthermore, it is also possible to find effects of excluding a country on the more detailed classifications indendrogram form. For example, Figs. 1 and 2 show thedendrograms resulting from runs 5 and 6. The only differ-enceinthedataisthatSouthAfricaisaddedinrun6;butthiscausesthepositionof Switzerland to change. It wouldthere-forebe possiblefor researchers to arrive at different classifi-cations of country X by including or excluding country Y.This might be done deliberately, subconsciously or acciden-tally. It would be possible for researchers to rationalize theselection of countries, and thereby affect the result.
Excluding topics
The selection of topics/characteristics fundamentally af-fects the classifications: in effect, the topic scores are beingclassified, as they are the proxies for the countries. Anexample from earlier is that the original Linnaean classifi-cation of plants chose to ignore everything but reproduc-tive features, but was substantially revised when DNAevidence became available. Let us consider the implica-tions of this by taking the example of Canada, whichadopted IFRS in 2011 and which has therefore not beenclassified before by IFRS practices. One researcher (possiblyfrom France) might hypothesize that Canada would begrouped with France, because French is an official languageand because code law is practised in a major province(Québec). The researcher could find support for this predic-tion by focussing on run 3 of Table 8. However, another re-searcher (possibly from the UK) might hypothesize thatCanada should be grouped with the UK. This could be sup-ported by focussing on run 7.
The difference in classification emerges by excludingone topic(topic 4: does thebalance sheet shownet assets?).Canadian companies all follow the French approach of notshowing net assets. If one weretotryto decide whichof runs3 or 7 produces the more meaningful grouping, one would
have to face at least two questions: (i) Is topic 4 importantfor describing a country’s accounting system? (ii) Does thechoice of Canadian companies result from ‘French-ness’?When deciding on (i), we note that the presentation choicedoes not change any accounting number. When decidingon (ii), we note that most of our Canadian companies arelistedintheUS47 and that practice there48 on topic 4 happens
to be the same as French practice under IFRS. Neither of the
classifications is ‘wrong’. Therefore, the point is a good exam-
ple of the old insight that no classifications are ‘real’. As noted
above, different researchers could arrive at different classifi-
cations using the same data.
Although no classifications are ‘real’, some are perhapsmore reasonable than others. At the least, researchersshould not abdicate responsibility for choosing the charac-teristics, and they should make their choices overt. We haveshown that some accounting classifiers have not compliedwith those desiderata. For the purposes of this paper (i.e.investigating sensitivity), we do not need to conclude onwhat is the best answer. However, one could take the viewthat the exclusion of several presentation topics increasesthe meaningfulness of a classification because it stressesthe more important topics. For example, we can compareruns 2 and 3 (in Table 8). They are both for all sectors of the same nine countries, but run 3’s exclusion of the threepresentation topics deemed unimportant in Nobes (2011)causes Australia to move into Group 2 (with the UK andHong Kong), and France, Spain and Italy to join Germany inGroup 1. If a further topic (topic 4) which does not affectmeasurement (or even the size of any total) is excluded asinrun7,thenCanadaalsojoinsthe‘Anglo-Saxon’group.Thisillustrates the above point: Nobes (2011) would not havebeen able to show that the two-class accounting world hadsurvived for 30 years if he had chosen a different topicmix. However, we repeat that such judgements are inevita-ble when classifying in any discipline.
Using our data, after all the ‘unimportant’ topics are ex-cluded, the multi-dimensional scaling (MDS) result is as inFig. 3, which shows the ‘Anglo’ countries on the right-handside. The dendrogram for the same data is shown as Fig. 4,although this presents a confused picture because of theway in which clustering works (see Appendix A).
Excluding sectors
The effect of excluding sectors can be illustrated in sev-
eral ways. Comparison of runs 4, 8 and 9 in Table 8 showsthat there is not necessarily any effect of such exclusions.All three runs relate to the 11 ‘important’ topics and toseven countries which result in a clear two-group classifi-cation using all sectors.49 First one sector, then two are
excluded, but the two groups remain stable. However, the
46
As for all countries, we excluded companies with foreign influence (seeAppendix B).
47 Specifically, 35 of the 49 Canadian companies in our sample were listed
in the US at the end of 2011. We define ‘listed in the US’ as filing 10-K or 40-
F reports with the Securities and Exchange Commission (SEC). The
corresponding data is collected from the EDGAR database of the SEC.48 See, for example, AICPA (2010, p. 147). There were no format
requirements in Canadian GAAP, although almost universal practice was
to present ‘total assets’ as in the US (Ordelheide & KPMG, 2001, p. 552).49
The five countries of Kvaal and Nobes (2010), plus Italy (which groupswith Spain) and Hong Kong (which groups with the UK).
588 C. Nobes, C. Stadler / Accounting, Organizations and Society 38 (2013) 573–595
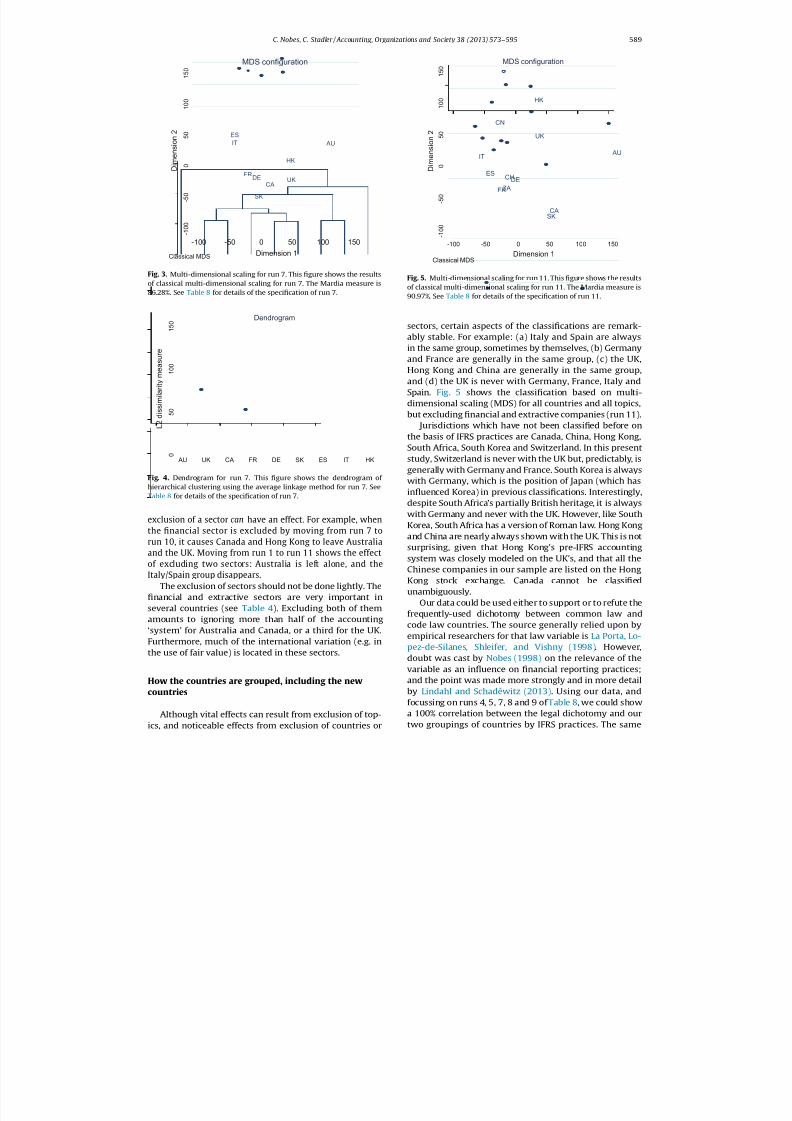
8/13/2019 1-s2.0-S0361368213000676-main
http://slidepdf.com/reader/full/1-s20-s0361368213000676-main 17/23
exclusion of a sector can have an effect. For example, when
the financial sector is excluded by moving from run 7 to
run 10, it causes Canada and Hong Kong to leave Australia
and the UK. Moving from run 1 to run 11 shows the effect
of excluding two sectors: Australia is left alone, and the
Italy/Spain group disappears.The exclusion of sectors should not be done lightly. The
financial and extractive sectors are very important inseveral countries (see Table 4). Excluding both of themamounts to ignoring more than half of the accounting‘system’ for Australia and Canada, or a third for the UK.Furthermore, much of the international variation (e.g. inthe use of fair value) is located in these sectors.
How the countries are grouped, including the new
countries
Although vital effects can result from exclusion of top-ics, and noticeable effects from exclusion of countries or
sectors, certain aspects of the classifications are remark-ably stable. For example: (a) Italy and Spain are alwaysin the same group, sometimes by themselves, (b) Germanyand France are generally in the same group, (c) the UK,Hong Kong and China are generally in the same group,and (d) the UK is never with Germany, France, Italy andSpain. Fig. 5 shows the classification based on multi-dimensional scaling (MDS) for all countries and all topics,but excluding financial and extractive companies (run 11).
Jurisdictions which have not been classified before onthe basis of IFRS practices are Canada, China, Hong Kong,South Africa, South Korea and Switzerland. In this presentstudy, Switzerland is never with the UK but, predictably, isgenerally with Germany and France. South Korea is alwayswith Germany, which is the position of Japan (which hasinfluenced Korea) in previous classifications. Interestingly,despite South Africa’s partially British heritage, it is alwayswith Germany and never with the UK. However, like SouthKorea, South Africa has a version of Roman law. Hong Kongand China are nearly always shown with the UK. This is notsurprising, given that Hong Kong’s pre-IFRS accountingsystem was closely modeled on the UK’s, and that all theChinese companies in our sample are listed on the HongKong stock exchange. Canada cannot be classifiedunambiguously.
Our data could be used either to support or to refute thefrequently-used dichotomy between common law andcode law countries. The source generally relied upon byempirical researchers for that law variable is La Porta, Lo-pez-de-Silanes, Shleifer, and Vishny (1998). However,doubt was cast by Nobes (1998) on the relevance of thevariable as an influence on financial reporting practices;and the point was made more strongly and in more detailby Lindahl and Schadéwitz (2013). Using our data, andfocussing on runs 4, 5, 7, 8 and 9 of Table 8, we could showa 100% correlation between the legal dichotomy and ourtwo groupings of countries by IFRS practices. The same
AU
UKCA
HK
FR
ES
IT
DE
SK
- 1 0 0
- 5 0
0
5 0
1 0 0
1 5 0
D i m e n s i o
n 2
-100 -50 0 50 100 150
Dimension 1Classical MDS
MDS configuration
Fig. 3. Multi-dimensional scaling for run 7. This figure shows the resultsof classical multi-dimensional scaling for run 7. The Mardia measure is86.28%. See Table 8 for details of the specification of run 7.
0
5 0
1 0 0
1 5 0
L 2 d i s s i m i l a r i t y m e a s u r e
AU UK CA FR DE SK ES IT HK
Dendrogram
Fig. 4. Dendrogram for run 7. This figure shows the dendrogram of hierarchical clustering using the average linkage method for run 7. SeeTable 8 for details of the specification of run 7.
AU
UK
CA
CN
HK
FR
ES
IT
DECH
ZA
SK
- 1 0 0
- 5 0
0
5 0
1 0 0
1 5 0
D i m e n s i o
n 2
-100 -50 0 50 100 150
Dimension 1Classical MDS
MDS configuration
Fig. 5. Multi-dimensional scaling for run 11. This figure shows the results
of classical multi-dimensional scaling for run 11. The Mardia measure is90.97%. See Table 8 for details of the specification of run 11.
C. Nobes, C. Stadler / Accounting, Organizations and Society 38 (2013) 573–595 589
8/13/2019 1-s2.0-S0361368213000676-main
http://slidepdf.com/reader/full/1-s20-s0361368213000676-main 18/23
would apply to run 6 if South Africa is scored as having ‘Ro-man Dutch’ law (as in legal classifications) rather than as‘English origin’ (as in La Porta et al., 1998). However, if we focussed on runs 1, 2, 10 and 11, quite a different storycould be told. This is a further illustration of the need for judgement by researchers and caution by readers.
Conclusions
Classification is a fundamental activity in many scien-tific disciplines and in everyday work in several fields. Itpervades society, organizations and accounting. There areindications that classifications in several fields havestrongly reflected their classifiers. This was particularlyobvious in the way in which man originally classified him-self and his world. Although some independence can beachieved by detailed systematic observation, the choiceof characteristics to represent the objects being classifiedremains inevitably a matter of judgement. For example,even though Linnaeus’ botanical classification rested onmeticulous observation, he chose to ignore most of the ob-servable things about plants. Classifications can still beuseful even when arbitrary, though some classificationsare now described by scientists as ‘natural’ rather thanarbitrary. Whether a classification is useful or not is relatedto its purpose. We collated lessons from other fields inpreparation for analyzing the long history of classificationin international accounting.
Accounting classifications have been extensively re-ferred to in policy-making debates; and they have beenused as part of the setting for research on many topics,and as a source of independent variables in empirical re-search. If the classifications are inappropriate, or have beenused inappropriately, the settings or variables are wrong.However, few accounting classifiers have discussed orinvestigated the robustness of classification to variationsin such matters as the number of objects classified andthe nature of the characteristics chosen to represent theobjects. In our survey of previous accounting classifica-tions, we find a wide range on these matters.
Like early classifications in other fields, the earlyaccounting classifications (items 1–4 of Table 1) seem toreflect the backgrounds of the classifiers. For example,Americans saw a three-class world: US, UK and other. An-other point from above is that classification should bebased on observation. However, those early accountingclassifications did not use data. Other classifications (items9–11) were also not based on detailed systematic observa-tion but on informal impressions. From the late 1970s, sev-eral classifiers (items 5–8 and 12 and 13) did use data, butthe data were based on the opinions of others. In terms of the introductory sections of this paper, the evidence washearsay. None of the classifiers appears to have lookedfor, or corrected, errors in their databases.
Most accounting classifiers have not addressed the factthat a classification depends entirely on the characteristicschosen to represent the countries being classified. Classifi-cations 5–8 even used data that had been designed to re-veal US/UK differences, whereupon the classificationsreflected this. Most classifications do not specify their date
or the type of companies considered. Where the latter isspecified, the scope is listed companies. Nearly all classifi-ers have ignored sectoral differences, and none has investi-gated the effect of such differences on classifications.
Our meta-analysis of the previous classificationsshowed only limited consensus about pairings or widergroups of countries, which suggests a high degree of arbi-trariness in the classifications. However, a British groupwas identified; it did not include North America, whichour review suggests is partly because of the biases in theperceptions of the classifiers and in the data.
One of this paper’s purposes is to assess the reliabilityof previous accounting classifications by empirically investi-gating their sensitivity to variations in a series of factors,i.e. the countries and sectors included, and the characteris-tics chosen to represent the countries. We do this by hand-picking data on the IFRS choices made on 14 topics by 514large listed companies from 12 countries in 2011. We re-port the data on IFRS choices; for five of our countries thisis the first time that data on IFRS choices has been re-ported. We choose to measure observable policy choicesbecause we believe that practices are the best indicationof an ‘accounting system’. Other data would lead to differ-ent classifications. For example, it would also be possible,though difficult, to collect data on other aspects of IFRSpractice, e.g. the tendency to make impairments.
When investigating sensitivity by using principal com-ponent analysis, we find that the inclusion or exclusionof particular countries does not generally affect how theremaining countries fall into the two (or sometimes three)groups produced. However, in the more detailed classifica-tions resulting from cluster analysis, the inclusion or exclu-sion of country X can cause country Y to change itsposition. So, this caveat should be noted by classifiers.
The key issue is the selection of characteristics to repre-sent a country. For example, we show that, by graduallyexcluding presentation topics (which some researchershave claimed are less fundamental), Australia and Canada join an ‘Anglo’ group; and another group containing allthe continental European countries is formed. By selectingdifferent characteristics, quite different classificationsemerge. This means that classifiers should not leave theselection of characteristics to the preparers of databases.The apparent objectivity of relying on someone else’s sub- jectivity (e.g. by using the topics chosen by Price Water-house or KPMG for purposes other than classification) isgreatly outweighed by the need to address the issue of which characteristics matter.
Our data show stark differences between sectors in IFRSchoices on certain topics. This does not generally affect theclassifications but, for some sets of the data, the exclusionof one or both sectors does change the classification.Depending on the topics, countries and sectors included,a two-groupclassification of our countries can be producedwhich corresponds exactly with a common/code law split.However, it would be possible to produce classificationsfrom our data which do not. Again, on the issues of thisparagraph, classifiers should discuss such sensitivity.
Despite the above findings, certain aspects of our classi-fications are remarkably stable, e.g. Italy and Spain are al-ways in the same group, and never with the UK. We
590 C. Nobes, C. Stadler / Accounting, Organizations and Society 38 (2013) 573–595
8/13/2019 1-s2.0-S0361368213000676-main
http://slidepdf.com/reader/full/1-s20-s0361368213000676-main 19/23
8/13/2019 1-s2.0-S0361368213000676-main
http://slidepdf.com/reader/full/1-s20-s0361368213000676-main 20/23
companies: first, 16 companies (mostly from Canada andSwitzerland) use US GAAP and are therefore not consid-ered; second, six Chinese companies use Chinese GAAPonly (see footnote 35); third, three Canadian companieswith rate-regulated activities use Canadian GAAP; fourth,47 companies were index constituents in 2005 and/or2010 but had been taken over/delisted by 2011. Conse-quently, our final sample consists of 514 unique companies(see Table 4 for a breakdown by country). For all thesecompanies, with the exception of some South Korean ones,we used English language reports. For those South Koreancompanies which did not provide consolidated statementsin English, we used the information that we could findfrom regulatory filings (from the ‘DART’) or from unconsol-idated statements.
Appendix C. Data collection and coding procedures
This Appendix provides details on how we collected thedata on observable IFRS policy choices (see Table 3) and on
how we coded the data in order to generate binary choicedata (see Table 5).
C.1. General procedures
Our default procedure is to recordthe IFRS policy choicesbased on the information provided in the financial state-mentsor theaccountingpolicies sectionof thenotes.If thereis no or insufficient information, other parts of thenotesaresearchedforthe relevant information. Weignorecaseswith-outa correspondingnumberin thecurrentyear; thisapplieswhen a company states a policy choice which was previ-ously made but is not applicable any more. We also ignore
choices that only relate to an associate or joint venture.
C.2. Specific procedures
Topic 1 (income statement format): ‘neither’ is recordedif the income statement contains both a by-nature and a by-function expense or if theincome statement contains so few lines that it isunclear whether it is ‘by nature’ or ‘by function’.We define a binary choice by distinguishingwhether or not the income statement is bynature because the ‘neither’ cases are usually
more similar to ‘by function’ than ‘by nature’. Forfinancial companies, this topic is omitted becausethe distinction between ‘by nature’ and ‘byfunction’ is not applicable to most of them.
Topic 2 (operating profit shown or not): For financialcompanies, this topic is omitted because formany of them there is only a line for earningsbefore taxation (EBT) since EBT = operatingprofit.
Topic 3 (position of equity profits in the incomestatement): We define a binary choice bydistinguishing whether or not the item is
included in operating profit, which we considerto be the key issue. Many financial companies donot have a clear ‘operating’ or ‘financing’ sectionin the income statement; for these, we recordthat equity profits are not included in ‘operating’if they are clearly separately shown below theoperating expenses items. We ignore cases where
both options are used (which applies to twocompanies).Topic 4 (balance sheet showing net assets or not):
Showing ‘net current assets’ is treated as showing‘net assets’.
Topic 5 (liquidity order of the balance sheet): No specificprocedures.
Topic 6 (direct or indirect operating cash flow):Information is collected from the cash flowstatement only. Otherwise most companieswould use indirect cash flows because thoseusing direct cash flows usually show areconciliation of an income statement number to
cash flow from operating activities in the notes.Topic 7 (position of dividends received in the cash flowstatement): We ignore cases where both optionsare used for different types of dividends (whichapplies to nine companies).
Topic 8 (position of interest paid in the cash flowstatement): Our assumption is that companieshave interest paid, unless there is evidenceagainst it. Therefore if a company uses theindirect method and the cash flow statementdoes not show interest paid, it can be inferredthat interest paid is included in operating cashflows. Interest paid includes capitalized
borrowing costs. We ignore cases where bothoptions are used (which applies to fourcompanies). For financial companies, this topic isomitted because IAS 7.33 states that interest paidis ‘usually’ classified as operating cash flows for afinancial institution.
Topic 9 (some property at fair value or not): Only annualrevaluations to fair value are considered, notinitial recognition, impairments or first-timeadoption of IFRS.
Topic10
(investment property at fair value or not): Thechoice of valuing some investment property atfair value according to IAS 40.32A is ignored if a
company generally uses the cost model.Topic11
(some designation of financial instruments at fairvalue or not): Some fair value designation is onlyrecordedif a companyclearly states that financialinstruments have been designated as at FVTPL (i.e. the fair value option is used) and the notesshow a corresponding number to confirm this.The latter is necessary because many companieshave boilerplate notes concerning fair valuedesignation even though there is no suchdesignation in the particular company. Forfinancial companies, this topic is omitted because
592 C. Nobes, C. Stadler / Accounting, Organizations and Society 38 (2013) 573–595
8/13/2019 1-s2.0-S0361368213000676-main
http://slidepdf.com/reader/full/1-s20-s0361368213000676-main 21/23
many have some fair value designation due tohaving a large number of financial instruments.
Topic12
(inventory valuation): Any method other thanFIFO or weighted average is ignored. This mainlyapplies to the ‘retail method’ used in the retailsector. For financial companies, this topic isomitted because most of them do not report
inventories.Topic13
(treatment of actuarial gains/losses): Any choicethat results in unrecognized actuarial gains andlosses (AGL) is treated as using the corridormethod, because the key difference between thecorridor method and the other options is theexistence of unrecognized AGL. We define abinary choice by combining the options ‘corridormethod’ and ‘to income in full’ because weconsider the key issue to be whether or not AGL are ever charged in the income statement, whichis not the case under ‘actuarial gains and losses toOCI’.
Topic14 (treatment of joint ventures): The choice of designation as at fair value through profit or lossupon initial recognition (IAS 31.1) is ignored. Thisonly applies to two financial companies in oursample. We ignore the choice of one financialcompany which uses both proportionateconsolidation and the equity method.
References
AAA (1977). American Accounting Association 1975–1976 committee oninternational accounting operations and education. The Accounting Review, 52(Suppl.), 65–132.
AICPA (2010). Accounting trends and techniques. Jersey City, NJ: AmericanInstitute of Certified Public Accountants.
Aldersley-Williams, H. (2011). Periodic tales: The curious lives of theelements. London: Viking.
Alexander, D., & Archer, S. (2000). On the myth of ‘‘Anglo-Saxon’’ financialaccounting. International Journal of Accounting, 35(4), 539–557.
Ali, A., & Hwang, L.-S. (2000). Country-specific factors related to financialreporting and the value relevance of accounting data. Journal of
Accounting Research, 38(1), 1–21.AlNajjar, F. K. (1986). Standardization in accounting practices: A
comparative international study. International Journal of Accounting, 21(2), 161–176.
Ball, R. (2006). International Financial Reporting Standards (IFRS): Prosand cons for investors. Accounting and Business Research, International
Accounting Policy Forum, 36 (Suppl.), 5–27.Ball, R., Kothari, S. P., & Robin, A. (2000). The effect of international
institutional factors on properties of accounting earnings. Journal of Accounting and Economics, 29(1), 1–51.
Basri, G., & Brown, M. E. (2006). Planetesimals to brown dwarfs: What is aplanet? Annual Review of Earth and Planetary Sciences, 34 , 193–216.
Bloor, D. (1982). Durkheim and Mauss revisited: Classification and thesociology of knowledge. Studies in History and Philosophy of Science,13(4), 267–297.
Botzem, S., &Quack, S. (2009). (No) limits to Anglo-American accounting?Reconstructing the history of the International Accounting StandardsCommittee: A review article. Accounting, Organizations and Society,
34(8), 988–998.Bowker, G. C., & Star, S. L. (2000). Sorting things out: Classification and its
consequences. Cambridge, MA: MIT Press.Brotton, J. (2012). A history of the world in twelve maps. London: Penguin.Camfferman, K., & Zeff, S. A. (2007). Financial reporting and global capital
markets: A history of the International Accounting Standards Committee,1973–2000. Oxford: Oxford University Press.
Christensen, H. B., & Nikolaev, V. V. (2013). Does fair value accounting fornon-financial assets pass the market test? Review of Accounting Studies, 18(3), 734–775.
Christie, A. A. (1990). Aggregation of test statistics: An evaluation of theevidence on contracting and size hypotheses. Journal of Accounting and Economics, 12(1–3), 15–36.
Cooke, T. E., & Wallace, R. S. O. (1990). Financial disclosure regulation andits environment: A review and further analysis. Journal of Accounting and Public Policy, 9(2), 79–110.
Coomber, R. R. (1956). Hugh Oldcastle and John Mellis. In A. C. Littleton &
B. S. Yamey (Eds.), Studies in the history of accounting (pp. 206–214).Homewood, IL: Irwin.
Cormack, R. M. (1971). A review of classification. Journal of the RoyalStatistical Society. Series A (General), 134(3), 321–367.
da Costa, R. C., Bourgeois, J. C., & Lawson, W. M. (1978). A classification of international financial accounting practices. International Journal of
Accounting, 13(2), 73–85.Daley, L. A., & Mueller, G. G. (1982). Accounting in the arena of world
politics: Crosscurrents of international standard-setting activities. Journal of Accountancy, 153(2), 40–50.
d’Arcy, A. (2001). Accounting classification and the internationalharmonisation debate – An empirical investigation. Accounting,Organizations and Society, 26 (4–5), 327–349.
David, R., & Brierley, J. E. C. (1985). Major legal systems in the world today: An introduction to the comparative study of law (3rd ed.). London:Stevens.
Delvaille, P., Ebbers, G., & Saccon, C. (2005). International financial
reporting convergence: Evidence from three continental Europeancountries. Accounting in Europe, 2, 137–164.
Ding, Y., Hope, O.-K., Jeanjean, T., & Stolowy, H. (2007). Differencesbetween domestic accounting standards and IAS: Measurement,determinants and implications. Journal of Accounting and Public Policy, 26 (1), 1–38.
Ding, Y., Richard, J., & Stolowy, H. (2008). Towards an understanding of the phases of goodwill accounting in four Western capitalistcountries: From stakeholder model to shareholder model.
Accounting, Organizations and Society, 33(7–8), 718–755.Doupnik, T. S., & Salter, S. B. (1993). An empirical test of a judgemental
international classification of financial reporting practices. Journal of International Business Studies, 24(1), 41–60.
Duff, R. J., & Nickrent, D. L. (1999). Phylogenetic relationships of landplants using mitochondrial small-subunit rDNA sequences. American
Journal of Botany, 86 (3), 372–386.Durkheim, É., & Mauss, M. (1903). De quelques formes primitives de
classification: Contribution à l’étude des représentations collectives.L’Année Sociologique, 6 (1901–1902), 1–72. In R. Needham (Tr.),Primitive classification. London: Cohen and West (1963).
Egger, M., Smith, G. D., & Phillips, A. N. (1997). Meta-analysis:Principles and procedures. BMJ: British Medical Journal, 315(7121),1533–1537.
Foucault, M. (1970). The order of things: An archaeology of the humansciences. London: Tavistock.
Frank, W. G. (1979). An empirical analysis of international accountingprinciples. Journal of Accounting Research, 17 (2), 593–605.
Goodrich, P. S. (1982). A typology of international accounting principlesand policies. AUTA Review, 14(1), 37–61.
Gordon, A. D. (1981). Classification: Methods for the exploratory analysis of multivariate data. London: Chapman and Hall.
Gray, S. J. (1988).Towards a theoryof culturalinfluenceon thedevelopmentof accounting systems internationally. Abacus, 24(1), 1–15.
Green, R. E., Krause, J., et al. (2010). A draft sequence of the Neandertal
genome. Science, 328(5979), 710–722.Gröjer, J.-E. (2001). Intangibles and accounting classifications: In search of
a classification strategy. Accounting, Organizations and Society, 26 (7–8), 695–713.
Harrison, G. L., & McKinnon, J. L. (1986). Culture and accountingchange: A new perspective on corporate reporting regulation andaccounting policy formulation. Accounting, Organizations and Society,11(3), 233–252.
Hatfield, H. R. (1911). Some variations in accounting practice in England,France, Germany and the United States. Reprinted in Journal of
Accounting Research, 4(2), 1966, 169–182.Hennes, M., & Metzger, S. (2010). Der unbekannte Feind aus London.
Handelsblatt , 21 September, p. 18. <http://www.handelsblatt.com/unternehmen/management/strategie/iasb-bilanzierungsregeln-der-unbekannte-feind-aus-london/3629726.html> (Retrieved 15.04.13).
C. Nobes, C. Stadler / Accounting, Organizations and Society 38 (2013) 573–595 593
8/13/2019 1-s2.0-S0361368213000676-main
http://slidepdf.com/reader/full/1-s20-s0361368213000676-main 22/23
Hutcheson, G. D., & Sofroniou, N. (1999). The multivariate social scientist:Introductory statistics using generalized linear models. Thousand Oaks,CA: Sage.
IAU (2006). International Astronomical Union 2006 General Assembly:Resolution B5: Definition of a planet in the solar system, resolutionB6: Pluto. <http://www.iau.org/static/resolutions/Resolution_GA26-5-6.pdf > (Retrieved 15.04.13).
Jaafar, A., & McLeay, S. (2007). Country effects and sector effects on theharmonization of accounting policy choice. Abacus, 43(2), 156–189.
Kaiser, H. F. (1970). A second generation little jiffy. Psychometrika, 35(4),
401–415.Kaiser, H. F. (1974). An index of factorial simplicity. Psychometrika, 39(1),
31–36.Kim, J.-O., & Mueller, C. W. (1978). Introduction to factor analysis: What it is
and how to do it . Thousand Oaks, CA: Sage (Quantitative Applicationsin the Social Sciences Series, No. 13).
Kleekämper, H. (2000). IASC – Das Trojanische Pferd der SEC? In W.Ballwieser (Ed.), US-amerikanische Rechnungslegung: Grundlagen undVergleiche mit deutschem Recht (4th ed., pp. 467–484). Stuttgart:Schäffer-Poeschel.
Kvaal, E., & Nobes, C. W. (2010). International differences in IFRS policychoice: A research note. Accounting and Business Research, 40(2),173–187.
Kvaal, E., & Nobes, C. W. (2012). IFRS policy changes and the continuationof national patterns of IFRS practice. European Accounting Review,
21(2), 343–371.La Porta, R., Lopez-de-Silanes, F., Shleifer, A., & Vishny, R. W. (1998). Law
and finance. Journal of Political Economy, 106 (6), 1113–1155.Leuz, C. (2010). Different approaches to corporate reporting regulation:
How jurisdictions differ and why. Accounting and Business Research,International Accounting Policy Forum, 40(3), 229–256.
Leuz, C., Nanda, D., & Wysocki, P. D. (2003). Earnings management andinvestor protection: An international comparison. Journal of FinancialEconomics, 69(3), 505–527.
Lévi-Strauss, C. (1958). Anthropologie structurale. In C. Jacobson, & B. G.Schoepf (Tr.), Structural anthropology. New York, NY: Basic Books(1963).
Lindahl, F., & Schadéwitz, H. (2013). Are legal families related to financialreporting quality? Abacus, 49(2), 242–267.
Linnaeus, C. (1751). Philosophia botanica. In S. Freer (Tr.), Linnaeus’ philosophia botanica. Oxford: Oxford University Press (2003).
Lovejoy, A. O. (1964). The great chain of being: A study of the history of anidea. Cambridge, MA: Harvard University Press.
Mishler, B. D. (2009). Three centuries of paradigm changes in biological
classification: Is the end in sight? Taxon, 58(1), 61–67.Mueller, G. G. (1967). International accounting, part I . New York, NY:
Macmillan.Mueller, G. G. (1968). Accounting principles generally accepted in the
United States versus those generally accepted elsewhere.International Journal of Accounting, 3(2), 91–103.
Nair, R. D. (1982). Empirical guidelines for comparing internationalaccounting data. Journal of International Business Studies, 13(3),85–98.
Nair, R. D., & Frank, W. G. (1980). The impact of disclosure andmeasurement practices on international accounting classifications.The Accounting Review, 55(3), 426–450.
Neuberger, E., & Duffy, W. J. (1976). Comparative economic systems: Adecision-making approach. Boston, MA: Allyn and Bacon.
Nobes, C. W. (1981). An emprical analysis of internationalaccounting principles: A comment. Journal of Accounting Research,19(1), 268–270.
Nobes, C. W. (1983). A judgemental international classification of financial reporting practices. Journal of Business Finance and
Accounting, 10(1), 1–19.Nobes, C. W. (1998). Towards a general model of the reasons for
international differences in financial reporting. Abacus, 34(2),162–187.
Nobes, C. W. (2004). On accounting classification and the internationalharmonisation debate. Accounting, Organizations and Society, 29(2),189–200.
Nobes, C. W. (2011). IFRS practices and the persistence of accountingsystem classification. Abacus, 47 (3), 267–283.
Nobes, C. W., & Perramon, J. (2013). Firm size and national profiles of IFRSpolicy choice. Australian Accounting Review, 23(3), 208–215.
O’Donnell, E., & Prather-Kinsey, J. (2010). Nationality and differences inauditor risk assessment: A research note with experimental evidence.
Accounting, Organizations and Society, 35(5), 558–564.
Ordelheide, D., & KPMG (2001). Transnational accounting (TRANSACC) (2nded.). Basingstoke: Palgrave.
Ordelheide, D., & Semler, A. (1995). A reference matrix. In D. Ordelheide &KPMG (Eds.), Transnational accounting (TRANSACC) (pp. 1–67).London: Macmillan.
Orens, R., Jorissen, A., Lybaert, N., & van der Tas, L. (2011). Corporatelobbying in private accounting standard setting: Does the IASB haveto reckon with national differences? Accounting in Europe, 8(2),211–234.
Perec, G. (1985). Penser/classer . Rungis: Hachette.
Power, M. (2009). Financial accounting without a state. In C. S. Chapman,D. J. Cooper, & P. B. Miller (Eds.), Accounting, organizations, andinstitutions: Essays in honour of Anthony Hopwood (pp. 324–340).Oxford: Oxford University Press.
Previts, G. J. (1975). On the subject of methodology and models forinternational accountancy. International Journal of Accounting, 10(2),1–12.
Price Waterhouse (1973). Accounting principles and reporting practices: Asurvey in 38 countries. New York, NY: Price Waterhouse.
Price Waterhouse (1976). A survey in 46 countries: Accounting principlesand reporting practices. London: Institute of Chartered Accountants inEngland and Wales.
Price Waterhouse (1979). International survey of accounting principles andreporting practices. Scarborough, Ontario: Butterworths.
Puxty, A. G., Willmott, H. C., Cooper, D. J., & Lowe, T. (1987). Modes of regulation in advanced capitalism: Locating accountancy in fourcountries. Accounting, Organizations and Society, 12(3), 273–291.
Roberts, A. (1995). The very idea of classification in internationalaccounting. Accounting, Organizations and Society, 20(7–8), 639–664.
Rudner, R. S. (1966). Philosophy of social science. Englewood Cliffs, NJ:Prentice Hall.
Ruhlen, M. (1991). A guide to the world’s languages (vol. 1): classification.Stanford, CA: Stanford University Press.
Salter, S. B., & Doupnik, T. S. (1992). The relationship between legalsystems and accounting practices: A classification exercise. Advancesin International Accounting, 5, 3–22.
Saudagaran, S. M., & Biddle, G. C. (1995). Foreign listing location: A studyof MNCs and stock exchanges in eight countries. Journal of International Business Studies, 26 (2), 319–341.
Savage, M., Devine, F., Cunningham, N., Taylor, M., Li, Y., Hjellbrekke, J.,et al. (2013). A new model of social class? Findings from theBBC’s Great British Class Survey experiment. Sociology, 47 (2),219–250.
Seidler, L. J. (1967). International accounting – The ultimate theory
course. The Accounting Review, 42(4), 775–781.Sellhorn, T., & Gornik-Tomaszewski, S. (2006). Implications of the ‘IAS
Regulation’ for research into the international differences inaccounting systems. Accounting in Europe, 3, 187–217.
Shils, E. (1966). Political development in the new states. The Hague:Mouton.
Shoenthal, E. R. (1989). Classification of accounting systems usingcompetencies as a discriminating variable: A Great Britain–UnitedStates study. Journal of Business Finance and Accounting, 16 (4),549–563.
Steiper, M. E., & Young, N. M. (2006). Primate molecular divergence dates.Molecular Phylogenetics and Evolution, 41(2), 384–394.
Stringer, C. (2011). The origin of our species. London: Penguin.Tarca, A., Morris, R. D., & Moy, M. (2013). An investigation of the
relationship between use of international accounting standards andsource of company finance in Germany. Abacus, 49(1), 74–98.
Tyrrall, D., Woodward, D., & Rakhimbekova, A. (2007). The relevance of
International Financial Reporting Standards to a developing country:Evidence from Kazakhstan. International Journal of Accounting, 42(1),82–110.
Watts, R. L., & Zimmerman, J. L. (1979). The demand for and supply of accounting theories: The market for excuses. The Accounting Review,54(2), 273–305.
Wehrfritz, M., Haller, A., & Walton, P. (2012). National influence on theapplication of IFRS – Interpretations and accounting estimates byGerman and British accountants. University of Regensburg, WorkingPaper.
Wildman, D. E., Uddin, M., Liu, G., Grossman, L. I., & Goodman, M.(2003). Implications of natural selection in shaping 99.4%nonsynonymous DNA identity between humans andchimpanzees: Enlarging genus Homo. Proceedings of the National
Academy of Sciences of the United States of America, 100(12),7181–7188.
594 C. Nobes, C. Stadler / Accounting, Organizations and Society 38 (2013) 573–595

8/13/2019 1-s2.0-S0361368213000676-main
http://slidepdf.com/reader/full/1-s20-s0361368213000676-main 23/23
Xiao, J. Z., Weetman, P., & Sun, M. (2004). Political influenceand coexistence of a uniform accounting system andaccounting standards: Recent developments in China. Abacus, 40(2),193–218.
Yamey, B. (1997). Diversity in mercantile accounting in WesternEurope, 1300–1800. In T. E. Cooke & C. W. Nobes (Eds.), Thedevelopment of accounting in an international context (pp. 12–29).London: Routledge.
C. Nobes, C. Stadler / Accounting, Organizations and Society 38 (2013) 573–595 595


