Embed Size (px)
Citation preview
2
The Roadmap
• Save
• Focus on financial goals
• Understand returns
• Understand risk
• Evaluate and asset allocation
• Monitor your investments

3
You are the “influencers”
• Many of you can directly benefit from this presentation
• Many of you have successfully navigated the financial journey
• We need you to be the “influencers” of those around you
4
Rule #1: You can make more money saving aggressively than you can investing aggressively.
5
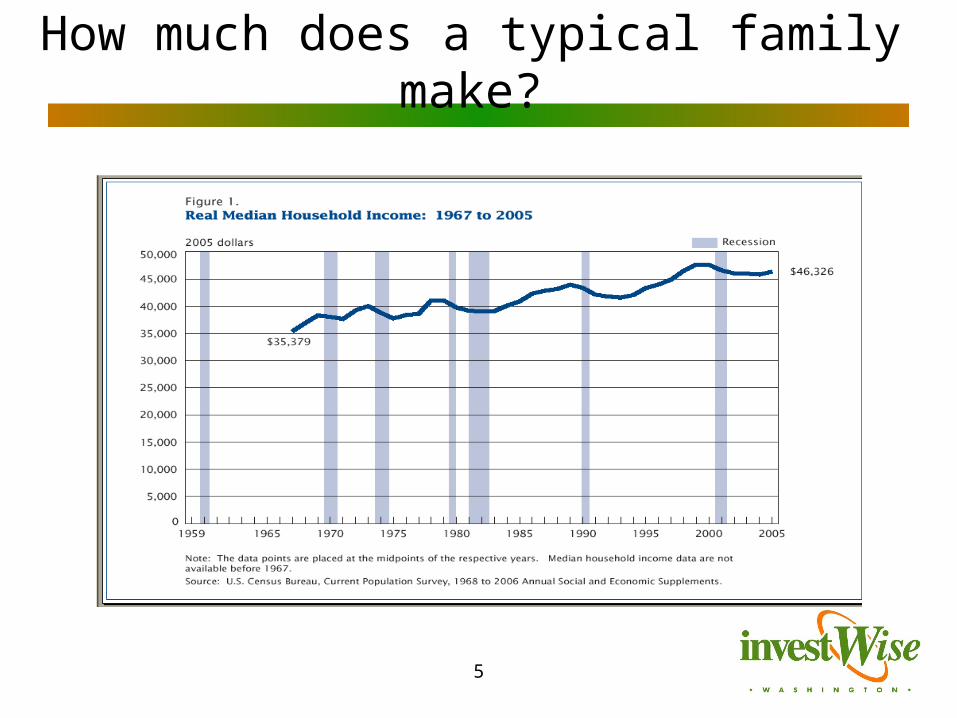
How much does a typical family make?
6
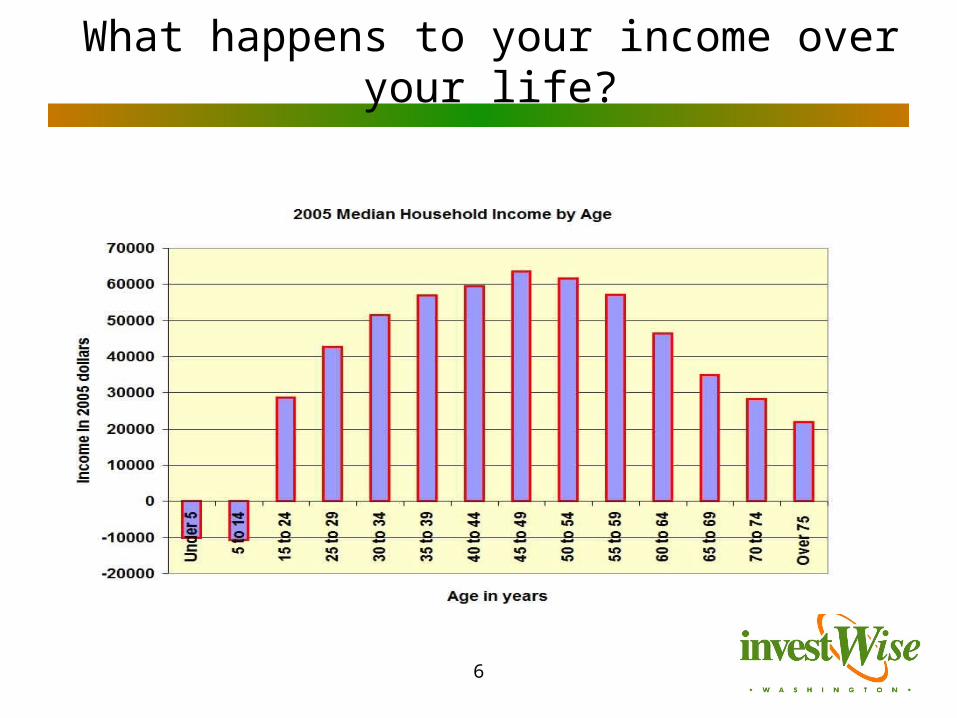
What happens to your income over your life?
7
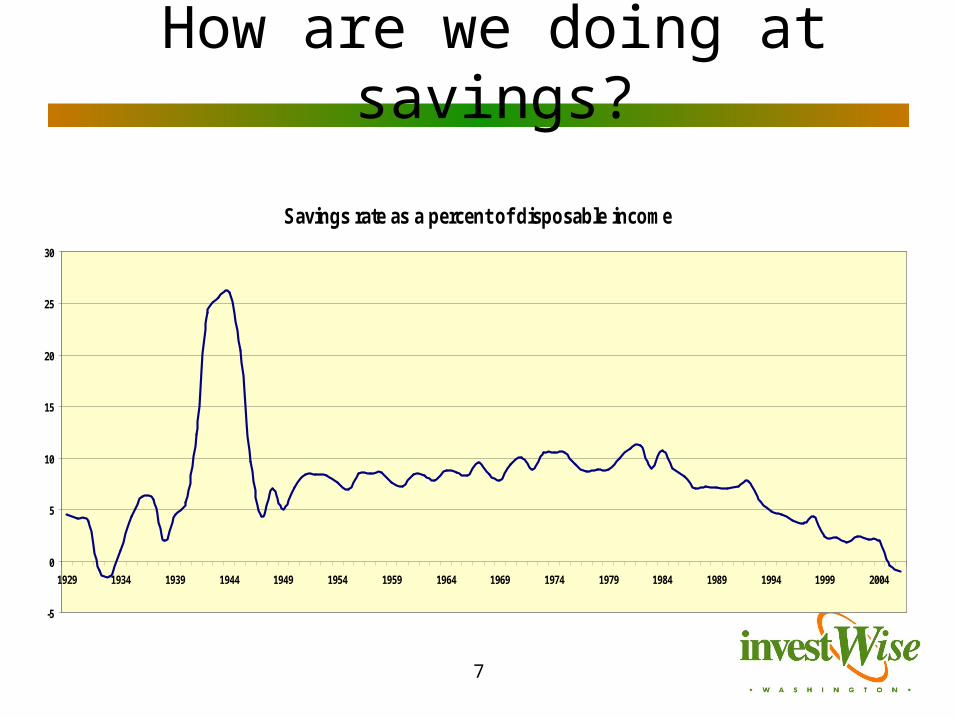
How are we doing at savings?
Savings rate as a percent of disposable income
-5
0
5
10
15
20
25
30
1929 1934 1939 1944 1949 1954 1959 1964 1969 1974 1979 1984 1989 1994 1999 2004
Source: http://www.bea.gov/bea/dn/nipaweb/TableView.asp#Mid
8
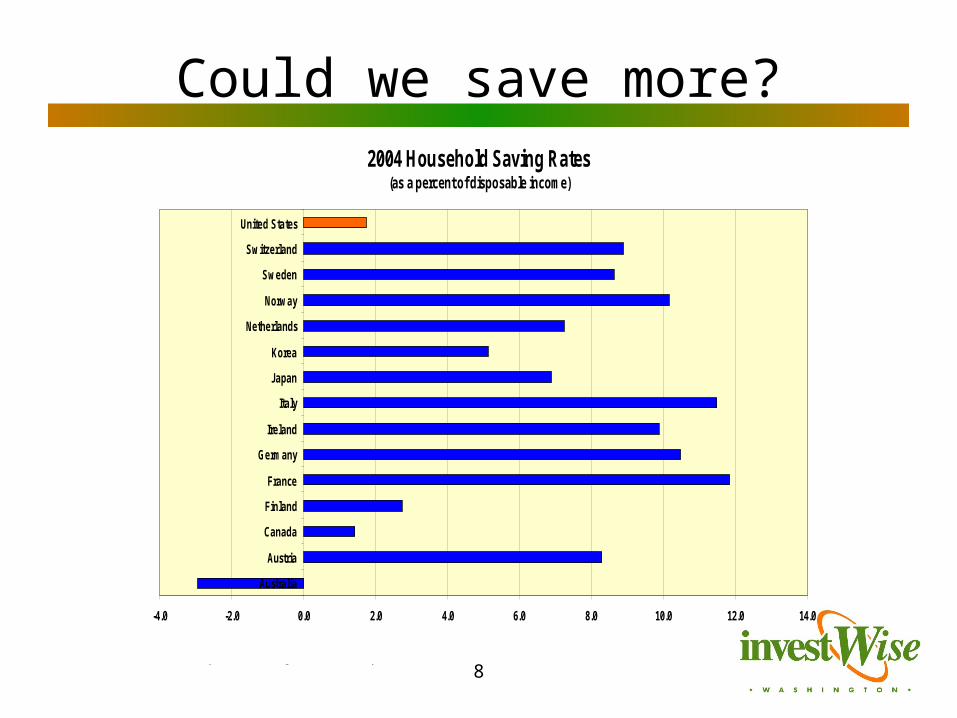
Could we save more?2004 Household Saving Rates
(as a percent of disposable income)
-4.0 -2.0 0.0 2.0 4.0 6.0 8.0 10.0 12.0 14.0
Australia
Austria
Canada
Finland
France
Germany
Ireland
Italy
Japan
Korea
Netherlands
Norway
Sweden
Switzerland
United States
http://stats.oecd.org/WBOS/default.aspx?DatasetCode=REFSERIES
9
Rule #2: If you don’t have goals, you won’t achieve them.
10
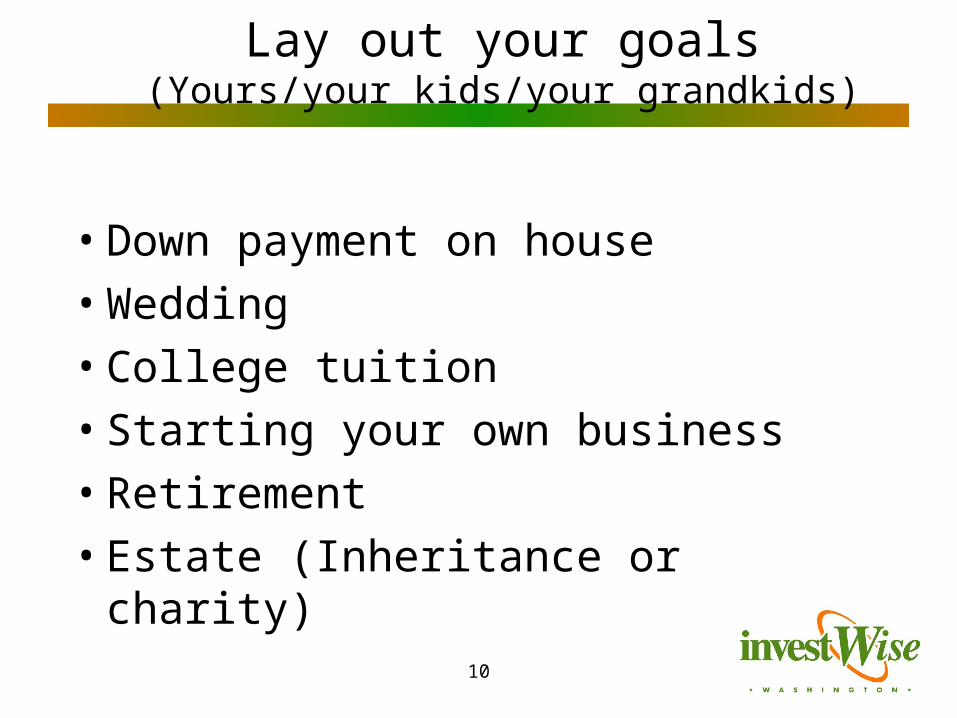
Lay out your goals(Yours/your kids/your grandkids)
• Down payment on house
• Wedding
• College tuition
• Starting your own business
• Retirement
• Estate (Inheritance or charity)
11
Rule #3: Know how to measure returns (it will make you less
susceptible to fraud.)
12
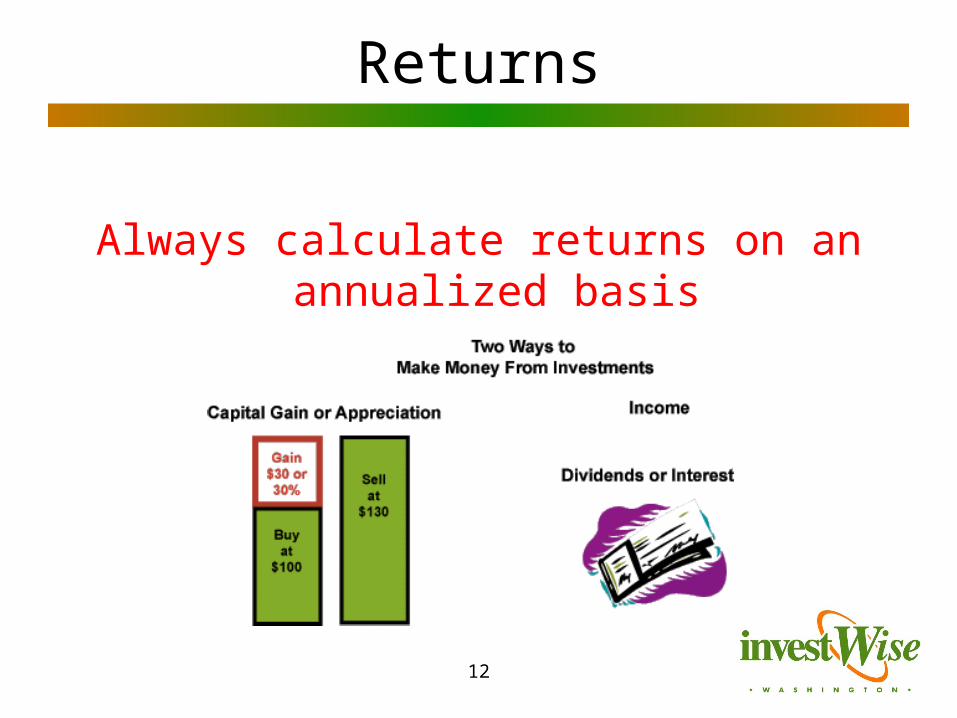
Returns
Always calculate returns on an annualized basis
13
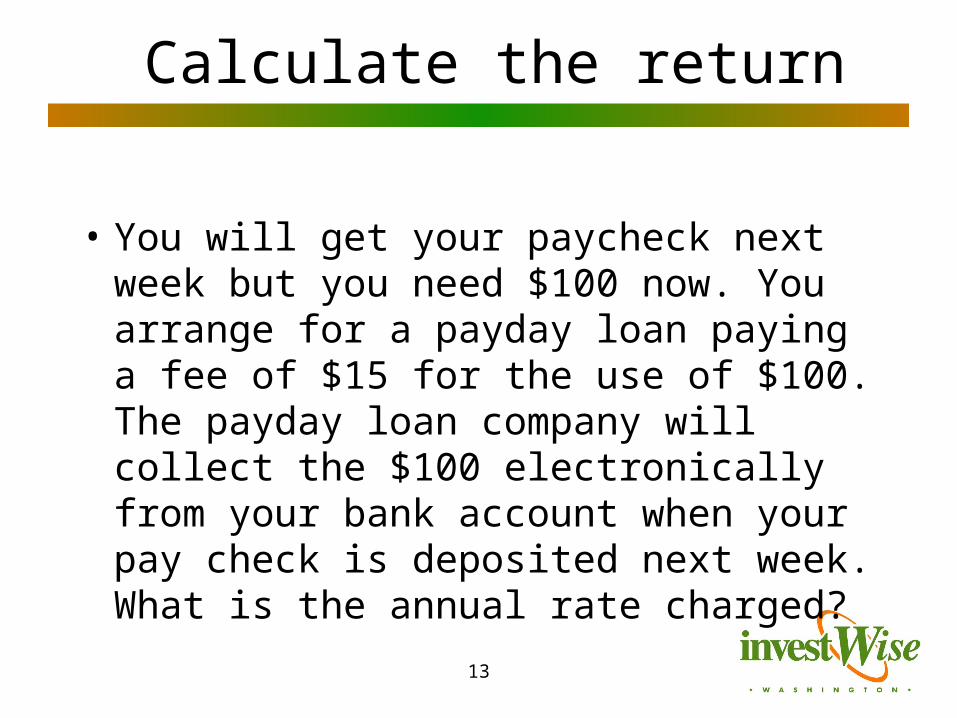
Calculate the return
• You will get your paycheck next week but you need $100 now. You arrange for a payday loan paying a fee of $15 for the use of $100. The payday loan company will collect the $100 electronically from your bank account when your pay check is deposited next week. What is the annual rate charged?
14
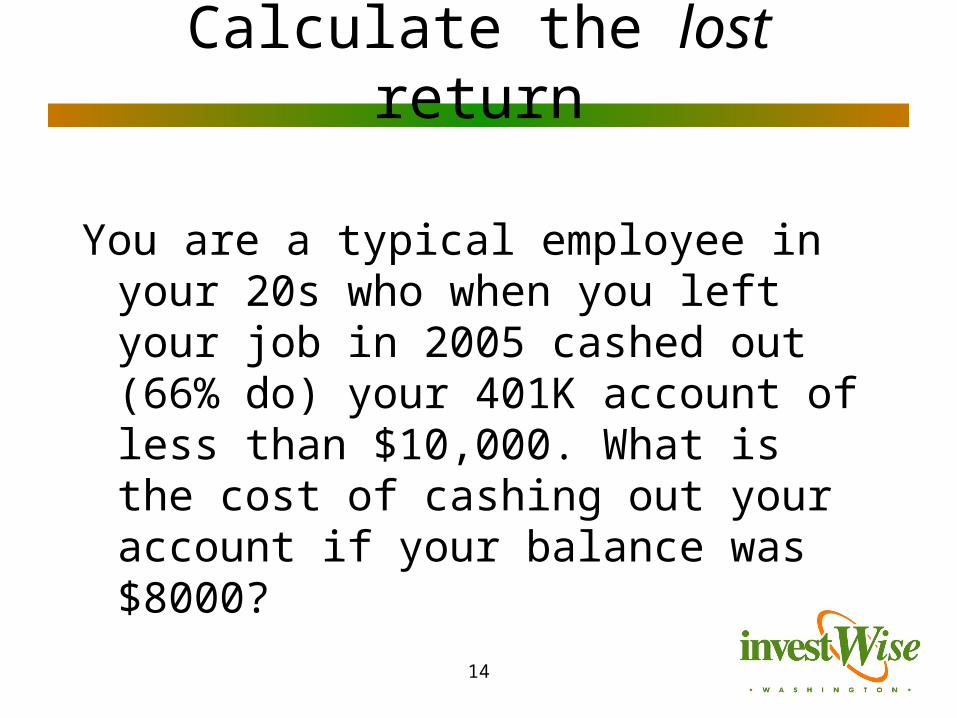
Calculate the lost return
You are a typical employee in your 20s who when you left your job in 2005 cashed out (66% do) your 401K account of less than $10,000. What is the cost of cashing out your account if your balance was $8000?
15
Rule #4: Understand risk
16
Investment Risks
• Market risk
• Business risk
• Interest rate
• Inflation risk
• Political risk
• Fraud risk
17
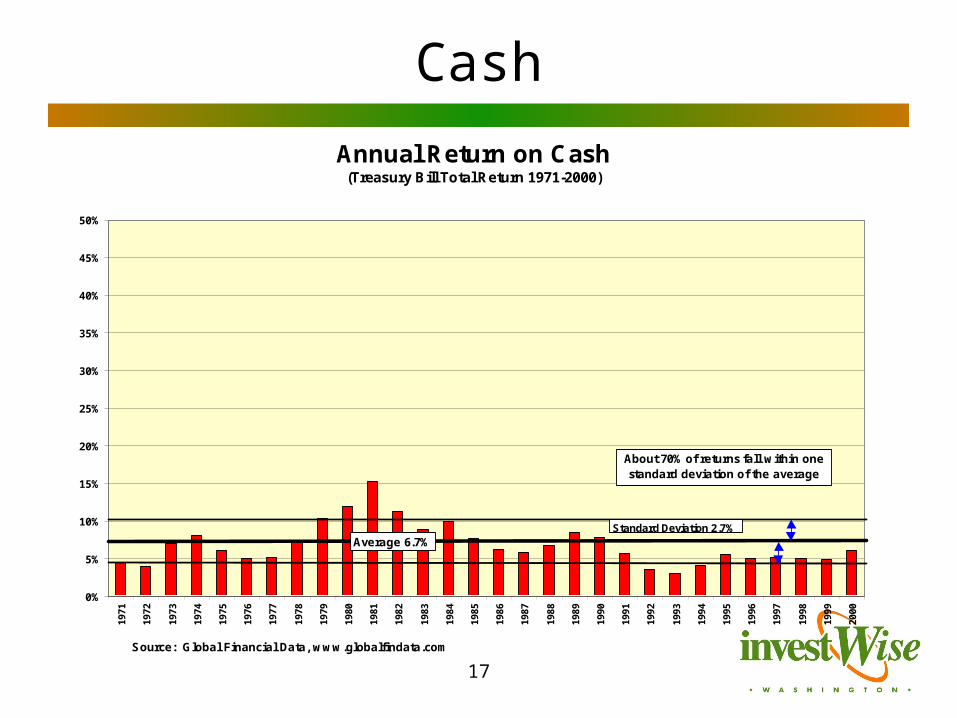
Cash
Annual Return on Cash (Treasury Bill Total Return 1971-2000)
0%
5%
10%
15%
20%
25%
30%
35%
40%
45%
50%
1971
1972
1973
1974
1975
1976
1977
1978
1979
1980
1981
1982
1983
1984
1985
1986
1987
1988
1989
1990
1991
1992
1993
1994
1995
1996
1997
1998
1999
2000
Source: Global Financial Data, www.globalfindata.com
Average 6.7%Standard Deviation 2.7%
About 70% of returns fall within one standard deviation of the average
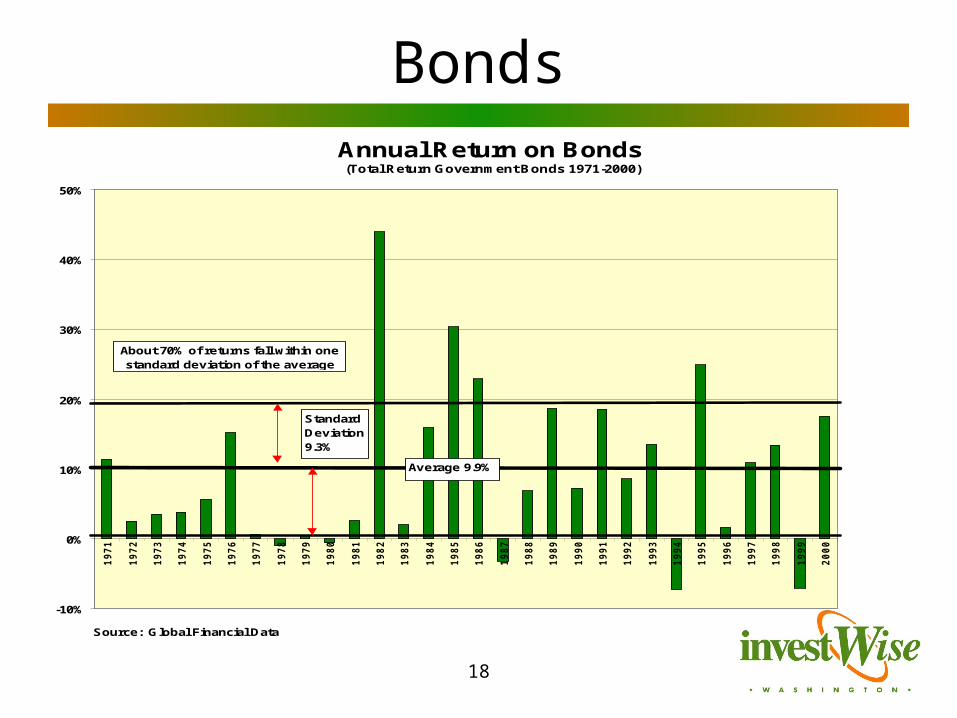
18
BondsAnnual Return on Bonds (Total Return Government Bonds 1971-2000)
-10%
0%
10%
20%
30%
40%
50%
19
71
19
72
19
73
19
74
19
75
19
76
19
77
19
78
19
79
19
80
19
81
19
82
19
83
19
84
19
85
19
86
19
87
19
88
19
89
19
90
19
91
19
92
19
93
19
94
19
95
19
96
19
97
19
98
19
99
20
00
Source: Global Financial Data
Average 9.9%
Standard Deviation 9.3%
About 70% of returns fall within one standard deviation of the average
19
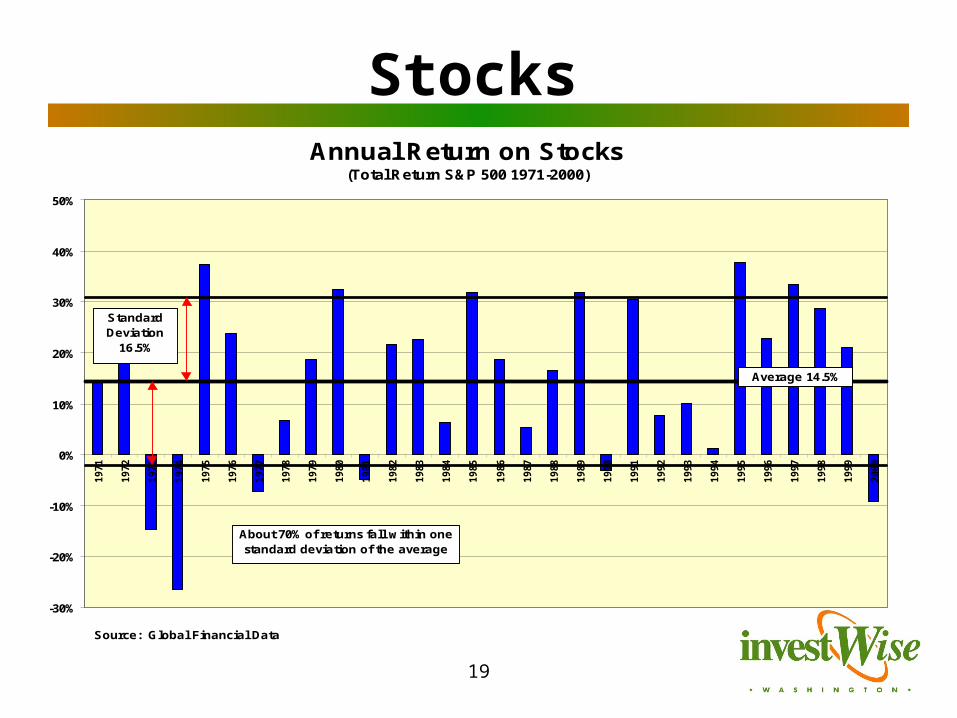
Annual Return on Stocks(Total Return S&P 500 1971-2000)
-30%
-20%
-10%
0%
10%
20%
30%
40%
50%
1971
1972
1973
1974
1975
1976
1977
1978
1979
1980
1981
1982
1983
1984
1985
1986
1987
1988
1989
1990
1991
1992
1993
1994
1995
1996
1997
1998
1999
2000
Source: Global Financial Data
Average 14.5%
Standard Deviation
16.5%
About 70% of returns fall within one standard deviation of the average
Stocks
20
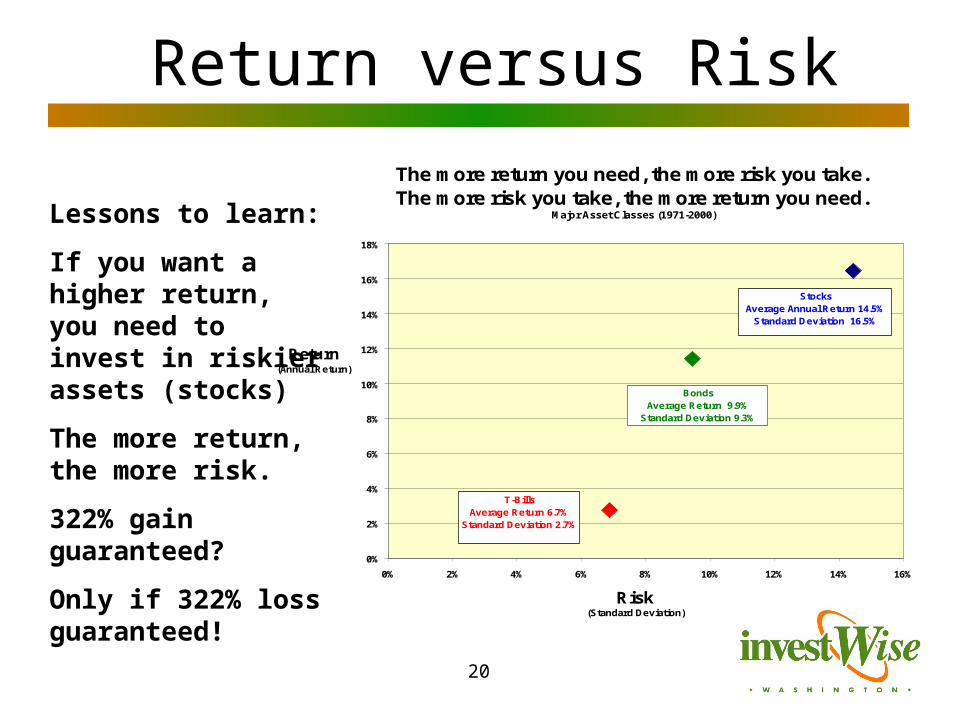
The more return you need, the more risk you take.The more risk you take, the more return you need.
Major Asset Classes (1971-2000)
0%
2%
4%
6%
8%
10%
12%
14%
16%
18%
0% 2% 4% 6% 8% 10% 12% 14% 16%
Risk (Standard Deviation)
Return (Annual Return)
T-BillsAverage Return 6.7%
Standard Deviation 2.7%
BondsAverage Return 9.9%
Standard Deviation 9.3%
StocksAverage Annual Return 14.5%
Standard Deviation 16.5%
Lessons to learn:
If you want a higher return, you need to invest in riskier assets (stocks)
The more return, the more risk.
322% gain guaranteed?
Only if 322% loss guaranteed!
Return versus Risk
21
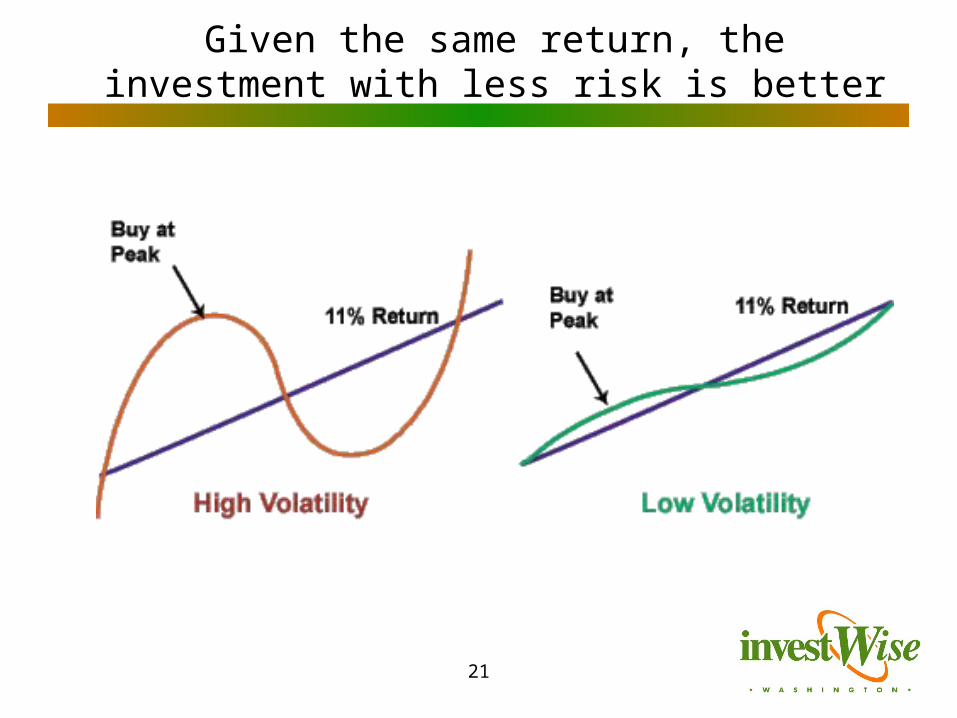
Given the same return, the investment with less risk is better
22
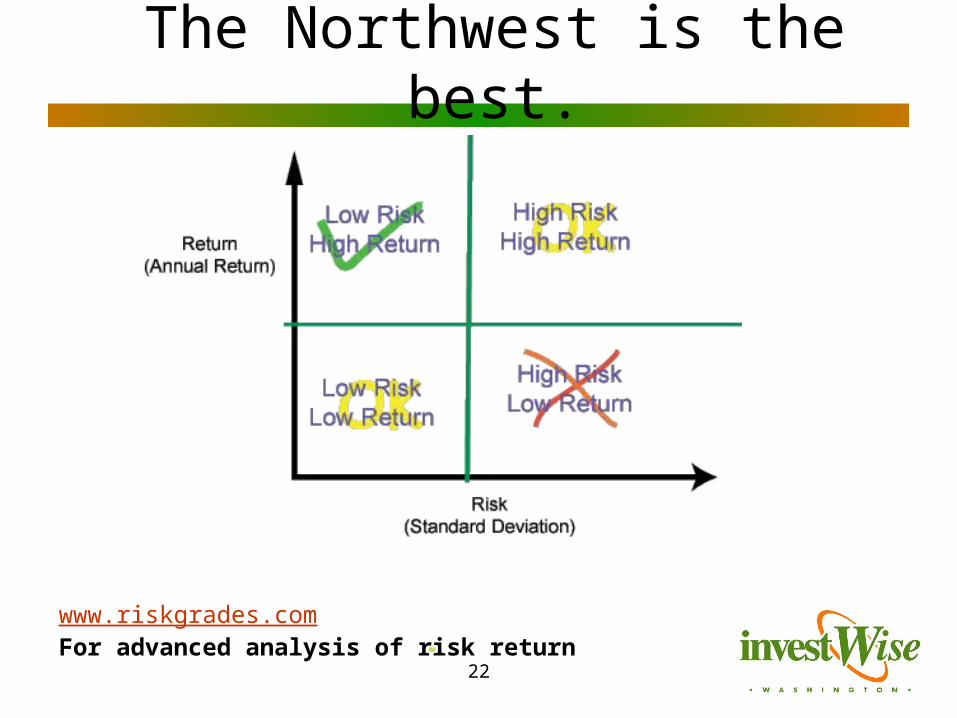
The Northwest is the best.
www.riskgrades.comFor advanced analysis of risk return
23
How do you get both a good return and low risk?
24
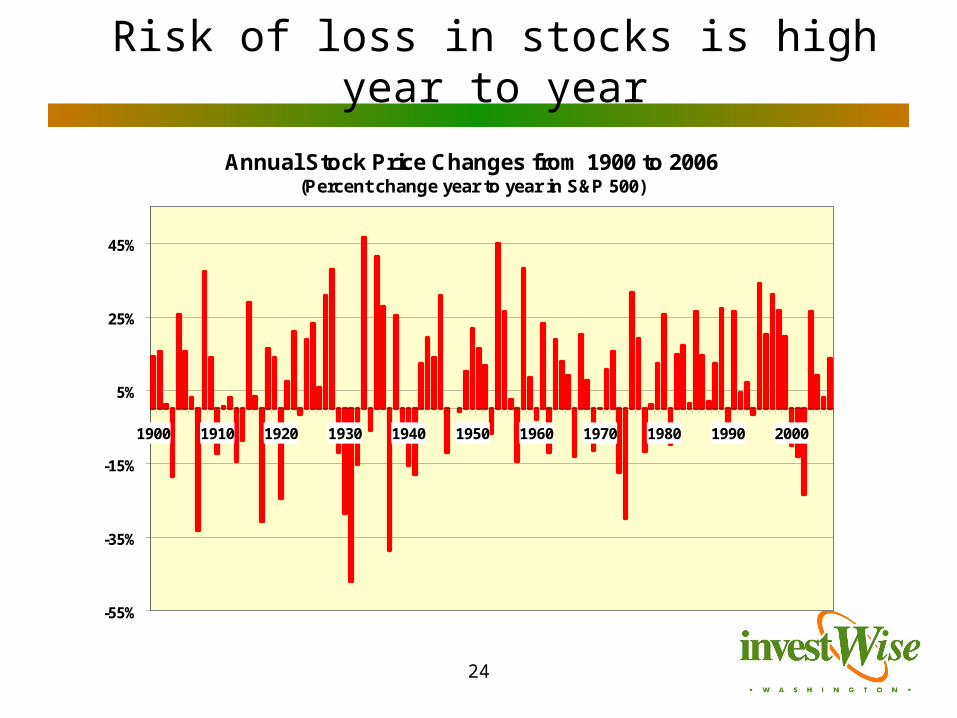
Risk of loss in stocks is high year to year
Annual Stock Price Changes from 1900 to 2006(Percent change year to year in S&P 500)
-55%
-35%
-15%
5%
25%
45%
1900 1910 1920 1930 1940 1950 1960 1970 1980 1990 2000
25
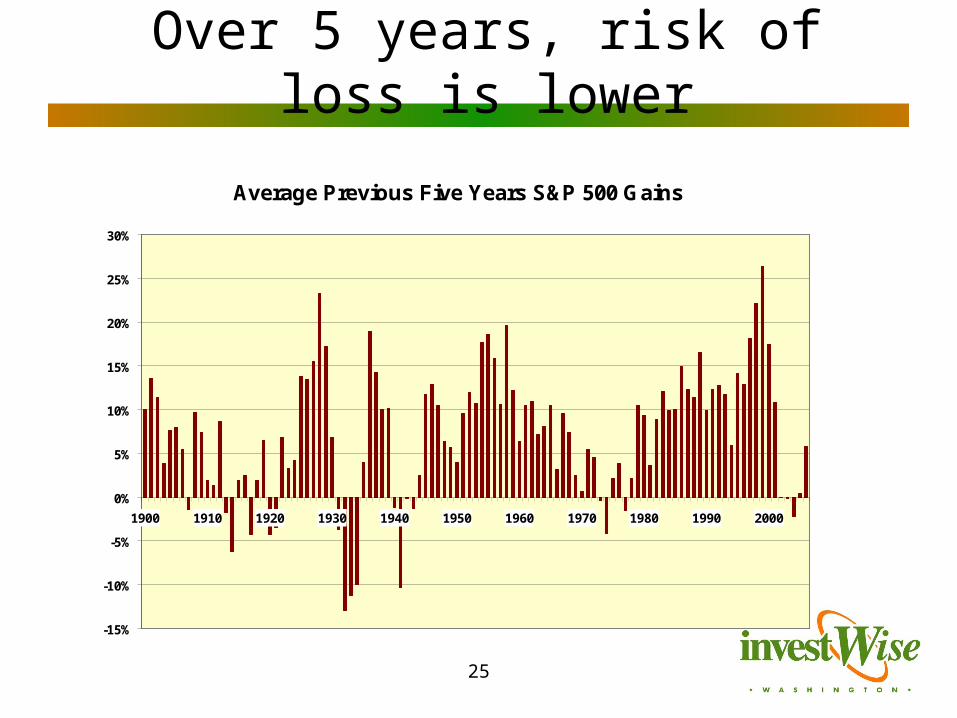
Over 5 years, risk of loss is lower
Average Previous Five Years S&P 500 Gains
-15%
-10%
-5%
0%
5%
10%
15%
20%
25%
30%
1900 1910 1920 1930 1940 1950 1960 1970 1980 1990 2000
26
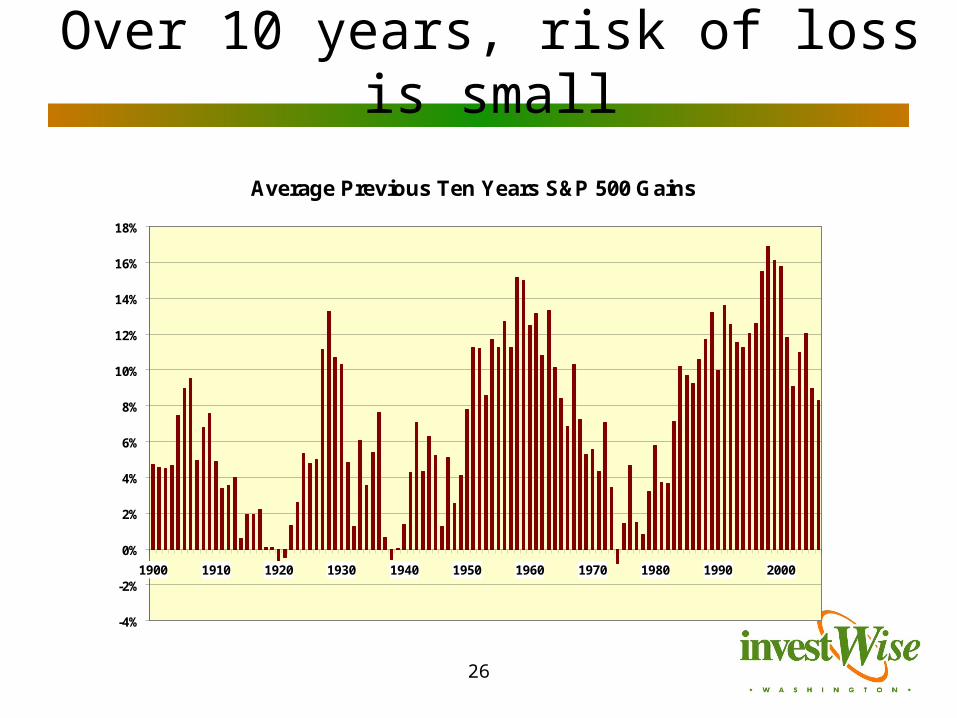
Over 10 years, risk of loss is small
Average Previous Ten Years S&P 500 Gains
-4%
-2%
0%
2%
4%
6%
8%
10%
12%
14%
16%
18%
1900 1910 1920 1930 1940 1950 1960 1970 1980 1990 2000
27
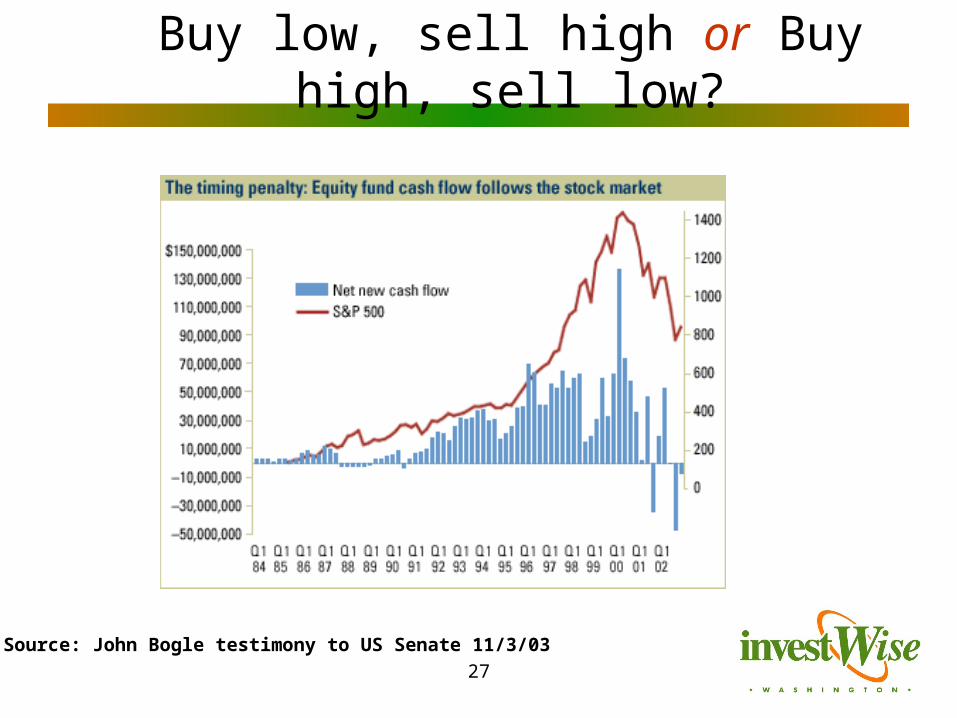
Buy low, sell high or Buy high, sell low?
Source: John Bogle testimony to US Senate 11/3/03
28
Lesson?
• Buy and hold market index funds (doesn’t work for individual stocks)
• Have an emergency fund (3 to 6 months) to tide you over
• Have other sources of income so you don’t have to cash out during down markets
29
Rule #5: Asset allocate
30
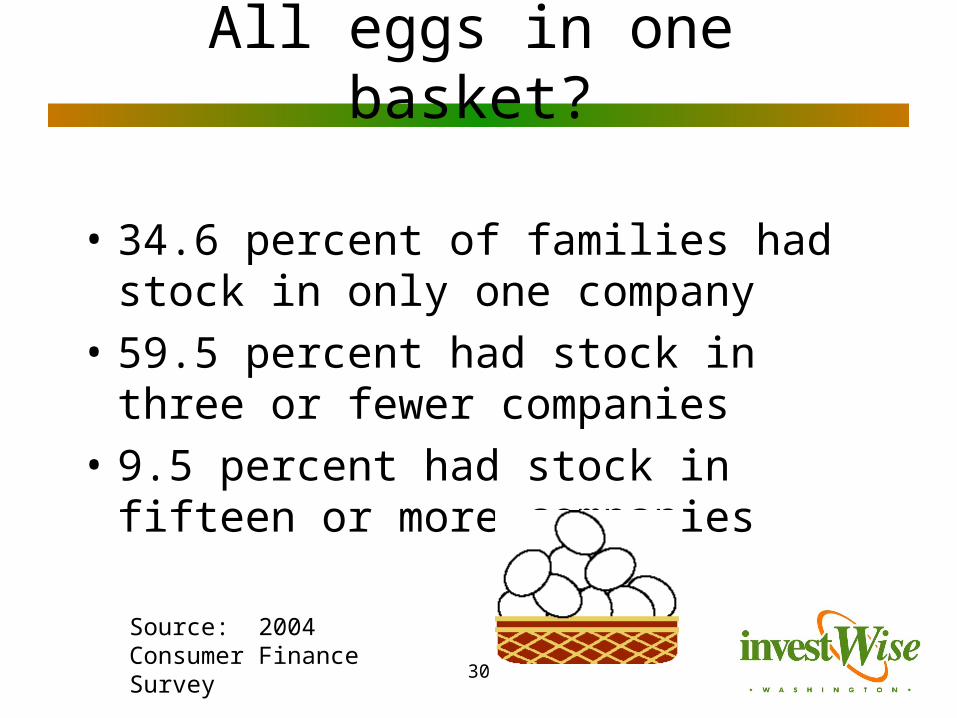
All eggs in one basket?
• 34.6 percent of families had stock in only one company
• 59.5 percent had stock in three or fewer companies
• 9.5 percent had stock in fifteen or more companies
Source: 2004 Consumer Finance Survey
31
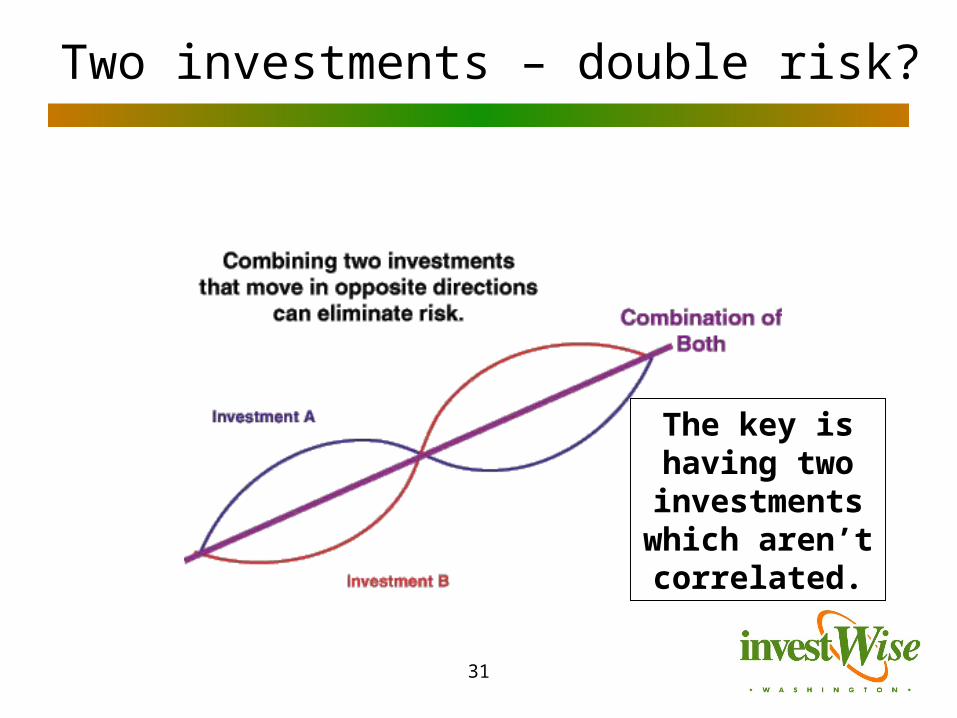
Two investments – double risk?
The key is having two
investments which aren’t correlated.
32
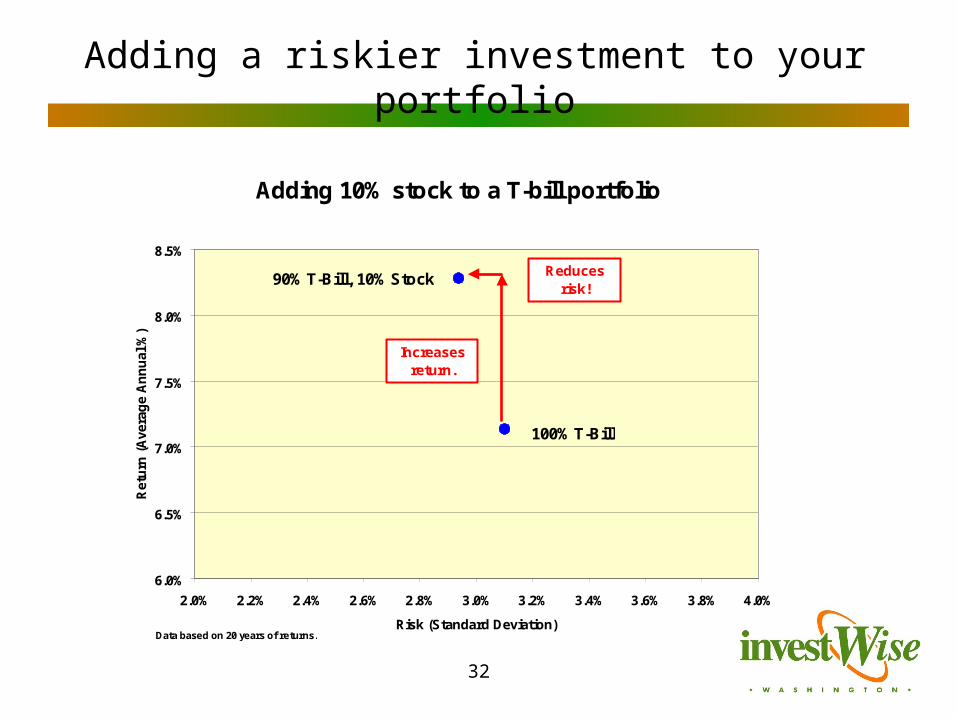
Adding a riskier investment to your portfolio
Adding 10% stock to a T-bill portfolio
6.0%
6.5%
7.0%
7.5%
8.0%
8.5%
2.0% 2.2% 2.4% 2.6% 2.8% 3.0% 3.2% 3.4% 3.6% 3.8% 4.0%
Risk (Standard Deviation)
Ret
urn
(A
vera
ge
An
nu
al %
)
90% T-Bill, 10% Stock
100% T-Bill
Increases return.
Reducesrisk!
Data based on 20 years of returns.
33
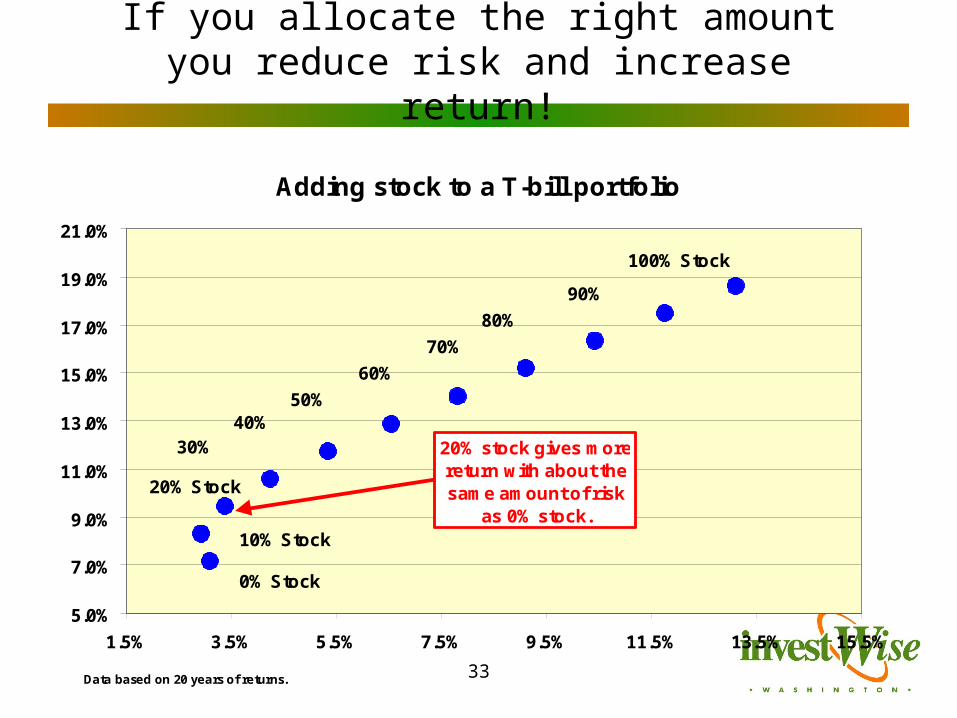
If you allocate the right amount you reduce risk and increase return!
Adding stock to a T-bill portfolio
5.0%
7.0%
9.0%
11.0%
13.0%
15.0%
17.0%
19.0%
21.0%
1.5% 3.5% 5.5% 7.5% 9.5% 11.5% 13.5% 15.5%
10% Stock
0% Stock
20% Stock
30% 40%
50%
60%
70%
80%
90%
100% Stock
Data based on 20 years of returns.
20% stock gives more return with about the same amount of risk
as 0% stock.
34
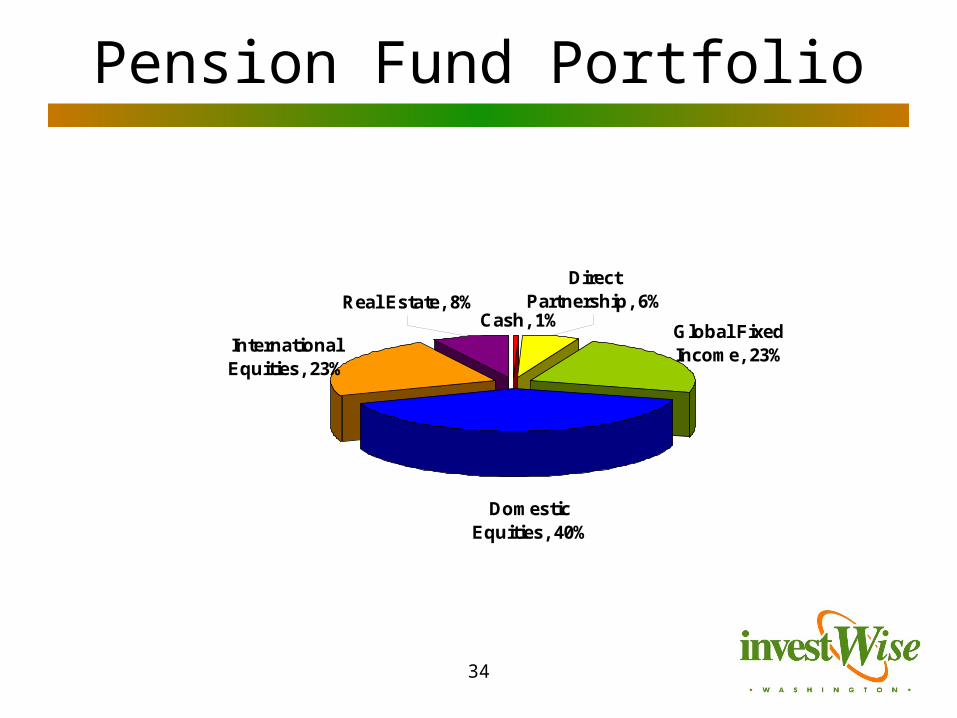
Pension Fund Portfolio
Cash, 1%International Equities, 23%
Domestic Equities, 40%
Global Fixed Income, 23%
Real Estate, 8%Direct
Partnership, 6%
California Pension System $230.3 Billion
Source: www.calpers.ca.gov Investment Portfolio Market Value as of Dec. 31, 2006
35
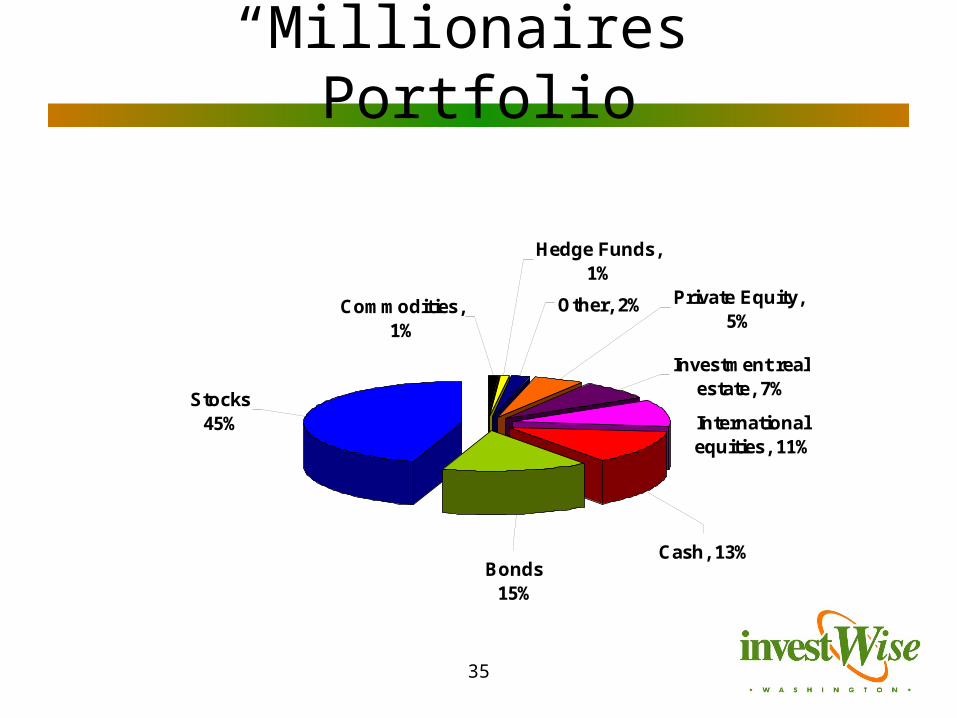
“Millionaires” Portfolio
Stocks45%
Bonds15%
Private Equity, 5%
International equities, 11%
Cash, 13%
Investment real estate, 7%
Other, 2%
Hedge Funds, 1%
Commodities, 1%
Households with investable assets
of $1 million to $10
million
Source: Fortune, 3/5/2007
36
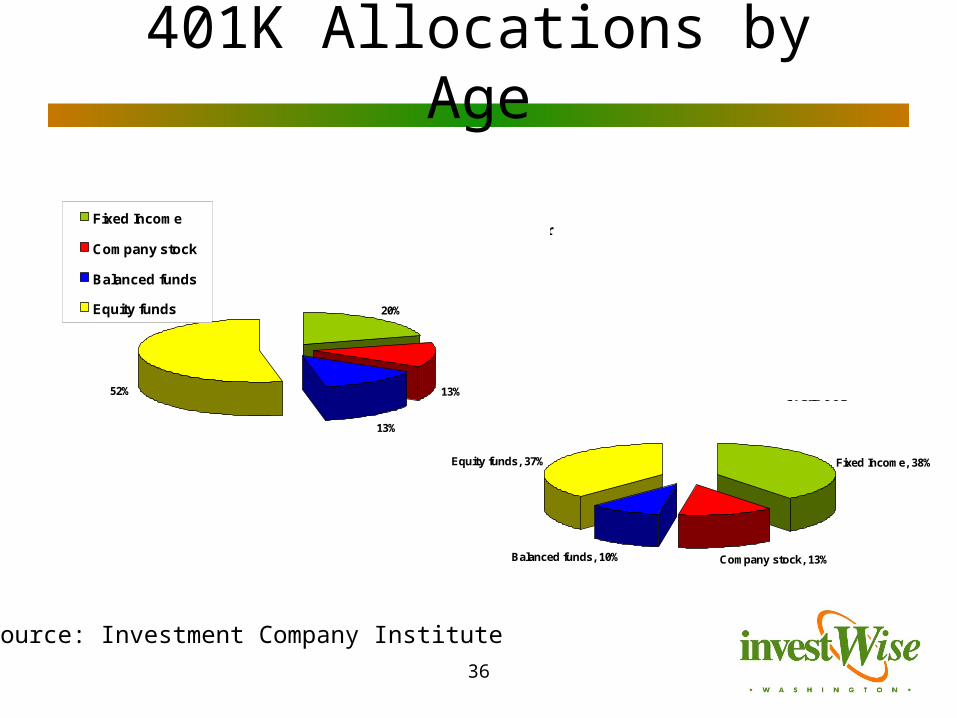
401K Allocations by Age
20%
13%
13%
52%
Fixed Income
Company stock
Balanced funds
Equity funds
Asset allocation for participants in their 20s
Fixed Income, 38%
Company stock, 13%Balanced funds, 10%
Equity funds, 37%
Asset allocation for participants in their 60s
Source: Investment Company Institute
37
Lessons learned
• Don’t try to time the market• Allocate between asset classes based
on your income requirements, your financial goals and your time horizon
• Ladder your fixed income investments• Rebalance your portfolio (at least
annually) to sell at highs and buy at lows
38
Rule # 6: Always watch your money.
39
Evaluating funds
• Fund company/manager reputation
• Fund expenses
• Past performance (asset class)
• Fund risks
For information, check out www.morningstar.com
40
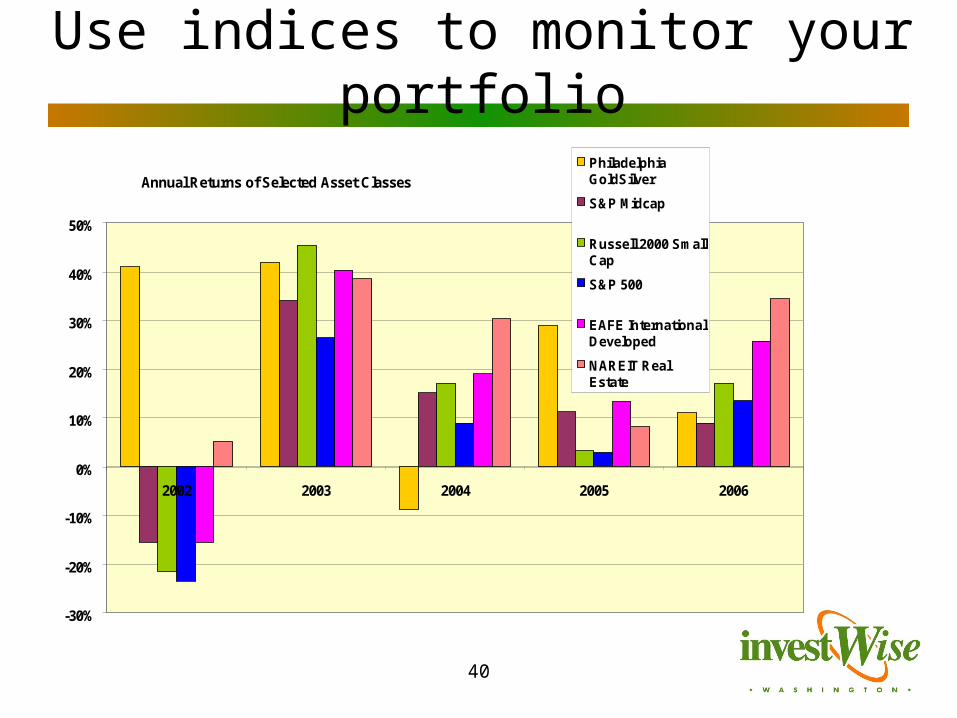
Use indices to monitor your portfolio
Annual Returns of Selected Asset Classes
-30%
-20%
-10%
0%
10%
20%
30%
40%
50%
2002 2003 2004 2005 2006
PhiladelphiaGoldSilver
S&P Midcap
Russell 2000 SmallCap
S&P 500
EAFE InternationalDeveloped
NAREIT RealEstate
41
Investment Advice
• According to the Consumer Federation about one-third of mutual fund investors rely completely on their advisors to choose investments and do not read about or research their investments
• Is this good?
42
• Spend time and take care in choosing your advisor
• Read all your statements, keep good records, and check for errors
• Only invest in what you understand (Warren Buffet rule #1)
• Assess your portfolio at least once a year against your cash requirements, financial goals and time horizon
Investment Advice
43
The Roadmap
• Save
• Focus on financial goals
• Understand returns
• Understand risk
• Asset allocation
• Monitor your investments