Embed Size (px)
Citation preview

1
Revision 2 1
Medium-range order in disordered K-feldspars by multinuclear NMR 2
Luis Sánchez-Muñoz1*, Jesús Sanz2, Isabel Sobrados2, and Zhehong Gan3 3
1Instituto de Cerámica y Vidrio (CSIC) Kelsen 5, 28049 Madrid, Spain 4 2Instituto Ciencia de Materiales de Madrid (CSIC), 28049 Madrid, Spain 5
3National High Magnetic Field Laboratory, Florida State University, Tallahassee, FL 32310, USA 6
(*Corresponding author: [email protected]) 7
8
ABSTRACT 9
The structures of K-rich feldspar (K>Na)AlSi3O8 are currently described as 10
“ideal” crystals with periodic average structures from Bragg diffraction maxima 11
obtained by reciprocal-space techniques. Polymorphism is explained by variable 12
substitutional disorder of framework Si and Al cations in tetrahedral T sites, and 13
positional disorder of cavity alkali cations in a single M site. Here, high-resolution 14
magic-angle spinning multi-nuclear magnetic resonance spectroscopy, leading to 29Si, 15
27Al and 23Na spectra at 9.4 as well as 27Al, 39K and 23Na spectra at 19.6 T, has been 16
used to investigate the “real” structures along the order-disorder series of K-feldspar 17
crystals. The “ideal” and “real” structure coincides only in the perfectly long-range 18
ordered triclinic end-member of the low microcline structure. Long-range disordered 19
structures (either with monoclinic or triclinic symmetry by X-ray diffraction) show non-20
random disorder at the medium-range scale, triclinic-like distortions with four sets of T 21
sites for framework atoms, two sets of M sites for alkali atoms, and Al-O-(K,Na) multi-22
site correlations by NMR spectroscopy. The K-feldspar structures can be described by a 23
medium-range structure using the number of Al atoms per four-membered rings of 24
tetrahedra, with “…-2-0-2-0-…“ chains for microcline and orthoclase where the Al-25
occupancies t1O > t2m > t2O ≈ t1m, and with “…-1-1-1-1-…” chains for valencianite 26

2
and sanidine, in which t1O > t2m ≈ t2O ≈ t1m. Framework cations respect Loewenstein’s 27
rule (Al-O-Al avoidance), as well as some additional constraints of charge dispersion 28
involving deficiency of Si atoms in Q4 (4Si,0Al), (1Si,3Al) and (0Si,4Al) environments, 29
which are particularly strong in valencianite. These “real” structure features cannot be 30
described by “ideal” structures owing to the lack of resolving power of the reciprocal-31
space techniques. 32
33
KEYWORDS: K-feldspars, NMR, medium-range order, valencianite, order-34
disorder series 35
36
INTRODUCTION 37
Taylor’s model of the archetypal structure of feldspars, induced from X-ray 38
diffraction (XRD) data of sanidine (Taylor 1933, Taylor et al. 1934), suggests a 39
monoclinic C2/m average symmetry if the framework of tetrahedra is idealized in a 40
topology where the actual occupancy of T sites by Si and Al atoms is disregarded. The 41
structure consists of three-dimensionally linked SiO4 and AlO4 tetrahedral units with 42
two crystallographically non-equivalent tetrahedral sites, T1 and T2. The T sites form 43
double crankshaft chains of four-member rings, replicated by mirrors parallel to (010). 44
The alkali cations, located at a single M site inside an irregular cavity, ensure local 45
electrostatic (ionic) neutrality. Immediately thereafter, Barth (1934) proposed an order-46
disorder relationship in the Si, Al distribution of the T sites to explain the structural 47
diversity of K-feldspar in Nature. Subsequent structural refinements (see Taylor 1965, 48
for an early review) confirmed this hypothesis when site occupancies are correlated with 49
mean T-O distances. As Si and Al atoms have similar X-ray scattering factors, it is 50
impossible to refine site occupancies using X-ray data (Smith 1954). Sanidine was 51
3
regarded as the high-temperature phase having completely random disorder, whereas 52
orthoclase is seen to be partially ordered, with preferential segregation of Al atoms into 53
the T1 sites. Further Si/Al ordering can produce microcline, the low-temperature phase, 54
with a lowering of the symmetry from C2/m to C-1, and a distortion of the unit-cell 55
shape. The four T sites are labeled T1O, T1m, T2O and T2m, with the Al atoms 56
concentrated in the T1O site and Si occupying three other sites (Megaw 1956). The Al-57
occupancies Al/(Al+Si) of the T sites, denoted as t1O, t1m, t2O and t2m, allows the 58
distinction between low microcline where t1O = 1.0 and t1m = t2O = t2m = 0.0 and 59
intermediate microcline where t1O > t1m > t2O = t2m (Ribbe 1983). It has been 60
suggested that in the K-feldspars alkali atoms may have positional disorder along the 61
order-disorder series, occupying slightly different positions around a single M site (see 62
discussions by Megaw 1959 and Ribbe 1994, p. 21-24). 63
64
The description of crystal structures of K-feldspar in terms of time and space 65
averages derived from Bragg diffractions in reciprocal-space techniques as “ideal” 66
crystal structures, and the calculation of the degree of Si/Al order from T-O distances, 67
have some weaknesses. That approach ignores the omnipresent X-ray diffuse scattering 68
(Laves 1950) arising from structural modulations in orthoclase (McConnell 1965) and 69
from intrinsic distortions of the framework due to different sizes of the AlO4 and SiO4 70
tetrahedra in sanidine (Pleger 1996). Random disorder in sanidine has not been 71
demonstrated from average T-O distances induced by more recent determinations by 72
XRD (Scambos et al. 1987; Kimata et al. 1996b) or neutron diffraction determinations 73
(Brown et al. 1974). The lattice model for orthoclase with an average monoclinic 74
symmetry is inconsistent with the local triclinic structure detected by other techniques 75
(McLaren and Fitz Gerald 1987; Sánchez-Muñoz et al. 1998), as first indicated by 76

4
Laves and Goldsmith (1961). In addition, it is impossible to determine the exact Al 77
occupancy of disordered Na-feldspars only on the basis of T-O bond distances, as the T 78
sites have intrinsically different T-O bond lengths (Winter et al. 1979). This finding 79
calls into question the usefulness of the approach in this family of minerals. The effect 80
of alkali atoms (as only one M site is invoked), as well as possible strain effects 81
(Eggleton and Buseck 1980) and the importance of the size of domains or twins to 82
produce coherent diffraction (Ribbe 1983), also must be considered. 83
84
Available nuclear magnetic resonance (NMR) data for K-feldspars (Laves and 85
Hafner 1962; Lippmaa et al. 1980; Smith et al. 1984; Kirkpatrick et al. 1985; Sherriff 86
and Hartman 1985; Phillips et al. 1988; Zhou et al. 1994 and 2001; Xiao et al. 1995; 87
Sánchez-Muñoz et al. 1998 and 2006a; Anbalagan et al. 2009) have supported the Si/Al 88
order-disorder hypothesis partially. In particular, the NMR parameters of monoclinic K-89
feldspars do not correlate well with site occupancies determined by XRD (Xiao et al. 90
1995). Most of the available NMR studies have been performed at low fields using 91
rather few samples, with limited characterization. The more disordered states have been 92
investigated in much less detail than the ordered counterparts, owing to lack of 93
sufficient spectral resolution. Data from the 29Si and 27Al spectra have not been 94
correlated with those from the 39K and 23Na spectra along the order-disorder series. 95
Moreover, disordered states having a triclinic symmetry (Chaison 1950; Laves 1950), 96
termed valencianite by Akizuki and Sunagawa (1978), have been disregarded in most 97
NMR investigations. In addition, 39K spectra are difficult to obtain because of the low 98
sensitivity and large quadrupolar coupling associated with highly asymmetric sites, 99
particularly in disordered structures. 100
101

5
In this paper we address the above questions by means of multinuclear NMR 102
analysis at 9.4 and 19.6 T using specimens very similar to those characterized by X-ray 103
methods in the literature to build up the conventional order-disorder model. The “real” 104
structures are investigated to evaluate the hypotheses that: 1) the Si, Al occupancies in 105
the framework T sites cannot be investigated independently of the distribution of alkali 106
cation in the M split-sites in the cavity, 2) a quasi-triclinic local symmetry exists along 107
the order-disorder series, and 3) the type of K-feldspar can be described with a specific 108
polyatomic arrangement at the medium-range length scale, inaccessible with the 109
resolving power of XRD techniques. 110
111
THE K-FELDSPARS 112
Table 1 indicates the chemical composition, provenance and host of the thirty 113
three natural specimens and synthetic samples of feldspars used in this work, including 114
selected K-feldspar specimens well known in literature, a sample with stoichiometric 115
KAlSi3O8 composition from hydrothermal crystallization at high temperatures and high 116
pressure (sample 7294), and three samples from ion-exchanged experiments using 117
previous natural specimens as starting materials to obtain K-feldspar with composition 118
close to KAlSi3O8 in a range of order-disorder states (samples K-ASGS, K-EU2 and K-119
713r*). A crystal of Na-feldspar (specimen CLBR) was included. Most specimens are 120
gem-quality materials in terms of transparency and uniformity at the optical scale, and 121
display a single structural state in their XRD patterns. The terms used in this work 122
include the recommendations of the International Mineralogical Association (IMA) to 123
designate mineral species (Barth 1934), including microcline (MI), orthoclase (OR) and 124
sanidine (SA). However, the term “valencianite” (VA) is needed to refer to some K-125

6
feldspar samples that cannot be labelled with the previous names; see Smith (1974) for 126
an extended review of nomenclature. 127
128
Microcline 129
Specimen 11924 is close to that used by Blasi et al. (1984a) for the structure 130
determination of the low microcline end-member. Specimen 9544 has a XRD pattern 131
very close to that of low microcline but shows regular Albite-Pericline twinning at both 132
the optical and transmission electron microscopy (TEM) scales (Sánchez-Muñoz et al. 133
2012). Specimens 176 and 116 show heterogeneous optical extinction and “irregular 134
twinning” (as described by Bambauer et al. 1989) at the TEM scale (Sánchez-Muñoz et 135
al. 2006a). They correspond to the intermediate microcline XRD variety of Ribbe 136
(1983). Specimen FB4 shows a heterogeneous diffraction pattern with broad (hkl), (hk0) 137
and (0kl) peaks, indicating a triclinic structure with low obliquity. 138
139
Orthoclase 140
Orthoclase can form from high-temperature precursor like sanidine (normally 141
with a high content of Na in solid solution), or at much lower temperatures in 142
hydrothermal veins as crystals of adularia (with lower Na contents in solid solution). 143
Because exsolution of the original feldspars takes place simultaneously with local 144
ordering during slow cooling, a low Na content reduces the contribution of Na-feldspar 145
impurities to the K-feldspar spectra, improving the experimental resolution. Thus, 146
crystals of adularia were selected instead of plutonic or metamorphic grains. The typical 147
“tweed” pattern in our specimens (Table 1) and the associated orthogonal diffuse streaks 148
in the [001] zone axis of selected-area electron diffraction (SAED) patterns, were 149
studied by TEM by Sánchez-Muñoz et al. (1998), including the specimen ASGS from 150
7
Saint Gotthard, Switzerland, similar to that originally studied by McConnell (1965), in 151
which the tweed pattern was first noted. Our orthoclase specimens have a higher Na 152
content in solid solution than the valencianite specimens, and negligible content of the 153
anorthite component. 154
155
Valencianite 156
Specimens of valencianite are defined by the characteristics described in 157
Chaison (1950), Laves (1950) and Akizuki and Sunagawa (1978): triclinic symmetry 158
with low obliquity on the basis of optical and diffractometric data, very low Na content 159
in solid solution (Table 1), and the lack of tweed or twin microstructures at the TEM 160
scale, as well as absence of diffuse streaks in SAED patterns. This variant indicates a 161
particularly low temperature of crystallization, and thus, the triclinic character must be 162
formed during crystallization at a temperature lower than the monoclinic-triclinic 163
transition. In contrast, microcline almost invariably shows some residual twinning from 164
the phase transformation of a monoclinic high-temperature precursor. Specimen AGM, 165
from “Valenciana mine” in Guanajuato, Mexico, is very uniform and has the highest 166
obliquity (γ = 89.74º) of our specimens. Specimen 1407 can be considered valencianite 167
on the basis of chemical and microstructural features (as well as from the NMR data), 168
but no peak splitting in (hkl), (hk0) and (0kl) reflexions was detected. This specimen is 169
therefore similar to adularia from Hishikari, Japan (Zhou et al. 2001). 170
171
Sanidine 172
The specimens used in this work are single crystals separated from glass 173
material of felsic volcanic rocks, except specimen RABB, from a subvolcanic granitic 174
pegmatite (O’Brient 1986, Keefer and Brown 1978). Specimens RABB and SBKS have 175

8
well developed submicroscopic albite films from partial exsolution. The other 176
specimens of sanidine do not show any evidence of exsolution. Additional features of 177
specimen EU2 can be found in Sánchez-Muñoz et al. (2007). Specimens SVNI-1 and 178
SVNI-2 are analogous to the one used by W.H. Taylor in 1933 in the first X-ray 179
determination of the structure of sanidine. Specimen 713r is also comparable to that 180
used in some other crystal-structure determinations (Brown et al. 1974; Kimata et al. 181
1996a and 1996b). 182
183
Synthetic samples 184
Ion-exchange experiments were conducted with orthoclase ASGS and sanidine 185
EU2 to obtain samples with pure KAlSi3O8 composition as K-ASGS and K-EU2. 186
Because valencianite invariably has a low content of Na in solid solution, no ion-187
exchange experiments were done in this case. Fine powders of the selected specimens 188
were mixed with molten KBr at 825°C for 30 hours. In addition, the same experiments 189
were performed at higher temperatures for specimen 713r to obtain sample K-713r* at 190
1050 ºC for 15 hours. In all cases, the ion-exchange products showed XRD pattern 191
compatible with a monoclinic structure, as the original material had, i.e. no departure in 192
the monoclinic symmetry was detected by XRD because of ion-exchange experiments. 193
Sample 7294 was synthesized at 725 ºC and 3 kbars for 168 h from a H2O- 194
oversaturated melt of KAlSi3O8 composition and with KF and AlF3 additions as 195
mineralizers, in the Institute des Sciences de la Terre d’Orléans (CNRS, France), with 196
the help of Prof. François Delbove. 197
198
199
200

9
EXPERIMENTAL METHODS 201
Chemical analysis 202
Spatially resolved quantitative chemical analysis of the major elements Si, Al, 203
Na, K and Ca were performed by electron microprobe analysis (EMPA). We carried out 204
an average of five or six analyses per sample, using a point-counting technique to obtain 205
information on the chemical homogeneity, in a SX-50 instrument by Mr. Olivier Rouer 206
in Institute des Sciences de la Terre d'Orléans (ISTO) in CNRS (France). Natural K-rich 207
and Na-feldspars as well as synthetic pure K- and Na-feldspars (also synthesized at 208
ISTO) were used as chemical standards, which were previously analyzed by the electron 209
probe in several experimental conditions to get the maximum signal and minimum loss 210
of Na. The spot diameter of the probe was circa 1 μm. The final operating conditions 211
were 15 kV and 25 nA. A ZAF software was used for the correction of the matrix 212
effects. The chemical compositions was expressed as OrxAbyAnz (x+y+z = 100) (Table 213
1), with Or, Ab and An expressing the molar content of KAlSi3O8, NaAlSi3O8 and 214
CaAl2Si2O8 components in solid solution. Only some specimens of sanidine show an 215
appreciable Ca content. 216
217
Nuclear Magnetic Resonance. 218
High-resolution 29Si, 27Al and 23Na magic angle spinning (MAS) NMR spectra 219
were recorded at 79.49, 104.23 and 105.80 MHz (9.4 T magnetic field), by spinning the 220
sample at the magic angle (54°44'') using a Bruker Avance 400 spectrometer equipped 221
with a Fourier transform unit of the Instituto de Ciencia de Materiales de Madrid 222
(CSIC) in Spain. The samples were spun in the range of 4000 to 20000 Hz. The pulse 223
lengths are 4, 2, and 2 μs; the recycle delays are 1800, 5 and 5 s; and the rf field are 60, 224
50, 50 kHz, respectively for the 29Si, 27Al and 23Na nuclei, to get a maximum in the 225

10
intensity of the experimental signal. Recycle-delay times for 29Si spectra were tested for 226
values between 60 and 1800 seconds in samples with different structural state and 227
chemical compositions to avoid saturation effects in the 29Si signals. Crystals from 228
volcanic rocks show iron impurities in T sites at the ppm scale, and a recycle time of 60 229
seconds was sufficient to obtain the 29Si spectra. However, crystals formed at low 230
temperatures do not show such paramagnetic impurities, and the best results were 231
obtained for 1800 second relaxation delays. Therefore, in order to get appropriate 232
comparison of the NMR spectra of the whole set of specimens and samples, 1800 233
seconds were used in all cases. The number of accumulations was 200 for Al, and 50 for 234
Si and Na signals. 235
236
High-resolution 27Al, 39K and 23Na spectra magic angle spinning (MAS) NMR 237
spectra were acquired also at 216.14, 38.89 and 219.42 MHz (19.6 T magnetic field), 238
using an 830 MHz Bruker DRX NMR spectrometer at the National High Magnetic 239
Field Laboratory (NHMFL) in Tallahassee, Florida, USA. Spectra were recorded with a 240
4 mm home-built MAS probe at 10 kHz sample spinning. The pulse lengths are 0.75, 2, 241
0.75 μs; the recycle delays are 2, 1, 2 s; and the rf field are 70, 50, 70 kHz, respectively 242
for the 27Al, 31K and 23Na nuclei. The number of accumulations was 128 for 27Al, and 243
1024 for 23Na signals, and between 3712 scans (e.g. in specimen 116) and 65536 scans 244
(e.g. in specimen 11924) for 39K. 245
246
Chemical shifts are reported in ppm relative to external references at room 247
temperature, specifically, to tetramethylsilane (TMS) for 29Si, 1 M AlCl3 aqueous 248
solution for 27Al, KBr for 39K and 1 M NaCl aqueous solution for 23Na spectra. The 249
mean error in the measured chemical shift of the NMR components was approximately 250

11
1 ppm for 29Si, 27Al and 23Na spectra, and circa 10 ppm for 39K spectra. Kaolinite, KBr 251
and Na2HPO4 were used as samples to calibrate the pulse widths for 27Al, 39K and 23Na, 252
respectively. 253
254
The 29Si signals (I = 1/2) were analyzed by comparison of experimental curves 255
with simulated profiles using Gaussian components for the different crystallographic 256
sites in distinct crystallochemical environments, with identical linewidths, and variable 257
intensities related to the Si, Al occupancies of the T sites. There is no physical basis for 258
assigning identical linewidths to geometrically different sites in distinct chemical 259
environments in the simulation of a single spectrum. However, we limited the number 260
of fit parameters to a minimum, mainly chemical shifts and relative areas (or intensities) 261
in the deconvolution of spectra. Additional difficulties come from the lack of 262
information about chemical shifts for the Al ↔ Si substitutions in the second-263
coordination sphere, as well as the effect of K and Na atoms. Finally we chose 4.85 ppm 264
as a shift between Si(nAl) and Si([n+1]Al) peaks for all the simulations, a value 265
compatible with other NMR studies of aluminosilicates with tectosilicate structures 266
(e.g., Klinowski et al. 1982; Phillips and Kirkpatrick 1995; Xiao et al. 1995); its use 267
allows the reproduction of the main spectral features of most K-feldspars. 268
269
The 27Al, 39K and 23Na NMR spectra were fitted with Bruker WINFIT and 270
DM2011 (Massiot et al. 2002) software, to calculate the quadrupolar constants CQ, the 271
asymmetry factor η and the linewidth of each component. Where the second-order 272
quadrupolar effects are visible in the central transition, the chemical shift and the 273
quadrupolar constant were determined from the fitting of the central transition profile. 274
An estimation of the second-order quadrupolar correction to the chemical shift was 275
12
obtained from the displacement of the center of gravity with external magnetic field 276
from 9.4 to 19.6 T, using the SORGE diagram of Massiot et al. (1995). Where a single 277
magnetic field was used and the second-order quadrupolar effects are not visible, the 278
values of chemical shift cannot be determined. 279
280
X-ray diffraction patterns 281
The feldspars were studied by powder XRD patterns to identify the mineral 282
species and varieties using an INEL CPS 120 instrument with Co Kα1 radiation at 30 283
kV and 25 mA, with Si as an internal standard. Spectra were recorded at 0.3º /min with 284
2º slits on samples placed in turning glass capillary tubes with a diameter of 0.50 mm. 285
With these patterns, the K-feldspars were identified (last column in Table 1) using XRD 286
data from Blasi (1984), Blasi et al. (1984b) and Kroll et al. (1986). 287
288
Eleven specimens and samples of K-feldspars, belonging to one of the four types 289
listed in Table 1, were selected to obtain unit-cell parameters using Rietveld refinement 290
by means of the whole-pattern decomposition or profile-matching method (Table 2). 291
The procedure is known as the LeBail fitting (LeBail et al. 1988, Rodriguez-Carvajal 292
1993), using the FULLPROF (Rodríguez-Carvajal 2001) and the WinPLOTR software 293
(Roisnel and Rodriguez-Carvajal 2001). This method does not require any structural 294
information except approximate unit-cell dimensions and resolution parameters. These 295
particular patterns were obtained using a Philips PANalytical X’Pert PRO MPD Alfa1 296
diffractometer. Incident X-ray radiation was produced with a PW 3373/10 Cu LFF 297
DK175180 instrument, with Cu Kα1 radiation at 45 kV and 40 mA. XRD patterns were 298
recorded between 4.0 and 130.0 º2θ, with a step size of 0.008º in a continuous scan 299
mode, using a Ge monochromator (Inc Beam 1xGe111 Cu/Co), a X’Celerator RTMS-300

13
type detector, and a X’Pert program for data collection. Cell parameters were used to 301
obtain order parameters, specifically Σt1 (t1O + t1m) and Σt2 (t2O + t2m) using formulas 302
of Kroll and Ribbe (1987), to classify the K-feldspar specimens and samples as XRD 303
varieties (Ribbe 1983). With this study, the IMA-approved mineral species (Table 1) 304
were correlated with the XRD varieties (Table 2), except for “valencianite” specimens, 305
in which the triclinic character derived from cell angles is not correlated with order-306
disorder based on unit-cell dimensions (see Smith 1974, for additional discussion about 307
K-feldspar nomenclature). Hence, as a whole, these materials do not correlate well with 308
the paradigmatic sequence of K-feldspar formation on cooling, in the sequence sanidine 309
→ orthoclase → microcline. In particular, specimen AGM has the sharpest peak 310
splitting from obvious triclinic character and shows the most disordered structure on the 311
basis of cell dimensions, with the lowest Σt1 value (Table 2). On the other hand, 312
specimen 1407, with a relatively high Σt1 value, shows no evidence of the splitting of 313
peaks as expected from a sharp monoclinic lattice. 314
315
RESULTS AND SPECTRAL SIMULATIONS 316
29Si MAS NMR spectra 317
In Figures 1 to 4, we summarize representative 29Si spectra of the K-feldspar 318
samples studied. Tables 3 and 4 (and Table 5 and 6 in supporting information online) 319
show the peak positions and intensities used in the spectral simulations of alternative 320
models. In all cases, the specific intensities of peaks for each T site with the variable 321
chemical environment were calculated assuming a fixed Si:Al ratio equal to 3:1 and Al-322
O-Al avoidance (Loewenstein’s rule: Loewenstein 1954), using the expressions of Xiao 323
et al. (1995), but in the following tetrahedral environments: the T1O site is surrounded 324
by 1 T1m, 1 T1O and 2 T2m sites; the T1m by 1 T1O, 1 T2m and 2 T2O; the T2O by 1 325

14
T1O, 1 T2m and 2 T1m; and finally the T2m by 1 T1m, 1 T2O and 2 T2O. The chemical 326
shift difference between the peaks for Si(nAl) and Si(n+1Al) environments was 327
assumed to be +4.85 ppm in all cases. The relationship between the peak intensity Ix in 328
% and the Al occupancy tx is given by tx = 1 – 3(Ix/100). With these basic assumptions, 329
the main spectral features of most K-feldspars can be reasonably explained. 330
331
Two contrasting types of 29Si spectra were observed. Microcline, orthoclase, 332
valencianite and sanidine (when it is close to the KAlSi3O8 composition, either from 333
K→Na ion-exchange of natural Na-rich sanidine or by stoichiometric crystallization in 334
hydrothermal experiments) have spectra with three maxima at -95.0 ± 0.3, -97.6 ± 0.3 335
and -100.8 ± 0.5 ppm, and some additional lateral shoulders (Figs. 1, 2 and 3). 336
However, natural sanidine (Fig. 4) consist of two maxima at -96.5 ± 0.5 and -100.2 ± 337
0.4 ppm with some minor lateral shoulders in non-exsolved specimens (e.g. specimen 338
EU2), whereas two maxima at -97.5 ± 0.3 and -100.5 ± 0.3 ppm with a well developed 339
shoulder at ~-95.2 ppm, are found in specimens in which an exsolution-induced 340
microtexture is developed (e.g. specimen RABB). 341
342
Figure 1 displays the 29Si spectra of microcline specimens. The spectrum of 343
specimen 9544 consist of three Gaussian peaks of equal intensity and width, attributed 344
to Si atoms in T2m (2Si,2Al) at -95.2 ppm, T2O (3Si,1Al) at -97.2 ppm, and T1m 345
(3Si,1Al) at -100.9 ppm. This spectrum is consistent with the low microcline structure 346
as the fully ordered end-member of the order-disorder series, with Al atoms occupying 347
only the T1O site (Lippmaa et al. 1980, Smith et al. 1984; Kirkpatrick et al. 1985; 348
Phillips et al. 1988; Xiao et al. 1995). If partial disorder exists, new signals from Si at 349
T1O and new chemical environments are generated as shown in three specimens of 350

15
intermediate microcline (Figs. 1b to 1d). These spectra were reasonably simulated with 351
chemical shifts similar to those of the low microcline, and the signal from Si atoms in 352
T1O (3Si,1Al) at -102.2 ppm. This analysis suggests that Al atoms are mainly located at 353
T1O sites, with t1O > 0.73 as expected from XRD data, but complemented with t2m > 354
t2O ≈ t1m values (Table 3), in contrast to conventional models from XRD data where 355
t1m > t2O ≈ t2m occupancies are indicated. 356
357
Surprisingly, orthoclase specimens have very similar spectra in all cases (Fig. 358
2a), consisting of three peaks with maxima at almost the same positions of microcline, 359
and with analogous intensity (but the peak at -100.8 ppm has larger area than the other 360
two peaks), as well as some minor lateral shoulders at -92.5 and -105.2 ppm. The ion-361
exchange experiments do not change the 29Si spectra of orthoclase significantly 362
(compare ASGS with K-ASGS in Fig. 2a). No indication of obliquity was found in the 363
XRD pattern of sample K-ASGS after the ion-exchange experiments, as it was absent 364
before the cation exchange. The spectral simulations compatible with the 365
experimentally observed spectra of orthoclase (Fig. 2b) were obtained by considering 366
the t1O value to be between 0.70 and 0.80, a t2m value between 0.10 and 0.20, t2O and 367
t1m values between 0.05 and 0.10, and δ T1O (3Si,1Al) = -101.7 ppm, δ T2m (2Si,2Al) 368
= -94.9 ppm (Table 3, and Table 5 in supporting information online). Our simulation of 369
the orthoclase spectra shows that t2m > t2O ≈ t1m is very characteristic of this structure. 370
However, the signal from Si at T1m (4Si,0Al) is invariably more developed in the 371
simulations that in the original spectra, indicating that additional restrictions to that of 372
the Loewenstein’s rule must be at work, for instance some additional dispersion of 373
charges reducing the development of (4Si,0Al) environment at the T1m site (* in Fig. 2). 374
The 29Si spectrum for a two-step monoclinic orthoclase was simulated in Figure 2c with 375

16
a typical Si, Al distribution over two T sites with t1O = t1m = 0.4 and t2O = t2m = 0.1 376
(Table 6 in supporting information online), as generally suggested by XRD. In addition, 377
the spectral simulation of the one-step triclinic orthoclase with t1O = 0.7 and t1m = t2O 378
= t2m = 0.1 (Table 6 in supporting information online) is shown in Fig. 2d. Both 379
alternative models reproduce the experimental results more poorly than the simulations 380
already suggested in Figure 2b, particularly if a monoclinic structure is considered. 381
382
Figure 3 exhibits the 29Si spectra of the valencianite specimens, which are 383
characterized mainly by the same three peaks of previous feldspars, however the peak at 384
-100.7 ppm is broader and more inhomogeneous having almost double area and higher 385
intensity than the other two peaks at -95.2 and -97.5 ppm, displaying also minor lateral 386
signals at -90.1, -92.5 and -105.2 ppm. The spectra of the less disordered valencianite 387
specimens can be simulated partially with t1O values of about 0.6 and t2O > t2m ≈ t1m 388
(specimens 1406 and 1109: Fig. 3a, Table 3). The broad peak with a maximum at about 389
-105.2 ppm, formed by the addition of signals from Si at T1O (4Si,0Al), T1m (4Si,0Al) 390
and T2m (4Si,0Al), and that at -90.1 ppm, reflecting Si at T2O and T2m with a (1Si,3Al) 391
environment (asterisk in Fig. 3), are much more developed in the simulations than in the 392
experimental spectra. The more disordered valencianite specimens, as judged from 393
NMR results (specimens AGM and 1407), are shown in comparison with two simulated 394
spectra for t1O = 0.4 and t1m = t2O = t2m = 0.2 (sim1 and sim2) in Figure 3b. The 395
spectrum sim1 is constructed with all the possible Si Q4 (nAl) environments for Si:Al = 396
3:1 and peak intensities complying Loewenstein’s rule. However, spectrum sim2 397
considers only the four major sites compatible with the same Al occupancy, i.e., T1O 398
(3Si,1Al), T1m (3Si,1Al), T2O (3Si,1Al) and T2m (2Si,2Al), for which the peak 399
positions are close to the standard values in microcline and orthoclase, and a wider 400
17
linewidth (see Table 3 for details). It is clear that the experimental spectra are 401
intermediate between these two cases, indicating that strong homogenization on the 402
charge distribution occurs throughout the framework during growth of these distinctive 403
disordered structures, at a low temperature. 404
405
Figure 4a shows the 29Si NMR spectra of specimens EU2 and SVNI-2; both are 406
very similar to the sample studied by Taylor (1933) in that they have a high sodium 407
content in solid solution (Table 1) as a consequence of a high temperature of 408
crystallization from alkali-rich magmas in a volcanic environment. Their spectra show 409
two maxima interpreted as corresponding to T1 and T2 sites in a monoclinic lattice 410
(Kirkpatrick et al. 1985, Zhou et al. 1994, Anbalagan et al. 2009), as expected from 411
Taylor’s model. Where sanidine shows exsolution, the spectra have an additional 412
shoulder at -95.1 ppm, also resolved in specimens RABB and SBKS. However, samples 413
of synthetic K-feldspar of KAlSi3O8 composition, acquired either by hydrothermal 414
crystallization from a melt at high temperature (sample 7294) or by K→Na ion-415
exchange reactions at 800ºC (sample K-EU2) or at 1050ºC (sample K-713r*), invariably 416
have three maxima, approximately at the same chemical shift as found in the other K-417
feldspar types, as was also reported for an adularia crystal with a high sanidine XRD 418
pattern (Zhou et al. 2001). Note that if Na atoms are replaced with K atoms by ion 419
exchange at 800ºC, the Si, Al distribution is not disturbed, whereas some modifications 420
are expected in heating experiments performed at 1050ºC. No obliquity was detected in 421
the XRD patterns of the sanidine specimens after the ion-exchange experiments. Our 422
findings suggest the presence of more spectroscopically distinct or real-space sites than 423
are considered by the monoclinic lattice model. It follows that the single peak at -97.0 424
ppm in natural sanidine must be due to the coalescence of two Si signals, T2O (3Si,1Al) 425

18
and T2m (2Si,2Al), which is induced by the partial substitution of K atoms for the 426
smaller Na atoms. The displacement effect is higher in the T2m (2Si,2Al) signal, the one 427
with a higher content of Al atoms in the second coordination sphere. The best 428
simulations of the three-maximum sanidine spectra were obtained using: 1) the same 429
line positions as in orthoclase and valencianite; 2) similar Si, Al occupancies as in 430
valencianite (the t1O value is considerably larger than the other three values); and 3) 431
larger linewidths (Fig. 4b, Table 3). Shoulders at -92.5 and particularly at -105.5 ppm 432
are well developed in the spectrum of K-substituted sanidine, but they are not as large 433
as in the simulated spectra. 434
435
The spectra resulting from a structure with a fully disordered Si, Al distribution, 436
where the four sites have the same Al occupancies (i.e., tx = 0.25), were also simulated 437
either with a monoclinic structure (Fig. 4c) or a local triclinic symmetry (Fig. 4d) for 438
sake of comparison. In the first case, only two populations of T sites are considered, i.e., 439
-97.8 – 4.8 = -93.0 ppm for T2O (3Si,1Al) = T2m (3Si,1Al), whereas in the second case, 440
the spectrum is the sum of four identical populations with different chemical shifts 441
(triclinic high sanidine in Table 6, in supporting information online). The two 442
simulations are farther from the experimental spectra of any sanidine specimen than the 443
proposed model in Figure 4b, where a large t1O value in comparison with the other 444
three site occupancies is assumed. A decrease in the shielding at 29Si between 4.0 and 445
5.5 ppm arising from the substitution of Al for Si atoms in the second-sphere 446
coordination did not reproduce a profile based on two maxima only. The 29Si spectrum 447
of sanidine based on two maxima was found only in Na-rich specimens, and it is 448
particularly far from the model of random disorder in a monoclinic lattice (Fig. 4c). 449
450

19
451
452
27Al MAS NMR spectra 453
Because Loewenstein’s rule was so useful in the interpretation of the 29Si spectra, 454
the Al atoms are expected to be systematically surrounded by four Si atoms, and the 455
interpretation of the spectra could be straightforward. On this basis, one should be able 456
to resolve signals arising from Al atoms surrounded by 4 Si at different structural sites, 457
having different average T-O distances, by this technique. However, the second-order 458
quadrupolar effect involves difficulties in the expected spectral resolution of the 459
different T sites, which can be partly improved by the use of a high external magnetic 460
field. Thus, 27Al MAS NMR spectra were obtained and compared at 9.4 and 19.6 T 461
(Table 4). 462
463
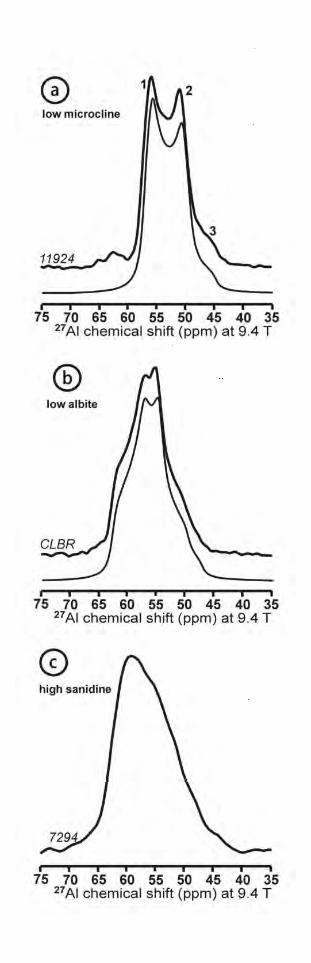
Figure 5 shows the central transition (C.T.) ½→- ½ in the 27Al MAS NMR spectra 464
at 9.4 T of Al atoms in tetrahedral coordination for the fully ordered end-member close 465
to the KAlSi3O8 composition with the low-microcline XRD pattern in specimen 11924 466
(Fig. 5a), the NAlSi3O8 composition with low albite XRD pattern in specimen CLBR 467
(Fig. 5b), the disordered sanidine with stoichiometric KAlSi3O8 composition in sample 468
7294 (Fig. 5c). The spectrum of low microcline shows a broad line due to second-order 469
quadrupolar effects (maxima 1 and 2 and shoulder 3), ascribed to a single crystalline 470
position of Al atoms in the T1O site, with δiso = 58.7 ppm, CQ = 3.2 MHz and η = 0.2 471
(Kirkpatrick et al., 1985; Phillips et al. 1988; Xiao et al., 1995). The signal at around 472
+63 ppm in Figure 5a is from a Na-feldspar impurity. Similarly, a single Al site is found 473
in the spectrum of low albite with with δi = 63.1 ppm, CQ ∼ 3.2 MHz and η = 0.65 474
(Kirkpatrick et al., 1985; Phillips et al. 1988). Note that the same CQ value is used for 475
20
the two simulations. However, the high sanidine spectrum is more compatible with the 476
presence of broad distributions of tetrahedral sites for aluminum. 477
478
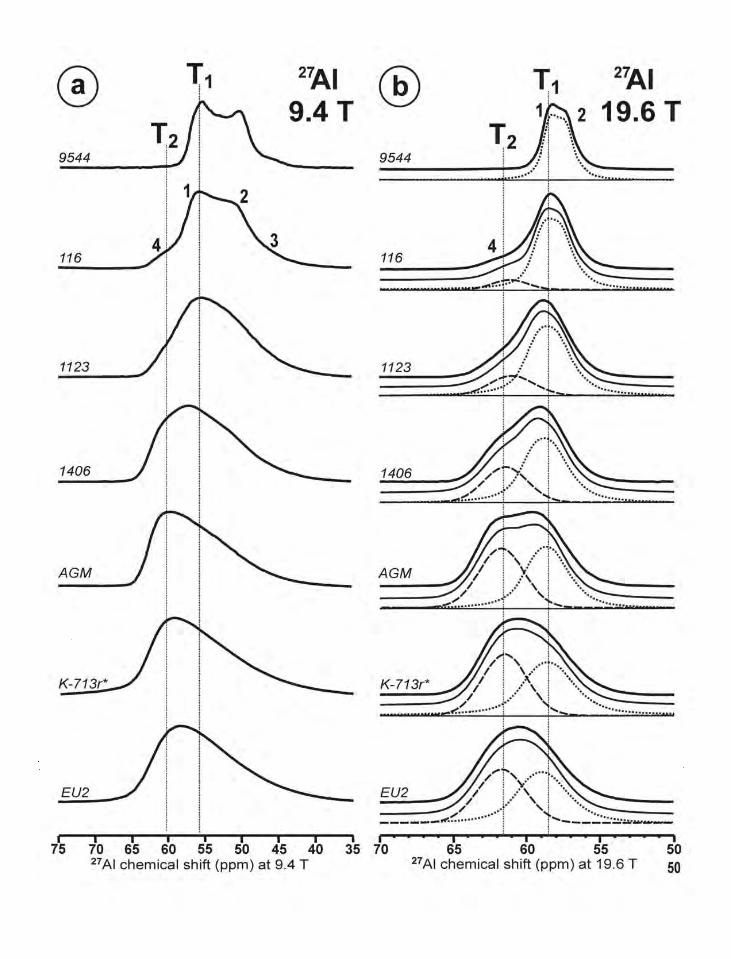
Figure 6a shows the changes in the C.T. of spectra with Si, Al disorder at 9.4 T 479
along the order-disorder series. The slightly disordered structures of intermediate 480
microcline show the same quadrupolar lineshape structure from the T1O site as low 481
microcline (specimen 11924 in Fig. 5a and specimen 9544 in Fig. 6a), but it is 482
somewhat blurred (marked with 1, 2 and 3 in specimen 116). In this case, an additional 483
shoulder at 61 ppm (marked as 4) is also detected. As disorder increases, the signal at 484
61 ppm increases, but the quadrupolar profiles cannot be recorded. In the high sanidine, 485
a broad asymmetric signal is obtained, with a maximum between the signals 1 and 4. 486
Figure 7 displays the variation of the first moment M1 of the C.T., calculated between 487
35 and 70 ppm, versus the linewidth at the middle height at this low external magnetic 488
field. The M1 and linewidth values change from 53.3 and 8.1 ppm in low microcline 489
(specimen 11924) to 57.1 ppm (sample 7294) and 13.0 (specimen EU2) in high 490
sanidine. This observed dispersion of data is due to variable contribution of the two 491
components T1 and T2, but also to the influence of Na atoms in the solid solution as well 492
as to Na-feldspar impurities caused by exsolution. However, it clearly shows the 493
existence of two populations of different K-feldspars, one consisting of microcline and 494
orthoclase, and the other, of sanidine and valencianite, which reflect different local 495
structures. The second population shows a higher dispersion of values, but if natural 496
EU2 and 713r specimens are ion-exchanged to produce pure K-feldspar as K-EU2 and 497
K-713r* synthetic samples, the M1 value is displaced from 13.0 and 12.7 ppm to 11.7 498
ppm. This value is very similar to that of the synthetic 7294 sample. Such type of 499
displacement is much smaller in ion-exchanged orthoclase (K-ASGS). 500
21
501
At 19.6 T, the C.T. signals from Al atoms are narrower than at 9.4 T (Fig. 6b) 502
displaying again two signals from T1 and T2 sites. In specimen 9544, the quadrupolar 503
broadening at 19.6 T (marked with 1 and 2) is lower but can be simulated with 504
comparable quadrupolar parameters as those used in specimen 11924 at 9.4 T. The 505
increment of local disorder produces the appearance of an additional signal at the left 506
side of the main peak, as at 9.4 T (marked with “4” for specimen 116). The 27Al spectra 507
at 19.6 T were simulated with a quadrupolar line for the T1 sites and a Gaussian curve 508
for the T2 sites, both signals becoming broader with disorder (Table 4). The Al 509
occupancies in these two sites were calculated from their spectral areas as Σt1 and Σt2 510
values. In the more disordered samples (natural and ion-exchanged sanidine and 511
valencianite AGM), the best spectral simulations were obtained for Σt1 > Σt2, with a 512
similar order-disorder parameter as that estimated from the 29Si spectra. The CQ and η 513
parameter change from circa 3.2 MHz and 0.25 in low microcline to 4.0 MHz and 0.5 in 514
high sanidine, with minor but still detectable changes in the chemical shifts. Note also 515
that disorder was simulated by increasing the linewidths (i.e., the Em parameter) in the 516
27Al spectra, as it was done also in the simulations of the 29Si spectra. 517
518
The modeling of the quadrupolar parameters for the two sets of T sites is 519
described in Figure 8, for structures close to the ordered and disordered end-members, 520
by means of a “second-order graphic extrapolation” of the chemical shift (similar to the 521
SORGE diagram of Massiot et al. 1995). It shows the external magnetic field 522
dependence of the position of the centers of gravity (cg) for the C.T. from Al atoms in 523
the two sets of T sites. The two T1 and T2 sites are represented by two straight lines 524
passing through three points, the δcg at 9.4 T (1/ν02 = 92.02 x10⁻⁴ MHz-2), the δcg at 19.6 525

22
T (1/ν02 = 21.06 x10⁻⁴ MHz-2), and the intercept with the vertical axis corresponding to 526
the δiso corrected from quadrupolar effects. For the T1O site, the value of δiso calculated 527
from the spectral simulation and the SORGE diagram are coincident in low microcline. 528
However, the δiso for the T2 sites can be inferred only from Figure 8c, as this signal was 529
simulated with Gaussian curves. Thus δiso (T2) = 62.1 ppm was estimated for disordered 530
Al atoms (from δcg = 61.1 ppm at 9.4 T and δcg = 61.8 ppm at 19.6 T) in intermediate 531
microcline and orthoclase. In addition, the slope of these lines is proportional to νQ2, 532
allowing the calculation of νQ for the T2 sites as ~220 kHz, less than the half of the 533
value at the T1O site. Similarly, the NMR parameters of the T2 site in sanidine EU2 534
were calculated as δiso = 62.5 ppm, CQ = 2.46 MHz (νQ ≈ 370 kHz). With these values, 535
we were finally able to simulate the C.T. at both external magnetic fields using two 536
quadrupolar profiles if a η = 0.60 value is used for the T2 sites (this parameter could not 537
determined from initial simulations using Gaussian profiles). 538
539
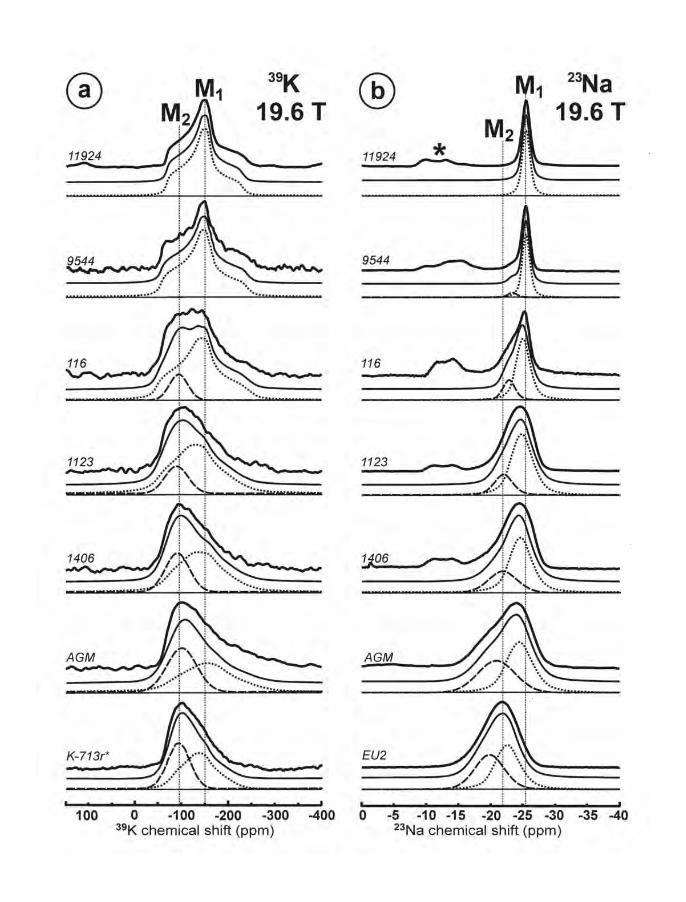
39K MAS NMR spectra 540
The C.T. of the 39K spectrum of specimen 11924 at 19.6 T (Fig. 9a) shows a 541
single M1 site for the K atoms, as in the spectrum recorded by Stebbins et al. (2002) for 542
low microcline, with δi = 65.2 ppm, CQ = 1.91 MHz and η = 0.87 (Table 4). The 39K 543
spectrum of specimen 9544 can still be fitted with a single site, but a slightly larger 544
quadrupolar CQ value is needed to reproduce the profile (Fig. 9a, Table 4). With 545
increasing disorder, this quadrupolar profile becomes blurred, and at least two signals 546
are needed for a simulation of the spectra, corresponding to two sets of 547
spectroscopically distinct M1 and M2 sites inside the irregular cavity, instead of a single 548
crystallographic M site as proposed by Taylor’s model. Spectra were reproduced with a 549
quadrupolar profile for the M1 site and a Gaussian curve for the M2 site, with changes in 550
23
the line broadening and in asymmetry parameter η from 0.87 in low microcline to 551
values around 0.6 in valencianite and sanidine for the M1 site. Also, it is necessary to 552
increase the relative intensity of the M2 signal, without much change in their chemical 553
shift (in comparison with estimated uncertainties). Disorder is also accompanied by an 554
increase in the linewidths (i.e., the Em parameter in spectral simulations). The site 555
occupancies of the K atoms in these M1 and M2 sites were calculated from their 556
respective areas as Σm1 and Σm2 values. Figure 10 is a correlationship between the site 557
occupancies of framework sites by Al atoms and the cavity sites by K atoms, calculated 558
from areas of the experimental spectra at 19.6 T. A linear relationship is clearly 559
obtained along the order-disorder series. 560
561
23Na MAS NMR spectra 562
The C.T. of the 23Na spectra of selected specimens at 19.6 T are shown in Figure 563
9b. The NMR parameters of the simulated peak shapes are given in Table 4. The spectra 564
of untwinned and twinned low microcline are similar at 9.4 T, but they are slightly 565
different at 19.6 T. Spectra from specimen 11924 are compatible with a single M1 site 566
for Na atoms, with well-defined quadrupolar parameters, whereas an additional signal 567
from the M2 site is detected in specimen 9544. This signal from the M2 site does not 568
overlap with a broad signal from the Na atoms of Na-feldspar in exsolution lamellae 569
and impurities (marked with an asterisk in specimen 11924, Fig. 9). Na-feldspar is 570
absent in sanidine EU2 and valencianite AGM as shown in spectra of Figure 9b. Again, 571
all the spectra were simulated with a quadrupolar profile for the M1 site and a Gaussian 572
curve for the M2 site. With disorder in the Si, Al distribution, the relative area of the 573
signal from Na atoms in the M2 site increases, displaying similar Na occupancies in the 574
two sites in spectra obtained at 9.4 and 19.6 T. In general terms, the simulation of the 575
24
23Na spectra is also consistent with that of 39K spectra, giving comparable Σm1 and Σm2 576
occupancies. The relationship between the occupancies of framework sites by Al atoms 577
and cavity sites by Na atoms is parallel to that represented in Figure 10. In other words, 578
no clear segregation of alkali atoms in these sites was noted. However, a strong/sharp 579
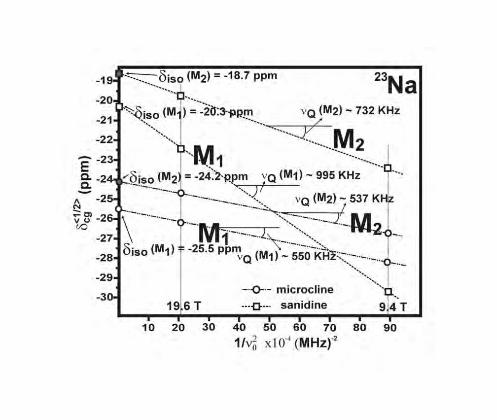
increase in the CQ for the M1 site, a linewidth increase for the M2 site, and some peak 580
shifts were noted with progressive disorder, effects that were investigated in detail with 581
the help of the SORGE diagram (Fig. 11). The values of the NMR parameters for the 582
M1 site from this diagram are also well-matched with those quantities estimated from 583
individual simulations. However, for the M2 site, the CQ and δiso parameters can only be 584
estimated from the SORGE diagram, using the δcg values measured from the Gaussian 585
profiles of the spectral simulations to calculate the ordinate for x = 0 and the line slopes. 586
In this way, δiso at -20.3 and -18.7 ppm and CQ of 1.07 and 1.46 MHz were obtained for 587
the M2 sites in low microcline and high sanidine, respectively. Using these values, the 588
quadrupolar profiles for the M2 site were reasonably reproduced for η ≈ 0.70 in the 589
original spectra at both external magnetic fields. 590
591
DISCUSSION 592
Local structures in K-feldspar 593
Structural states in K-feldspar are conventionally defined between two end-594
members or stable thermodynamic phases: low microcline for the fully ordered end-595
member and high sanidine for the totally disordered end-member. These states are 596
described with very specific lattice models from reciprocal-space techniques. Orthoclase 597
is generally considered to be an intermediate and metastable state, whereas valencianite 598
is described as an unstable phase (Smith 1974). 599
600

25
Figure 12a exhibits the triclinic C-1 model of low microcline, in which the four 601
T sites have a fixed Al occupancy defined as t1O = 1.0 and t1m = t2O = t2m = 0.00, and a 602
single M site for K atoms. Two structural layers are schematically represented, with 603
four four-membered rings of tetrahedra, labeled 1 to 4, in two complementary 604
orientations (bottom left and right schemes, Fig. 12a). The ring structures have perfect 605
alternation in the number of Al atoms (in red color) per ring, shown as “…-2-0-2-0-…” 606
chains along the b axis (as well as perpendicularly) in the upper layer and “…-0-2-0-2-607
..” in the lower layer. A coordination of the K atom by seven oxygen atoms emerges for 608
K-O distances less than ~3.0 Å (Downs et al. 1996). Two K-OCO bonds exist here in 609
each four-T ring with two Al atoms (one in dark red related to the Ku atom if this bond 610
points up, the other in light red at the Kd atoms when it points down, OCO atoms in red 611
color). The K-OCm distances are greater than 3.12 Å (discontinuous lines and oxygen 612
atoms in black color), and thus OCm atoms are underbonded with K atoms. The NMR 613
data of the untwinned low microcline (specimen 11924 with t1O = Σm1 = 1.0 and t2m ≈ 614
t2o ≈ t1m ≈ Σm2 = 0.00) are entirely consistent with that model to produce perfect long-615
range periodicity. The non-equivalent crystallographic sites, defined with invariant 616
atomic coordinates from the average structure after Bragg diffractions, are equivalent to 617
spectroscopically distinct sites in the form of specific local chemical environments with 618
fixed quadrupolar parameters and chemical shifts from NMR spectra. 619
620
Figure 12b shows two structural layers of tetrahedra of the monoclinic C2/m 621
model of high sanidine (t1O = t1m = t2O = t2m = 0.25), in which the mirror plane “m”, 622
twofold “2” axes and inversion centers are schematically represented. The rings do not 623
show the Si and Al occupancies (i.e., the two shown in green) and the cavity atoms rest 624
in a single M site located at the mirror plane, for a random distribution of the framework 625
26
cations. In other words, the ionicity of the K atoms and the monoclinic symmetry for the 626
topology of tetrahedra were formally linked in Taylor’s original model to describe 627
structural disorder. The K-OC distances are larger than 3.12 Å, and thus, OC atoms (in 628
black) are underbonded (discontinuous lines) by the K atoms, although a coordination 629
with seven oxygen atoms exists from K-O distances lower than ~3.02 Å (as it was used 630
for microcline in Fig. 12a). Substitutional disorder in the framework could be associated 631
with positional disorder inside the cavity. 632
633
Our data support structural features and constraints not fully recognized in this 634
conventional model for disorder, as follows. Two T sites and a single M site were not 635
detected by NMR experiments. The 29Si spectra at 9.4 T and the 27Al spectra at 19.6 T 636
have shown in all cases Σt1 > Σt2 if the Al occupancies are inferred from the relative 637
areas of peaks. The chemical shifts of the T1 and T2 sites in the 29Si and 27Al spectra are 638
equivalent when the same chemical environment is compared, i.e., (δ T1O + δ T1m)/2 < 639
(δ T2O + δ T2m)/2 for Si atoms, and δiso T1 < δiso T2 for Al atoms. The lower CQ value 640
for Al atoms in T2 sites (Fig. 8c) could indicate that this site is locally less distorted than 641
the T1 site. The η parameter for the T1 sites decreases slightly from sanidine to 642
microcline, indicating lower distortions in these sites with increasing disorder. Thus the 643
T1 and T2 sites are very different from the spectroscopic point of view. All of these data 644
unequivocally indicate that random disorder of the framework cations must be very 645
uncommon or nonexistent. Positional disorder involves slightly variable bond-distances 646
and bond-angles, which cause distributions of isotropic chemical shifts and quadrupolar 647
parameters produced by electric field gradients (EFG), as we also noted in the NMR 648
spectra of the alkali cations. 649
650

27
The simulations of the 29Si spectra can be used to calculate a mean local 651
obliquity Δ from the chemical shifts of the different sites with the same chemical 652
environment; for instance, for Tx (3Si,1Al) we can define Δ as [(δ T1O - δ T1m) + (δ 653
T2O - δ T2m)] / 2. We have found that in intermediate microcline close to the low 654
microcline (specimen 176) Δ is 1.85 ppm; in orthoclase Δ is 1.5 ppm, and in sanidine 655
and valencianite Δ is 1.35 ppm. A Δ value of 0.0 must occur for strictly monoclinic 656
symmetry where δ T1O = δ T1m and δ T2O = δ T2m (as in models shown in Figs. 2c and 657
4c), but this was not observed in any of the experimental spectra. This finding implies 658
that analogous triclinic-like distortions exist for all structures along the order-disorder 659
series at room temperature, with four spectroscopically distinct T sites having t1O ≠ t1m, 660
t2O ≠ t2m, instead of two T sites for sanidine and four T sites for microcline. 661
662
The 39K and 23Na spectra demonstrate the existence of a single M site for alkali 663
atoms only in untwinned low microcline close to the stoichiometric KAlSi3O8 664
composition, which is extremely rare in Nature. Two sets of M site distributions can be 665
resolved if some disorder exists in the framework of tetrahedra. The CQ parameter for 666
the M1 site derived from the 39K spectra do not change significantly along the order-667
disorder series, whereas the same parameter for the T1 site from the 27Al spectra clearly 668
increases. It could indicate similar local environments for K atoms but growing 669
tetrahedral distortions when disorder increases. Thus, the local geometry of the 670
framework cations seems to be forced to change to accommodate framework disorder, 671
whereas the local geometry in the M1 site for K atoms is better preserved. The same 672
adaptive behavior to disorder is found for Na atoms as the CQ values from the 23Na 673
spectra increase progressively from low microcline to high sanidine. In addition, the 674
SORGE diagrams indicate CQ (T1) > CQ (T2) from 27Al spectra as CQ (M1) > CQ (M2) 675

28
from 23Na spectra, with similar η parameter in all cases. Note also that δiso for Na atoms 676
in M1 sites is lower than in M2 sites, as can also be inferred for the K atoms. Hence, the 677
NMR data show a remarkable internal consistency if data from the different nuclides are 678
compared. In addition, no segregation of alkali atoms in the M sites is noted. 679
680
Structural models featuring an alkali site split into two half-occupied or four 681
quarter-occupied sites have been proposed for disordered Na-feldspar (Ribbe et al. 682
1969, Prewitt et al. 1976, Winter et al. 1979), hypersolvus alkali feldspars (Fenn and 683
Brown 1977; Salje 1986), disordered Li-feldspar (Baur et al. 1996), as well as in 684
plagioclase (Fitz Gerald et al. 1986) on the basis of the highly anisotropic shape of the 685
electron-density distribution surrounding alkali atoms in single-crystal XRD 686
refinements. Because of the domain structure in some of these disordered feldspars and 687
the limited resolution of diffractometric techniques, non-equivalent positions for alkali 688
atoms are difficult to distinguish from spatial average effects due to slightly disoriented 689
domains. As a result, it is hard to distinguish site distributions from positional disorder 690
of discrete structural sites with XRD techniques. Because the NMR measurements are 691
not averaged over domains or twin microstructures at the mesoscale, which are totally 692
absent in valencianite and sanidine, we can conclude that split sites for alkali atoms 693
must be considered also in disordered K-feldspars. 694
695
If we correlate the site occupancy of framework and cavity cations on the basis 696
of 27Al, 39K and 23Na spectra at 19.6 T, a linear relationship is outlined along the entire 697
order-disorder series (Fig. 10). In addition, the increase in the CQ values for Al atoms at 698
the T1 and T2 sites with framework disorder is also correlated with the same trend for 699
the Na atoms in the M1 and M2 sites, indicating the increment of disorder. The departure 700

29
from overall monoclinic symmetry at a local scale thus is connected with multi-site 701
correlations or chemical coupling between Al atoms and alkali atoms to form 702
molecular-like Al(T2)-O-K(M2) and Al(T1)-O-K(M1) linkages. Hence, “real” M sites 703
with energy minima inside a single type of irregular cavity for the alkali atoms are 704
formed as requirements of the Si, Al distribution, as a consequence of local charge-705
balancing mechanism at the atomic scale. On this basis, a general model for disordered 706
structures can be proposed with a quasi-triclinic local symmetry (i.e., the two-fold axis, 707
the mirror plane and the inversion centers are absent at the medium-range scale) as in 708
Figure 12c. The Al atoms (in red) are distributed over different four-T rings related to 709
OCO or OCm oxygen atoms (also in red), which are bonded with K atoms. Where Al 710
atoms are at T1 sites, K1-O are formed (red arrows), where Al atoms are at T2 sites K2-O 711
bonds exist (blue arrows), with overall maintenance of the seven coordination of K by 712
oxygen atoms. 713
714
Medium-range order in disordered K-feldspar 715
The crystal structures of long-range disordered K-feldspars can be described by 716
the ring structures over medium-range length scale, with structural correlations in the 717
range of 0.5 – 2.0 nm according to the number of Al atoms per each four-T ring, which 718
is closely associated with the disposition of the alkali atoms. The medium-range order 719
(MRO) of K-feldspar explains their diversity in two broad groups, microcline and 720
orthoclase on the one hand, and valencianite and sanidine on the other hand. 721
722
Microcline. Some disorder is detected only in the 23Na spectrum in regularly twinned 723
low microcline (specimen 9544). It may be associated with structural distortion at Na-724
rich broad twin boundaries (Sánchez-Muñoz et al. 1998, Sánchez-Muñoz et al. 2006b). 725

30
Intermediate microcline has a more disordered structure, and the simulations of the 29Si 726
spectra are consistent with t1O >> t2m > t2O ≈ t1m values. Interestingly, a high t1O value 727
seems to be associated with a very low t1m value (a characteristic that is developed 728
more clearly in orthoclase), but a structure of “…-2-0-2-0-…” chains with “Al(T1O)-729
Si(T2m)-Al(T1O)-Si(T2m)” rings must be a major feature. 730
731
This framework arrangement does not follow Dempsey’s rule that, based on 732
electrostatic arguments, suggests the number of Al-O-Si-O-Al linkages tend to a 733
minimum (i.e., the Al atoms assume the largest possible separation) for a given Si/Al 734
ratio value (Dempsey et al. 1969). Thus, the microcline structures could be analogous to 735
that of hydrogen faujasite where two Si atoms and two Al atoms also form four-736
membered rings with Si-O-Al bridges at opposite sides, with local stabilization by 737
bonded protons at the bridging oxygen atoms (Schröder and Sauer 1993). 738
739
Orthoclase. The 29Si spectra are consistent with t1O > t2m > t2O ≈ t1m with t1O + t2m ≈ 740
0.9, i.e., our findings imply that Al atoms are preferentially located at T1O-T2m-T1O-741
T2m rings. A relatively high Al content at the T2m site has not been suggested from 742
XRD methods in orthoclase, as only T1 and T2 sites are distinguished in the structural 743
lattice model with monoclinic symmetry. However, mean T2m-O distances larger than 744
the T2O-O and T1m-O distances do exist in high albite (Taylor 1965). It is not possible 745
to discriminate between different Al occupancies of the T sites and intrinsic structural 746
differences in these sites on the basis of X-ray data only (Winter 1979). Because of 747
Loewenstein’s rule of Al-O-Al avoidance, Al atoms cannot occupy T1O and T1m sites 748
in the same four-T ring, and consequently two types of rings with “…-2-0-2-0-…” 749
arrangements must alternate along the chains of tetrahedra as “Al(T1O)-Si(T2m)-750
31
Al(T1O)-Si(T2m)” (rings 1 to 4 in Fig. 12a) and “Si(T1O)-Al(T2m)-Si(T1O)-Al(T2m)” 751
(rings 1 to 4 in Fig. 12c). 752
753
The natural abundance and persistence of orthoclase in igneous, metamorphic 754
and hydrothermally affected rocks, have been interpreted as resulting from a small 755
driving force for ordering once structural modulations are formed, involving the 756
formation and coexistence of ordered and anti-ordered domains (Eggleton and Buseck 757
1980) and a domain-texture barrier effect (Brown & Parsons 1989). However, it is 758
difficult to imagine extended ordering processes at the subsolidus stage in K-feldspar of 759
hydrothermal origin, because of the low temperature of crystallization. In this case, the 760
observable state of order must be very close to that originally formed during growth. 761
One can envision that it will be very difficult to reverse configuration of atoms where 762
the Al occupancy forms that type of four-T rings, because the ordering reactions cannot 763
occur by a single atomic jump, as an Al atom at the T2m site avoids the location of 764
another Al atom at the T1O site in the same four-T ring. Therefore, this particular 765
medium-range order scheme (orthoclase in Fig. 12c) can explain the metastability, 766
attainability and preservation of orthoclase, in spite of the presence of H2O in the 767
environment. 768
769
Valencianite. The 29Si spectra in this type of K-feldspar are compatible with t1O > t2O > 770
t1m ≈ t2m values in the less strongly disordered samples and t1O > t2O ≈ t1m ≈ t2m 771
values in the more strongly disordered ones. However, the (3Si,1Al) and (2Si,2Al) 772
environments seem to be much more abundant than in a simple model obeying 773
Loewenstein’s rule. Therefore, the most characteristic feature of valencianite is the 774
expression of some Si, Al order (involving strong deficiency of Si atoms in Q4 775

32
(4Si,0Al), (1Si,3Al) and (0Si,4Al) environments) not accounted for in a conventional 776
disorder model, which assumes purely random distribution of Si and Al neighbors once 777
Loewenstein’s rule is respected. This particular order, in such low-temperature 778
structures, is compatible with a medium-range scale configuration in which mainly only 779
one Al atom occurs per four-T rings to give “…-1-1-1-1-…” chains as in rings 5 to 8 in 780
Figure 12c. 781
782
Sanidine. The 29Si spectra of natural specimens and synthetic samples are also 783
compatible with t1O ≠ t1m and t2O ≠ t2m, with a t1O value higher than the Al occupancy 784
of the other three sites, involving triclinic-like local distortions as noted from the 785
chemical shifts. Loewenstein’s rule of Al-O-Al avoidance seems to be respected, as in 786
other framework aluminosilicates (Klinowski et al. 1982, Phillips and Kirkpatrick 787
1995). However, the (4Si,0Al) and (0Si,4Al) environments are less developed in 788
experimental than in the simulated spectra, which are closer to experimental ones than 789
in the case of valencianite. Hence, the “…-1-1-1-1-…” chain configuration could be still 790
valid for this high-temperature structure, although the additional effect of dispersion of 791
charges seems to be less well developed than in valencianite. In our interpretation, 792
sanidine forms directly as a quasi-triclinic modification, or it undergoes displacive-like 793
transformations on cooling, or both. Extensive Si, Al ordering on cooling cannot be 794
invoked in unexsolved natural Na-rich specimens and in samples obtained via ion-795
exchange experiments. 796
797
798
799
800

33
IMPLICATIONS 801
Two complementary implications are derived from previous experimental data, 802
one at the level of K-feldspar systematics and nomenclature, the other related to the own 803
understanding of the crystalline solid-state. 804
805
The IMA only recognizes three terms for K-feldspar mineral species, namely 806
sanidine, orthoclase and microcline (Barth 1934). However, “valencianite” can be 807
described with a crystal structure having not only the distinctive characteristics of 808
triclinicity and disorder, but also a particular MRO atomic scheme, as suggested from 809
the NMR data of this work. Thus, perhaps “valencianite” can be considered also as a 810
mineral species of the K-feldspar group. This K-feldspar must be of high interest in the 811
study of authigenic rocks and mineral deposits from epithermal environment. 812
813
Solids are commonly seen from a sharp twofold perspective, either as crystalline 814
or non-crystalline, having (or not) atomic order on a scale that produces an indexable 815
diffraction pattern (IUCr 1992, Nickel 1995). In crystalline solids, short-range order 816
(SRO) arises from atomic forces resulting in the first sphere of coordination, whereas 817
long-range order (LRO) is the consequence of periodicity (Lifshitz 2007). Where 818
crystals have perfect LRO (i.e., the distances of atomic correlations are much longer 819
than the size of coherent diffraction), reciprocal-space techniques are able to resolve 820
structural arrangements at the atomic scale as lattice models in “ideal” crystal structures. 821
822
However, the discovery of quasicrystals involves the unequivocal existence of 823
solids with LRO without periodicity, and led to the modern debate of what is a 824
“crystal” (Desiraju 2003, Lifshitz 2007). In addition, it is worth considering to what 825

34
extent the concept of space group needs to be amended in disordered structures 826
(Welberry 2004). Disordered, modulated and incommensurated crystals have strictly 827
non-periodic structures and site distributions, but their “real” structure can in principle 828
be described with a periodic “ideal” average from the analysis of the concentrated 829
intensity at Bragg peaks (i.e., ignoring diffuse scattering). 830
831
Feldspars (the most abundant minerals in the crust of the Earth and Moon) are 832
particularly relevant in this debate because: i) disorder was expressed in terms of a 833
periodic average structure for the first time in sanidine by XRD (Taylor, 1933); ii) the 834
modulated and incommensurated structures of feldspars are currently described using 835
the concept of an average structure (Taylor 1965, Ribbe 1984, Ribbe 1994), and iii) 836
diffuse scattering is ubiquitous (Laves 1950, Gay 1953, Jagodzinski 1984, Pleger 1996). 837
We have shown in the present study that the NMR data cannot be interpreted with 838
available lattice models where long-range disorder exists. Major substitutional Si, Al 839
disorder in T sites is not coupled only with minor positional disorder for K atoms inside 840
the irregular cavity in a K-feldspar. Non-equivalent atoms and site distributions due to 841
positional disorder are both superposed at the same lattice site in the overlapped image 842
offered by XRD, owing to a lack of intrinsic spatial resolving power. More importantly, 843
the average structure approach in strictly non-periodic disordered crystals fails to 844
recognize essential chemical medium-range order (MRO), i.e., “real” structural features 845
at the local scale can be hidden if “ideal” long-range periodicity is imposed. Obviously, 846
the lattice model is unsuccessful to describe crystallinity based on MRO schemes that 847
do not form extended periodic arrangements. 848
849
ACKNOWLEDGMENTS 850

35
This work was partially supported by the National High Magnetic Field 851
Laboratory through National Science Foundation Cooperative Agreement (DMR-852
0084173) and by the State of Florida. LSM thanks projects MAT2010-21088-C03-01 853
and MAT2010-17753 for additional financial support. We thank Francois Delbove for 854
sample 7294, Ray Berry for specimen 11924, and Museo Geo-Minero (IGME) in 855
Madrid, Museo Nacional de Ciencias Naturales (MNCN, CSIC) of Madrid, and Museé 856
d’Histoire Naturelle de Paris, for the K-feldspar specimens used in this work. We also 857
thank to Mr. Olivier Rouer (ISTO, CNRS, France) for the results of the EMPA chemical 858
analyses. In addition, we thank Robert F. Martin and two anonymous reviewers for the 859
suggestions and constructive comments, as well as associate editor Brian Phillips for 860
their help in improving this work. 861
862
REFERENCES CITED 863
Anbalagan, G., Sankari, G., Ponnusamy, S., Thilak Kumar, R., and Gunasekaran, S. 864
(2009) Investigation of silicate mineral sanidine by vibrational and NMR spectroscopic 865
methods. Spectrochimica Acta Part A: Molecular and Biomolecular Spectroscopy, 74, 866
404-409. 867
868
Akizuki, M. and Sunagawa, I. (1978) Study of sector structure in adularia by means of 869
optical microscopy, infra-red absorption, and electron microscopy. Mineralogical 870
Magazine, 42, 453-462. 871
872
Bambauer, H.U., Krause, C., and Kroll, H. (1989) TEM investigation of the 873
sanidine/microcline transition across metamorphic zones: the K feldspar varieties. 874
European Journal of Mineralogy, 1, 47-58. 875
36
876
Barth, T.F.W. (1934) Polymorphic phenomena and crystal structure. American Journal 877
of Science, 227, 273-286. 878
879
Baur, W.H., Joswig, W., and Müller, G. (1996) Mechanics of the feldspar framework; 880
crystal structure of Li-feldspar. Journal of the Solid State Chemistry, 121, 12-23. 881
882
Blasi, A. (1984) The variation of the 2θ angles in powder diffraction patterns of one- 883
and two-step K-rich feldspars. Bulletin de Minéralogie, 107, 437-445. 884
885
Blasi, A., Brajkovic, A., De Pol Blasi, C., Foord, E.E., Martin, R.F., and Zanazzi, P.F. 886
(1984a) Structure refinement and genetics aspects of a microcline overgrowth on 887
amazonite from Pikes Peak batholiths, Colorado, U.S.A. Bulletin de Minéralogie, 107, 888
411-422. 889
890
Blasi, A., Brajkovic, A., and De Pol Blasi, C. (1984b) Dry-heating conversion of low 891
microcline to high sanidine via a one-step disordering process. Bulletin de Minéralogie, 892
107:423-435 893
894
Brown, G.E., Hamilton, W.C., Prewitt, C.T. and Sueno, S. (1974) Neutron diffraction 895
study of Al/Si ordering in sanidine: a comparison with X-ray diffraction data. In W S. 896
MacKenzie and J. Zussman Eds, The Feldspars, p. 68-80, Manchester Univ. Press, 897
Manchester. 898
899

37
Brown, W.L. and Parsons, I. (1989) Alkali feldspars: ordering rates, phase 900
transformation and behavior diagrams for igneous rocks. Mineralogical Magazine, 53, 901
25-42. 902
903
Chaison, U. (1950) The optics of triclinic adularia. Journal of Geology, 58, 537-547. 904
905
Dempsey, E., Kuhl, G.H. and Olson, D.H. (1969) Variation of the lattice parameter with 906
aluminum content in synthetic sodium faujasites. Evidence for ordering of the 907
framework ions. Journal of Physical Chemistry, 73, 387-390. 908
909
Desiraju, G.R. (2003) In search of clarity. Nature, 423, 485. 910
911
Downs, R.T., Andalman, A., and Hudacsko, M. (1996) The coordination number of Na 912
and K atoms in low albite and microcline as determined from a procrystal electron-913
density distribution. American Mineralogist, 81, 1344-1349. 914
915
Eggleton, R.A., and Buseck, P.R. (1980) The orthoclase-microcline inversion: a high 916
resolution transmission electron microscope study and strain analysis. Contributions to 917
Mineralogy and Petrology, 74, 123-133. 918
919
Fitz Gerald, J.D., Parise, J.B. and Mackinnon, I.D.R. (1986) Average structure of an 920
An48 plagioclase from the Hogarth Ranges. American Mineralogist, 71, 1399-1408. 921
922
Fenn, P.H. and Brown, G.E. (1977) Crystal structure of a synthetic, compositionally 923
intermediate, hypersolvus alkali feldspar: evidence for Na, K site ordering. Zeitschrift 924
für Kristallographie, 145, 124-145. 925
38
926
Gay, P. (1953) The structures of the plagioclase feldspars: III. An X-ray study of 927
anorthites and bytownites. Mineralogical Magazine, 30, 169-177. 928
929
IUCr (1992) International Union of Crystallography: Report of the executive committee 930
for 1991. Acta Crystallographica A, 48, p.928 931
932
Jagodzinski, H. (1984) Determination of modulated structures. Bulletin de Minéralogie, 933
107, 455-466. 934
935
Keefer, K.D. and Brown, G.E. (1978) Crystal structures and composition of sanidine 936
and high albite in cryptoperthitic intergrowth. American Mineralogist, 63, 1264-1273. 937
938
Kimata, M., Saito, S., Shimizu, M., Iida, I., and Matsui, T. (1996a) Low-temperature 939
crystal structure of orthoclase and sanidine. Neues Jahrbuch für Mineralogie 940
Abhandlungen, 171, 199-213. 941
942
Kimata, M., Shimizu, M. and Saito, S. (1996b) High-temperature crystal structure of 943
sanidine. The crystal structure of sanidine at 935ºC. European Journal of Mineralogy, 8, 944
15-24. 945
946
Kirkpatrick, R.J., Kinsey, R.A., Smith, K.A., Henderson, D.M., and Oldfield, E. (1985) 947
High resolution solid-state sodium-23, aluminum-27, and silicon-29 nuclear magnetic 948
resonance spectroscopic reconnaissance of alkali and plagioclase feldspars. American 949
Mineralogist 70, 106-123. 950
39
951
Klinowski, J., Ramdas, S., Thomas, J.M., Fyfe, C.A. and Hartman, J.S. (1982) A re-952
examination of Si, Al ordering in zeolites NaX and NaY. Journal of the Chemical 953
Society, Faraday Transactions 2: Molecular and Chemical Physics, 78, 1025-1050. 954
955
Kroll, H., Schmiemann, I., and von Cölln, G. (1986) Feldspar solid solutions. American 956
Mineralogist, 71, 1-16. 957
958
Kroll, H. and Ribbe, P.H. (1987) Determining (Al,Si) distribution and strain in alkali 959
feldspars using lattice parameters and diffraction peak positions: a review. American 960
Mineralogist, 72, 491-506 961
962
Laves, F. (1950) The lattice and twinning of microcline and other potash feldspars. 963
Journal of Geology, 58, 548-571. 964
965
Laves, F. and Goldsmith, J.R. (1961) Polymorphism, order, disorder, diffusion and 966
confusion in the feldspars. Cursillos y Conferencias, 8, 71–80. 967
968
Laves, F. and Hafner, F. (1962) Infrared absortion effects, nuclear magnatic resonance 969
and structure of feldspars. Norsk Geologisk Tidsskrift, 42, 57-72 970
971
LeBail, A., Duroy, H., and Fourquet, J.L. (1988) Ab-initio structure determination of 972
LiSbWO6 by X-ray powder diffraction. Material Research Bulletin, 23, 447-452. 973
974
Lifshitz, R. (2007) What is a crystal? Zeitschrift für Kristallographie, 222, 313-317. 975

40
976
Lippmaa, E., Mägi, M., Samoson, A., Engelhardt, G. and Grimmer, A.-R. (1980) 977
Structural studies of silicates by solid-state high-resolution 29Si NMR. Journal of the 978
American Chemical Society, 102, 4889-4893. 979
980
Loewenstein, W. (1954) The distribution of aluminum in the tetrahedra of silicates and 981
aluminates. American Mineralogist, 39, 92-96. 982
983
Massiot, D., Müller, D., Hübert, T., Schneider, M., Kengens, A.P.M., Coté, B., 984
Coutures, J.P, and Gessner, W. (1995) Double rotation and magic-angle spinning 985
nuclear magnetic resonance study of 27Al: reexamination of the aluminum borate 986
9Al2O3·2B2O3. Solid State Nuclear Magnetic Resonance, 5, 175-180. 987
988
Massiot, D., Fayon, F., Capron, M., King, I., Le Calvé, S., Alonso, B., Durand, J.O., 989
Bujoli, B., Gan, Z.H. and Hoatson, G. (2002) Modelling one and two-dimensional solid-990
state NMR spectra. Magnetic Resonance in Chemistry, 40, 70-76. 991
992
McConnell, J.D.C. (1965). Electron optical study of effects associated with partial 993
inversion in a silicate phase. Philosophical Magazine, 11, 1289–1301. 994
995
McLaren, A.C. and Fitz Gerald, J.D. (1987) CBED and ALCHEMI investigation of 996
local symmetry and Si/Al ordering in K-feldspars. Physics and Chemistry of Minerals, 997
14, 281-292. 998
999
Megaw, H.D. (1956) Notation for feldspar structures. Acta Crystallographica, 9, 56-60. 1000
41
1001
Megaw, H.D. (1959) Order and disorder in the feldspars, I. Mineralogical Magazine, 32, 1002
226-241. 1003
1004
Nickel, E.H. (1995) The definition of a mineral. The Canadian Mineralogist, 33, 689-1005
690. 1006
1007
O’Brient, J.D. (1986) Preservation of primary magmatic features in subvolcanic 1008
pegmatites, aplites and granite from Rabb Park, New Mexico. American Mineralogist. 1009
71, 608-624 1010
1011
Phillips B.L., Kirkpatrick, J., and Hovis, G.L. (1988) 27Al, 29Si and 23Na MAS NMR 1012
study of an Al, Si ordered alkali feldspar solid solution series. Physics and Chemistry of 1013
Minerals, 16, 262-275. 1014
1015
Phillips, B.L. and Kirkpatrick, R.J. (1995) High-temperature 29Si MAS NMR 1016
spectroscopy of anorthite (CaAl2Si2O8) and its P-1 – I-1 structural phase transition. 1017
Physics and Chemistry of Minerals, 22, 268-276. 1018
1019
Pleger, S. (1996) Diffuse X-ray scattering of homogeneous potassium-rich low- and 1020
high-temperature sanidines. Zeitschrift für Kristallographie, 211, 293-298. 1021
1022
Prewitt, C.T., Sueno, S. and Papike, J.J. (1976) The crystal structures of high albite and 1023
monalbite at high temperatures. American Mineralogist, 61, 1213-1225. 1024
1025

42
Ribbe, P.H., Megaw, H.D., Taylor, W.H., Ferguson, R.B. and Traill, R.J. (1969) The 1026
albite structures. Acta Crystallographica, B25, 1503-1518. 1027
1028
Ribbe, P.H. (1983) Chemistry, structure and nomenclature of feldspars. Rev. Mineral. 2, 1029
1-19. 1030
1031
Ribbe, P.H. (1984) Average structures of alkali and plagioclase feldspars: systematic 1032
and applications. In: Brown, W.L. (ed) Feldspars and Feldspathoids. NATO Adv Stud 1033
Inst C137, D. Reidel Publishing Company, pp.1-54, 1034
1035
Ribbe, P.H. (1994) The crystal structures of the aluminium-silicate feldspars. In: 1036
Parsons, I. (ed) Feldspars and their reactions. NATO Adv Stud Inst C421 Dordrecht, 1037
Boston, London, pp 1-49. 1038
1039
Rodriguez-Carvajal, J. (1993) Recent advances in magnetic-structure determination by 1040
neutron powder diffraction. Physica B, 192, 55-69 1041
1042
Rodriguez-Carvajal, J. (2001) Reference Guide, V. 1.9c, Laboratoire Léon-Brillouin 1043
(CEA-CNRS), France (2001). 1044
1045
Roisnel, T., and Rodriguez-Carvajal, J. (2001) WinPLOTR: A Windows tool for 1046
powder diffraction pattern analysis. In: Delhez, R. and Mittemeijer, E.J. (eds), 1047
Materials Science Forum, 378-3, 118-123. 1048
1049

43
Salje, E. (1986) Raman spectroscopic investigation of the order parameter behavior in 1050
hypersolvus alkali feldspars: displacive phase transitions and evidence for Na-K site 1051
ordering. Physics and Chemistry of Minerals, 13, 340-346. 1052
1053
Sánchez-Muñoz, L., Nistor, L., Van Tendeloo, G., and Sanz, J. (1998) Modulated 1054
structures in KAlSi3O8: a study by high resolution electron microscopy and 29Si MAS-1055
NMR spectroscopy. Journal of Electron Microscopy, 47, 17-28. 1056
1057
Sánchez-Muñoz, L., García-Guinea, J., Sanz, J., Correcher, V., and Delgado, A. (2006a) 1058
Ultraviolet luminescence from defects complexes in the twin boundaries of K-feldspar. 1059
Chemistry of Materials, 18, 3336-3342. 1060
1061
Sánchez-Muñoz, L., Correcher, V., Turrero, M.J., Cremades, A., and García-Guinea, J. 1062
(2006b) Visualization of elastic strain fields by the spatial distribution of the blue 1063
luminescence in a twinned microcline crystal. Physics and Chemistry of Minerals, 33, 1064
639-650. 1065
1066
Sánchez-Muñoz, L., Correcher, V., García-Guinea, J., and Delgado, A. (2007) 1067
Luminescence at 400 and 440 nm in sanidine feldspar from original and X-ray-induced 1068
defects. Nuclear Instruments and Methods in Physic Research A 580, 679-682. 1069
1070
Sánchez-Muñoz, L., García-Guinea, J., Zagorsky, V.Ye., Juwono, T., Modreski, P.J., 1071
Cremades, A., Van Tendeloo, G., De Moura, O.J.M. (2012) The evolution of twin 1072
patterns in perthitic K-feldspar from granitic pegmatites. The Canadian Mineralogist, 1073
50, 989-1024. 1074

44
1075
Scambos, T.A.; Smyth, R.J.; and McCormick, T.C. (1987) Crystal-structure refinement 1076
of high sanidine from the upper mantle. American Mineralogist, 72, 973-978. 1077
1078
Schröder, K.P. and Sauer, J. (1993) Preferred stability of the Al-O-Si-O-Al linkages in 1079
high-silica zeolite catalysts. Theoretical predictions contrary to Dempsey’s rule. The 1080
Journal of Physical Chemistry, 97, 6579-6581. 1081
1082
Sherriff, B.L. and Hartman, J.S. (1985) Solid-state high-resolution 29Si NMR of 1083
feldspars: Al-Si disorder and the effect of paramagnetic centres. The Canadian 1084
Mineralogist, 23, 205-212. 1085
1086
Smith, J.V. (1954) A review of the Al-O and Si-O distances. Acta Crystallographica, 7, 1087
479-483. 1088
1089
Smith, J.V. (1974) Feldspar minerals, Volume 1, p. 423-436. Springer Verlag, New 1090
York. 1091
1092
Smith, J.V., Blackwell, C.S., and Hovis, G.L. (1984) NMR of albite microcline series. 1093
Nature, 309, 140-142. 1094
1095
Stebbins, J.F., Du, L.S., Kroeker S., Neuhoff, P., Rice, D., Frye, J., and Jakobsen, H.J. 1096
(2002) New opportunities for high-resolution solid-state NMR spectroscopy of oxide 1097
materials at 21.1- and 18.8-T fields. Solid State Nuclear Magnetic Resonance, 21, 105-1098
115. 1099
45
1100
Taylor, W.H. (1933) The structure of sanidine and other feldspars. Zeitschrift für 1101
Kristallographie, 85, 425-442. 1102
1103
Taylor, W.H., Darbyshire, J.A., and Strunz, H. (1934) An X-ray investigation of the 1104
feldspars. Zeitschrift für Kristallographie, 87, 464-498. 1105
1106
Taylor, W.H. (1965) The Feldspars, in: Crystal Structure of Minerals (W.L. Bragg and 1107
G.F. Claringbull, eds.); Bell and Sons, London, UK. 1108
1109
Welberry, T.R. (2004) Diffuse X-ray scattering and models of disorder (IUCr 1110
Monographs on Crystallography 16, Oxford Univ. Press, Oxford. 1111
1112
Winter, J.K.; Okamura, F.P. and Ghose, S. (1979) A high-temperature structural study 1113
of high albite, monalbite, and the analbite→monalbite phase transition. American 1114
Mineralogist, 64, 409-423 1115
1116
Xiao, Y., Kirkpatrick, R.J., Hay, R.L., Kim, Y.J. and Phillips, B.L. (1995) Investigation 1117
of Al, Si order in K-feldspars using 27Al and 29Si MAS NMR. Mineralogical Magazine, 1118
59, 47-61. 1119
1120
Zhou, L., Guo, J., Yuan, H., and Li, L. (1994) Solid state nuclear magnetic resonance 1121
and infrared spectroscopy of alkali feldspars. Science in China (Series D), 40, 2, 159-1122
165. 1123
1124
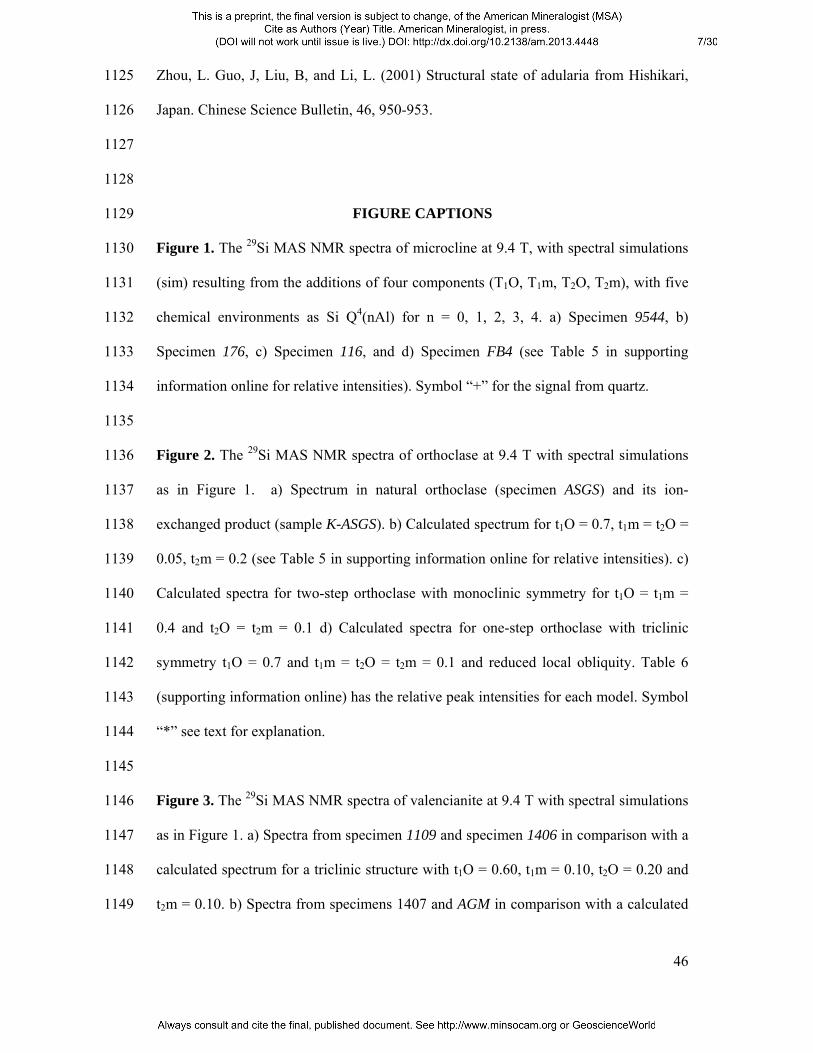
46
Zhou, L. Guo, J, Liu, B, and Li, L. (2001) Structural state of adularia from Hishikari, 1125
Japan. Chinese Science Bulletin, 46, 950-953. 1126
1127
1128
FIGURE CAPTIONS 1129
Figure 1. The 29Si MAS NMR spectra of microcline at 9.4 T, with spectral simulations 1130
(sim) resulting from the additions of four components (T1O, T1m, T2O, T2m), with five 1131
chemical environments as Si Q4(nAl) for n = 0, 1, 2, 3, 4. a) Specimen 9544, b) 1132
Specimen 176, c) Specimen 116, and d) Specimen FB4 (see Table 5 in supporting 1133
information online for relative intensities). Symbol “+” for the signal from quartz. 1134
1135
Figure 2. The 29Si MAS NMR spectra of orthoclase at 9.4 T with spectral simulations 1136
as in Figure 1. a) Spectrum in natural orthoclase (specimen ASGS) and its ion-1137
exchanged product (sample K-ASGS). b) Calculated spectrum for t1O = 0.7, t1m = t2O = 1138
0.05, t2m = 0.2 (see Table 5 in supporting information online for relative intensities). c) 1139
Calculated spectra for two-step orthoclase with monoclinic symmetry for t1O = t1m = 1140
0.4 and t2O = t2m = 0.1 d) Calculated spectra for one-step orthoclase with triclinic 1141
symmetry t1O = 0.7 and t1m = t2O = t2m = 0.1 and reduced local obliquity. Table 6 1142
(supporting information online) has the relative peak intensities for each model. Symbol 1143
“*” see text for explanation. 1144
1145
Figure 3. The 29Si MAS NMR spectra of valencianite at 9.4 T with spectral simulations 1146
as in Figure 1. a) Spectra from specimen 1109 and specimen 1406 in comparison with a 1147
calculated spectrum for a triclinic structure with t1O = 0.60, t1m = 0.10, t2O = 0.20 and 1148
t2m = 0.10. b) Spectra from specimens 1407 and AGM in comparison with a calculated 1149

47
spectrum for a triclinic structure with t1O = 0.40, t1m = t2O = t2m = 0.20. Sim1 and 1150
sim2 are built up using different intensities in Table 5 (supporting information online). 1151
Symbol “+” for the signal from quartz, and symbol “*” see text for explanation. 1152
1153
Figure 4. The 29Si MAS NMR spectra of sanidine at 9.4 T with spectral simulations as 1154
in Figure 1. a) Specimens EU2, SVNI-2, RABB and SBKS, and samples 7294, K-713r* 1155
and K-EU2. b) Calculated spectrum for a sanidine (t1O = 0.40, t1m = 0.15, t2O = 0.25 1156
and t2m = 0.20) with a triclinic structure but reduced local obliquity. c) Calculated 1157
spectrum for strict monoclinic symmetry t1O = t1m = t2O = t2m = 0.25. d) Calculated 1158
spectrum for triclinic symmetry with reduced obliquity and the same occupancies of c). 1159
Symbol “*” see text for explanation. 1160
1161
Figure 5. The 27Al MAS NMR spectra of alkali feldspars at 9.4 T. a) Specimen 11924 1162
or untwinned K-feldspar ordered end-member (low microcline), marked with 1, 2 and 3 1163
for the features of the quadrupolar profile of the T1O site, simulated with δiso = 58.7 1164
ppm, CQ = 3.2 MHz and η = 0.2. b) Specimen CLBR with fully ordered low albite, 1165
simulated with δiso = 62.9 ppm, CQ = 3.17 MHz, and η = 0.65. c) Sample 7294 as the 1166
disordered end-member (high sanidine) with KAlSi3O8 composition. 1167
1168
Figure 6. The 27Al MAS NMR spectra from selected specimens and samples of K-1169
feldspar at 9.4 T in a) and 19.6 T in b). Signals 1, 2 and 3 can be explained as in Figure 1170
5 from T1 sites, and signal 4 corresponds to Al atoms in T2 sites. Spectral simulations in 1171
b) are performed with NMR parameters of Table 4. Dotted lines for T1 sites and dashed 1172
lines for T2 sites, simulated spectra as fine continuous lines, experimental spectra as 1173
thick continuous lines. 1174

48
1175
Figure 7. Variation of the first moment M1 with linewidth in ppm from the C.T. in the 1176
27Al spectra at 9.4 T. The relationships between some natural specimens and their ion-1177
exchanged counterpart are marked with arrows. Ordered and disordered end-members 1178
(specimen 11924 and sample 7294) and valencianite AGM are also labeled. 1179
1180
Figure 8. SORGE diagram for the two spectroscopically distinct sets of T sites for Al 1181
atoms for microcline and sanidine. The δcg values for the central transition are plotted 1182
with the intensity of the external magnetic field as 1/ν02. The T1 site in microcline from 1183
specimen 9544, the T2 site for intermediate microcline from specimen 116, T1 and T2 1184
sites in sanidine from specimen EU2, (see explanations in the text) are here analyzed. 1185
The chemical shift values from the simulated spectra are denoted by white symbols, 1186
whereas calculated chemical shift values from this diagram are in grey. 1187
1188
Figure 9. The 39K MAS NMR spectra in a) and 23Na MAS NMR spectra in b) of 1189
selected K-feldspars at 19.6 T. Dotted lines for M1 sites and dashed lines for M2 sites, 1190
simulated spectra as fine continuous lines (Table 4), experimental spectra as thick 1191
continuous lines. The asterisk “*” denotes signal from exsolved Na-rich feldspar. 1192
1193
Figure. 10. Correlationship between Σt1 from Al atoms in T1 sites and Σm1 from K 1194
atoms in M1 sites from spectral simulations (Table 4) of experimental spectra at 19.6 T. 1195
1196
Figure 11. SORGE diagram for the two spectroscopically distinct sets of M sites for Na 1197
atoms, where the δcg values for the C.T. are plotted with the external magnetic field as 1198

49
1/ν02. M1 and M2 sites from twinned low microcline (specimen 9544) and high sanidine 1199
(specimen EU2) with symbols as in Fig. 8 (see explanations in the text). 1200
1201
Figure 12. Lattice models of low microcline (a) and high sanidine (b) from XRD; “m” 1202
mirror plane, “2” two-fold binary axis, and “*” inversion centers. c) Quasi-triclinic 1203
model with MRO from NMR for orthoclase, valencianite and sanidine. The projection 1204
normal to the a axis show two sheets of T sites with the interlayer M sites, and onto the 1205
(001) plane display a chain of T atoms along the b axis and related K atoms at different 1206
height. The K-OCO bonds (absent in the monoclinic model) are in red for Ku (up) and 1207
light red for Kd (down). Four 4-membered rings of T sites are marked with numbers in 1208
the two projections. The T1 sites are in light red and T2 sites in blue for the C2/m model 1209
in b), whereas T1O sites in red, T1m sites in pink, T2O sites in blue and T2m sites in 1210
green for the C-1 model in a); green color for both Si and Al atoms in b), and blue for Si 1211
atoms and red for Al atoms in a); the OA1 oxygen atoms are in orange, the other oxygen 1212
atoms are in yellow; oxygen atoms not bonded to K (at larger distances than 3.12 Å) are 1213
in black and with discontinuous lines. In c), the rings 1 to 4 correspond with orthoclase, 1214
and rings 5 to 8 with the valencianite and sanidine, M1 sites with red arrows, M2 with 1215
blue arrows. Structural data: Blasi et al. (1984a) for microcline; Kimata et al (1996a) for 1216
sanidine (see text for details). 1217
1218
1219
1220
1221
1222
1223
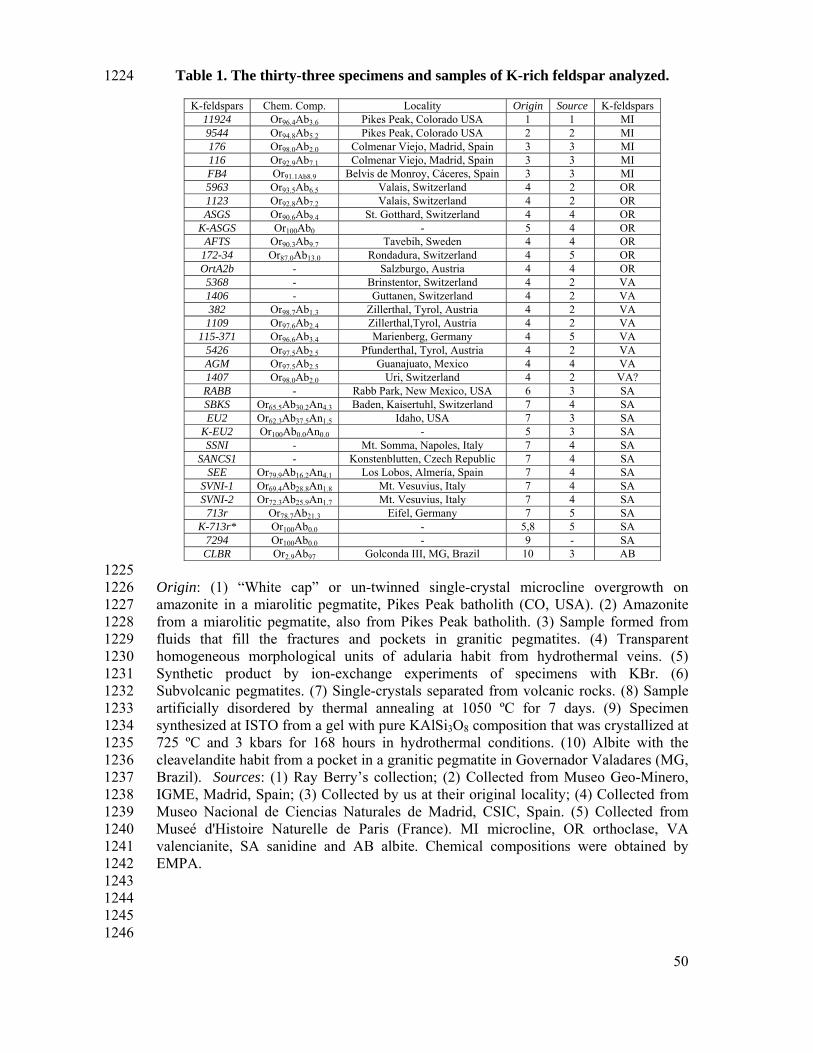
50
Table 1. The thirty-three specimens and samples of K-rich feldspar analyzed. 1224
K-feldspars Chem. Comp. Locality Origin Source K-feldspars 11924 Or96.4Ab3.6 Pikes Peak, Colorado USA 1 1 MI 9544 Or94.8Ab5.2 Pikes Peak, Colorado USA 2 2 MI 176 Or98.0Ab2.0 Colmenar Viejo, Madrid, Spain 3 3 MI 116 Or92.9Ab7.1 Colmenar Viejo, Madrid, Spain 3 3 MI FB4 Or91.1Ab8.9 Belvis de Monroy, Cáceres, Spain 3 3 MI 5963 Or93.5Ab6.5 Valais, Switzerland 4 2 OR 1123 Or92.8Ab7.2 Valais, Switzerland 4 2 OR ASGS Or90.6Ab9.4 St. Gotthard, Switzerland 4 4 OR
K-ASGS Or100Ab0 - 5 4 OR AFTS Or90.3Ab9.7 Tavebih, Sweden 4 4 OR
172-34 Or87.0Ab13.0 Rondadura, Switzerland 4 5 OR OrtA2b - Salzburgo, Austria 4 4 OR 5368 - Brinstentor, Switzerland 4 2 VA 1406 - Guttanen, Switzerland 4 2 VA 382 Or98.7Ab1.3 Zillerthal, Tyrol, Austria 4 2 VA 1109 Or97.6Ab2.4 Zillerthal,Tyrol, Austria 4 2 VA
115-371 Or96.6Ab3.4 Marienberg, Germany 4 5 VA 5426 Or97.5Ab2.5 Pfunderthal, Tyrol, Austria 4 2 VA AGM Or97.5Ab2.5 Guanajuato, Mexico 4 4 VA 1407 Or98.0Ab2.0 Uri, Switzerland 4 2 VA? RABB - Rabb Park, New Mexico, USA 6 3 SA SBKS Or65.5Ab30.2An4.3 Baden, Kaisertuhl, Switzerland 7 4 SA EU2 Or62.3Ab37.5An1.5 Idaho, USA 7 3 SA
K-EU2 Or100Ab0.0An0.0 - 5 3 SA SSNI - Mt. Somma, Napoles, Italy 7 4 SA
SANCS1 - Konstenblutten, Czech Republic 7 4 SA SEE Or79.9Ab16.2An4.1 Los Lobos, Almería, Spain 7 4 SA
SVNI-1 Or69.4Ab28.8An1.8 Mt. Vesuvius, Italy 7 4 SA SVNI-2 Or72.3Ab25.9An1.7 Mt. Vesuvius, Italy 7 4 SA
713r Or78.7Ab21.3 Eifel, Germany 7 5 SA K-713r* Or100Ab0.0 - 5,8 5 SA
7294 Or100Ab0.0 - 9 - SA CLBR Or2.9Ab97 Golconda III, MG, Brazil 10 3 AB
1225 Origin: (1) “White cap” or un-twinned single-crystal microcline overgrowth on 1226 amazonite in a miarolitic pegmatite, Pikes Peak batholith (CO, USA). (2) Amazonite 1227 from a miarolitic pegmatite, also from Pikes Peak batholith. (3) Sample formed from 1228 fluids that fill the fractures and pockets in granitic pegmatites. (4) Transparent 1229 homogeneous morphological units of adularia habit from hydrothermal veins. (5) 1230 Synthetic product by ion-exchange experiments of specimens with KBr. (6) 1231 Subvolcanic pegmatites. (7) Single-crystals separated from volcanic rocks. (8) Sample 1232 artificially disordered by thermal annealing at 1050 ºC for 7 days. (9) Specimen 1233 synthesized at ISTO from a gel with pure KAlSi3O8 composition that was crystallized at 1234 725 ºC and 3 kbars for 168 hours in hydrothermal conditions. (10) Albite with the 1235 cleavelandite habit from a pocket in a granitic pegmatite in Governador Valadares (MG, 1236 Brazil). Sources: (1) Ray Berry’s collection; (2) Collected from Museo Geo-Minero, 1237 IGME, Madrid, Spain; (3) Collected by us at their original locality; (4) Collected from 1238 Museo Nacional de Ciencias Naturales de Madrid, CSIC, Spain. (5) Collected from 1239 Museé d'Histoire Naturelle de Paris (France). MI microcline, OR orthoclase, VA 1240 valencianite, SA sanidine and AB albite. Chemical compositions were obtained by 1241 EMPA. 1242 1243 1244 1245
1246
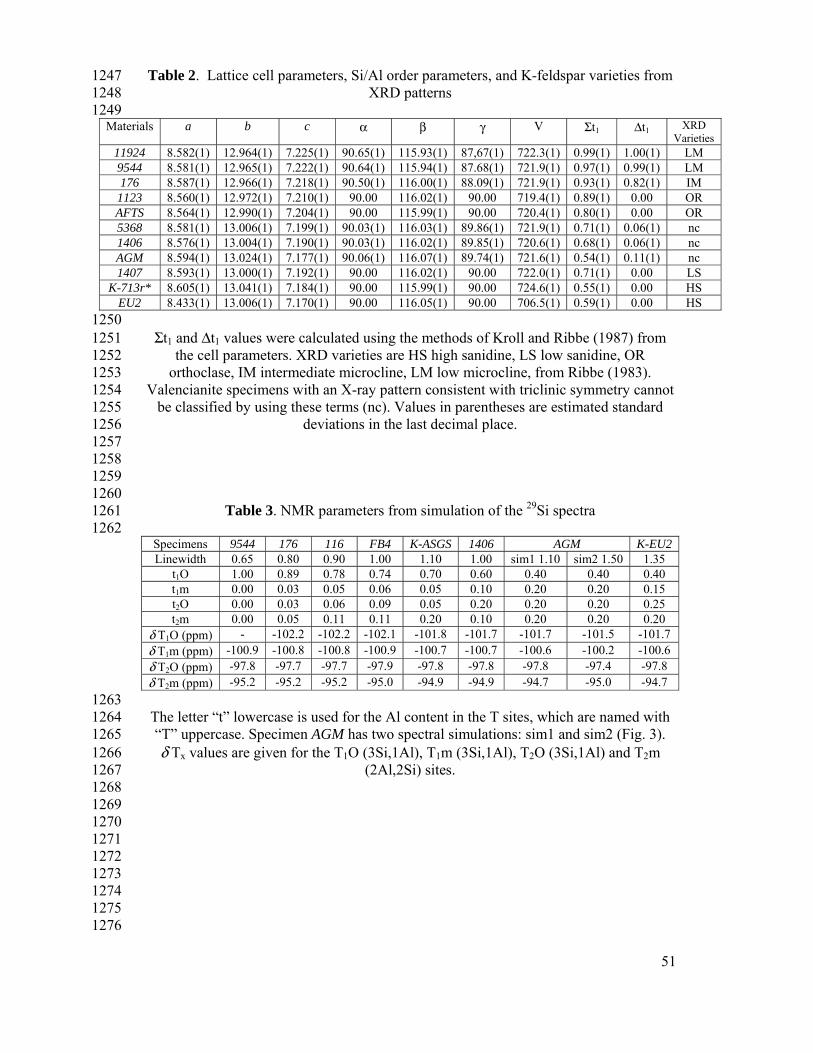
51
Table 2. Lattice cell parameters, Si/Al order parameters, and K-feldspar varieties from 1247 XRD patterns 1248
1249 Materials a b c α β γ V Σt1 Δt1 XRD
Varieties11924 8.582(1) 12.964(1) 7.225(1) 90.65(1) 115.93(1) 87,67(1) 722.3(1) 0.99(1) 1.00(1) LM 9544 8.581(1) 12.965(1) 7.222(1) 90.64(1) 115.94(1) 87.68(1) 721.9(1) 0.97(1) 0.99(1) LM 176 8.587(1) 12.966(1) 7.218(1) 90.50(1) 116.00(1) 88.09(1) 721.9(1) 0.93(1) 0.82(1) IM
1123 8.560(1) 12.972(1) 7.210(1) 90.00 116.02(1) 90.00 719.4(1) 0.89(1) 0.00 OR AFTS 8.564(1) 12.990(1) 7.204(1) 90.00 115.99(1) 90.00 720.4(1) 0.80(1) 0.00 OR 5368 8.581(1) 13.006(1) 7.199(1) 90.03(1) 116.03(1) 89.86(1) 721.9(1) 0.71(1) 0.06(1) nc 1406 8.576(1) 13.004(1) 7.190(1) 90.03(1) 116.02(1) 89.85(1) 720.6(1) 0.68(1) 0.06(1) nc AGM 8.594(1) 13.024(1) 7.177(1) 90.06(1) 116.07(1) 89.74(1) 721.6(1) 0.54(1) 0.11(1) nc 1407 8.593(1) 13.000(1) 7.192(1) 90.00 116.02(1) 90.00 722.0(1) 0.71(1) 0.00 LS
K-713r* 8.605(1) 13.041(1) 7.184(1) 90.00 115.99(1) 90.00 724.6(1) 0.55(1) 0.00 HS EU2 8.433(1) 13.006(1) 7.170(1) 90.00 116.05(1) 90.00 706.5(1) 0.59(1) 0.00 HS
1250 Σt1 and Δt1 values were calculated using the methods of Kroll and Ribbe (1987) from 1251
the cell parameters. XRD varieties are HS high sanidine, LS low sanidine, OR 1252 orthoclase, IM intermediate microcline, LM low microcline, from Ribbe (1983). 1253
Valencianite specimens with an X-ray pattern consistent with triclinic symmetry cannot 1254 be classified by using these terms (nc). Values in parentheses are estimated standard 1255
deviations in the last decimal place. 1256 1257 1258 1259 1260
Table 3. NMR parameters from simulation of the 29Si spectra 1261 1262
Specimens 9544 176 116 FB4 K-ASGS 1406 AGM K-EU2 Linewidth 0.65 0.80 0.90 1.00 1.10 1.00 sim1 1.10 sim2 1.50 1.35
t1O 1.00 0.89 0.78 0.74 0.70 0.60 0.40 0.40 0.40 t1m 0.00 0.03 0.05 0.06 0.05 0.10 0.20 0.20 0.15 t2O 0.00 0.03 0.06 0.09 0.05 0.20 0.20 0.20 0.25 t2m 0.00 0.05 0.11 0.11 0.20 0.10 0.20 0.20 0.20
δ T1O (ppm) - -102.2 -102.2 -102.1 -101.8 -101.7 -101.7 -101.5 -101.7 δ T1m (ppm) -100.9 -100.8 -100.8 -100.9 -100.7 -100.7 -100.6 -100.2 -100.6 δ T2O (ppm) -97.8 -97.7 -97.7 -97.9 -97.8 -97.8 -97.8 -97.4 -97.8 δ T2m (ppm) -95.2 -95.2 -95.2 -95.0 -94.9 -94.9 -94.7 -95.0 -94.7
1263 The letter “t” lowercase is used for the Al content in the T sites, which are named with 1264 “T” uppercase. Specimen AGM has two spectral simulations: sim1 and sim2 (Fig. 3). 1265 δ Tx values are given for the T1O (3Si,1Al), T1m (3Si,1Al), T2O (3Si,1Al) and T2m 1266
(2Al,2Si) sites. 1267 1268 1269 1270
1271 1272 1273 1274 1275 1276
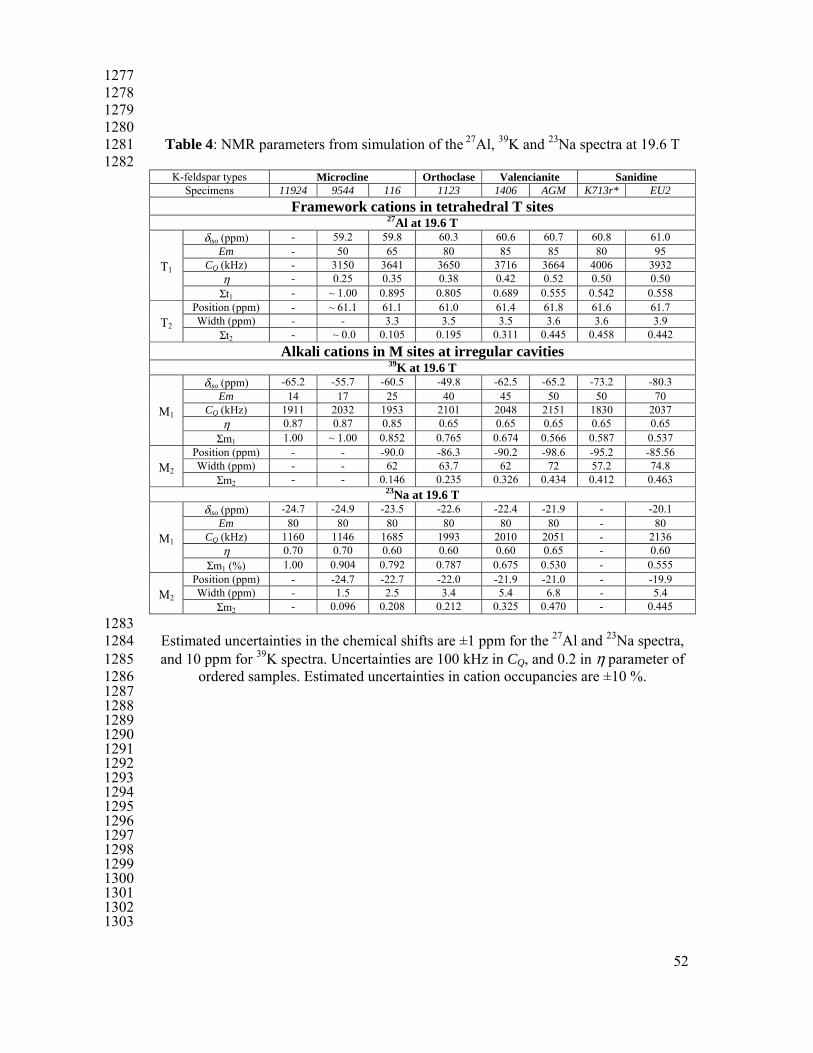
52
1277 1278 1279 1280
Table 4: NMR parameters from simulation of the 27Al, 39K and 23Na spectra at 19.6 T 1281 1282
K-feldspar types Microcline Orthoclase Valencianite Sanidine Specimens 11924 9544 116 1123 1406 AGM K713r* EU2
Framework cations in tetrahedral T sites 27Al at 19.6 T
T1
δiso (ppm) - 59.2 59.8 60.3 60.6 60.7 60.8 61.0 Em - 50 65 80 85 85 80 95
CQ (kHz) - 3150 3641 3650 3716 3664 4006 3932η - 0.25 0.35 0.38 0.42 0.52 0.50 0.50
Σt1 - ~ 1.00 0.895 0.805 0.689 0.555 0.542 0.558
T2
Position (ppm) - ~ 61.1 61.1 61.0 61.4 61.8 61.6 61.7 Width (ppm) - - 3.3 3.5 3.5 3.6 3.6 3.9
Σt2 - ~ 0.0 0.105 0.195 0.311 0.445 0.458 0.442 Alkali cations in M sites at irregular cavities
39K at 19.6 T
M1
δiso (ppm) -65.2 -55.7 -60.5 -49.8 -62.5 -65.2 -73.2 -80.3 Em 14 17 25 40 45 50 50 70
CQ (kHz) 1911 2032 1953 2101 2048 2151 1830 2037 η 0.87 0.87 0.85 0.65 0.65 0.65 0.65 0.65
Σm1 1.00 ~ 1.00 0.852 0.765 0.674 0.566 0.587 0.537
M2 Position (ppm) - - -90.0 -86.3 -90.2 -98.6 -95.2 -85.56 Width (ppm) - - 62 63.7 62 72 57.2 74.8
Σm2 - - 0.146 0.235 0.326 0.434 0.412 0.463 23Na at 19.6 T
M1
δiso (ppm) -24.7 -24.9 -23.5 -22.6 -22.4 -21.9 - -20.1 Em 80 80 80 80 80 80 - 80
CQ (kHz) 1160 1146 1685 1993 2010 2051 - 2136 η 0.70 0.70 0.60 0.60 0.60 0.65 - 0.60
Σm1 (%) 1.00 0.904 0.792 0.787 0.675 0.530 - 0.555
M2 Position (ppm) - -24.7 -22.7 -22.0 -21.9 -21.0 - -19.9 Width (ppm) - 1.5 2.5 3.4 5.4 6.8 - 5.4
Σm2 - 0.096 0.208 0.212 0.325 0.470 - 0.445 1283
Estimated uncertainties in the chemical shifts are ±1 ppm for the 27Al and 23Na spectra, 1284 and 10 ppm for 39K spectra. Uncertainties are 100 kHz in CQ, and 0.2 in η parameter of 1285
ordered samples. Estimated uncertainties in cation occupancies are ±10 %. 1286 1287 1288 1289 1290 1291 1292 1293 1294 1295 1296 1297 1298 1299 1300 1301 1302 1303

53
1304 1305 1306 1307
Figure 1 1308 1309 1310 1311 1312
1313 1314
1315

54
1316 1317 1318
Figure 2 1319 1320 1321 1322
1323 1324
1325 1326 1327

55
1328 Figure 3 1329
1330 1331
1332
1333 1334 1335 1336 1337 1338 1339 1340 1341 1342 1343 1344 1345 1346 1347 1348
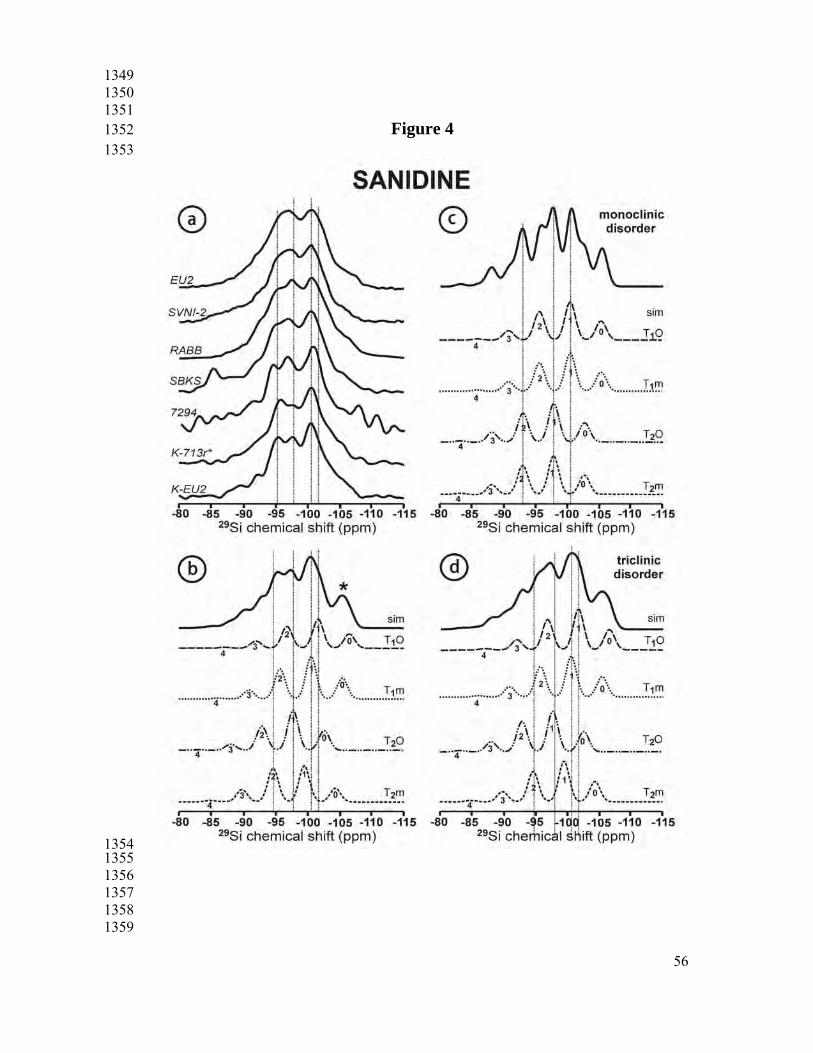
56
1349 1350 1351
Figure 4 1352 1353
1354 1355 1356 1357 1358 1359
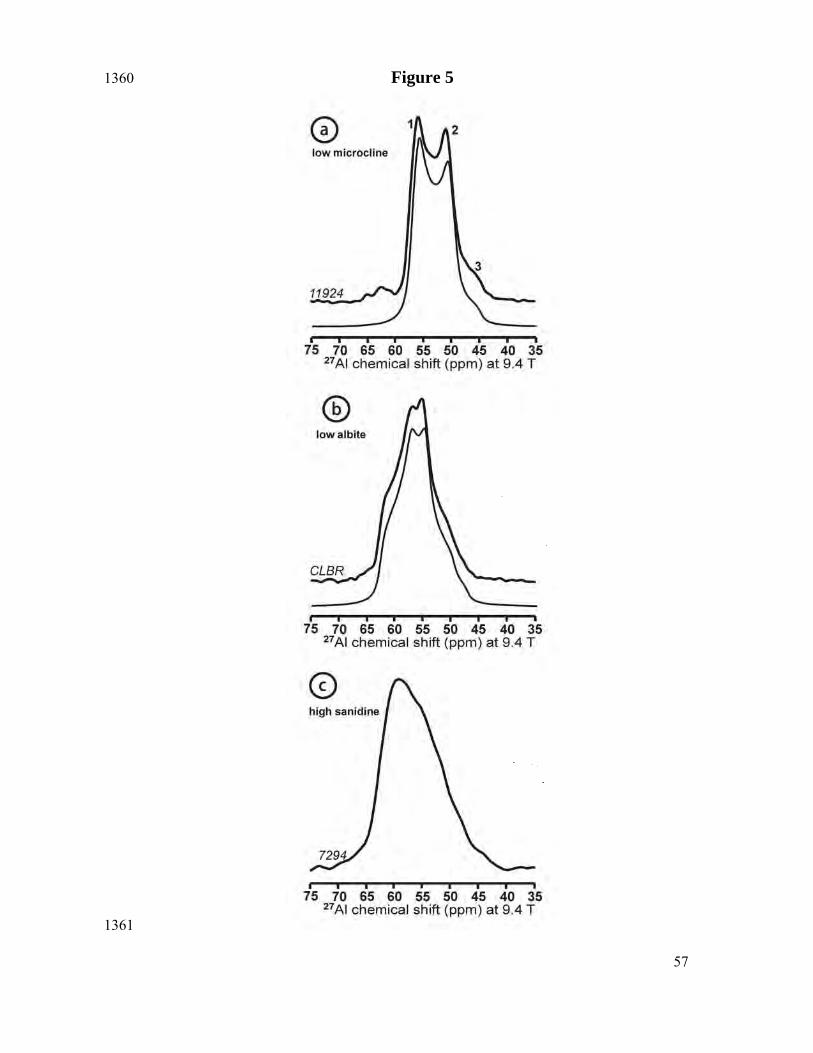
57
Figure 5 1360
1361

58
1362 1363
Figure 6 1364 1365
1366 1367 1368
1369 1370 1371
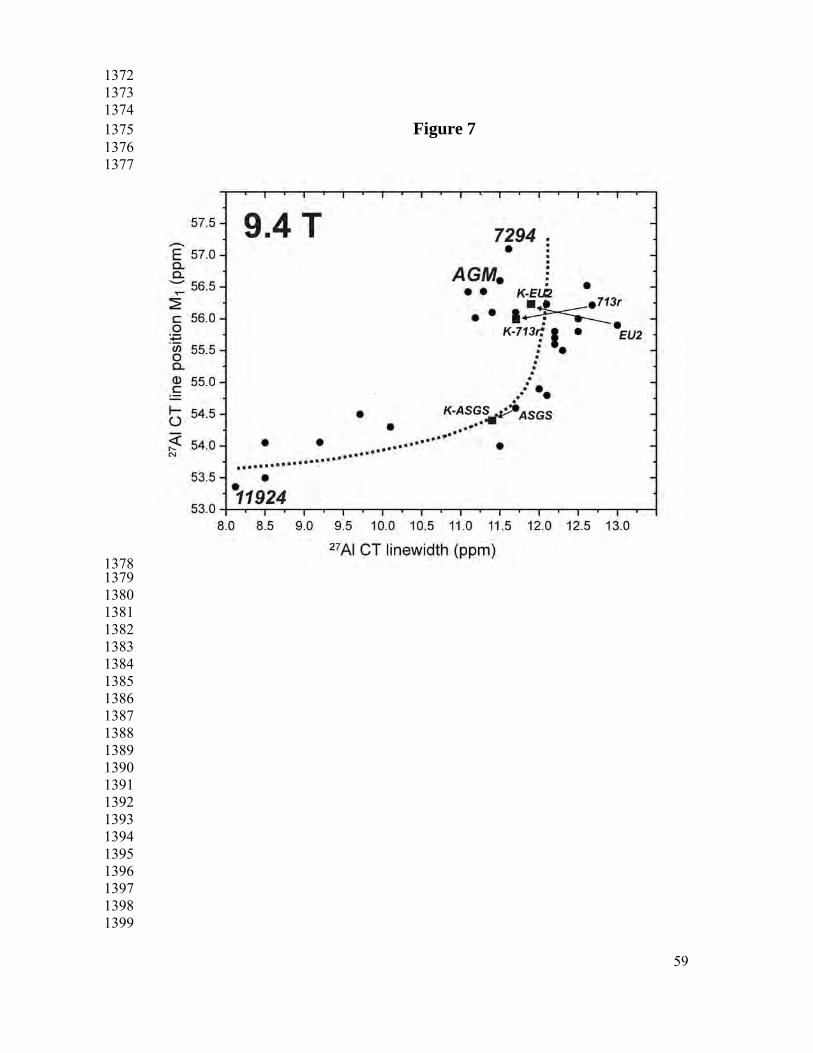
59
1372 1373 1374
Figure 7 1375 1376 1377
1378 1379
1380 1381 1382 1383 1384 1385 1386 1387 1388 1389 1390 1391 1392 1393 1394 1395 1396 1397 1398 1399

60
1400 1401 1402 1403
Figure 8 1404 1405
1406 1407 1408 1409
1410 1411 1412 1413 1414 1415 1416 1417 1418 1419 1420 1421 1422

61
1423 1424 1425
Figure 9 1426 1427
1428 1429 1430 1431 1432

62
1433 1434 1435 1436
Figure 10 1437
1438 1439 1440 1441 1442 1443 1444 1445 1446 1447 1448 1449 1450 1451
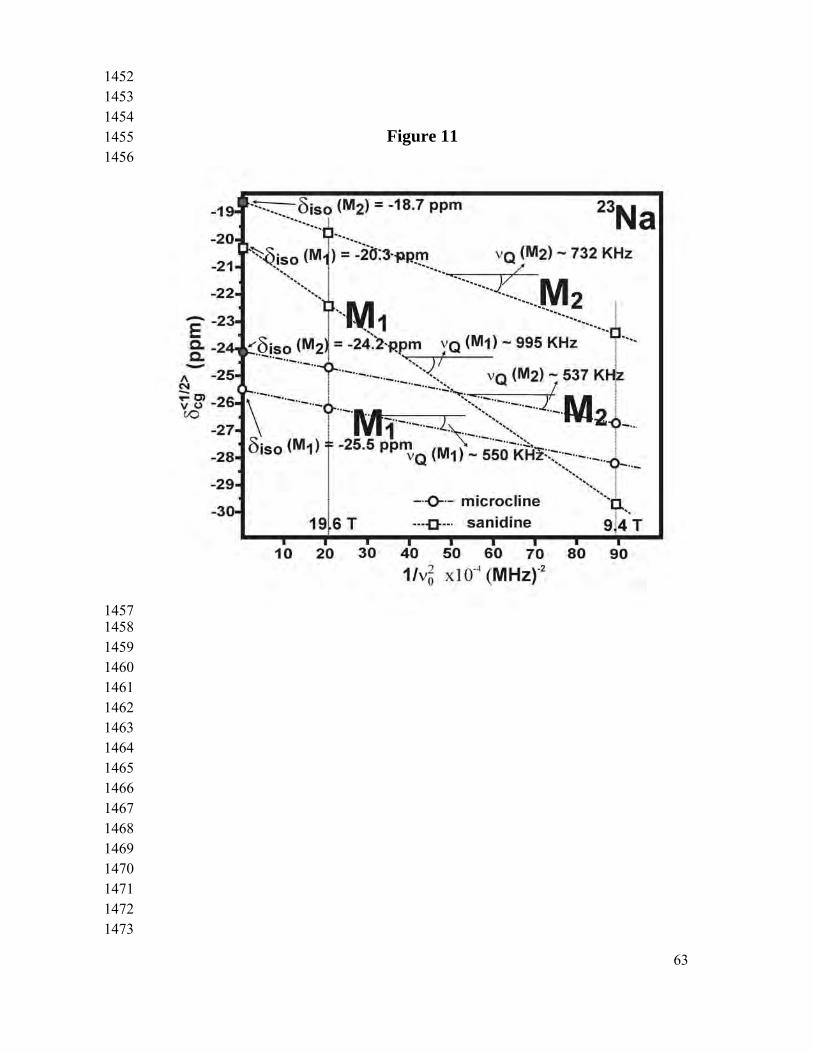
63
1452 1453 1454
Figure 11 1455 1456
1457 1458 1459 1460 1461 1462 1463 1464 1465 1466 1467 1468 1469 1470 1471 1472 1473

64
Figure 12 1474
1475 1476 1477 1478

65
1479 1480
Supporting information online 1481 1482 1483
Table 5 1484 1485
Peak intensities of the specific simulations of the 29Si MAS NMR spectra 1486 1487
Specimens 9544 176 116 FB4 K-ASGS 1406 AGM K-EU2 sim1 sim2
T1O (0Si, 4Al) 0.00 0.06 0.11 0.12 0.12 0.10 0.25 - 0.23 T1O (1Si, 3Al) 0.00 0.44 0.92 0.99 1.36 1.04 1.98 - 1.95 T1O (2Si, 2Al) 0.00 1.20 2.52 2.78 4.35 3.75 5.94 - 5.98 T1O (3Si, 1Al) 0.00 1.39 2.75 3.33 3.40 5.63 7.92 20.00 7.97 T1O (4Si, 0Al) 0.00 0.58 1.03 1.45 0.77 2.81 3.96 - 3.89 T1m (0Si, 4Al) 0.00 0.00 0.01 0.03 0.01 0.11 0.21 - 0.27 T1m (1Si, 3Al) 0.00 0.12 0.45 0.71 0.55 1.70 2.09 - 2.49 T1m (2Si, 2Al) 0.00 3.13 5.46 6.32 6.44 8.32 7.51 - 8.26 T1m (3Si, 1Al) 33.33 26.71 21.35 19.47 18.77 14.51 11.27 26.66 11.62 T1m (4Si, 0Al) 0.00 2.38 4.40 4.81 5.91 5.38 5.63 - 5.72 T2O (0Si, 4Al) 0.00 0.00 0.01 0.01 0.01 0.04 0.21 - 0.14 T2O (1Si, 3Al) 0.00 0.12 0.37 0.46 0.55 0.83 2.09 - 1.66 T2O (2Si, 2Al) 0.00 3.13 5.11 5.36 6.43 5.95 7.31 - 6.63 T2O (3Si, 1Al) 33.33 26.71 21.62 20.13 18.77 15.32 11.27 26.66 11.00 T2O (4Si, 0Al) 0.00 2.38 4.22 4.35 5.91 4.47 5.64 - 5.48 T2m (0Si, 4Al) 0.00 0.03 0.09 0.14 0.08 0.33 0.42 - 0.39 T2m (1Si, 3Al) 0.00 1.70 2.67 3.23 2.42 4.12 3.34 - 3.34 T2m (2Si, 2Al) 33.33 26.30 20.81 18.49 18.63 13.09 9.18 26.66 9.23 T2m (3Si, 1Al) 0.00 3.52 5.71 7.10 5.18 10.17 10.02 - 10.01 T2m (4Si, 0Al) 0.00 0.12 0.40 0.71 0.37 2.31 3.76 - 3.73
1488 Peak intensities in % are calculated assuming a constant Si/Al ratio of 3.0 and 1489
Loewenstein’s Al-O-Al avoidance rule, after Xiao et al. (1995). The chemical shifts 1490 produced by replacement of Si by Al, to calculate different possible Si Q4 (nAl) n = 0, 1491
1, 2, 3, 4, was assumed ± 4.85 ppm in all cases. The δx values are in ppm. 1492 1493 1494 1495 1496 1497 1498 1499 1500 1501 1502 1503 1504 1505 1506 1507 1508 1509
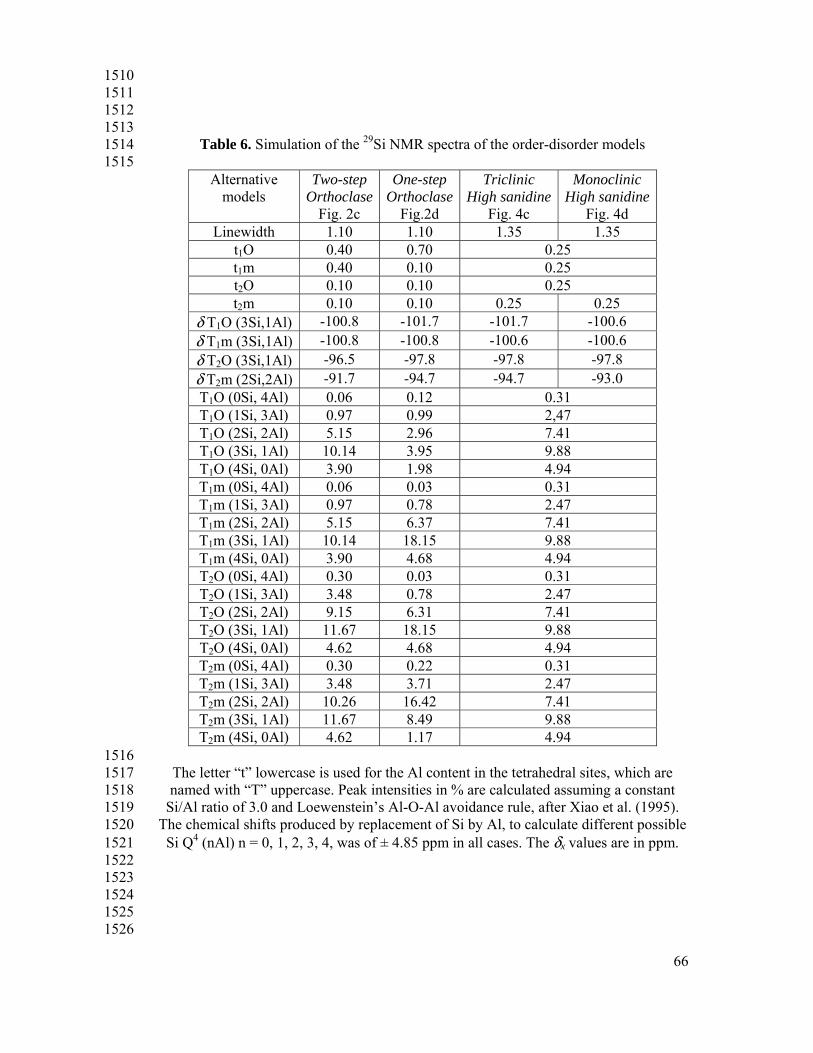
66
1510 1511 1512 1513
Table 6. Simulation of the 29Si NMR spectra of the order-disorder models 1514 1515
Alternative models
Two-step Orthoclase
Fig. 2c
One-step Orthoclase
Fig.2d
Triclinic High sanidine
Fig. 4c
Monoclinic High sanidine
Fig. 4d Linewidth 1.10 1.10 1.35 1.35
t1O 0.40 0.70 0.25 t1m 0.40 0.10 0.25 t2O 0.10 0.10 0.25 t2m 0.10 0.10 0.25 0.25
δ T1O (3Si,1Al) -100.8 -101.7 -101.7 -100.6 δ T1m (3Si,1Al) -100.8 -100.8 -100.6 -100.6 δ T2O (3Si,1Al) -96.5 -97.8 -97.8 -97.8 δ T2m (2Si,2Al) -91.7 -94.7 -94.7 -93.0 T1O (0Si, 4Al) 0.06 0.12 0.31 T1O (1Si, 3Al) 0.97 0.99 2,47 T1O (2Si, 2Al) 5.15 2.96 7.41 T1O (3Si, 1Al) 10.14 3.95 9.88 T1O (4Si, 0Al) 3.90 1.98 4.94 T1m (0Si, 4Al) 0.06 0.03 0.31 T1m (1Si, 3Al) 0.97 0.78 2.47 T1m (2Si, 2Al) 5.15 6.37 7.41T1m (3Si, 1Al) 10.14 18.15 9.88 T1m (4Si, 0Al) 3.90 4.68 4.94 T2O (0Si, 4Al) 0.30 0.03 0.31 T2O (1Si, 3Al) 3.48 0.78 2.47 T2O (2Si, 2Al) 9.15 6.31 7.41 T2O (3Si, 1Al) 11.67 18.15 9.88 T2O (4Si, 0Al) 4.62 4.68 4.94 T2m (0Si, 4Al) 0.30 0.22 0.31 T2m (1Si, 3Al) 3.48 3.71 2.47 T2m (2Si, 2Al) 10.26 16.42 7.41 T2m (3Si, 1Al) 11.67 8.49 9.88 T2m (4Si, 0Al) 4.62 1.17 4.94
1516 The letter “t” lowercase is used for the Al content in the tetrahedral sites, which are 1517 named with “T” uppercase. Peak intensities in % are calculated assuming a constant 1518
Si/Al ratio of 3.0 and Loewenstein’s Al-O-Al avoidance rule, after Xiao et al. (1995). 1519 The chemical shifts produced by replacement of Si by Al, to calculate different possible 1520
Si Q4 (nAl) n = 0, 1, 2, 3, 4, was of ± 4.85 ppm in all cases. The δx values are in ppm. 1521 1522
1523 1524 1525 1526

67
1527 1528