Embed Size (px)
Citation preview
1
Review of Youth Training – Background Evidence Presentation
October 2014
2
• This slide pack set outs the economic and social context within which the review of youth training is taking place. It includes:
a summary of key messages;
the economic and labour market context;
the economic context for young people in particular;
the social context;
Northern Ireland’s skills profile and education statistics; and
national and international evidence of benefits of investment in vocational training especially for young people.
Objectives

3
Summary of key messages

• While the global downturn had a major impact on the NI economy in relation to falling output and rising unemployment a number of economic indicators have recently shown that the economy is moving back in a positive direction.
• The recent economic growth data in NI has largely seen a positive upward trend in output; more jobs are being created and this has lead to lower rates of unemployment.
• Longer term economic challenges remain: Northern Ireland continues to have low levels of output per head, a weak private sector.
• In terms of salary NI has the lowest salary of all UK regions however there is strong evidence that higher skills are associated with higher earnings.
• Northern Ireland is less well developed than the rest of the UK in a number of sectors that are likely to drive future growth such as ICT, Finance and Professional and Technical Activities. In addition youth unemployment rates are particularly high in Northern Ireland compared to the rest of the UK and many European countries.
4
Summary of key messages
• Skill levels in Northern Ireland have improved steadily over recent years. With the proportion of working aged adults qualified to level 2+, 3+ and 4+ all increasing from 2006 levels.
• However despite these figures NI skills profile is still weaker than other UK countries and the ROI.
• Almost 70% of pupils are now staying at school beyond year 12 and more school leavers are now entering HE and FE institutions.
• While there is an improving trend in the proportion of school leavers achieving at least 5 GCSE’s A*-C, by 2012/13, 21.5% of school leavers are still not achieving 5 GCSEs A*-C and 37.8% of pupils leave school without 5 GCSEs A*-C including English and Maths.
5
Summary of key messages (Cont’d)
• Literacy rates play an important role in the probability of not being in Education Employment or Training (NEET). In NI the literacy rates of school children (15 years old) are similar to the OECD average, however those aged 16-18 have literacy levels that are below the OECD average.
• Skills will be an important driver for growth and as the NI economy develops its demand for higher level skills will increase.
• Current skills deficiencies in NI include; employers noting difficulties recruiting people with the skills they need across a range of sectors from trade occupations to software development. Issues also relate to improving skill provision, sector attractiveness and stakeholder engagement.
• In NI employer investment in training per employee is relatively low by UK standards with 77% of NI firms providing training for staff compared to a UK average of 86% (NI Employer Skill Survey 2013)
6
Summary of key messages (Cont’d)
• Domestically Northern Ireland is making progress in terms of upskilling the workforce, However there is still a significant percentage of our workforce still that have no or low qualifications.
• There is a need to increase higher level skills (qualifications level 4 and above) with 50% of jobs in 2020 likely to require skills at that level including higher professional and technical skills; There is also a need for additional and improved technical skills across a range of sectors; Northern Ireland requires more individuals achieving STEM qualifications; and Vocational Training will have a critical role to play in addressing these needs and developing the skills required both now and in the future. Also there is a need for increasing literacy and numeracy skills as well as managerial and leadership skills.
• vocational qualifications deliver substantial wage and employment benefits over the learner’s lifetime, On average, individuals with an intermediate apprenticeship earn £48,000 to £74,000 more than similar individuals with Level 1 qualifications.
• Evidence from the Employer Skills Survey show that 70% of employers in Northern Ireland consider skills to have a positive impact on the performance of their employees, the highest of all UK countries. Yet a lower proportion of employers in Northern Ireland have taken steps to address the skills gaps of their staff - the lowest in the UK.
7
Summary of key messages (Cont’d)

8
The Economic and Labour Market Context

Source: NISRA, ONS
Economic growth has now returned after the Northern Ireland economy suffered significantly in the face of the global economic downturn. In addition, this growth is predicted to continue.
Q 4
Q 1
Q 2
Q 3
Q 4
Q 1
Q 2
Q 3
Q 4
Q 1
Q 2
Q 3
Q 4
Q 1
Q 2
Q 3
Q 4
Q 1
Q 2
Q 3
Q 4
Q 1
Q 2
Q 3
Q 4
Q 1
Q 2
Q 3
Q 4
Q 1
Q 2
Q 3
Q 4
Q 1
Q 2
Q 3
Q 4
Q 1
Q 2
Q 3
Q 4
Q 1
Q 2
Q 3
Q 4
Q 1
Q 2
2002
2003 2004 2005 2006 2007 2008 2009 2010 2011 2012 2013 2014
85
90
95
100
105
110
115UK and NI Economic Output
NI UK
Ind
ex
(2
01
0 =
10
0)
A period of impressive growth up to 2007.
Economic downturn
NI downturn longerGrowth now taking rootbut in NI economy well below output peak
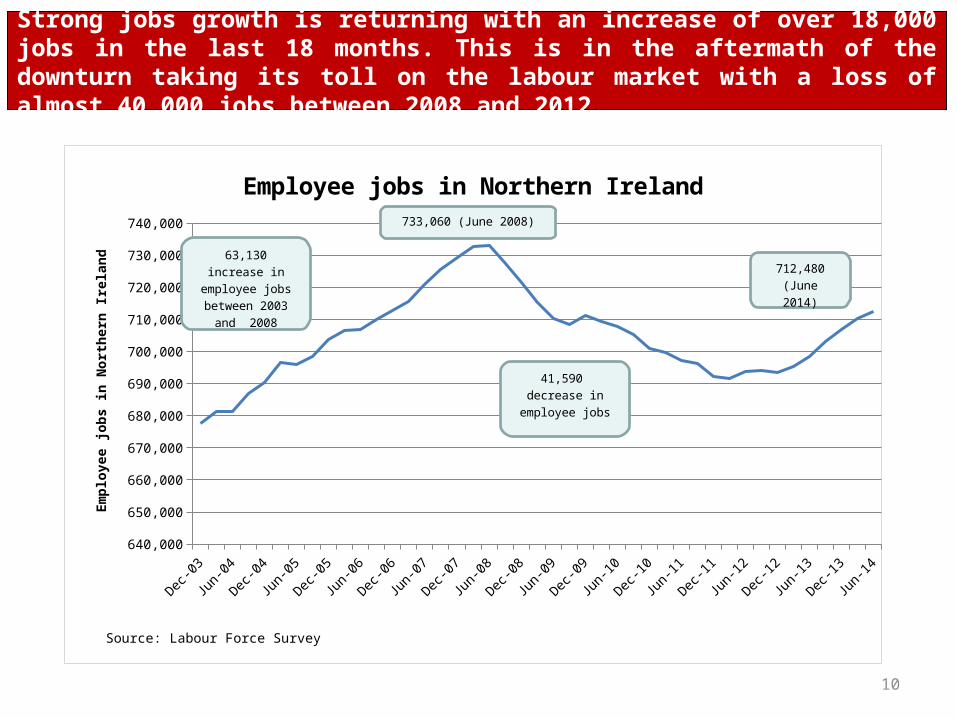
Strong jobs growth is returning with an increase of over 18,000 jobs in the last 18 months. This is in the aftermath of the downturn taking its toll on the labour market with a loss of almost 40,000 jobs between 2008 and 2012.
10
Dec-03
Jun-04
Dec-04
Jun-05
Dec-05
Jun-06
Dec-06
Jun-07
Dec-07
Jun-08
Dec-08
Jun-09
Dec-09
Jun-10
Dec-10
Jun-11
Dec-11
Jun-12
Dec-12
Jun-13
Dec-13
Jun-14640,000
650,000
660,000
670,000
680,000
690,000
700,000
710,000
720,000
730,000
740,000
Employee jobs in Northern Ireland
Source: Labour Force Survey
Empl
oyee
jobs
in N
orth
ern
Irela
nd
733,060 (June 2008)
41,590 decrease in em-
ployee jobs
63,130 increase in employee jobs be-tween 2003 and
2008
712,480(June 2014)
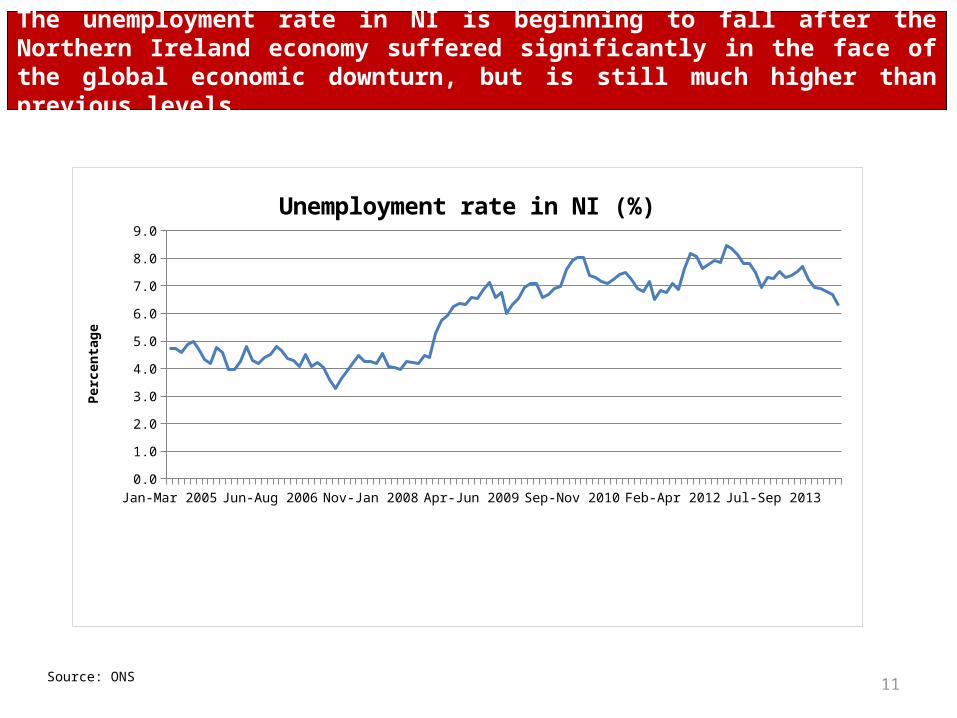
The unemployment rate in NI is beginning to fall after the Northern Ireland economy suffered significantly in the face of the global economic downturn, but is still much higher than previous levels.
Source: ONS 11
Jan-Mar 2005 Feb-Apr 2006Mar-May 2007Apr-Jun 2008 May-Jul 2009 Jun-Aug 2010 Jul-Sep 2011 Aug-Oct 2012 Sep-Nov 20130.0
1.0
2.0
3.0
4.0
5.0
6.0
7.0
8.0
9.0
Unemployment rate in NI (%)
Perc
enta
ge
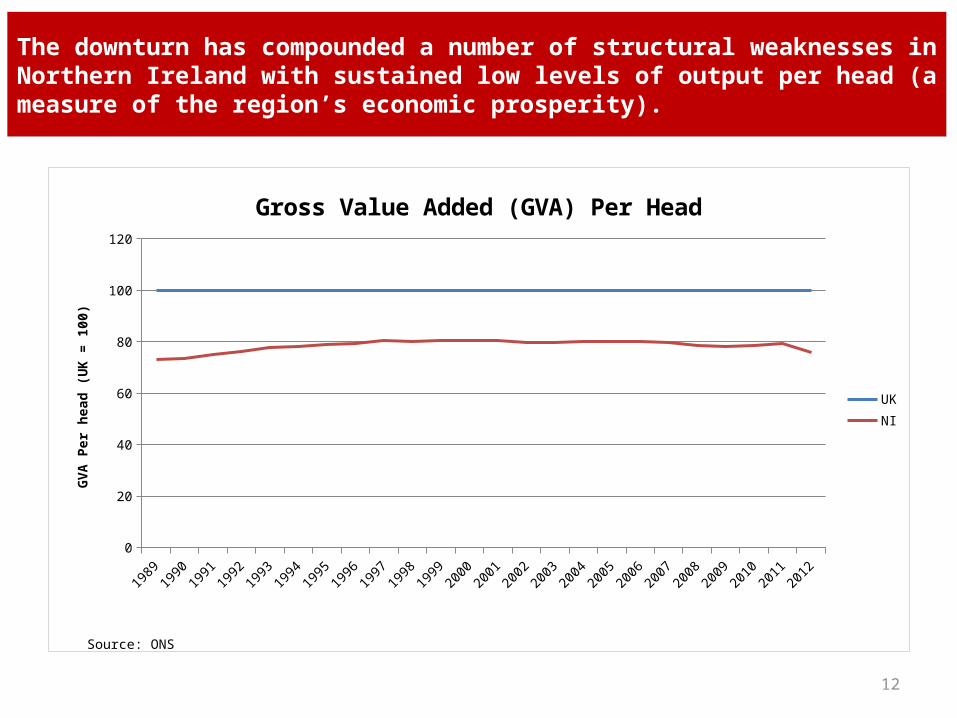
The downturn has compounded a number of structural weaknesses in Northern Ireland with sustained low levels of output per head (a measure of the region’s economic prosperity).
12
1989199019911992199319941995199619971998199920002001200220032004200520062007200820092010201120120
20
40
60
80
100
120
Gross Value Added (GVA) Per Head
UKNI
Source: ONS
GVA
Per h
ead
(UK
= 10
0)
13
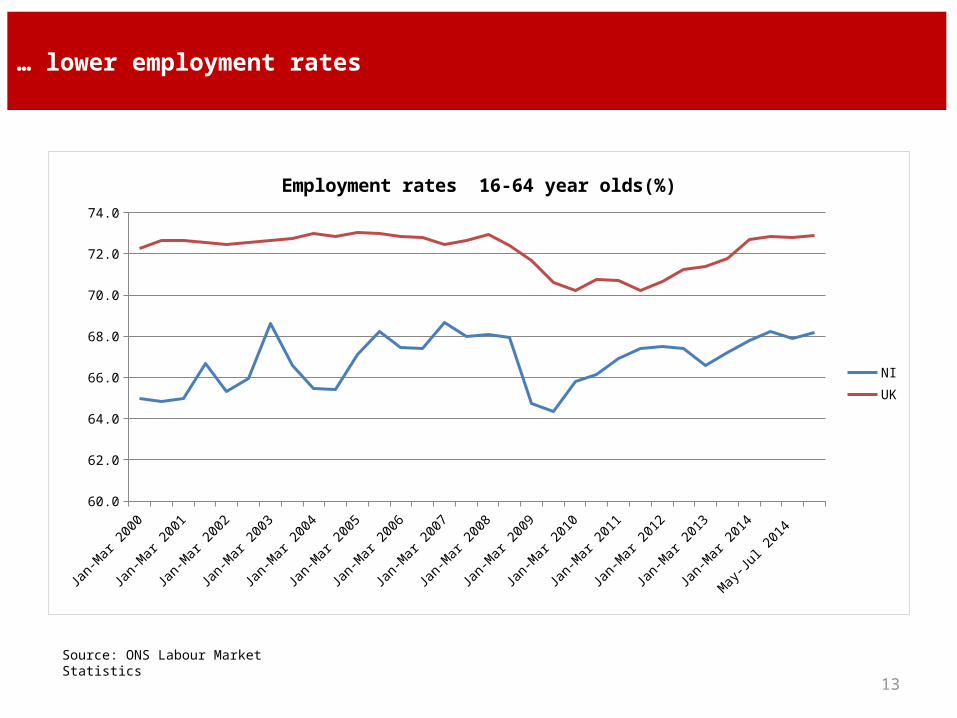
… lower employment rates
Source: ONS Labour Market Statistics
Jan-M
ar 2000
Jul-Sep
2000
Jan-M
ar 2001
Jul-Sep
2001
Jan-M
ar 2002
Jul-Sep
2002
Jan-M
ar 2003
Jul-Sep
2003
Jan-M
ar 2004
Jul-Sep
2004
Jan-M
ar 2005
Jul-Sep
2005
Jan-M
ar 2006
Jul-Sep
2006
Jan-M
ar 2007
Jul-Sep
2007
Jan-M
ar 2008
Jul-Sep
2008
Jan-M
ar 2009
Jul-Sep
2009
Jan-M
ar 2010
Jul-Sep
2010
Jan-M
ar 2011
Jul-Sep
2011
Jan-M
ar 2012
Jul-Sep
2012
Jan-M
ar 2013
Jul-Sep
2013
Jan-M
ar 2014
Apr-Jun 2014
May-Ju
l 2014
Jun-Aug 2
01460.0
62.0
64.0
66.0
68.0
70.0
72.0
74.0
Employment rates 16-64 year olds(%)
NIUK
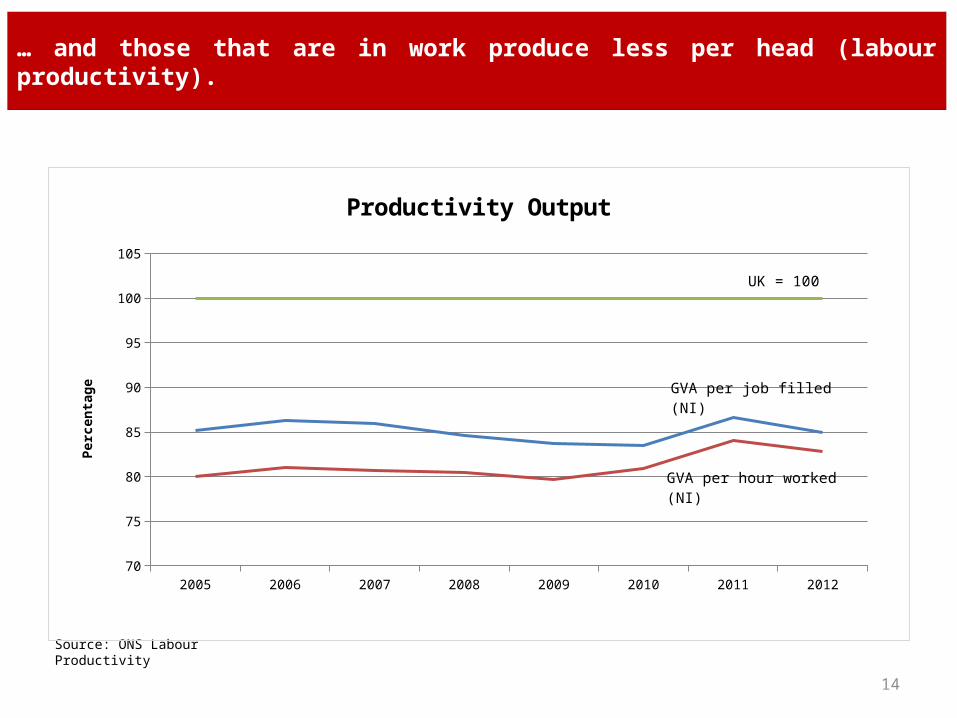
… and those that are in work produce less per head (labour productivity).
14
Source: ONS Labour Productivity
2005 2006 2007 2008 2009 2010 2011 201270
75
80
85
90
95
100
105
Productivity Output
Perc
enta
ge
GVA per job filled (NI)
GVA per hour worked (NI)
UK = 100
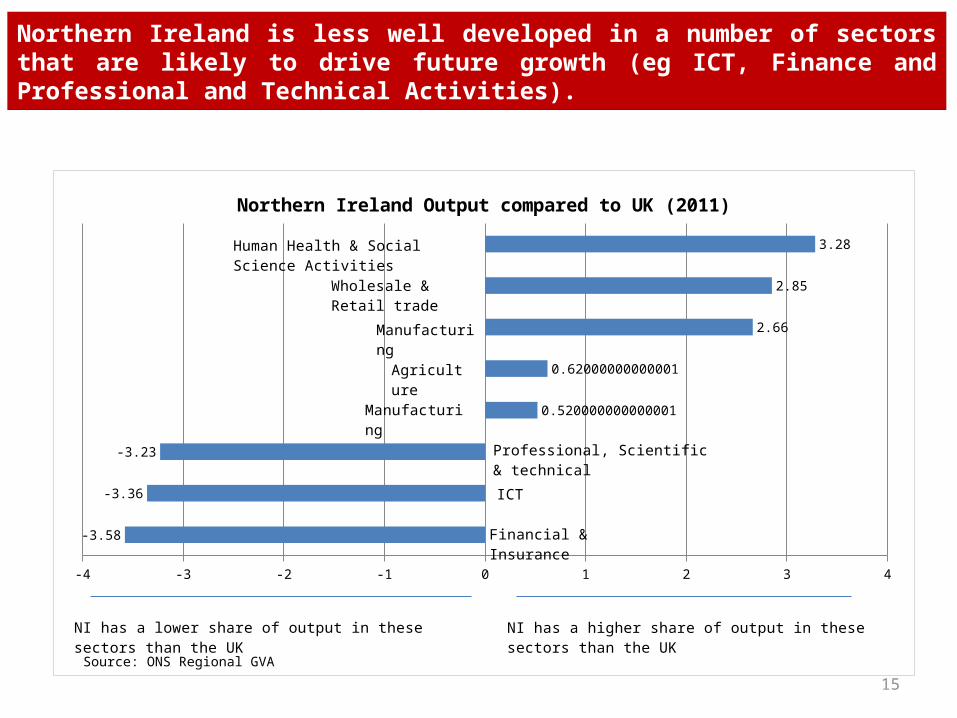
Northern Ireland is less well developed in a number of sectors that are likely to drive future growth (eg ICT, Finance and Professional and Technical Activities).
15
-4 -3 -2 -1 0 1 2 3 4
-3.58
-3.36
-3.23
0.520000000000001
0.62000000000001
2.66
2.85
3.28
Northern Ireland Output compared to UK (2011)
Human Health & Social Science Activ-ities
Wholesale & Retail trade
Manufacturing
Agriculture
Manufacturing
Professional, Scientific & technical
ICT
Financial & Insurance
Source: ONS Regional GVA
NI has a higher share of output in these sectors than the UK
NI has a lower share of output in these sectors than the UK
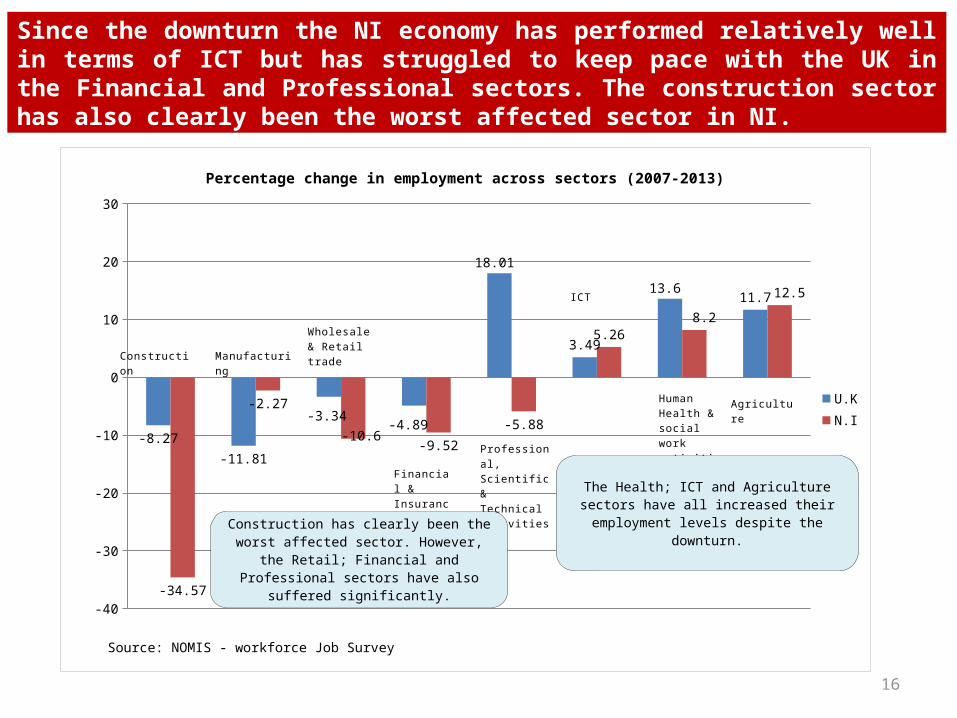
Since the downturn the NI economy has performed relatively well in terms of ICT but has struggled to keep pace with the UK in the Financial and Professional sectors. The construction sector has also clearly been the worst affected sector in NI.
16
-40
-30
-20
-10
0
10
20
30
-8.27
-11.81
-3.34-4.89
18.01
3.49
13.611.7
-34.57
-2.27
-10.6-9.52
-5.88
5.268.2
12.5
Percentage change in employment across sectors (2007-2013)
U.KN.I
Source: NOMIS - workforce Job Survey
Construction Manufacturing
Wholesale & Retail trade
Financial & Insurance
Professional, Scientific & Technical activities
ICT
Human Health & social work activities
Agriculture
Construction has clearly been the worst af-fected sector. However, the Retail; Financial and Professional sectors have also suffered
significantly.
The Health; ICT and Agriculture sectors have all increased their employment levels despite
the downturn.
17
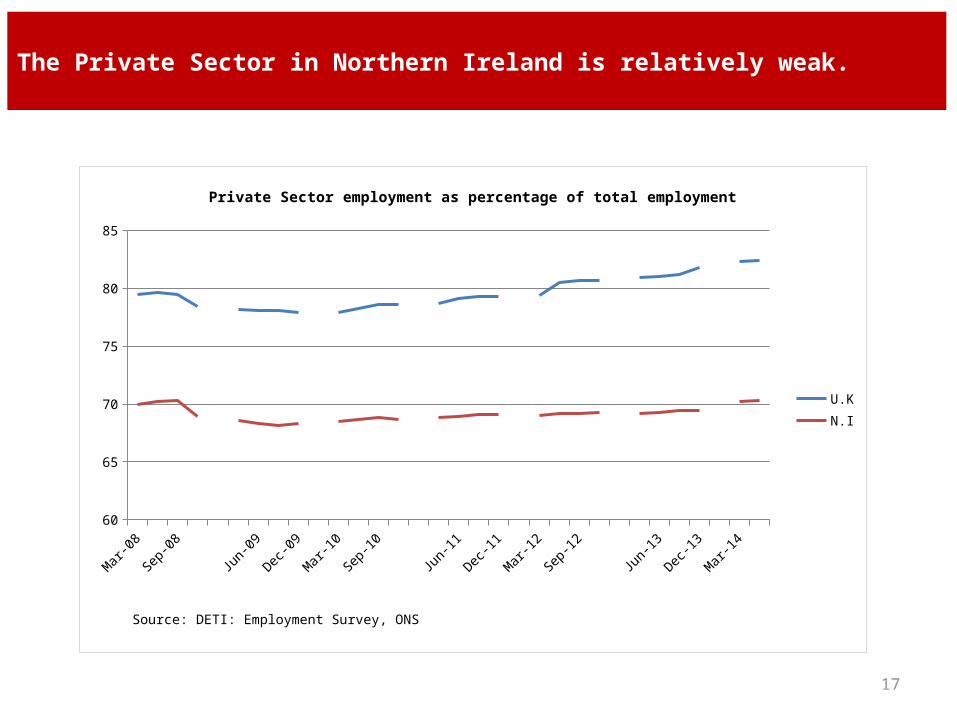
The Private Sector in Northern Ireland is relatively weak.
Mar-08
Jun-08
Sep-08
Dec-08
Mar-09
Jun-09
Sep-09
Dec-09
Mar-10
Jun-10
Sep-10
Dec-10
Mar-11
Jun-11
Sep-11
Dec-11
Mar-12
Jun-12
Sep-12
Dec-12
Mar-13
Jun-13
Sep-13
Dec-13
Mar-14
Jun-1460
65
70
75
80
85
Private Sector employment as percentage of total employment
U.KN.I
Source: DETI: Employment Survey, ONS
Sole
Small
Medium
Large
Sole
Small
Medium
Large
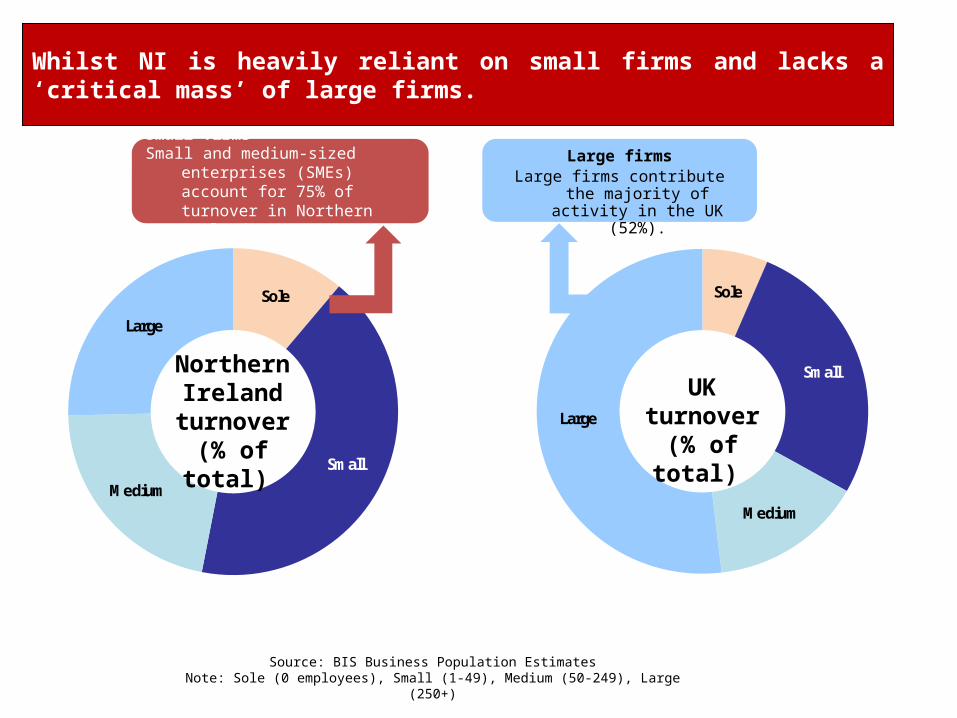
Small firmsSmall and medium-sized enterprises
(SMEs) account for 75% of turnover in Northern Ireland.
Large firmsLarge firms contribute the majority
of activity in the UK (52%).
Northern Ireland
turnover(% of total)
UKturnover
(% of total)
Source: BIS Business Population EstimatesNote: Sole (0 employees), Small (1-49), Medium (50-249), Large (250+)
Whilst NI is heavily reliant on small firms and lacks a ‘critical mass’ of large firms.
19
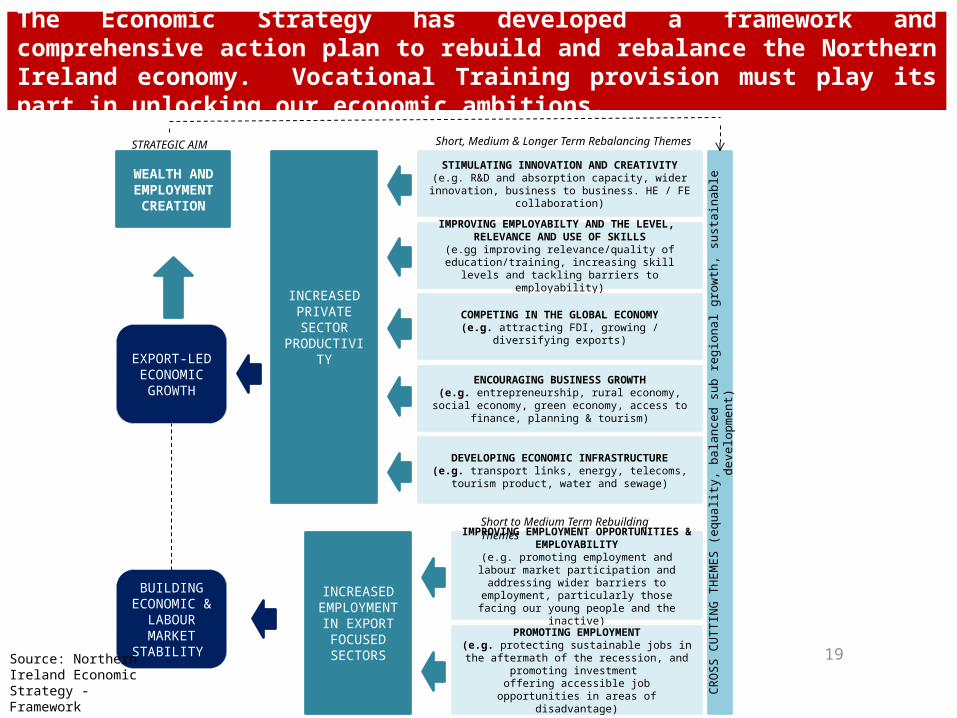
The Economic Strategy has developed a framework and comprehensive action plan to rebuild and rebalance the Northern Ireland economy. Vocational Training provision must play its part in unlocking our economic ambitions.
STIMULATING INNOVATION AND CREATIVITY(e.g. R&D and absorption capacity, wider innovation,
business to business. HE / FE collaboration)
IMPROVING EMPLOYABILTY AND THE LEVEL, RELEVANCE AND USE OF SKILLS
(e.gg improving relevance/quality of education/training, increasing skill levels and tackling barriers to employability)
COMPETING IN THE GLOBAL ECONOMY(e.g. attracting FDI, growing / diversifying exports)
ENCOURAGING BUSINESS GROWTH(e.g. entrepreneurship, rural economy, social economy, green economy, access to finance, planning & tourism)
DEVELOPING ECONOMIC INFRASTRUCTURE(e.g. transport links, energy, telecoms, tourism product,
water and sewage)
IMPROVING EMPLOYMENT OPPORTUNITIES & EMPLOYABILITY
(e.g. promoting employment and labour market participation and addressing wider barriers to
employment, particularly those facing our young people and the inactive)
PROMOTING EMPLOYMENT(e.g. protecting sustainable jobs in the aftermath of
the recession, and promoting investment offering accessible job opportunities in areas of
disadvantage)
CRO
SS C
UTT
ING
TH
EMES
(equ
ality
, bal
ance
d su
b re
gion
al g
row
th, s
usta
inab
le d
evel
opm
ent)
INCREASEDPRIVATESECTOR
PRODUCTIVITY
INCREASEDEMPLOYMENT
IN EXPORT FOCUSED SECTORS
BUILDINGECONOMIC &
LABOURMARKET
STABILITY
EXPORT-LED ECONOMIC GROWTH
WEALTH AND EMPLOYMENT
CREATION
Short to Medium Term Rebuilding Themes
Short, Medium & Longer Term Rebalancing ThemesSTRATEGIC AIM
Source: Northern Ireland Economic Strategy - Framework
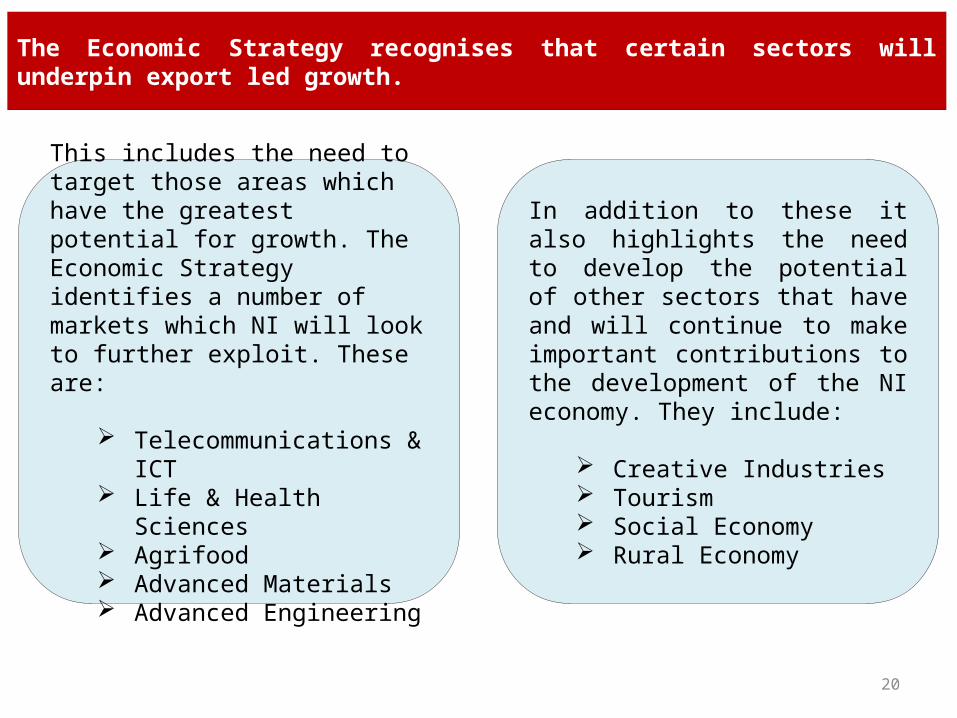
The Economic Strategy recognises that certain sectors will underpin export led growth.
20
In addition to these it also highlights the need to develop the potential of other sectors that have and will continue to make important contributions to the development of the NI economy. They include:
Creative Industries Tourism Social Economy Rural Economy
This includes the need to target those areas which have the greatest potential for growth. The Economic Strategy identifies a number of markets which NI will look to further exploit. These are:
Telecommunications & ICT Life & Health Sciences Agrifood Advanced Materials Advanced Engineering
• The global downturn has had a major impact on the NI economy: However, economic growth has returned with consistent increases in output; more jobs being created and lower levels of unemployment.
• Longer term economic challenges remain: Northern Ireland continues to have low levels of output per head, lower private sector activity and productivity particularly in key growth sectors.
• The challenge is to successfully rebuild and rebalance the local economy: skills will be critical to unlocking the region’s economic aspirations and youth and vocational training provision will be an essential ingredient.
The Northern Ireland Economy: Key Messages
21
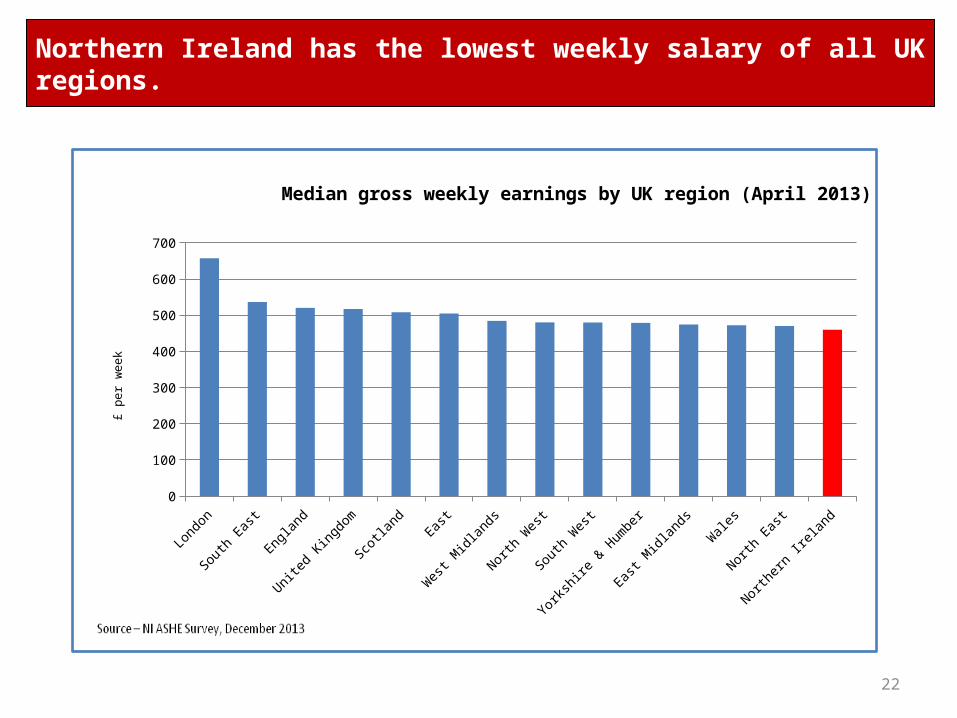
Northern Ireland has the lowest weekly salary of all UK regions.
22
Lond
on
South
Eas
t
Englan
d
United
King
dom
Scotla
ndEas
t
Wes
t Midl
ands
North
Wes
t
South
Wes
t
Yorks
hire
& Hum
ber
East M
idlan
ds
Wale
s
North
Eas
t
North
ern
Irelan
d0
100
200
300
400
500
600
700
Median gross weekly earnings by UK region (April 2013)
£ pe
r w
eek
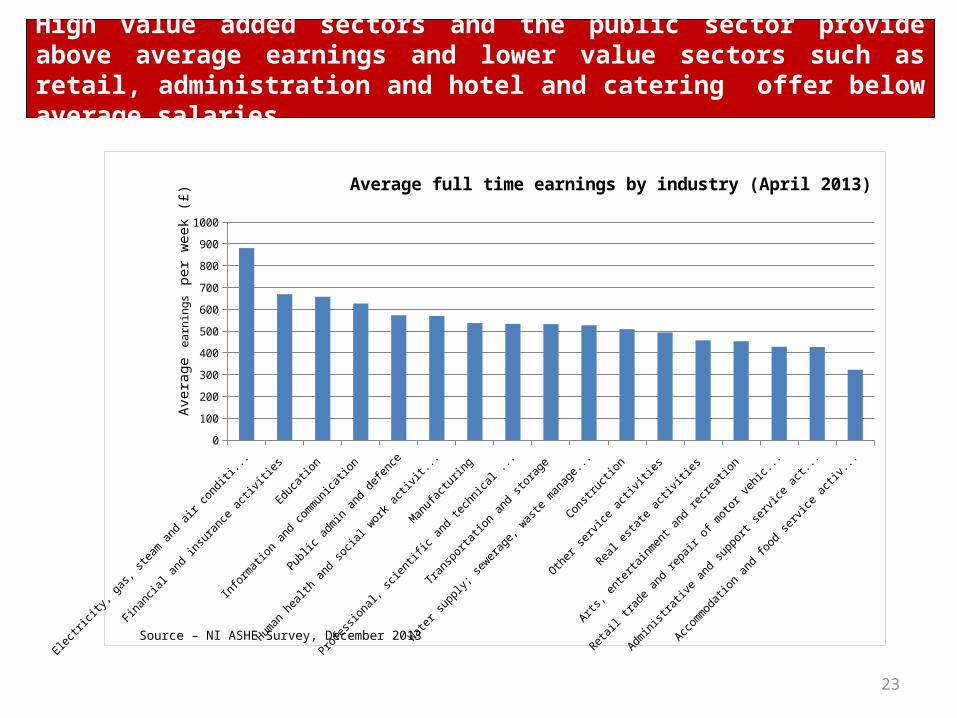
High value added sectors and the public sector provide above average earnings and lower value sectors such as retail, administration and hotel and catering offer below average salaries.
23
Electrici
ty, gas,
steam and air c
onditioning
Financial a
nd insu
rance acti
vities
Education
Information and co
mmunication
Public admin and defence
Human health and so
cial w
ork acti
vities
Manufactu
ring
Professi
onal, scie
ntific and te
chnica
l acti
vities
Transp
ortation and st
orage
Water s
upply; se
werage, waste
management
Constr
uction
Other s
ervice
activiti
es
Real e
state acti
vities
Arts
, enterta
inment and re
creation
Retail trade and re
pair of m
otor vehicl
es
Administ
rative and su
pport se
rvice
activiti
es
Acco
mmodation and food se
rvice
activiti
es 0
100
200
300
400
500
600
700
800
900
1000
Average full time earnings by industry (April 2013)
Ave
rage
ear
ning
s pe
r w
eek
(£)
Source – NI ASHE Survey, December 2013
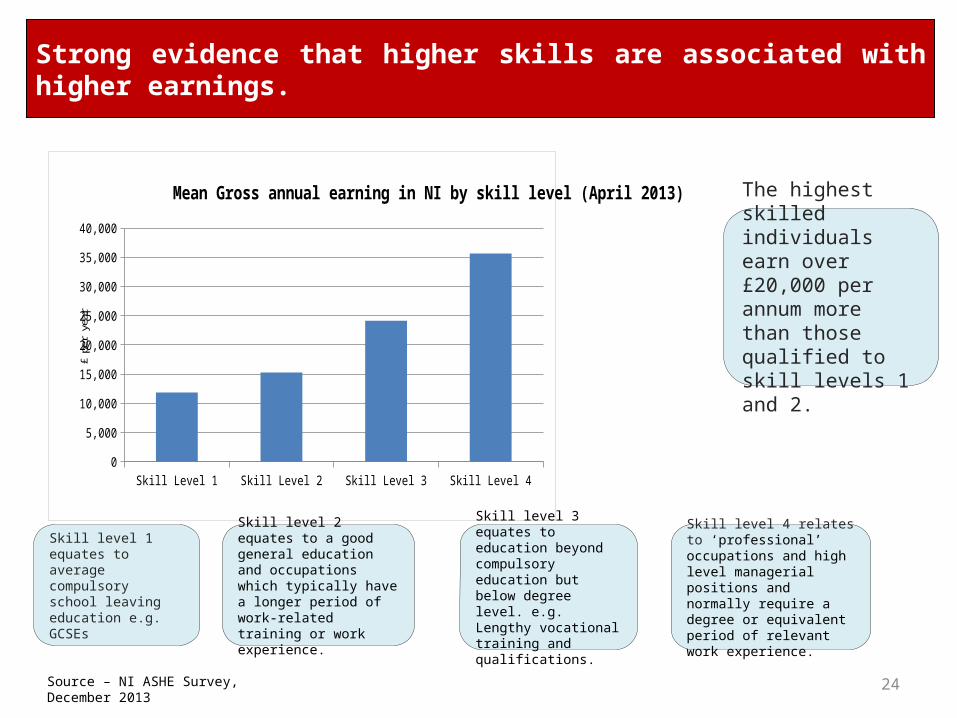
Strong evidence that higher skills are associated with higher earnings.
24
Skill Level 1 Skill Level 2 Skill Level 3 Skill Level 40
5,000
10,000
15,000
20,000
25,000
30,000
35,000
40,000
Mean Gross annual earning in NI by skill level (April 2013)
£ pe
r ye
ar
The highest skilled individuals earn over £20,000 per annum more than those qualified to skill levels 1 and 2.
Skill level 1 equates to average compulsory school leaving education e.g. GCSEs
Skill level 4 relates to ‘professional’ occupations and high level managerial positions and normally require a degree or equivalent period of relevant work experience.
Skill level 2 equates to a good general education and occupations which typically have a longer period of work-related training or work experience.
Skill level 3 equates to education beyond compulsory education but below degree level. e.g. Lengthy vocational training and qualifications.
Source – NI ASHE Survey, December 2013
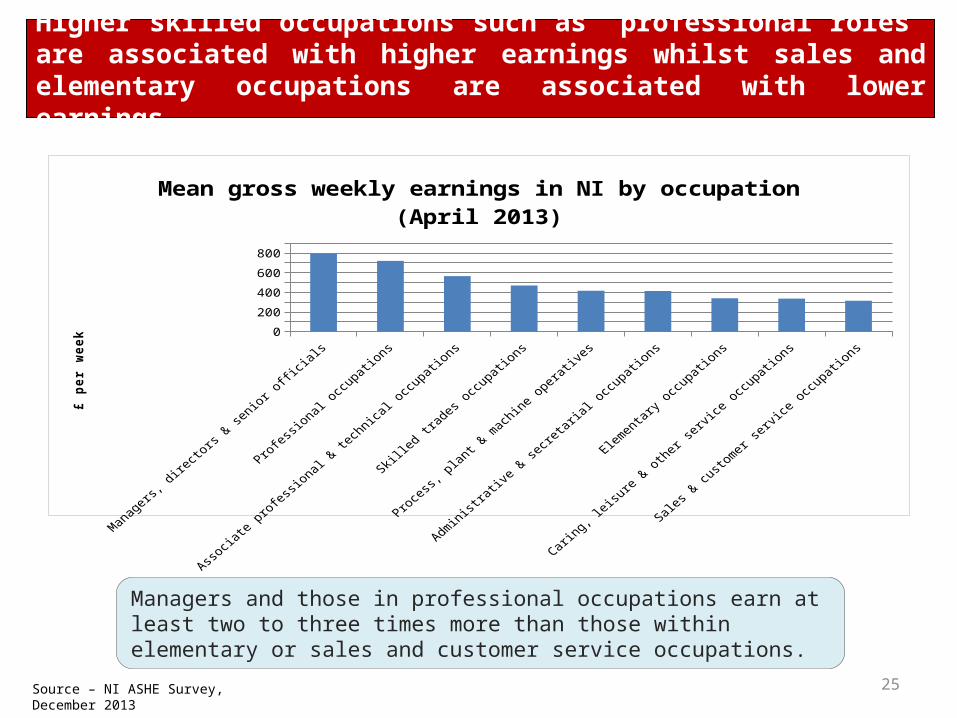
Higher skilled occupations such as ‘professional roles’ are associated with higher earnings whilst sales and elementary occupations are associated with lower earnings.
25
Managers and those in professional occupations earn at least two to three times more than those within elementary or sales and customer service occupations.
Source – NI ASHE Survey, December 2013
Manag
ers, d
irecto
rs & se
nior officia
ls
Profes
sional
occupati
ons
Associa
te pro
fessio
nal & te
chnica
l occu
pations
Skille
d trad
es occu
pations
Proces
s, plan
t & m
achine o
perative
s
Administrati
ve &
secre
tarial
occupati
ons
Elemen
tary o
ccupati
ons
Caring,
leisu
re & other
servic
e occu
pations
Sales
& cu
stomer
servic
e occu
pations
0100200300400500600700800900
Mean gross weekly earnings in NI by occupation (April 2013)
£ pe
r wee
k

26
The Economic Context for Young People
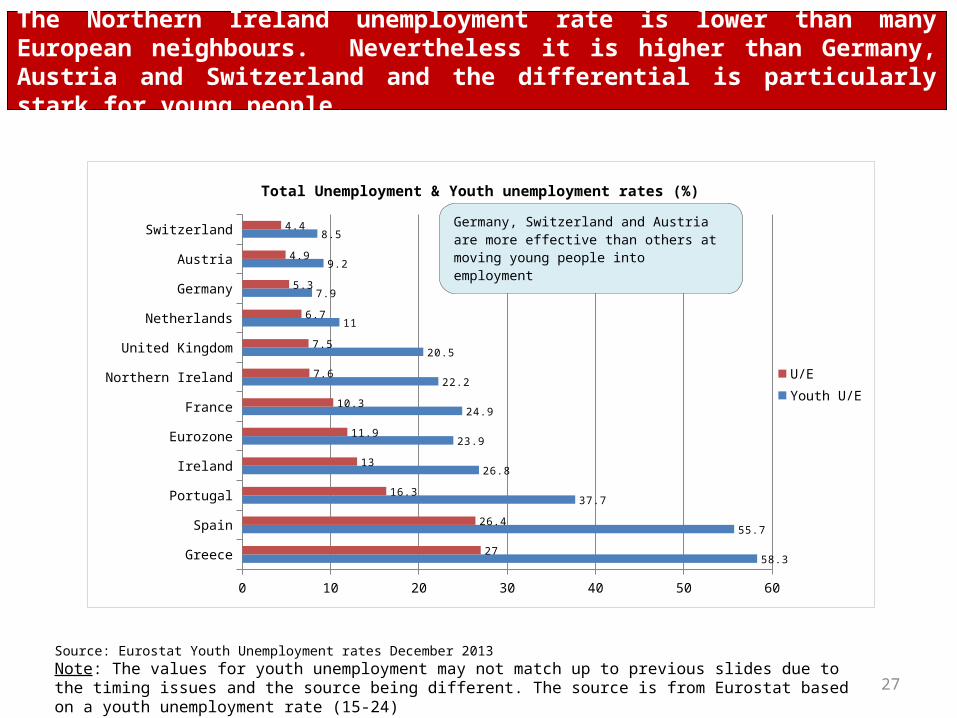
The Northern Ireland unemployment rate is lower than many European neighbours. Nevertheless it is higher than Germany, Austria and Switzerland and the differential is particularly stark for young people.
27
Source: Eurostat Youth Unemployment rates December 2013
Note: The values for youth unemployment may not match up to previous slides due to the timing issues and the source being different. The source is from Eurostat based on a youth unemployment rate (15-24)
Greece
Spain
Portugal
Ireland
Eurozone
France
Northern Ireland
United Kingdom
Netherlands
Germany
Austria
Switzerland
0 10 20 30 40 50 60
58.3
55.7
37.7
26.8
23.9
24.9
22.2
20.5
11
7.9
9.2
8.5
27
26.4
16.3
13
11.9
10.3
7.6
7.5
6.7
5.3
4.9
4.4
Total Unemployment & Youth unemployment rates (%)
U/EYouth U/E
Germany, Switzerland and Austria are more ef-fective than others at moving young people into employment
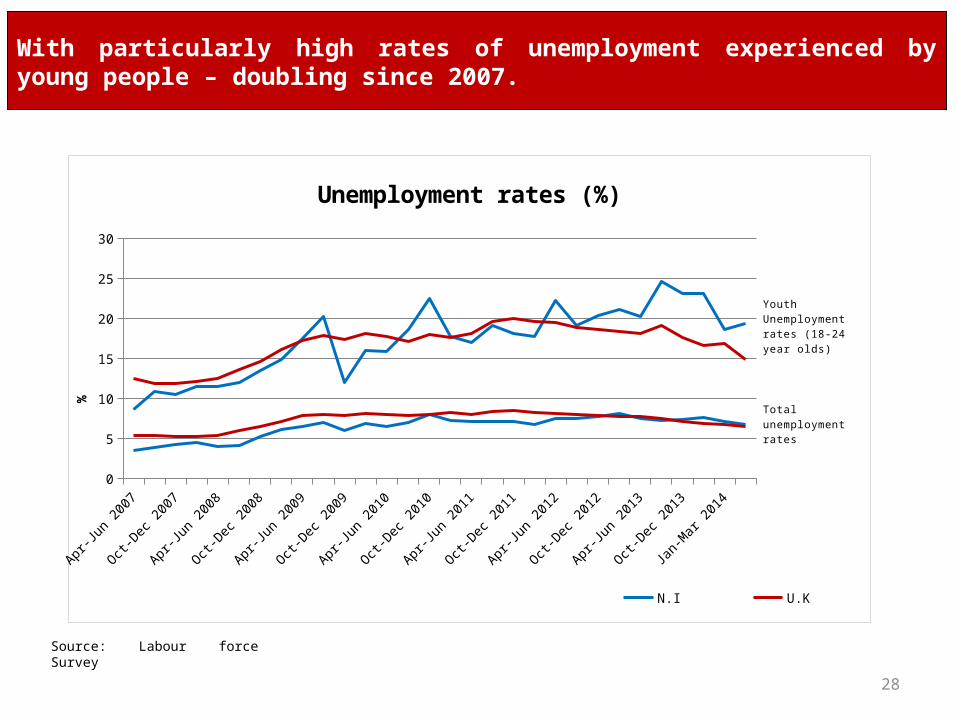
With particularly high rates of unemployment experienced by young people – doubling since 2007.
Source: Labour force Survey
28
Apr-Jun 2007
Jul-Sep
2007
Oct-Dec
2007
Jan-M
ar 2008
Apr-Jun 2008
Jul-Sep
2008
Oct-Dec
2008
Jan-M
ar 2009
Apr-Jun 2009
Jul-Sep
2009
Oct-Dec
2009
Jan-M
ar 2010
Apr-Jun 2010
Jul-Sep
2010
Oct-Dec
2010
Jan-M
ar 2011
Apr-Jun 2011
Jul-Sep
2011
Oct-Dec
2011
Jan-M
ar 2012
Apr-Jun 2012
Jul-Sep
2012
Oct-Dec
2012
Jan-M
ar 2013
Apr-Jun 2013
July-sep
t 2013
Oct-Dec
2013
Dec-Fe
b 2014
Jan-M
ar 2014
Apr-Jun 2014
0
5
10
15
20
25
30
Unemployment rates (%)
N.I U.K
%
Youth Unemploy-ment rates (18-24 year olds)
Total unemploy-ment rates
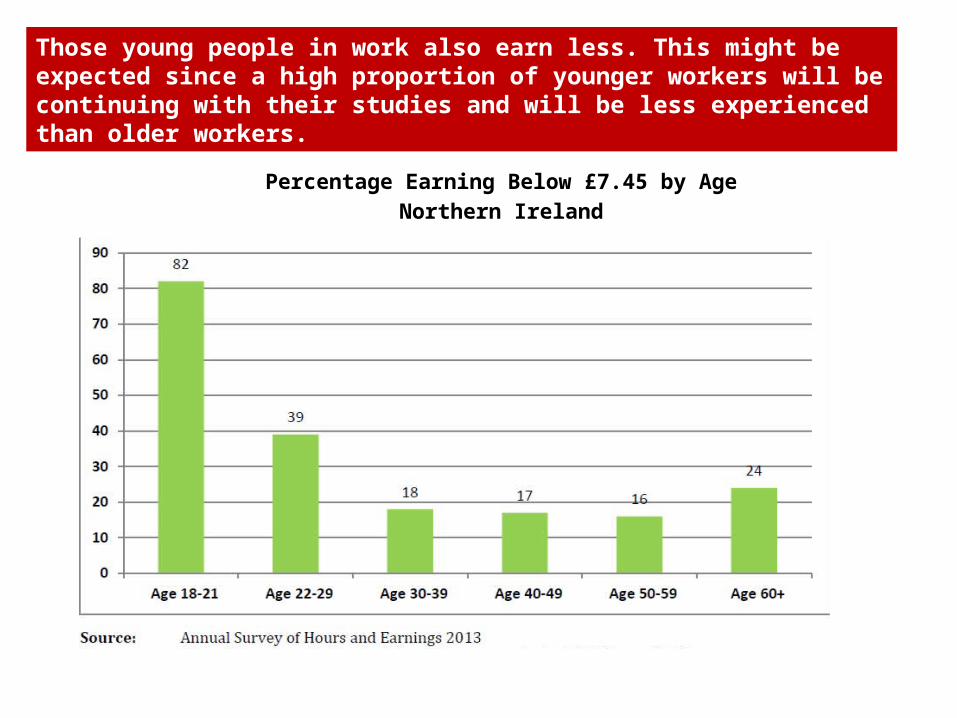
Percentage Earning Below £7.45 by AgeNorthern Ireland
Those young people in work also earn less. This might be expected since a high proportion of younger workers will be continuing with their studies and will be less experienced than older workers.
30
other
ICT
Administration
Accomadation & Food
Construction
Wholesale & Retail
Manufacturing
Agriculture
0 10 20 30 40 50 60 70
11
19
40
10
19
28
10
32
65
14
34
13
28
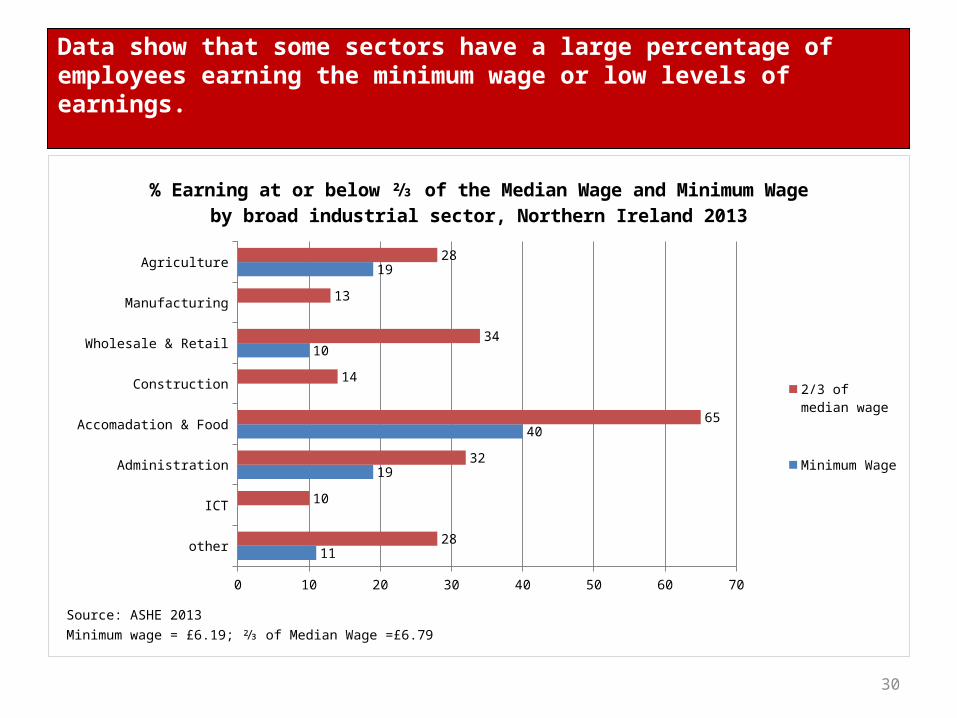
% Earning at or below ⅔ of the Median Wage and Minimum Wage by broad industrial sector, Northern Ireland 2013
2/3 of median wage
Minimum Wage
Source: ASHE 2013Minimum wage = £6.19; ⅔ of Median Wage =£6.79
Data show that some sectors have a large percentage of employees earning the minimum wage or low levels of earnings.
• As jobs become more specialised and skills intensive - the transition between education and the labour market has become increasingly complex.
• This is not just an issue related to the downturn but has been emphasised as a result of it.
• Research shows that periods of unemployment when young leave labour market scars for life (in terms of future earnings and future employment prospects).
Young people entering the economy are worthy of a particular focus.

32
Social Context
Changing incomes in Northern Ireland and the UK
33
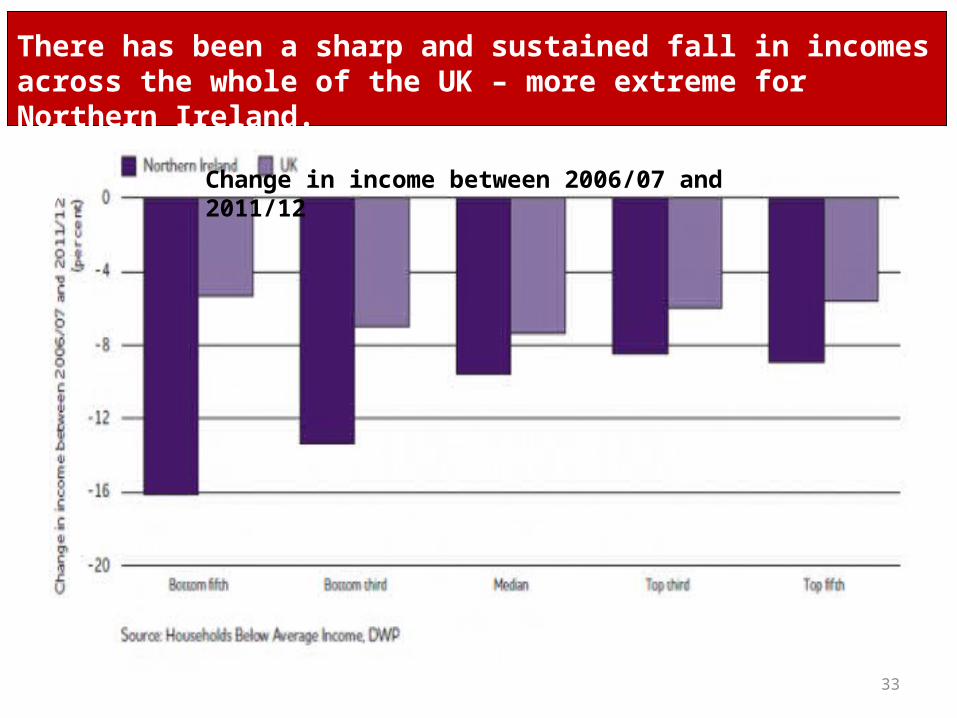
There has been a sharp and sustained fall in incomes across the whole of the UK – more extreme for Northern Ireland.
Change in income between 2006/07 and 2011/12
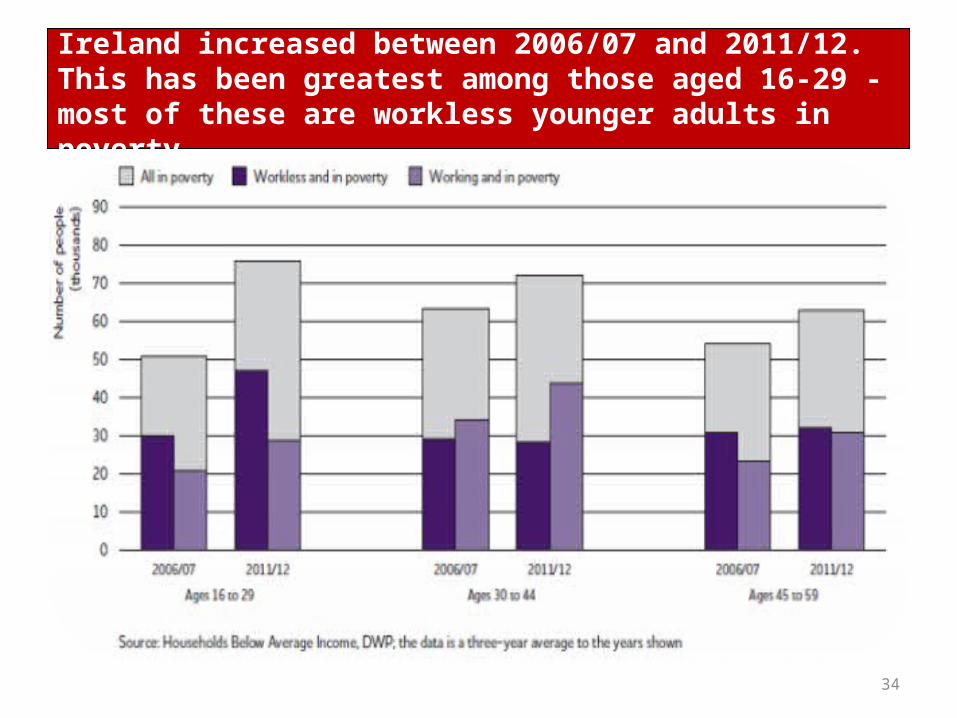
34
The number of people in poverty in Northern Ireland increased between 2006/07 and 2011/12. This has been greatest among those aged 16-29 - most of these are workless younger adults in poverty.
35
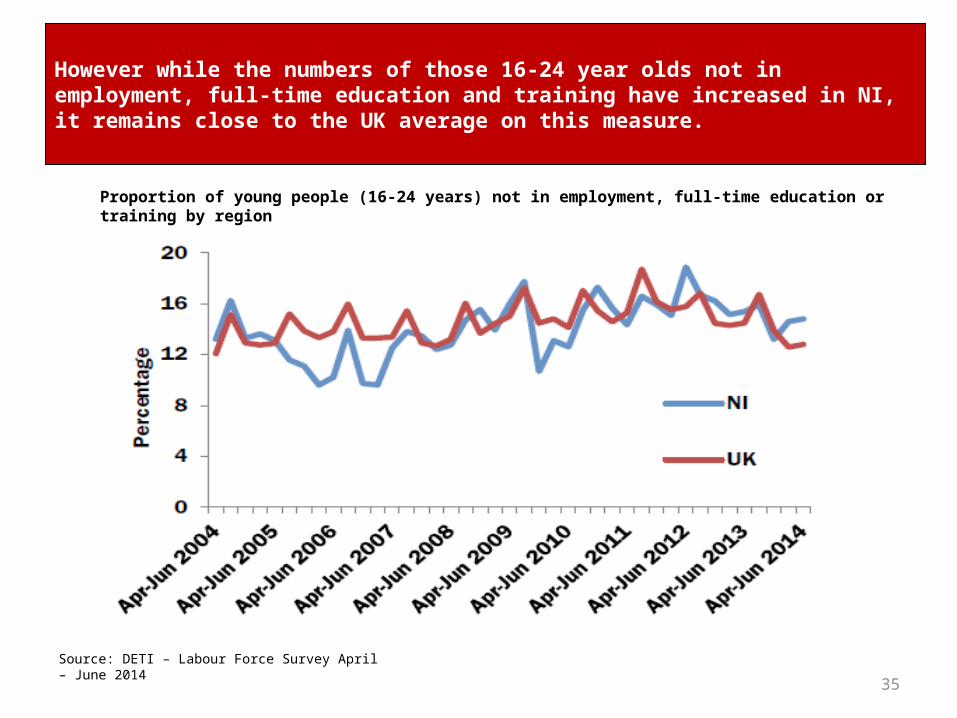
However while the numbers of those 16-24 year olds not in employment, full-time education and training have increased in NI, it remains close to the UK average on this measure.
Proportion of young people (16-24 years) not in employment, full-time education or training by region
Source: DETI – Labour Force Survey April – June 2014
36
10/11 11/12 12/130
1,000
2,000
3,000
4,000
5,000
6,000
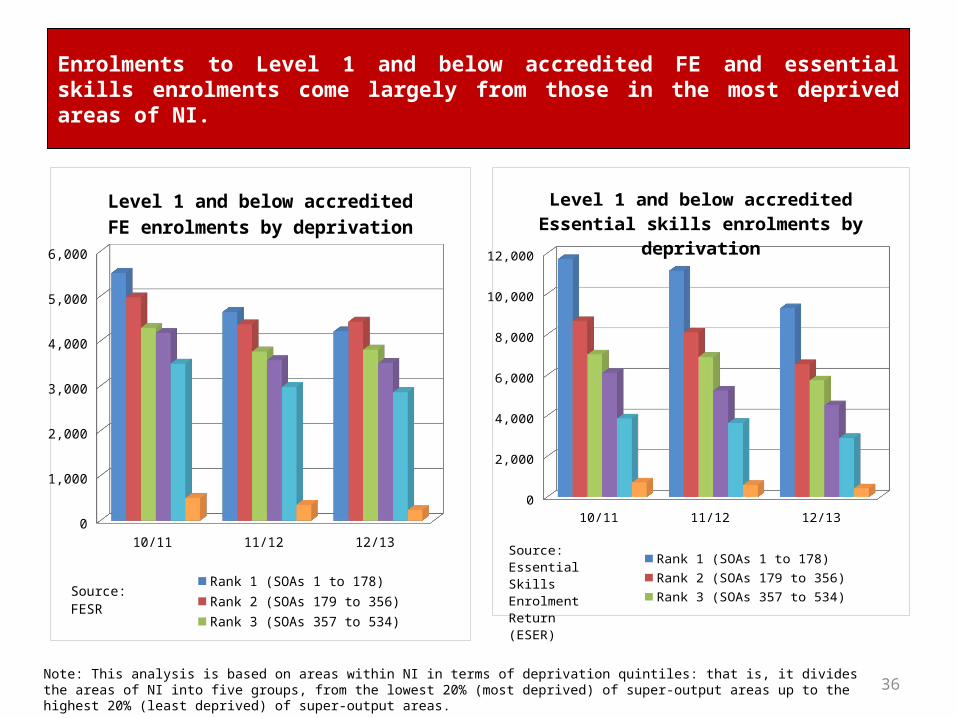
Level 1 and below accredited FE en-rolments by deprivation
Rank 1 (SOAs 1 to 178) Rank 2 (SOAs 179 to 356)Rank 3 (SOAs 357 to 534) Rank 4 (SOAs 535 to 712)Rank 5 (SOAs 713 to 890) Unknown Postcode
Source: FESR
10/11 11/12 12/130
2,000
4,000
6,000
8,000
10,000
12,000
Level 1 and below accredited Essential skills enrolments by deprivation
Rank 1 (SOAs 1 to 178) Rank 2 (SOAs 179 to 356)Rank 3 (SOAs 357 to 534) Rank 4 (SOAs 535 to 712)Rank 5 (SOAs 713 to 890) Unknown Postcode
Source: Essen-tial Skills En-rolment Return (ESER)
Enrolments to Level 1 and below accredited FE and essential skills enrolments come largely from those in the most deprived areas of NI.
Note: This analysis is based on areas within NI in terms of deprivation quintiles: that is, it divides the areas of NI into five groups, from the lowest 20% (most deprived) of super-output areas up to the highest 20% (least deprived) of super-output areas.
37
Northern Ireland’s Skills Profile and Education Statistics
• Widespread consensus on value of skills to individual, employers and economy.
• Positive correlation between skills and GDP per capita.
• Important driver for economic growth.
• Skills help people move into work, stay in work and progress in work.
• Strong association with wages – higher skilled individuals earn higher wages.
38
Skills are the most important offering that we have to attract inward investment and enable local companies to grow." Minister Farry (Hansard 27/2/2012)
“Skills are, without doubt, a critical factor in economic development ….” Minister Foster, (25/1/2010)
Skills Matter for the individual, for employers and for the economy
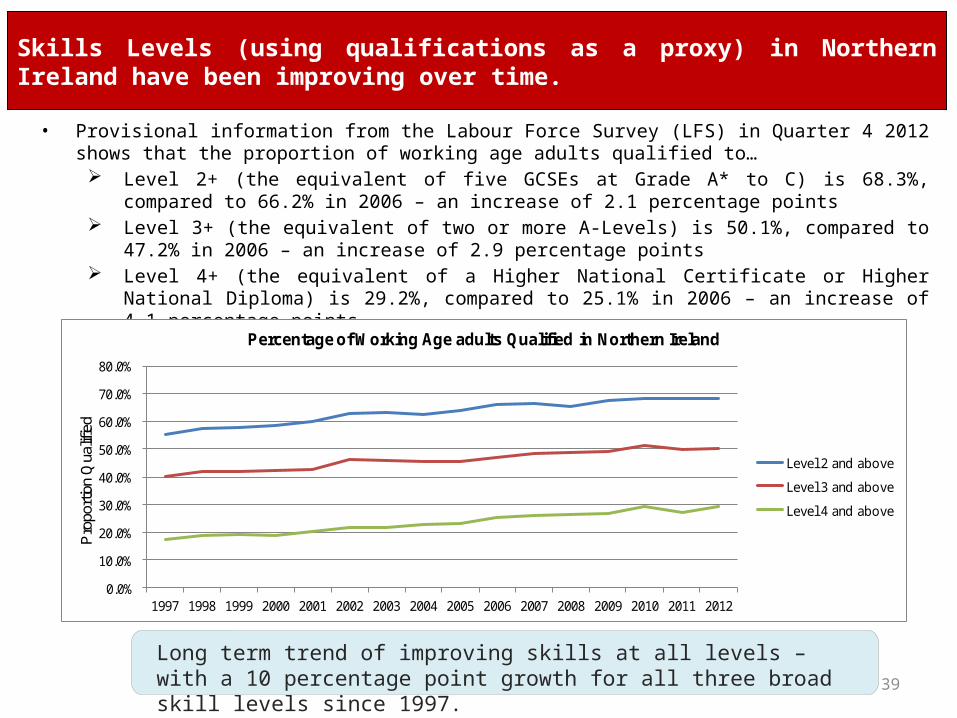
• Provisional information from the Labour Force Survey (LFS) in Quarter 4 2012 shows that the proportion of working age adults qualified to… Level 2+ (the equivalent of five GCSEs at Grade A* to C) is 68.3%, compared to 66.2% in 2006 – an increase
of 2.1 percentage points Level 3+ (the equivalent of two or more A-Levels) is 50.1%, compared to 47.2% in 2006 – an increase of 2.9
percentage points Level 4+ (the equivalent of a Higher National Certificate or Higher National Diploma) is 29.2%, compared
to 25.1% in 2006 – an increase of 4.1 percentage points
39
Skills Levels (using qualifications as a proxy) in Northern Ireland have been improving over time.
0.0%
10.0%
20.0%
30.0%
40.0%
50.0%
60.0%
70.0%
80.0%
1997 1998 1999 2000 2001 2002 2003 2004 2005 2006 2007 2008 2009 2010 2011 2012
Pro
port
ion
Qua
lifie
d
Percentage of Working Age adults Qualified in Northern Ireland
Level 2 and above
Level 3 and above
Level 4 and above
Long term trend of improving skills at all levels – with a 10 percentage point growth for all three broad skill levels since 1997.
40
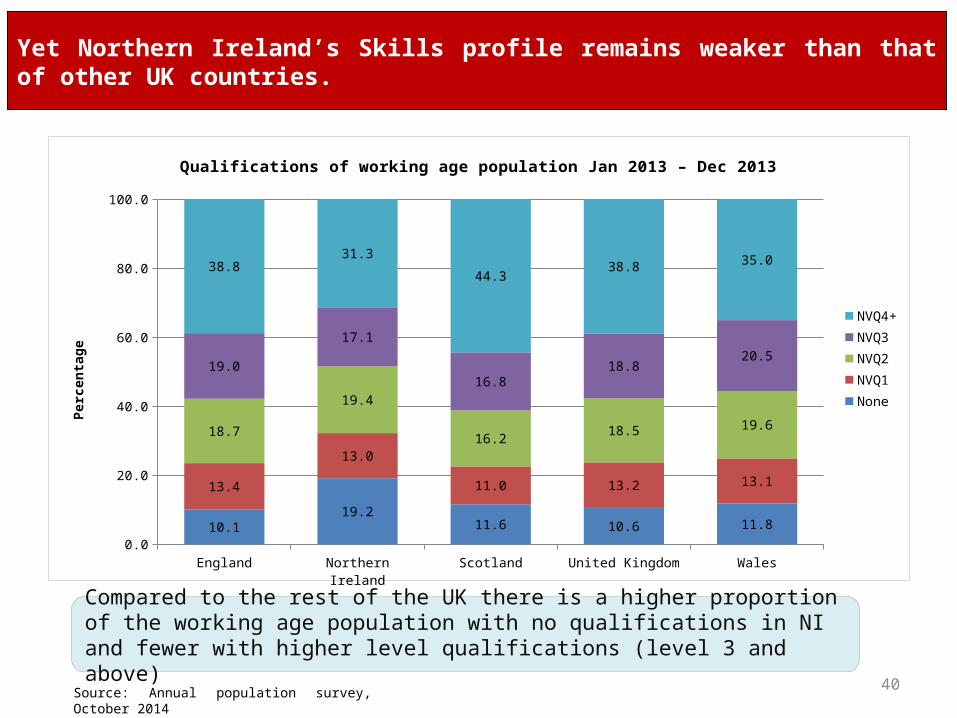
Yet Northern Ireland’s Skills profile remains weaker than that of other UK countries.
Compared to the rest of the UK there is a higher proportion of the working age population with no qualifications in NI and fewer with higher level qualifications (level 3 and above)
Source: Annual population survey, October 2014
England Northern Ireland Scotland United Kingdom Wales0.0
20.0
40.0
60.0
80.0
100.0
10.119.2
11.6 10.6 11.8
13.4
13.0
11.0 13.2 13.1
18.7
19.4
16.218.5 19.6
19.0
17.1
16.818.8
20.5
38.831.3
44.338.8 35.0
Qualifications of working age population Jan 2013 – Dec 2013
NVQ4+NVQ3NVQ2NVQ1None
Perc
enta
ge
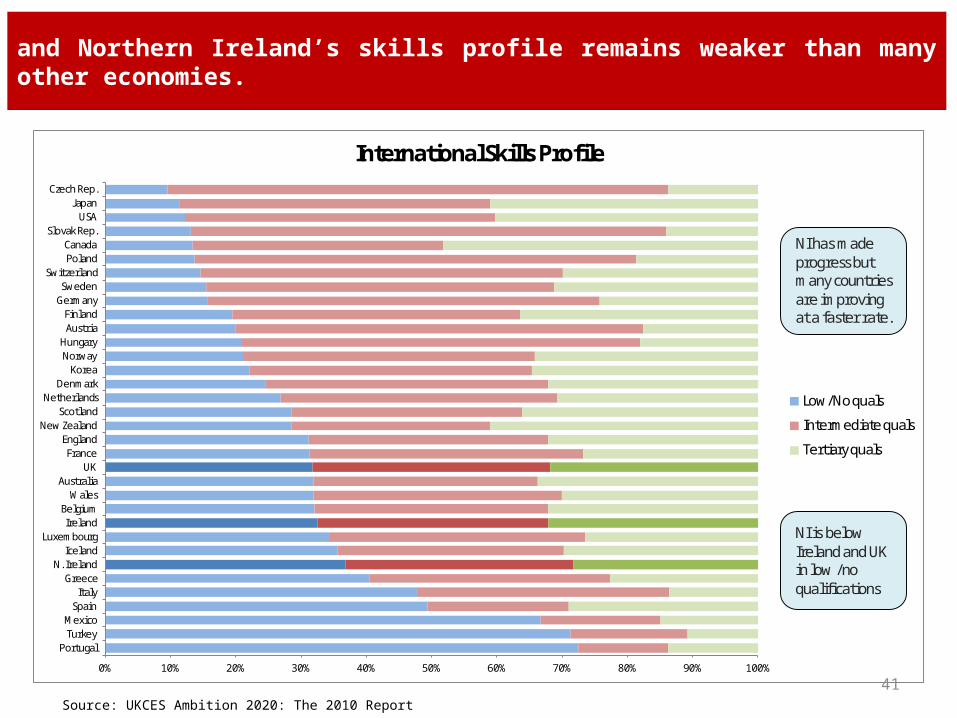
and Northern Ireland’s skills profile remains weaker than many other economies.
0% 10% 20% 30% 40% 50% 60% 70% 80% 90% 100%
PortugalTurkeyMexico
SpainItaly
GreeceN. Ireland
IcelandLuxembourg
IrelandBelgium
WalesAustralia
UKFrance
EnglandNew Zealand
ScotlandNetherlands
DenmarkKorea
NorwayHungary
AustriaFinland
GermanySweden
SwitzerlandPolandCanada
Slovak Rep.USA
JapanCzech Rep.
International Skills Profile
Low/No quals
Intermediate quals
Tertiary quals
NI has made progress but many countries are improving at a faster rate.
NI is below Ireland and UK in low /no qualifications
41Source: UKCES Ambition 2020: The 2010 Report
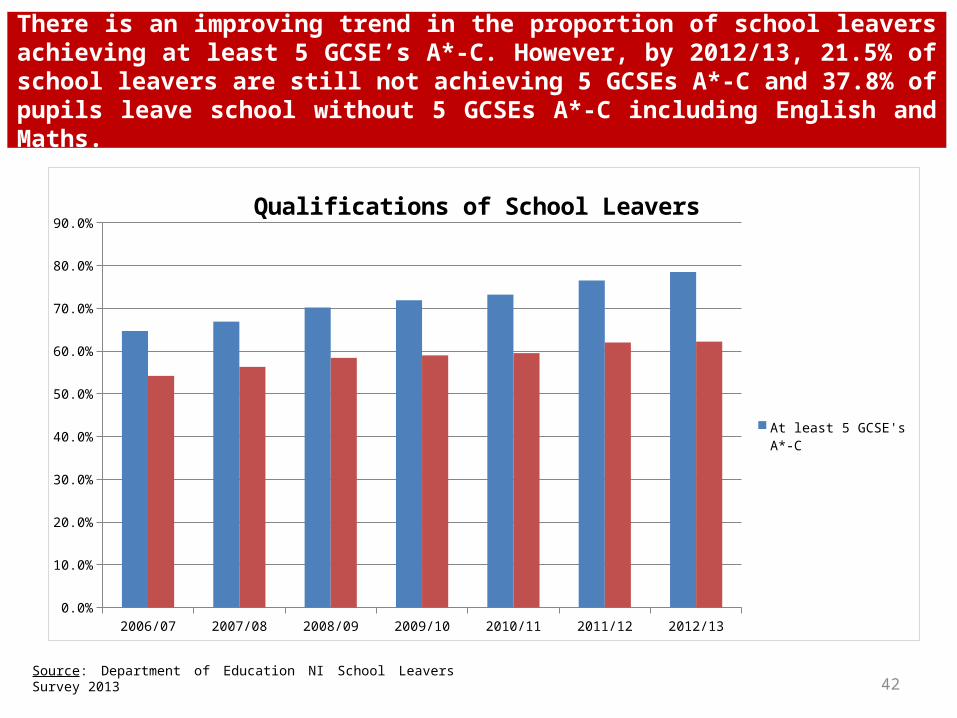
There is an improving trend in the proportion of school leavers achieving at least 5 GCSE’s A*-C. However, by 2012/13, 21.5% of school leavers are still not achieving 5 GCSEs A*-C and 37.8% of pupils leave school without 5 GCSEs A*-C including English and Maths.
Source: Department of Education NI School Leavers Survey 2013 42
2006/07 2007/08 2008/09 2009/10 2010/11 2011/12 2012/130.0%
10.0%
20.0%
30.0%
40.0%
50.0%
60.0%
70.0%
80.0%
90.0%Qualifications of School Leavers
At least 5 GCSE's A*-C
At Least 5 GCSEs A*-C inc English and maths
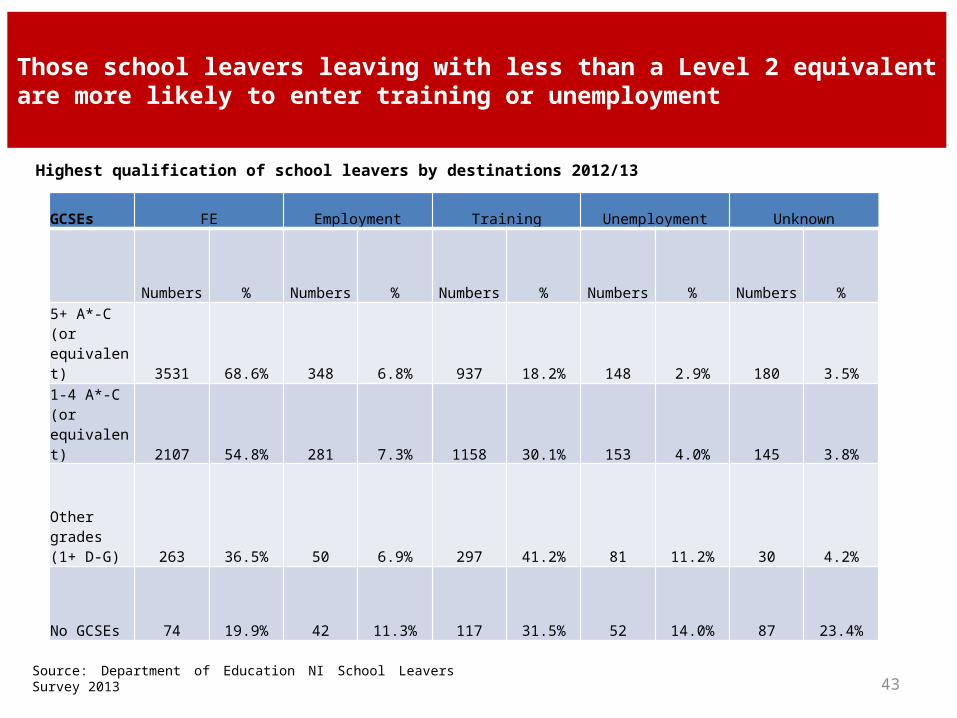
Those school leavers leaving with less than a Level 2 equivalent are more likely to enter training or unemployment
Source: Department of Education NI School Leavers Survey 2013 43
GCSEs FE Employment Training Unemployment Unknown
Numbers % Numbers % Numbers % Numbers % Numbers %
5+ A*-C (or equivalent) 3531 68.6% 348 6.8% 937 18.2% 148 2.9% 180 3.5%
1-4 A*-C (or equivalent) 2107 54.8% 281 7.3% 1158 30.1% 153 4.0% 145 3.8%
Other grades (1+ D-G) 263 36.5% 50 6.9% 297 41.2% 81 11.2% 30 4.2%
No GCSEs 74 19.9% 42 11.3% 117 31.5% 52 14.0% 87 23.4%
Highest qualification of school leavers by destinations 2012/13
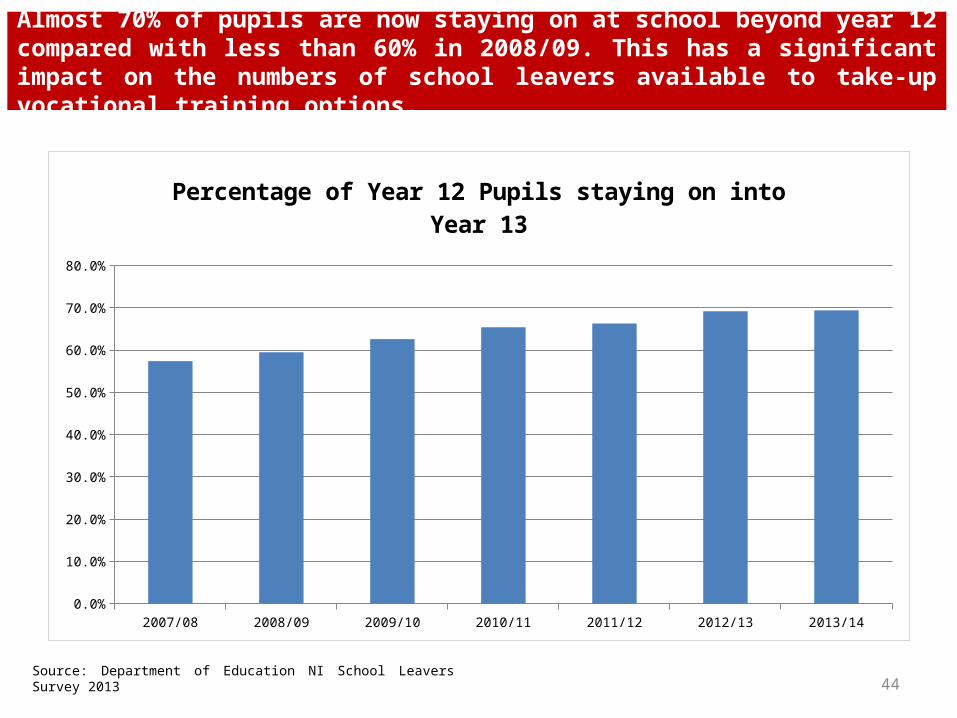
Almost 70% of pupils are now staying on at school beyond year 12 compared with less than 60% in 2008/09. This has a significant impact on the numbers of school leavers available to take-up vocational training options.
Source: Department of Education NI School Leavers Survey 2013 44
2007/08 2008/09 2009/10 2010/11 2011/12 2012/13 2013/140.0%
10.0%
20.0%
30.0%
40.0%
50.0%
60.0%
70.0%
80.0%
Percentage of Year 12 Pupils staying on into Year 13
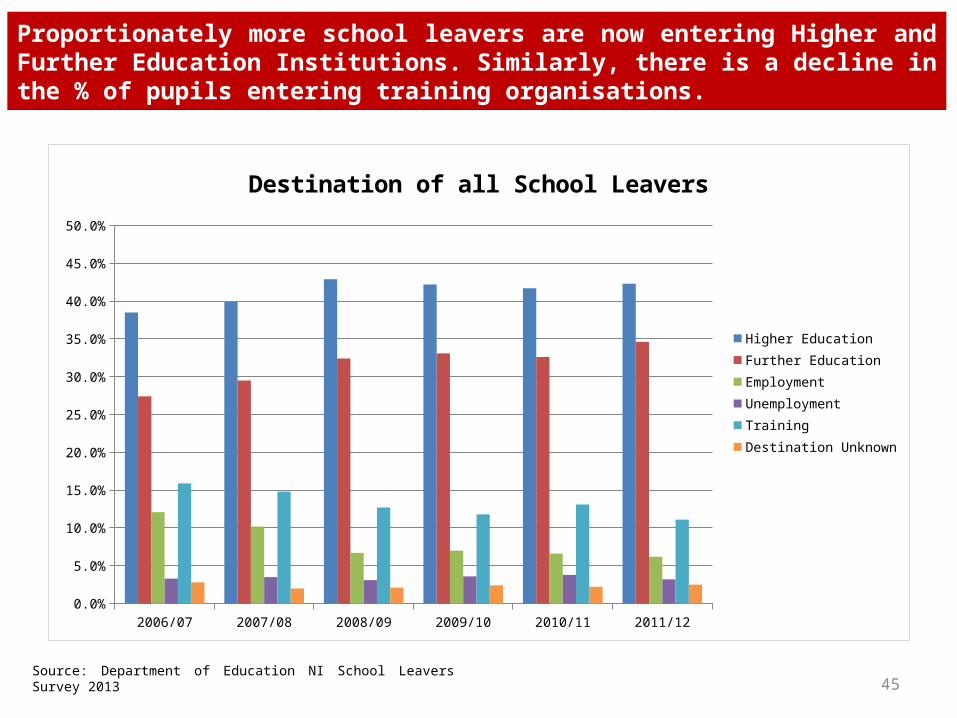
Proportionately more school leavers are now entering Higher and Further Education Institutions. Similarly, there is a decline in the % of pupils entering training organisations.
Source: Department of Education NI School Leavers Survey 2013 45
2006/07 2007/08 2008/09 2009/10 2010/11 2011/120.0%
5.0%
10.0%
15.0%
20.0%
25.0%
30.0%
35.0%
40.0%
45.0%
50.0%
Destination of all School Leavers
Higher EducationFurther EducationEmploymentUnemploymentTrainingDestination Unknown
Total numbers achieving level 2 and Level 3
46
2007/08 2008/09 2009/10 2010/11 2011/12 2012/130
1000
2000
3000
4000
5000
6000
Level 2 and Level 3 Qualifications Achieved on TfS, PLA and AppsNI
Total level 2Total level 3
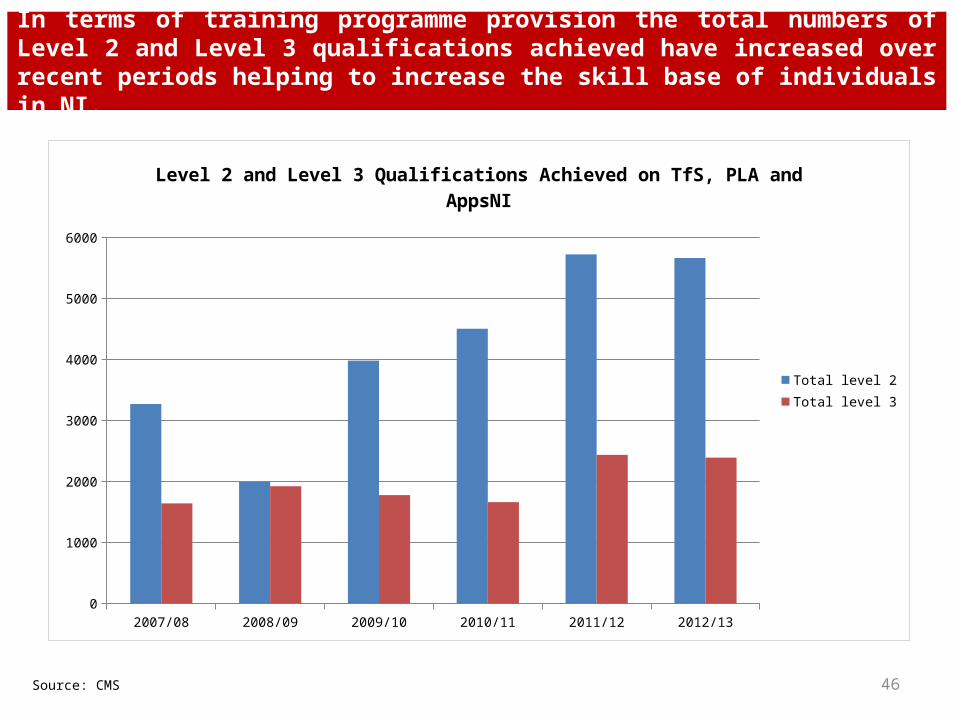
In terms of training programme provision the total numbers of Level 2 and Level 3 qualifications achieved have increased over recent periods helping to increase the skill base of individuals in NI.
Source: CMS
Source: OECD Survey of Adult Skills 2012 (PIAAC)
Leve
l 1
Leve
l 2
Leve
l 3
Leve
l 4 a
nd 5
Leve
l 1
Leve
l 2
Leve
l 3
Leve
l 4 a
nd 5
Leve
l 1
Leve
l 2
Leve
l 3
Leve
l 4 a
nd 5
16-29 30-49 50-65
-30%
-25%
-20%
-15%
-10%
-5%
0%
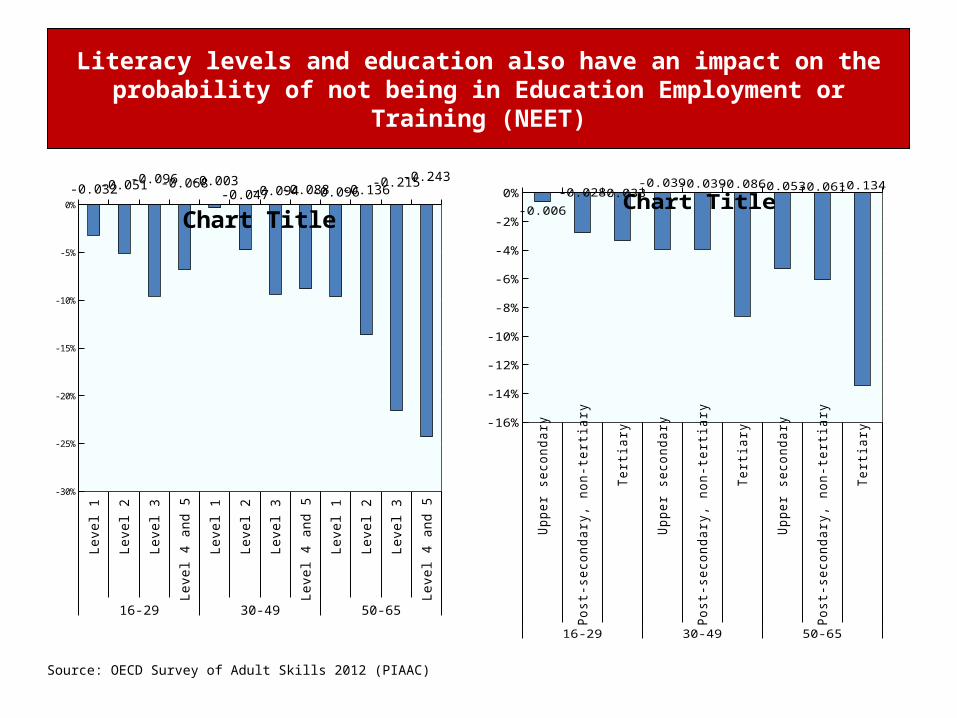
-0.032-0.051-0.096-0.068-0.003-0.047-0.094-0.088-0.096-0.136-0.215-0.243
Chart Title
Uppe
r sec
onda
ry
Post
-sec
onda
ry, n
on-te
rtiar
y
Terti
ary
Uppe
r sec
onda
ry
Post
-sec
onda
ry, n
on-te
rtiar
y
Terti
ary
Uppe
r sec
onda
ry
Post
-sec
onda
ry, n
on-te
rtiar
y
Terti
ary
16-29 30-49 50-65
-16%
-14%
-12%
-10%
-8%
-6%
-4%
-2%
0%-0.006
-0.028 -0.033-0.039 -0.039 -0.086 -0.053 -0.061 -0.134Chart Title
Literacy levels and education also have an impact on the probability of not being in Education Employment or Training (NEET)
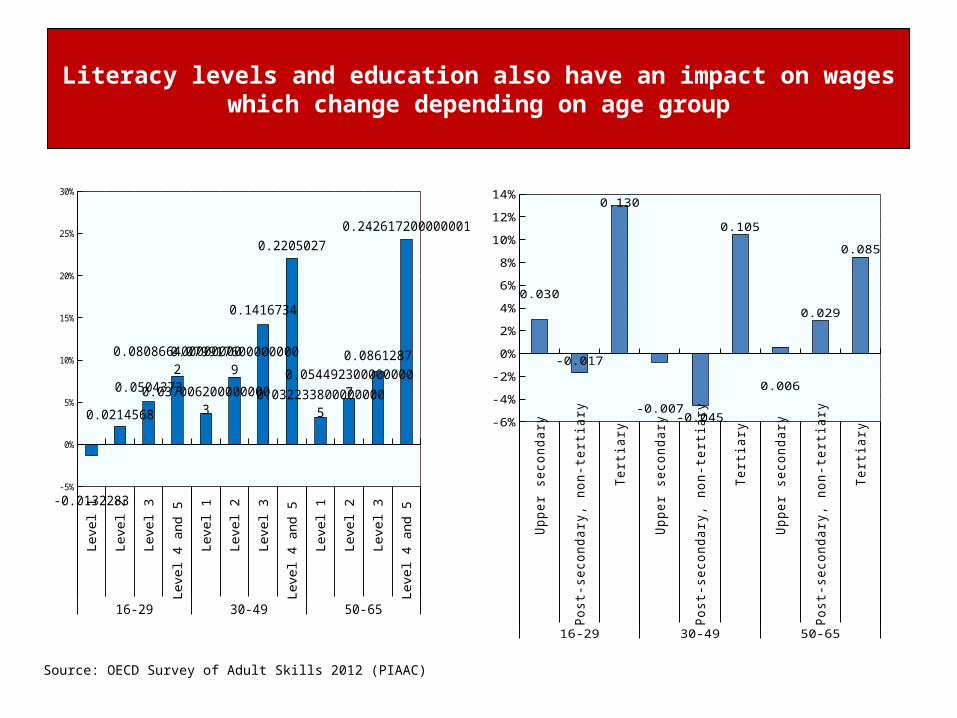
Source: OECD Survey of Adult Skills 2012 (PIAAC)
Leve
l 1
Leve
l 2
Leve
l 3
Leve
l 4 a
nd 5
Leve
l 1
Leve
l 2
Leve
l 3
Leve
l 4 a
nd 5
Leve
l 1
Leve
l 2
Leve
l 3
Leve
l 4 a
nd 5
16-29 30-49 50-65
-5%
0%
5%
10%
15%
20%
25%
30%
-0.0132283
0.0214568
0.0504373
0.0808664000000002
0.0370062000000003
0.0799176000000009
0.1416734
0.2205027
0.03223380000000050.0544923000000007
0.0861287
0.242617200000001
Uppe
r sec
onda
ry
Post
-sec
onda
ry, n
on-te
rtiar
y
Terti
ary
Uppe
r sec
onda
ry
Post
-sec
onda
ry, n
on-te
rtiar
y
Terti
ary
Uppe
r sec
onda
ry
Post
-sec
onda
ry, n
on-te
rtiar
y
Terti
ary
16-29 30-49 50-65
-6%
-4%
-2%
0%
2%
4%
6%
8%
10%
12%
14%
0.030
-0.017
0.130
-0.007-0.045
0.105
0.006
0.029
0.085
Literacy levels and education also have an impact on wages which change depending on age group
-20
-15
-10
-5
0
5
10
15
HK
SIN
GJA
PKO
RRO
ISW
IG
ER FRA UK NI
US
SPA
LUX
SWE
GRE CH
IM
EX
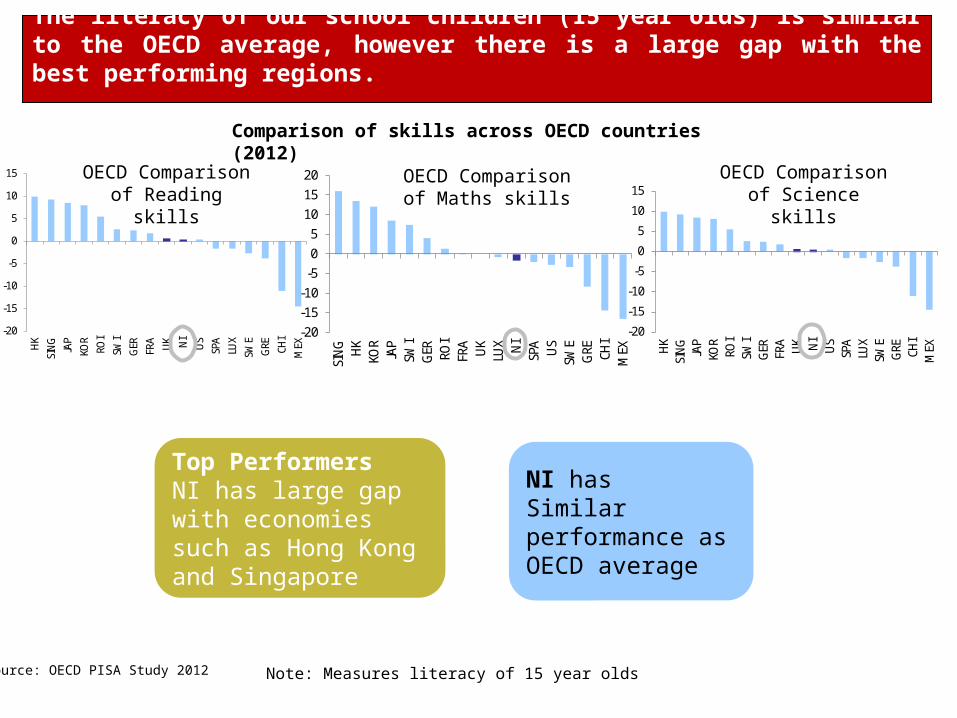
NI hasSimilar performance as OECD average
Source: OECD PISA Study 2012 Note: Measures literacy of 15 year olds
-20-15-10
-505
101520
SIN
G HK
KOR
JAP
SWI
GER RO
IFR
A UK
LUX NI
SPA US
SWE
GRE CH
IM
EX
-20
-15
-10
-5
0
5
10
15
HK
SIN
GJA
PKO
RRO
ISW
IG
ER FRA UK NI
US
SPA
LUX
SWE
GRE CH
IM
EX
OECD Comparison of Reading skills
OECD Comparison of Maths skills
OECD Comparison of Science skills
Top PerformersNI has large gap with economies such as Hong Kong and Singapore
The literacy of our school children (15 year olds) is similar to the OECD average, however there is a large gap with the best performing regions.
Comparison of skills across OECD countries (2012)
0.0
2.0
4.0
6.0
8.0
10.0
12.0
14.0
16.0
18.0
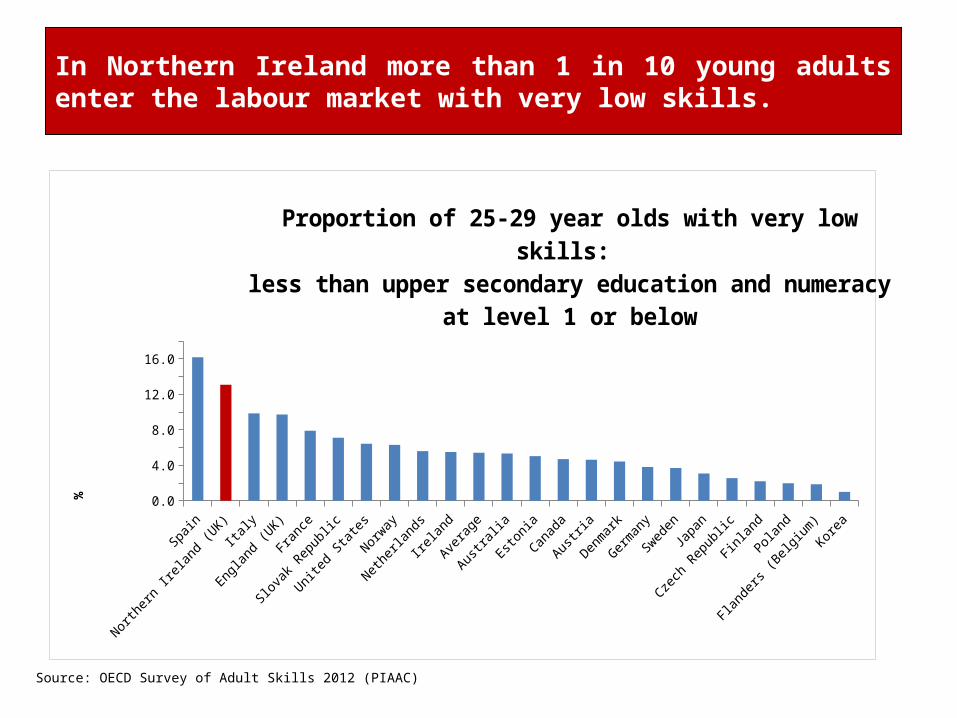
Proportion of 25-29 year olds with very low skills: less than upper secondary education and numeracy at level 1 or be-
low
%
Source: OECD Survey of Adult Skills 2012 (PIAAC)
In Northern Ireland more than 1 in 10 young adults enter the labour market with very low skills.
Aged 16-18 Aged 19-24 Aged 25-34 Aged 35-44 Aged 45-54 Aged 55-65 Aged 16-65240
245
250
255
260
265
270
275
280
285
290
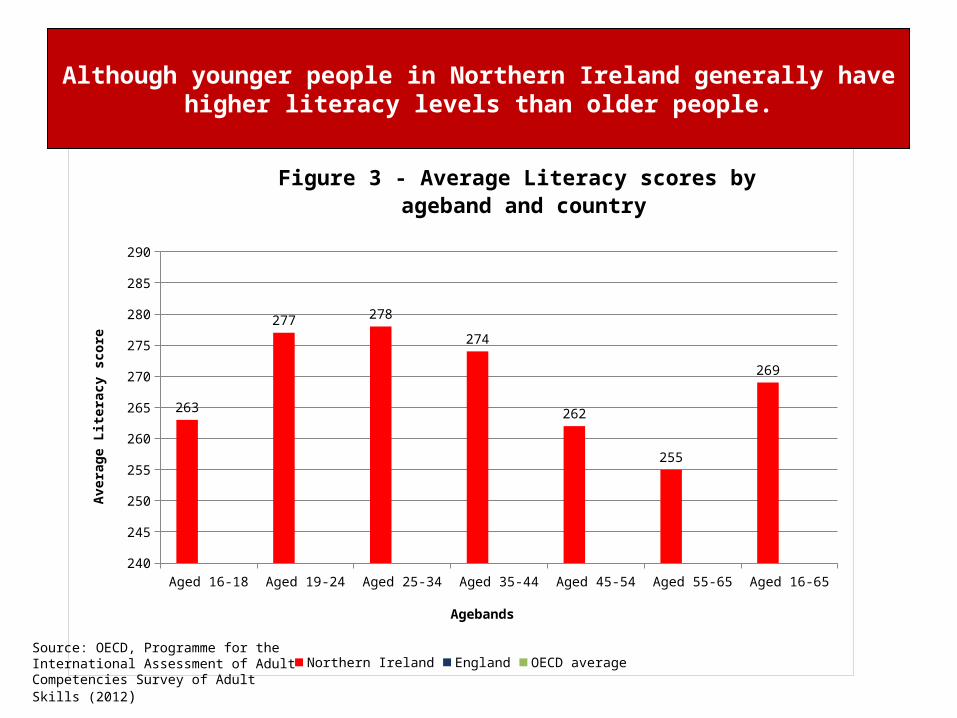
263
277 278
274
262
255
269
Figure 3 - Average Literacy scores by ageband and country
Northern Ireland England OECD average
Agebands
Aver
age
Liter
acy
scor
eAlthough younger people in Northern Ireland generally have higher literacy levels
than older people.
Source: OECD, Programme for the International Assessment of Adult Competencies Survey of Adult Skills (2012)
Aged 16-18 Aged 19-24 Aged 25-34 Aged 35-44 Aged 45-54 Aged 55-65 Aged 16-65240
245
250
255
260
265
270
275
280
285
290
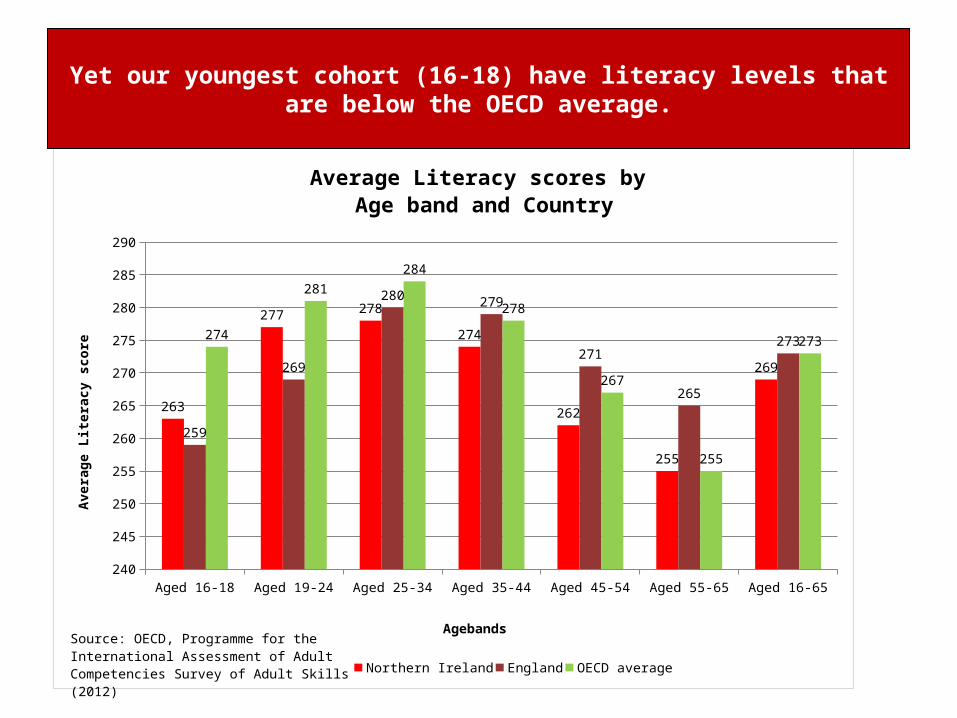
263
277 278
274
262
255
269
259
269
280 279
271
265
273274
281
284
278
267
255
273
Average Literacy scores by Age band and Country
Northern Ireland England OECD average
Agebands
Aver
age
Liter
acy
scor
e
Source: OECD, Programme for the International Assessment of Adult Competencies Survey of Adult Skills (2012)
Yet our youngest cohort (16-18) have literacy levels that are below the OECD average.
Skills will continue to be an important driver of growth here and certain skills will be particularly important
• The ‘Forecasting Future Skills Needs in NI’ report, which underpins the Northern Ireland Skills Strategy, Success through Skills – Transforming Futures, identified the likely 2020 skills profile that employers will need if productivity is to improve.
• Key areas identified are:
– need for Higher Level Skills;
– need for appropriate Up-skilling of the workforce;
– developing literacy and numeracy skills
– need for improved management and leadership;
– addressing subject imbalances;
– need for qualifications in STEM; and
– need to attract skilled labour
53
54
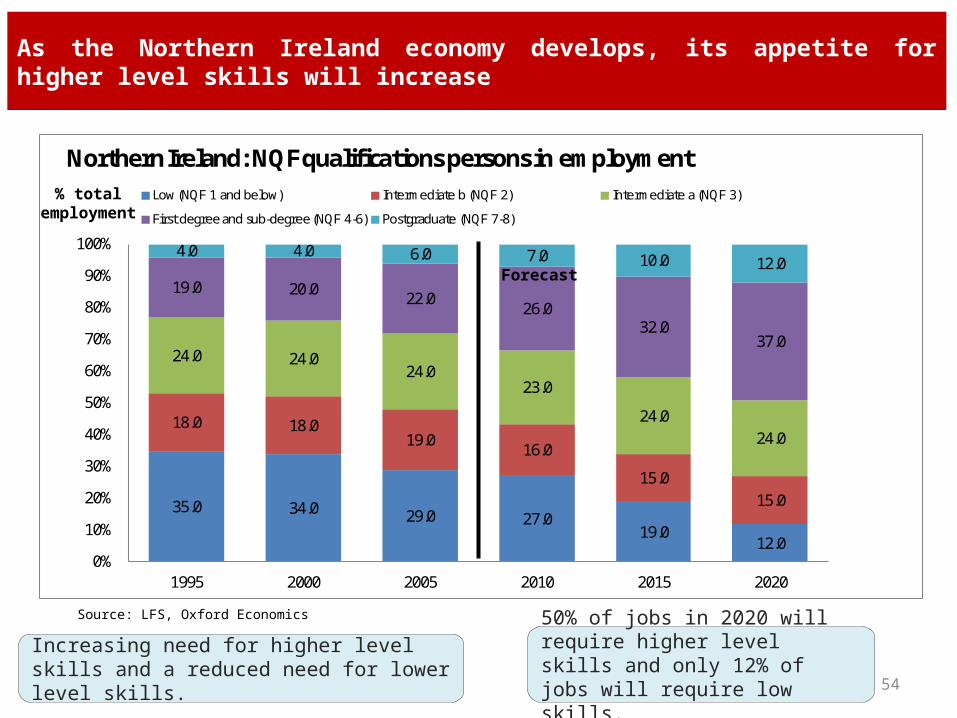
Increasing need for higher level skills and a reduced need for lower level skills.
50% of jobs in 2020 will require higher level skills and only 12% of jobs will require low skills.
As the Northern Ireland economy develops, its appetite for higher level skills will increase
35.0 34.0 29.0 27.019.0
12.0
18.0 18.019.0
16.0
15.015.0
24.0 24.024.0
23.0
24.024.0
19.0 20.0 22.026.0
32.037.0
4.0 4.0 6.0 7.0 10.0 12.0
0%
10%
20%
30%
40%
50%
60%
70%
80%
90%
100%
1995 2000 2005 2010 2015 2020
Northern Ireland: NQF qualifications persons in employmentLow (NQF 1 and below) Intermediate b (NQF 2) Intermediate a (NQF 3)
First degree and sub-degree (NQF 4-6) Postgraduate (NQF 7-8)
Source: LFS, Oxford Economics
% total employment
Forecast
55
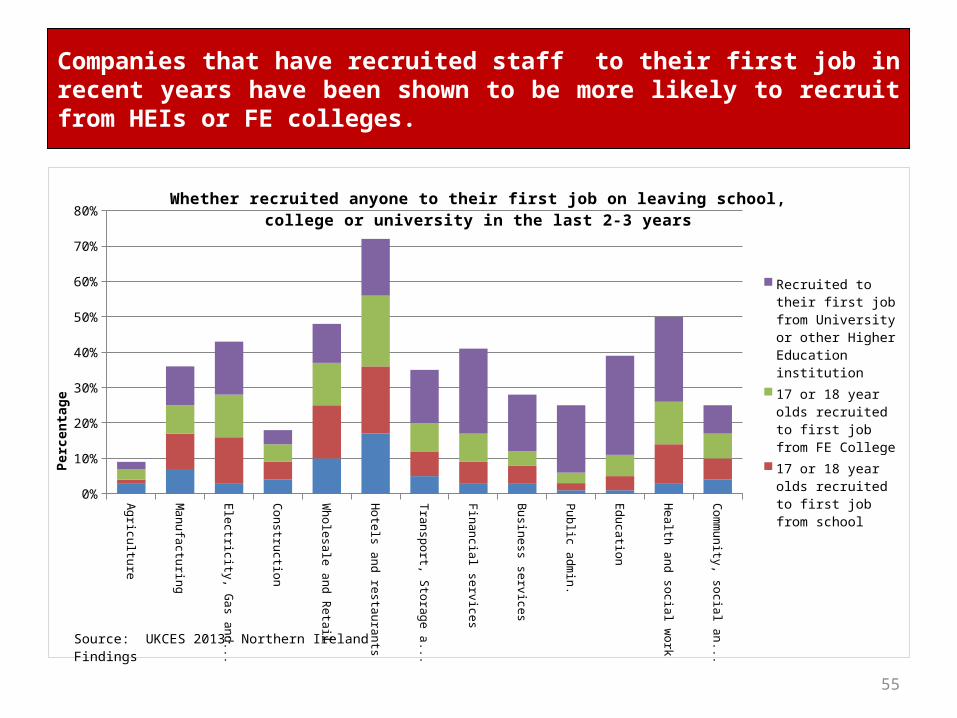
Companies that have recruited staff to their first job in recent years have been shown to be more likely to recruit from HEIs or FE colleges.
Agriculture
Manufacturing
Electricity, Gas and W
ater
Construction
Wholesale and Retail
Hotels and restaurants
Transport, Storage and Comm
s
Financial services
Business services
Public admin.
Education
Health and social work
Comm
unity, social and other ac...
0%
10%
20%
30%
40%
50%
60%
70%
80%Whether recruited anyone to their first job on leaving school, college or university in the last 2-3
years
Recruited to their first job from University or other Higher Education institution
17 or 18 year olds re-cruited to first job from FE College
17 or 18 year olds re-cruited to first job from school
16 year olds recruited to first job from school
Perc
enta
ge
Source: UKCES 2013: Northern Ireland Findings
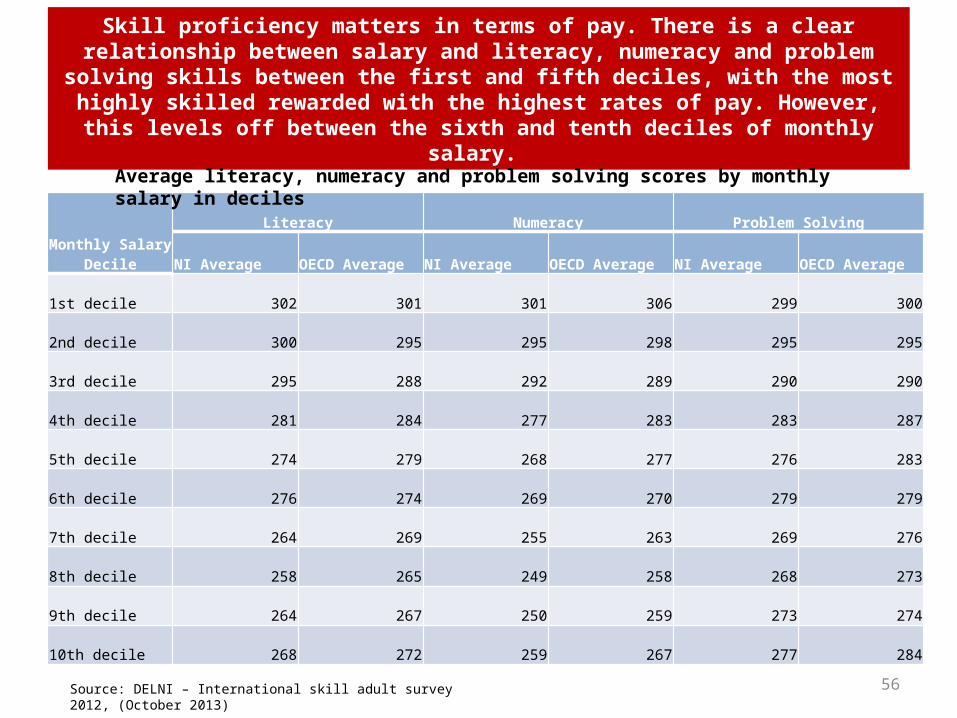
Monthly Salary Decile
Literacy Numeracy Problem Solving
NI Average OECD Average NI Average OECD Average NI Average OECD Average
1st decile 302 301 301 306 299 300
2nd decile 300 295 295 298 295 295
3rd decile 295 288 292 289 290 290
4th decile 281 284 277 283 283 287
5th decile 274 279 268 277 276 283
6th decile 276 274 269 270 279 279
7th decile 264 269 255 263 269 276
8th decile 258 265 249 258 268 273
9th decile 264 267 250 259 273 274
10th decile 268 272 259 267 277 284
56
Skill proficiency matters in terms of pay. There is a clear relationship between salary and literacy, numeracy and problem solving skills between the first and fifth deciles, with the most highly skilled rewarded with the highest rates of pay. However, this levels off between the sixth
and tenth deciles of monthly salary.
Source: DELNI – International skill adult survey 2012, (October 2013)
Average literacy, numeracy and problem solving scores by monthly salary in deciles
While recognising the future skill needs there is also a need to be aware of current skills gaps and shortages.
• NI’s Employer Skills Survey (2013) found concentrations of employers reporting difficulties recruiting people with the skills they need (skill shortages) in skilled trade occupations and professional occupations.
• Skills deficiencies have been reported across several sectors in NI e.g. Software development/testing and engineering sector.
• Skill needs have been well articulated by business to the Minister.
• This has led to the establishment of three sectoral Working Groups – ICT, Advanced Manufacturing and Engineering Services and Food and Drink.
• Action Plans have been developed to address key issues.
57
Further evidence of skills deficiencies
58
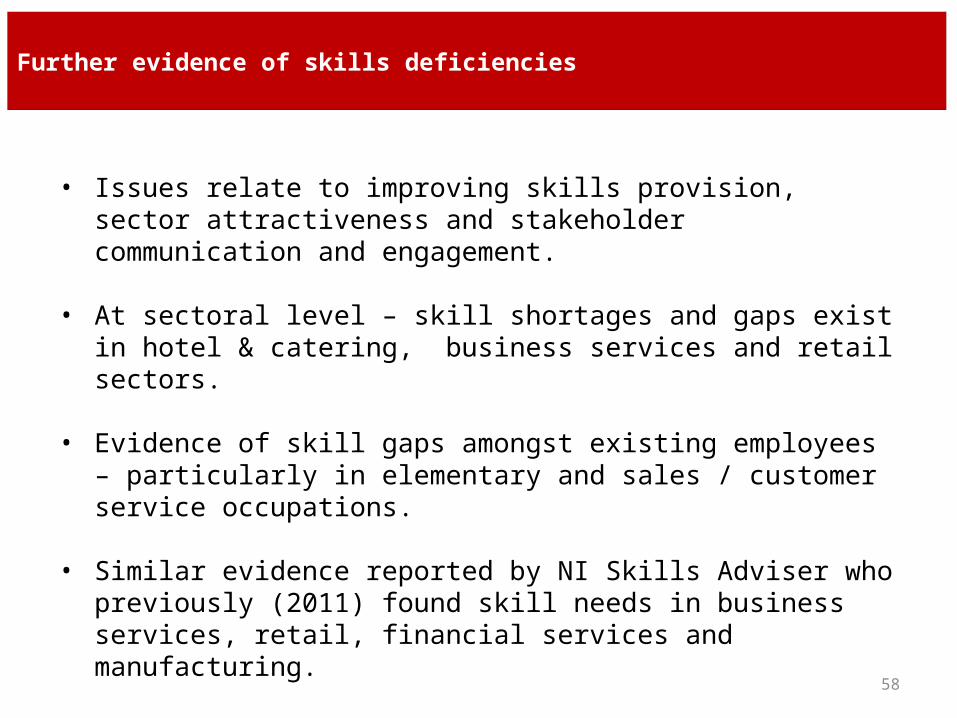
• Issues relate to improving skills provision, sector attractiveness and stakeholder communication and engagement.
• At sectoral level – skill shortages and gaps exist in hotel & catering, business services and retail sectors.
• Evidence of skill gaps amongst existing employees – particularly in elementary and sales / customer service occupations.
• Similar evidence reported by NI Skills Adviser who previously (2011) found skill needs in business services, retail, financial services and manufacturing.
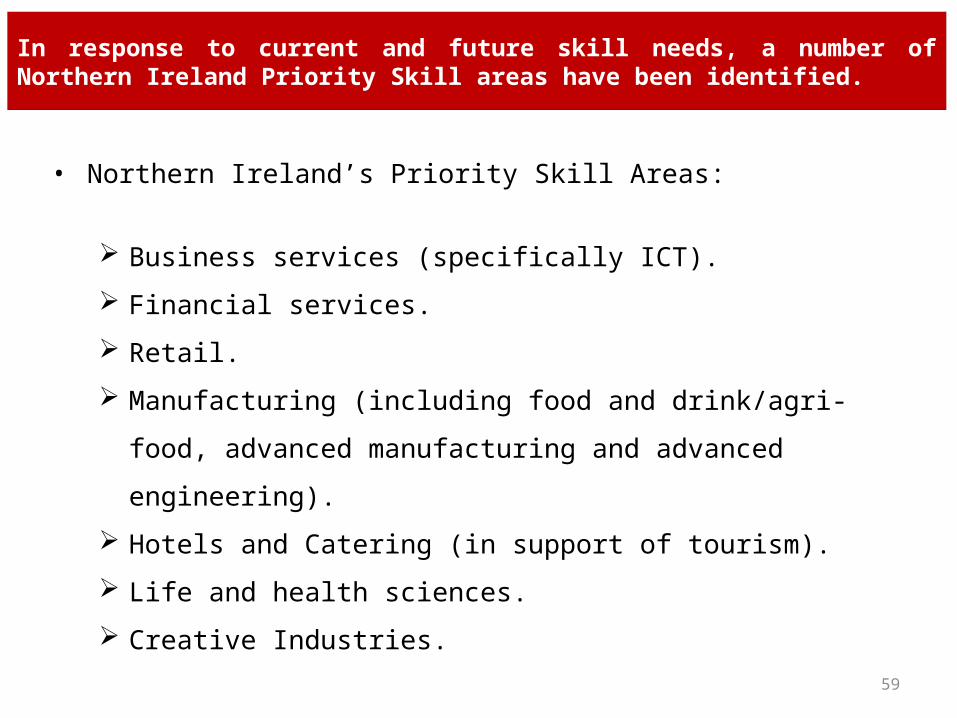
In response to current and future skill needs, a number of Northern Ireland Priority Skill areas have been identified.
• Northern Ireland’s Priority Skill Areas:
Business services (specifically ICT).
Financial services.
Retail.
Manufacturing (including food and drink/agri-food, advanced
manufacturing and advanced engineering).
Hotels and Catering (in support of tourism).
Life and health sciences.
Creative Industries.
59

Northern Ireland’s Skills Profile – Key Messages
• Skills are fundamental to employment, productivity and economic growth.
• Domestically Northern Ireland is making progress in terms of upskilling the workforce.
• However, Northern Ireland still has much ground to catch up on the world leaders.
• A significant percentage of our workforce still have no or low qualifications.
• There is a need to increase higher level skills (qualifications level 4 and above) with 50% of jobs in 2020 likely to require skills at that level including higher professional and technical skills.
• There is also a need for additional and improved technical skills across a range of sectors.
• Northern Ireland requires more individuals achieving STEM qualifications.
• Vocational Training will have a critical role to play in addressing these needs and developing the skills required both now and in the future.
60
61
Evidence on Employer Engagement with Skills
62
UK
EU-27
NetherlandsFrance
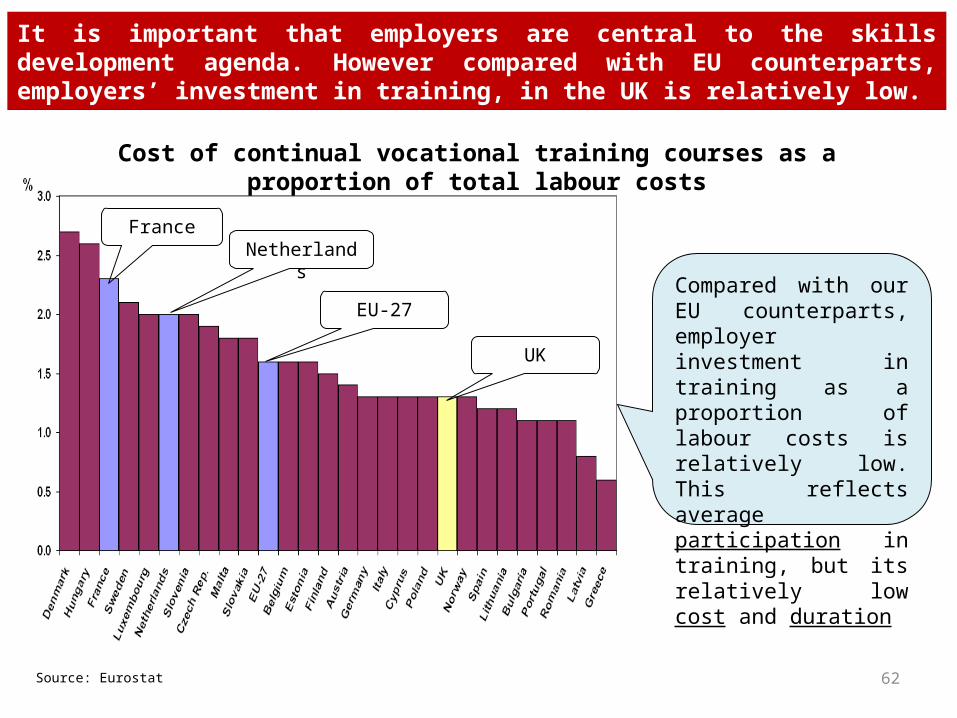
Cost of continual vocational training courses as a proportion of total labour costs
Compared with our EU counterparts, employer investment in training as a proportion of labour costs is relatively low. This reflects average participation in training, but its relatively low cost and duration
It is important that employers are central to the skills development agenda. However compared with EU counterparts, employers’ investment in training, in the UK is relatively low.
Source: Eurostat
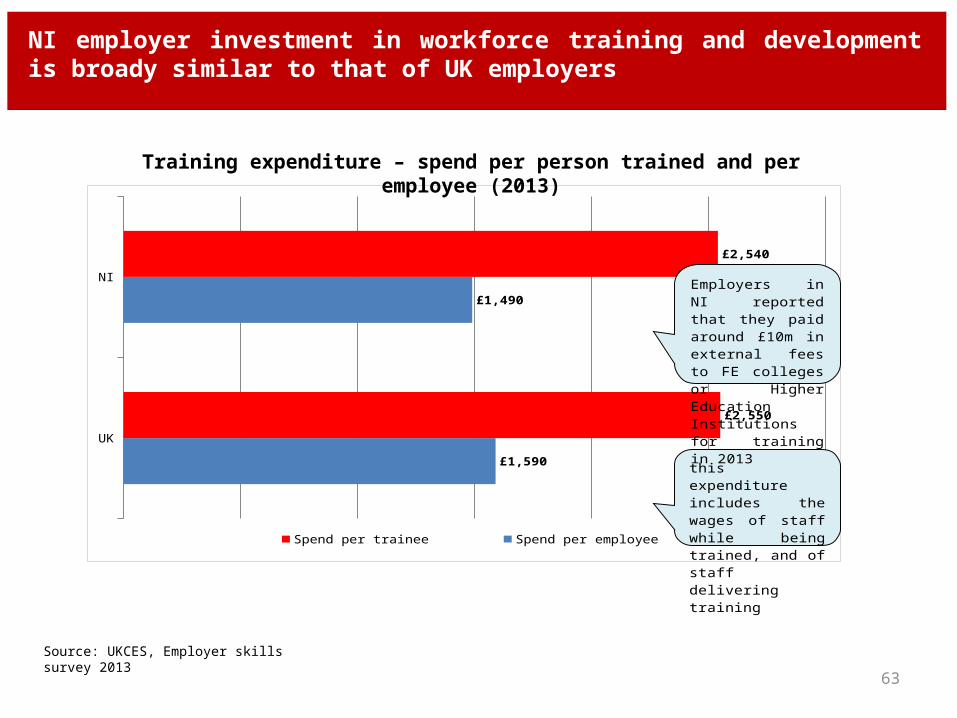
63
UK
NI
£1,590
£1,490
£2,550
£2,540
Spend per trainee Spend per employee
this expenditure in-cludes the wages of staff while being trained, and of staff delivering training
Employers in NI re-ported that they paid around £10m in ex-ternal fees to FE col-leges or Higher Educa-tion Institutions for training in 2013
Training expenditure – spend per person trained and per employee (2013)
NI employer investment in workforce training and development is broady similar to that of UK employers
Source: UKCES, Employer skills survey 2013
Northern Ireland Employer Skills Survey 2013
• 77% of NI firms provided training for their staff in previous 12 months compared with a UK average of 86%.
• Employers in NI are also considerably less likely to have increased training-related activities more specifically (58% in contrast with the UK average of 68%.
• Similarly, in terms of training per employee NI lags other UK countries with 3.7 days training per employee against the UK average of 4.2 days per employee.
• Incidence of training increased between 2011 and 2013 but at a slower rate than other UK countries.
64
Those trained in Northern Ireland also receive the fewest days training per annum in the UK.
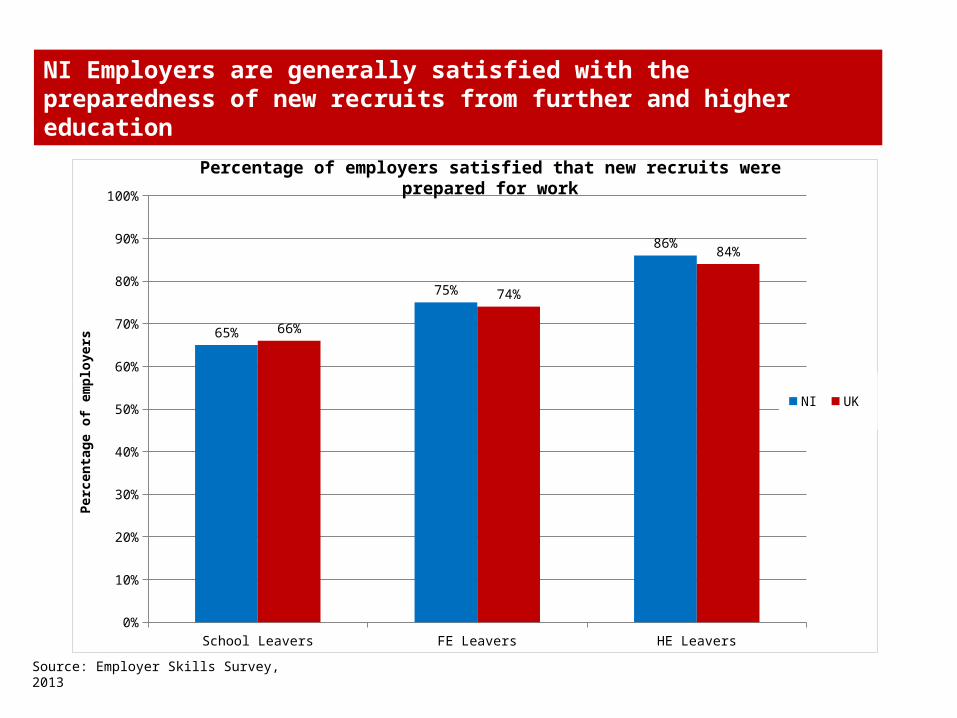
NI Employers are generally satisfied with the preparedness of new recruits from further and higher education
School Leavers FE Leavers HE Leavers0%
10%
20%
30%
40%
50%
60%
70%
80%
90%
100%
65%
75%
86%
66%
74%
84%
NI UK
Perc
enta
ge o
f em
ploy
ers
Source: Employer Skills Survey, 2013
Percentage of employers satisfied that new recruits were prepared for work
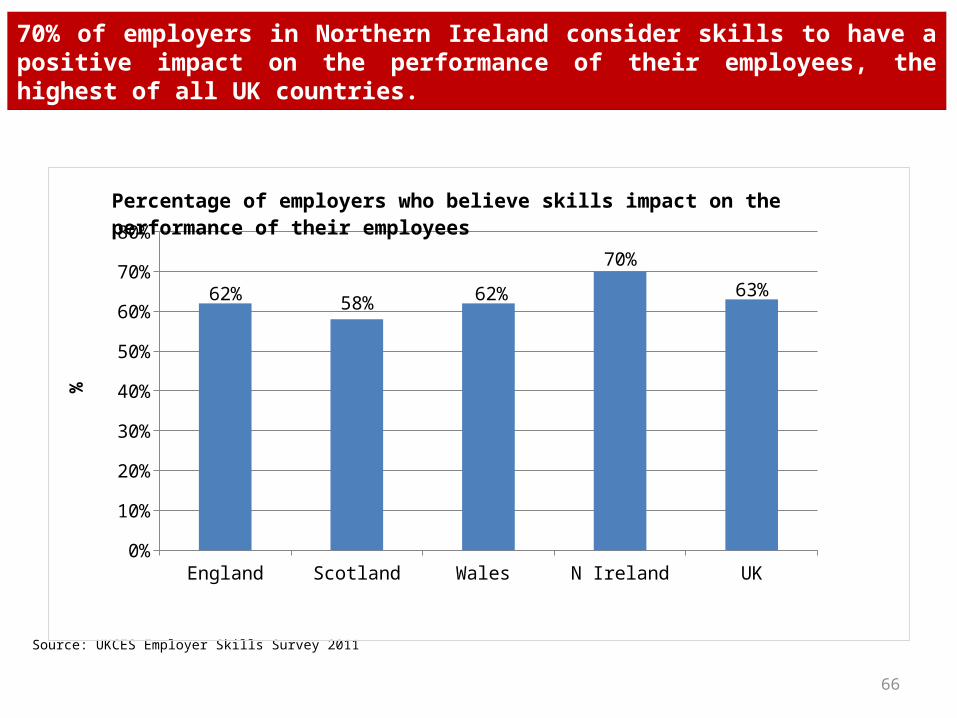
70% of employers in Northern Ireland consider skills to have a positive impact on the performance of their employees, the highest of all UK countries.
Source: UKCES Employer Skills Survey 2011
66
England Scotland Wales N Ireland UK0%
10%
20%
30%
40%
50%
60%
70%
80%
62% 58% 62%
70%
63%
%
Percentage of employers who believe skills impact on the performance of their employees
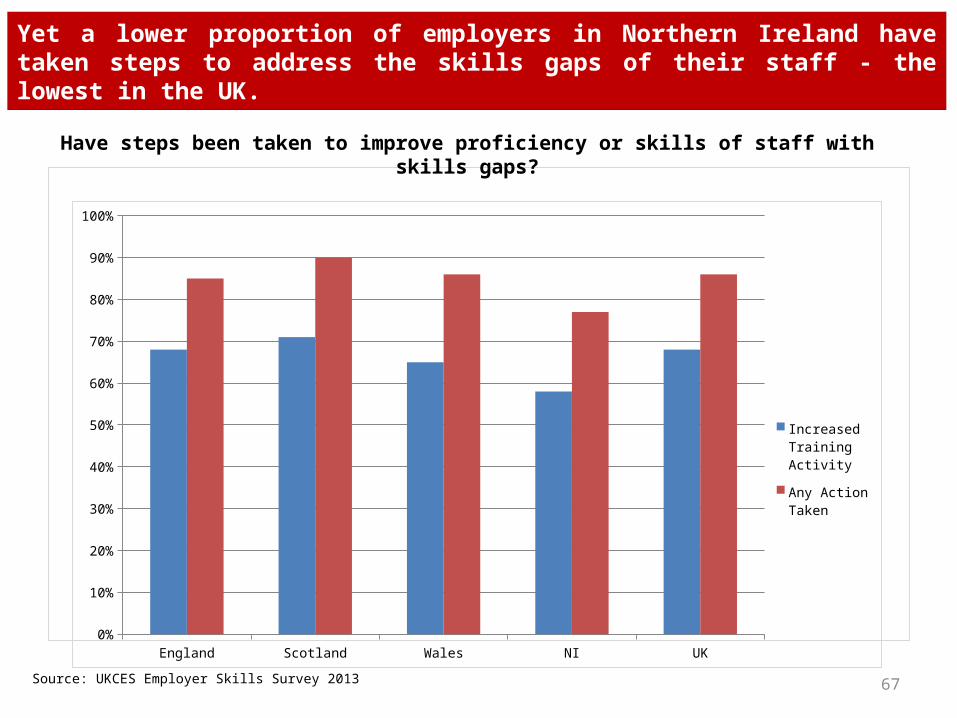
Yet a lower proportion of employers in Northern Ireland have taken steps to address the skills gaps of their staff - the lowest in the UK.
Source: UKCES Employer Skills Survey 2013 67
Have steps been taken to improve proficiency or skills of staff with skills gaps?
England Scotland Wales NI UK0%
10%
20%
30%
40%
50%
60%
70%
80%
90%
100%
Increased Train-ing Activity
Any Action Taken
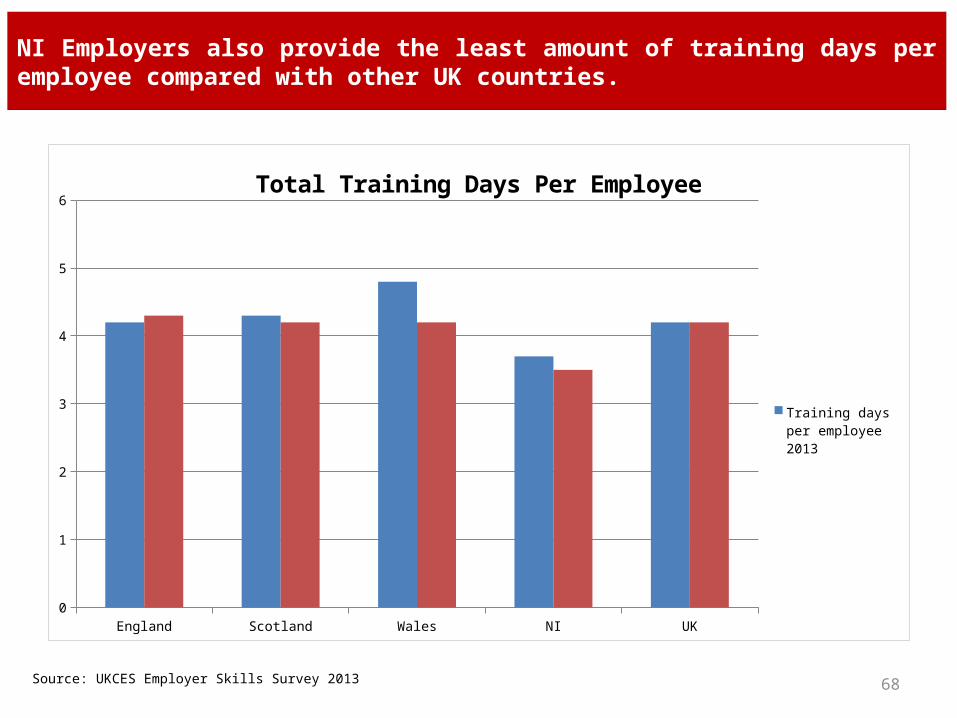
NI Employers also provide the least amount of training days per employee compared with other UK countries.
Source: UKCES Employer Skills Survey 2013 68
England Scotland Wales NI UK0
1
2
3
4
5
6Total Training Days Per Employee
Training days per employee 2013
Training days per employee 2011
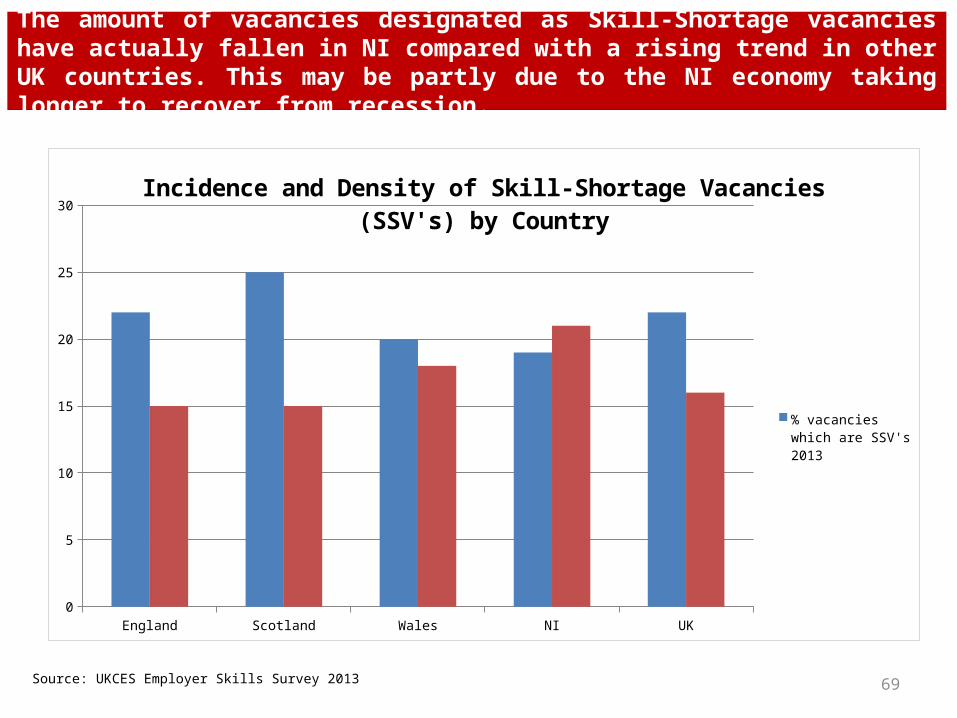
The amount of vacancies designated as Skill-Shortage vacancies have actually fallen in NI compared with a rising trend in other UK countries. This may be partly due to the NI economy taking longer to recover from recession.
Source: UKCES Employer Skills Survey 2013 69
England Scotland Wales NI UK0
5
10
15
20
25
30
Incidence and Density of Skill-Shortage Vacancies (SSV's) by Country
% vacancies which are SSV's 2013
% vacancies which are SSV's 2011
70Source: NI Employer Skills Survey 2013
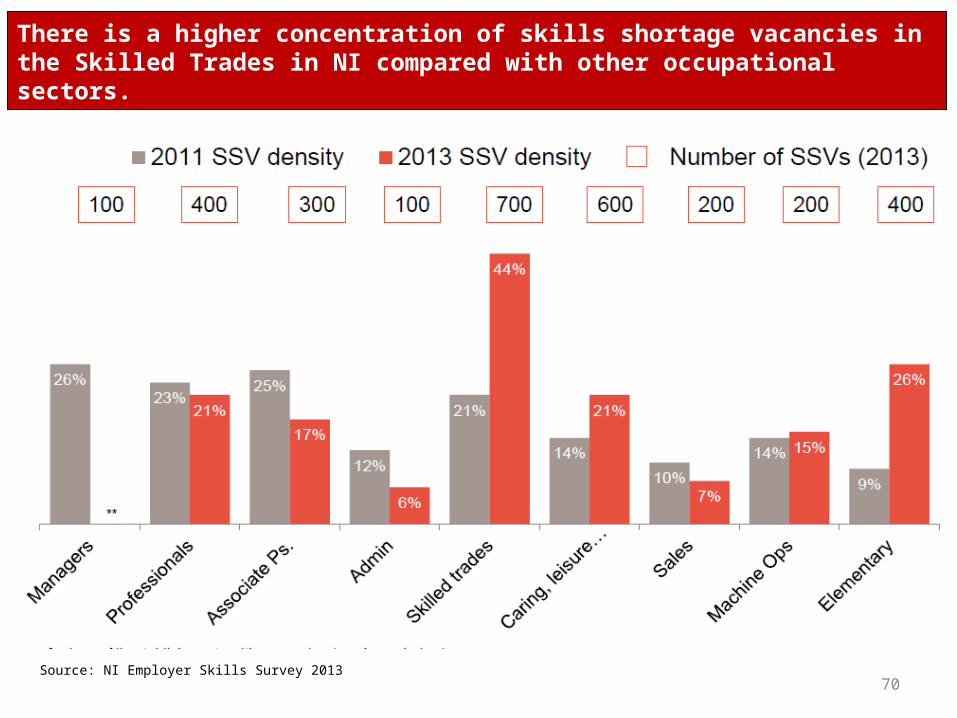
There is a higher concentration of skills shortage vacancies in the Skilled Trades in NI compared with other occupational sectors.
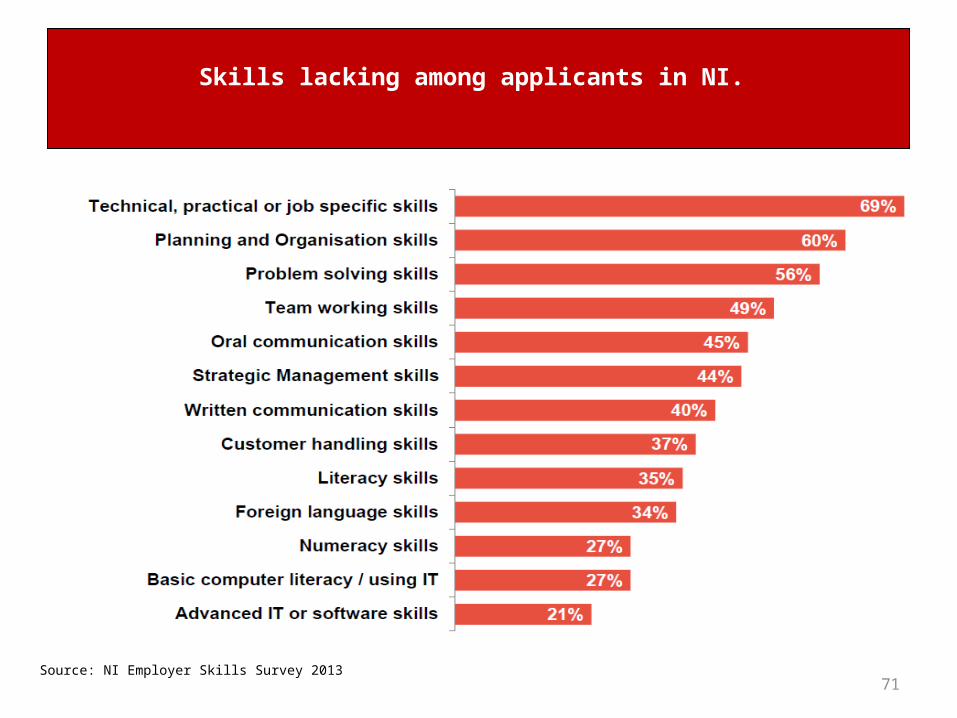
71Source: NI Employer Skills Survey 2013
Skills lacking among applicants in NI.
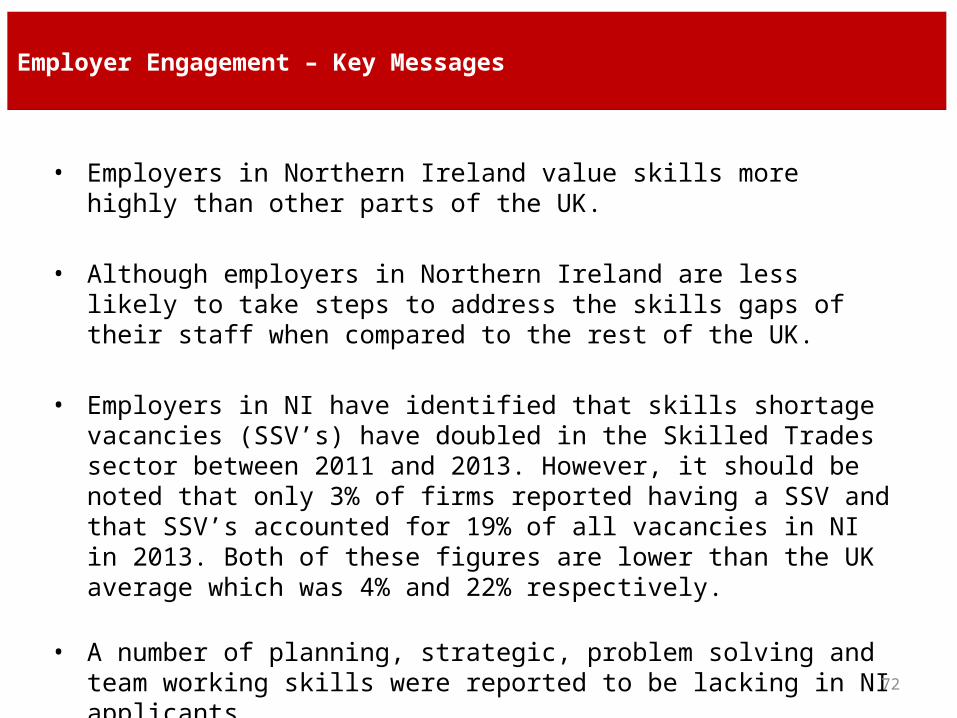
Employer Engagement – Key Messages
• Employers in Northern Ireland value skills more highly than other parts of the UK.
• Although employers in Northern Ireland are less likely to take steps to address the skills gaps of their staff when compared to the rest of the UK.
• Employers in NI have identified that skills shortage vacancies (SSV’s) have doubled in the Skilled Trades sector between 2011 and 2013. However, it should be noted that only 3% of firms reported having a SSV and that SSV’s accounted for 19% of all vacancies in NI in 2013. Both of these figures are lower than the UK average which was 4% and 22% respectively.
• A number of planning, strategic, problem solving and team working skills were reported to be lacking in NI applicants.
72
73
Wider National and International Evidence on the Benefits of Investment
in Vocational Training
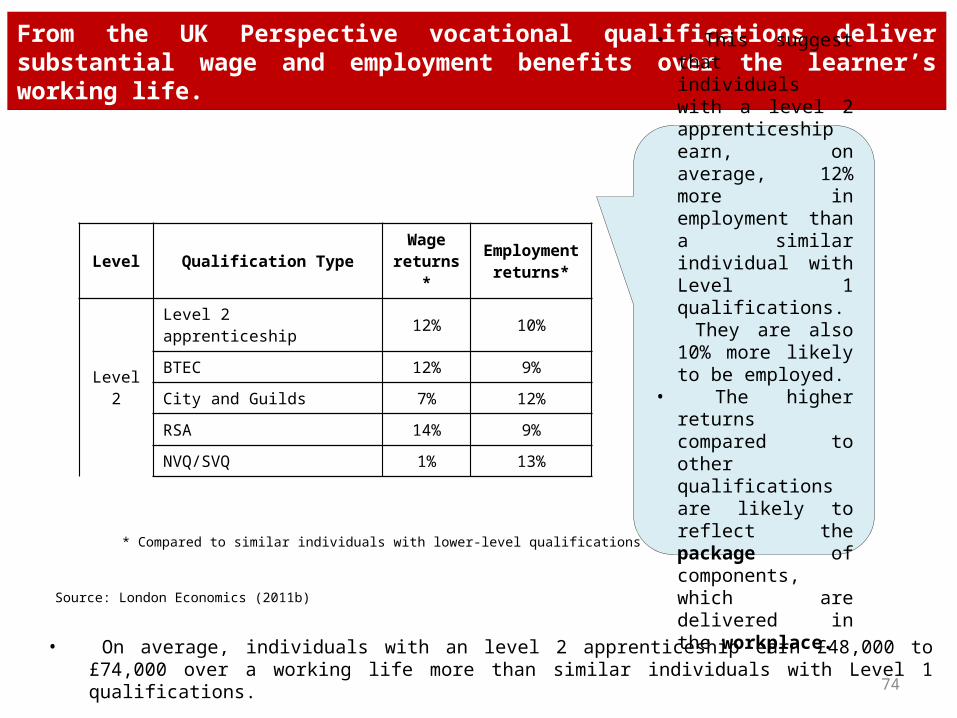
From the UK Perspective vocational qualifications deliver substantial wage and employment benefits over the learner’s working life.
Level Qualification TypeWage
returns*Employment
returns*
Level 2
Level 2 apprenticeship 12% 10%
BTEC 12% 9%
City and Guilds 7% 12%
RSA 14% 9%
NVQ/SVQ 1% 13%
• This suggest that individuals with a level 2 apprenticeship earn, on average, 12% more in employment than a similar individual with Level 1 qualifications. They are also 10% more likely to be employed.
• The higher returns compared to other qualifications are likely to reflect the package of components, which are delivered in the workplace.
* Compared to similar individuals with lower-level qualifications
Source: London Economics (2011b)
• On average, individuals with an level 2 apprenticeship earn £48,000 to £74,000 over a working life more than similar individuals with Level 1 qualifications.
74
75Source: BIS Research Paper Number 53
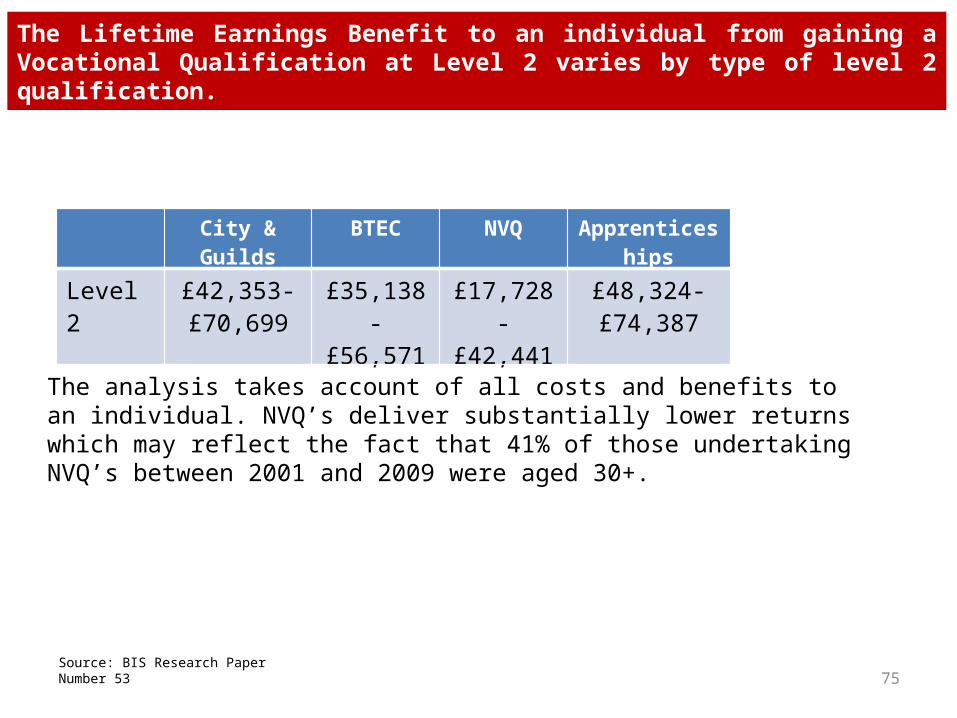
The Lifetime Earnings Benefit to an individual from gaining a Vocational Qualification at Level 2 varies by type of level 2 qualification.
City & Guilds BTEC NVQ Apprenticeships
Level 2 £42,353-£70,699
£35,138-£56,571
£17,728-£42,441
£48,324-£74,387
The analysis takes account of all costs and benefits to an individual. NVQ’s deliver substantially lower returns which may reflect the fact that 41% of those undertaking NVQ’s between 2001 and 2009 were aged 30+.
76Source: BIS Research Paper Number 53
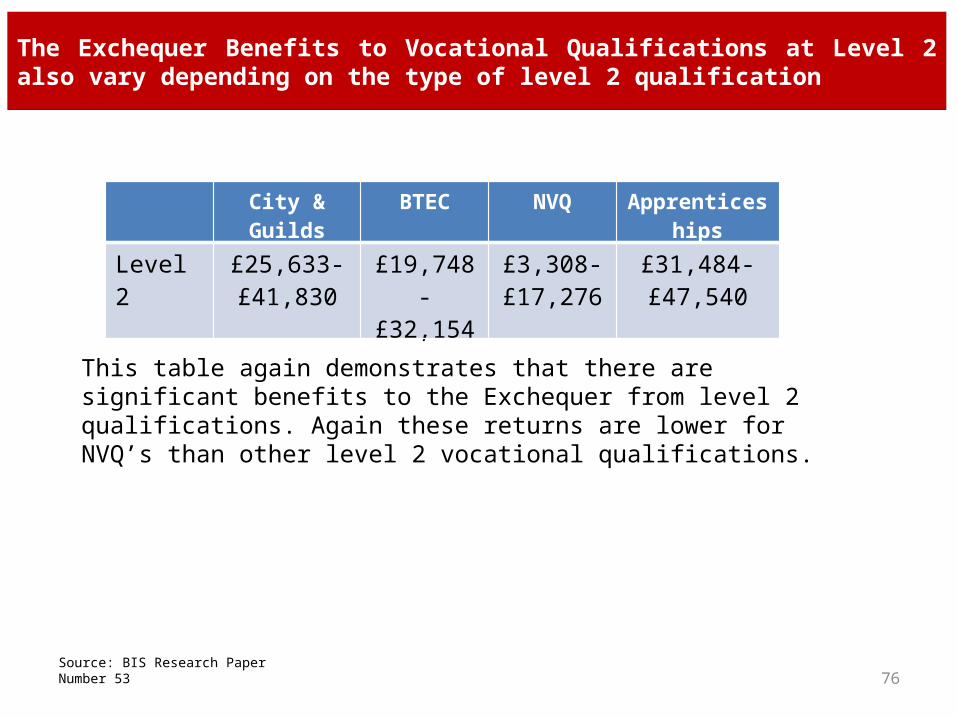
The Exchequer Benefits to Vocational Qualifications at Level 2 also vary depending on the type of level 2 qualification
City & Guilds BTEC NVQ Apprenticeships
Level 2 £25,633-£41,830
£19,748-£32,154
£3,308-£17,276
£31,484-£47,540
This table again demonstrates that there are significant benefits to the Exchequer from level 2 qualifications. Again these returns are lower for NVQ’s than other level 2 vocational qualifications.
77Source: BIS Research Paper Number 53
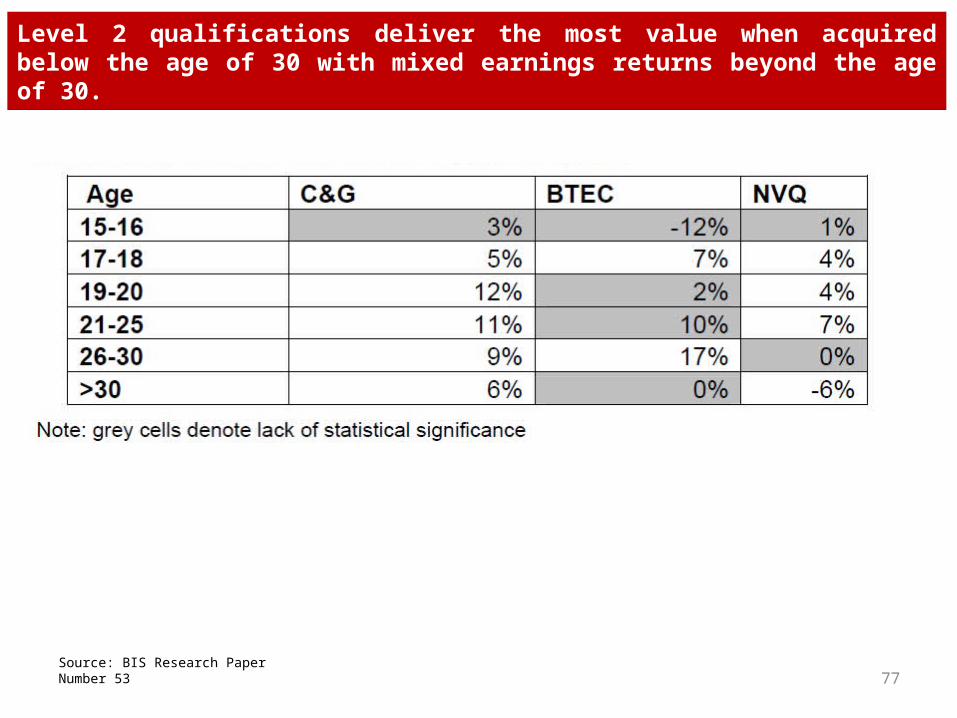
Level 2 qualifications deliver the most value when acquired below the age of 30 with mixed earnings returns beyond the age of 30.
78
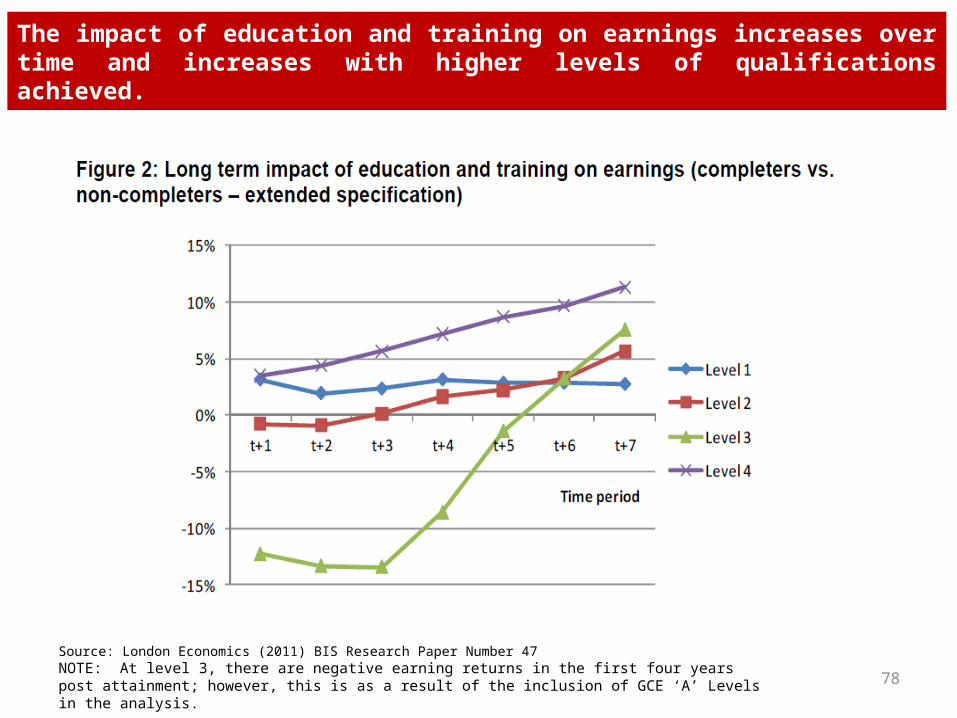
Source: London Economics (2011) BIS Research Paper Number 47NOTE: At level 3, there are negative earning returns in the first four years post attainment; however, this is as a result of the inclusion of GCE ‘A’ Levels in the analysis.
The impact of education and training on earnings increases over time and increases with higher levels of qualifications achieved.
79
Source: London Economics (2011) BIS Research Paper Number 47
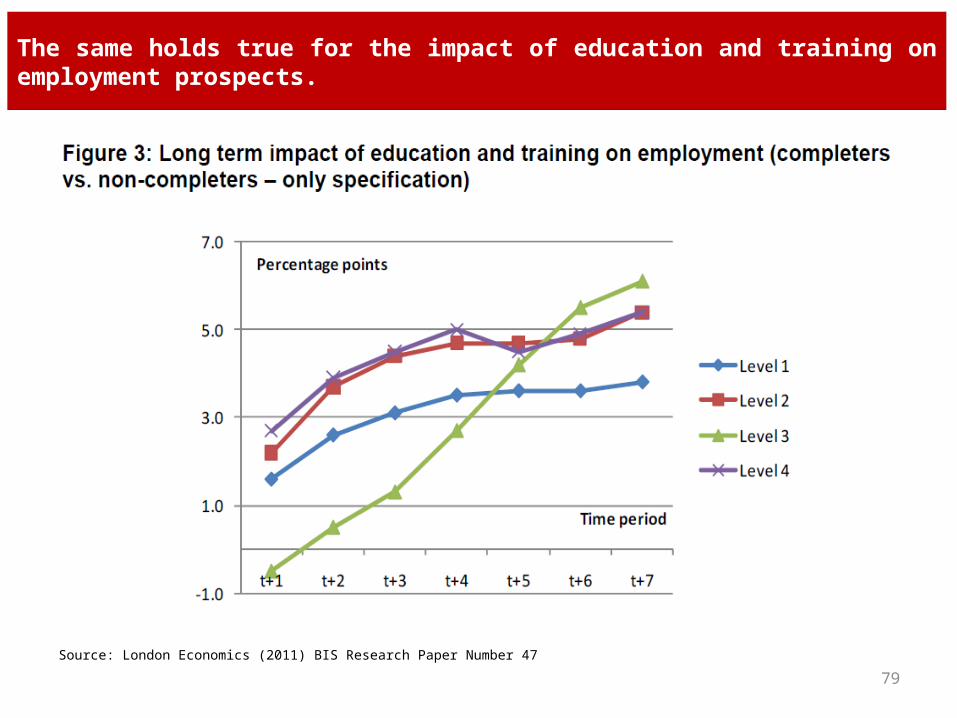
The same holds true for the impact of education and training on employment prospects.
80Source: London Economics (2011) BIS Research Paper Number 47
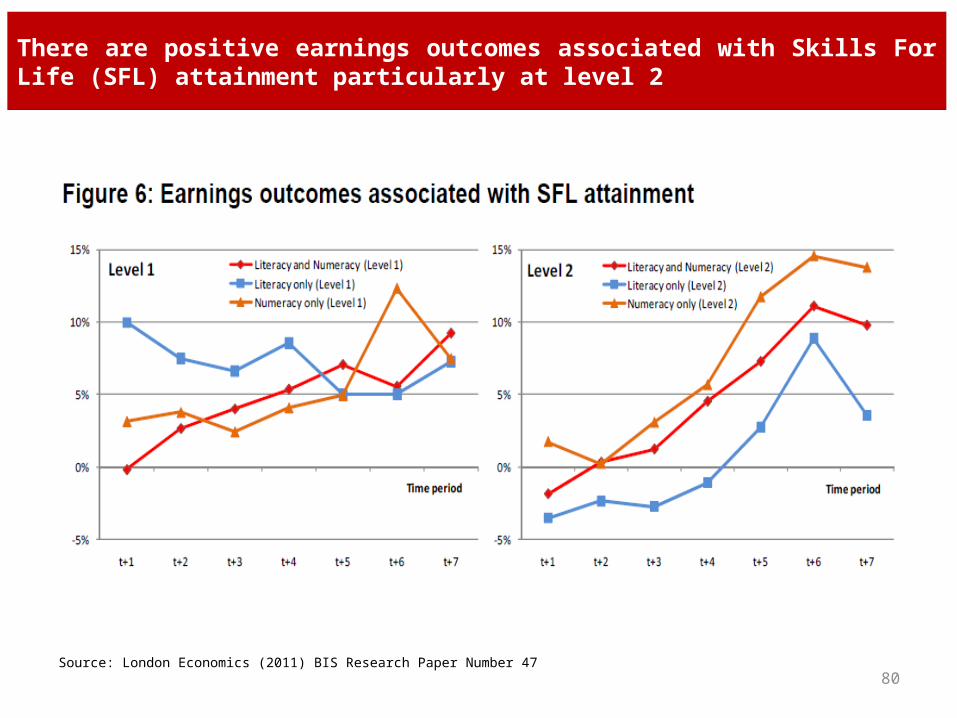
There are positive earnings outcomes associated with Skills For Life (SFL) attainment particularly at level 2
81Source: London Economics (2011) BIS Research Paper Number 47
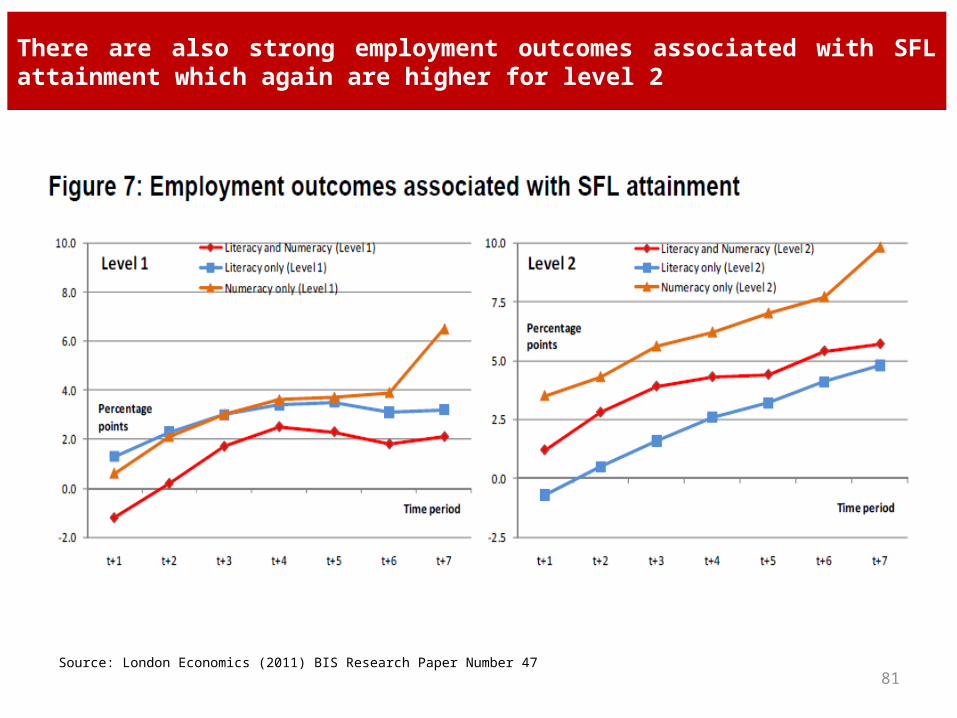
There are also strong employment outcomes associated with SFL attainment which again are higher for level 2