Embed Size (px)
Citation preview

1Research Methods Festival 2008
Zhiqiang Feng1,2 and Paul Boyle1
1School of Geography & Geosciences
University of St Andrews2The Centre for Census Interaction
Date Estimation and Research (CIDER)
Estimating Spatially Consistent Interaction
Flows

2Research Methods Festival 2008
Introduction
Census interaction data include the Special Migration Statistics and Special Workplace Statistics (2001 Special Travel Statistics for Scotland)
A major source of migration and journey to work information and the only source at a local level
The census interaction data were severely under-used
These data sets produced at large expense

3Research Methods Festival 2008
Use of interaction data in analysis of demographic and social change
•Theoretical implications
• counter-urbanisation
• depopulation
• Policy implications
• energy consumption
• environmental pollution

4Research Methods Festival 2008
Problems
• Changes in census questions• Changes in definition• Changes in themes
• Changes in coverage• Changes in disclosure control and
imputation• Changes in geographical
boundaries

5Research Methods Festival 2008
Census Ward 1981 1991 2001
England 8718 8822 7932
Wales 974 1108 868
Scotland 1211 1003 1176
10903 10933 9976
excluding shipping wards
1981 1991 2001
England 8357 8461 7932
Wales 932 1066 868
Scotland 1155 1002 1176
10444 10529 9976
Changes in geography
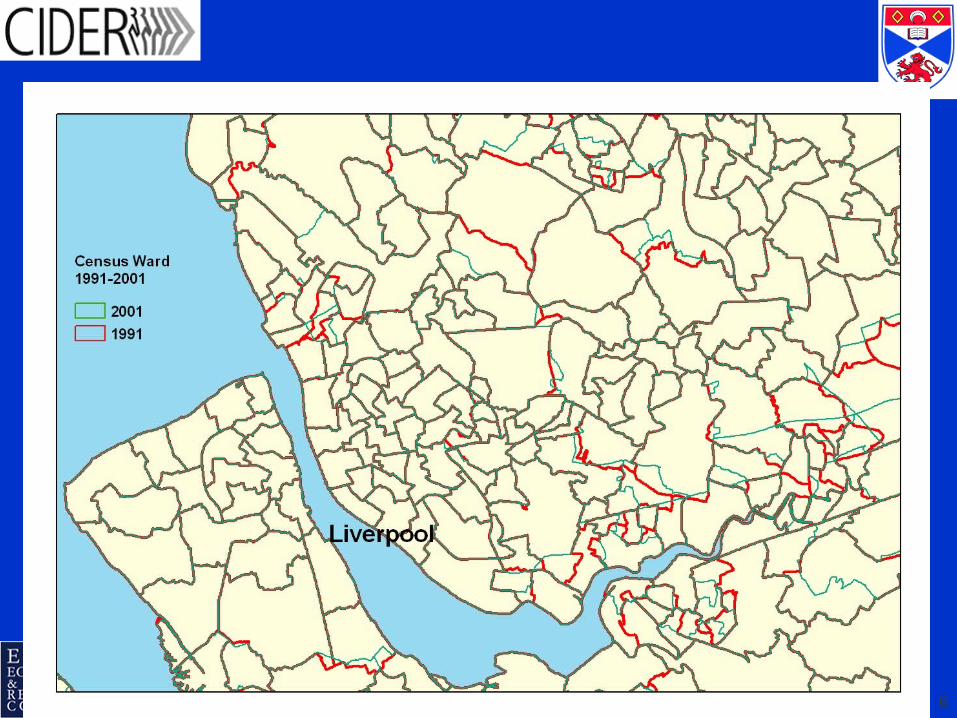
6Research Methods Festival 2008

7Research Methods Festival 2008
Research objectives
• Develop a standard methodology for integrating migration and commuting flow matrices for different geographical units
• Specifically, how do we re-estimate interaction matrices derived for the 1981, 1991 ward geographies (10,0002) for the different 1991 and 2001 ward geographies?
• Deliver reliable time series (1981-2001) interaction data for academic use

8Research Methods Festival 2008
Special Migration Statistics
1981
• Set 1:
Many tables, but complex geography
• Set 2:
Ward-level (10,0002)
1 table
2 matrices (male, female)
1991
• Set 1:
(Equivalent to 1981 Set 2)
Ward-level (10,0002)
1 table
12 matrices (age by sex)
• Set 2:
Many tables, at district-level

9Research Methods Festival 2008
Special Workplace Statistics
1981
• Set A & Set B
Ward and district level
By residence and workplace
(not matrices)
• Set C:
Ward-level (10,0002)
5 tables
172 matrices
1991
• Set A & Set B
Ward and district level
By residence and workplace
(not matrices)
• Set C
Ward-level (10,0002)
9 tables
274 matrices

10Research Methods Festival 2008
Areal Interpolation
Pi
Pj=1/2*Pi
Pk=1/2*Pi
i j k
sntt PP *

11Research Methods Festival 2008
Interpolation for interaction flows
1 2 A B CA B C

12Research Methods Festival 2008
Integrating strategy
• Use 1981 interaction data estimating for 1991 geography as an example• Gravity model of 1981 ward flows• Parameter estimates from this model used
to estimate 1981 ED flows (130,0002) • Aggregate ED flows to 1991 wards• Constrained ED flows so they sum to known
intra- and inter-ward flows

13Research Methods Festival 2008
Integrating strategy1981 ward flows
I81 J81
1991 wards
I81 J81
I91
J91
1981 estimated ED flows
A
B
C
D
Aggregate to 91 wards
A
B
C
D
1991 ward flows
I91
J91

14Research Methods Festival 2008
Methodology
Mij=migration between 1981 wards i and j; Pi=population in 1981 ward i; Pj=population in 1981 ward j; dij=distance between ward i and j;
ijij3j2i10ij ε)lndβlnPβlnPβexp(βM
30=parameters to be estimated
ijijiij dWM )lnlnexp( 210
Migration:
Commuting:
Mij=commuting between 1981 wards i and j; Pi=workers in 1981 ward i; dij=distance between ward i and j;
Models at the ward level

15Research Methods Festival 2008
Methodology
β0-3= parameters derived from ward-level model
iA jB
ABij MM ˆ
)lnlnexp(ˆ210 ABAAB dWM Commuting:
)lnlnlnexp(ˆ3210 ABBAAB dPPM Migration:
AB= migration between 1981 EDs A and B; PA= population in 1981 ED A;
PB= population in 1981 ED B; dAB= distance between ED A and B;
M̂
AB= commuting between 1981 EDs A and B; PA=employees in 1981 ED A;
dAB= distance between ED A and B;
M̂
Estimating 1981 ED flows

16Research Methods Festival 2008
• Population and grid reference data extracted from Small Area Statistics (SAS)
• Distance measurements:
Euclidean?Network?Mixed : Euclidean and network?
Measuring distance

17Research Methods Festival 2008
Estuary problem

18Research Methods Festival 2008
Island effect
Assume Euclidean distance results in over-estimates of
flows between, into and out of islands.
In fact, the model for all Scottish wards
shows these flows are under-estimated.

19Research Methods Festival 2008
Comparison between migration model results with different distance measures
Euclideandistance
Mixed distance
Deviance 921422 922090
Degree of freedom 1002998 1002998
Proportion explained 0.5811 0.5801
Constant 1.3390 1.1811
Logged distance -1.3888 -1.3644
Logged origin population 0.7144 0.7124
Logged destinationpopulation
0.6714 0.6697
Data source: 1991 SMS Set 1, Scotland

20Research Methods Festival 2008
Intra-ED flowsIntra-ED flows are excluded in the model because there is no intra-ED distance for 1981 EDs
A linear regression was used to estimate the proportion of intra-ED flow compared to the total flow
Proportion of intra-ED flow = f (logged average population)

21Research Methods Festival 2008
Estimating flows with unstated origins
Destination is always knownOrigin district and ward entirely unknown
Select from all wards in Britain
Origin district known
Select from wards with flows within the district
Estimated flowsproportional to actual flows
District ?? ward ?? District ward
District ward ?? District ward
origin destination
origin destination
Estimated flows
proportional to
ij
ji
d
PP
If there are no observed flows from the same district select from all wards from that district
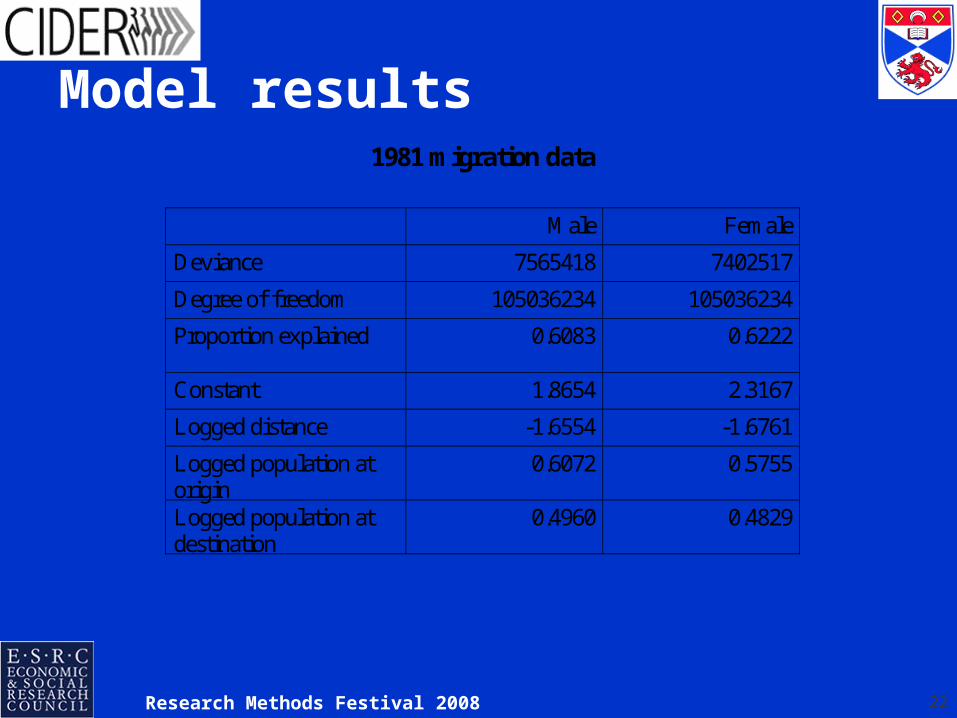
22Research Methods Festival 2008
Model results
1981 migration data
Male Female
Deviance 7565418 7402517
Degree of freedom 105036234 105036234
Proportion explained 0.6083 0.6222
Constant 1.8654 2.3167
Logged distance -1.6554 -1.6761
Logged population atorigin
0.6072 0.5755
Logged population atdestination
0.4960 0.4829

23Research Methods Festival 2008
Re-estimated Datasets on WICIDMigration dataData sets 1991 2001
ward ST ward 1981 SMS (set 2) X X
1981 SMS (set 2) X Xincl. pro-rate migrants origin unstated
1991 SMS (set 1) X
1991 SMS (set 1) Xincl. pro-rate migrants origin unstated

24Research Methods Festival 2008
Commuting dataData sets 1991 2001
geography geography
1981 SWS (set c) X X
1981 SWS (set c) X Xincl. pro-rate commuters workplace unstated
1991 SWS (set c) X
1991 SWS (set c) Xincl. pro-rate commuters workplace unstated
Re-estimated Datasets on WICID

25Research Methods Festival 2008
Case Study - Commuting change in Liverpool

26Research Methods Festival 2008

27Research Methods Festival 2008

28Research Methods Festival 2008
Conclusion
1. An innovative and model-based method has been developed for the areal interpolation of large interaction data sets
2. The estimated data sets have been loaded into WICID for academic use in analysis of spatio-temporal variations
3. Methods could be applied to other interaction data sets