Embed Size (px)
Citation preview

I of III VA103-79/2-1 Revision 0 June 15, 2005
Knight Piésold C O N S U L T I N G
FISHERIES AND OCEANS CANADA FLOW RAMPING STUDY
STUDY OF RAMPING RATES FOR HYDROPOWER DEVELOPMENTS
(REF. NO. VA103-79/2-1)
EXECUTIVE SUMMARY
In recent years, British Columbia has experienced rapid growth in the private development and operation of run-of-river hydroelectric facilities. The operation of these facilities can result in temporary rapid changes in flow (ramping) that can negatively impact aquatic resources and recreational users in a river, but which may be mitigated through the specification and implementation of ramping controls. At present, there are only numerical ramping rate standards issued by Fisheries and Oceans Canada. However, there is very limited (if any) available supporting documentation or guidelines in British Columbia for developers, operators and regulators. This report focuses on flow ramping that results from the operation of run-of-river hydroelectric facilities, and it offers recommendations on the development of a ramping rate derivation protocol for run-of-river hydroelectric developments in BC. Some of the principles presented herein, however, can also be applied to other types of hydroelectric facilities such as small storage hydro, or any facility that proposes flow regime alteration through water extraction (i.e. for industrial, agricultural or domestic use). The focusing questions to be answered in this report are:
1. What is flow ramping? 2. Why does it occur? 3. What is “river lag time” and why is this significant to ramping? 4. What are the primary hydroelectric turbine operations that cause ramping? 5. What are the primary types of hydroelectric turbines and what relevance is this to
ramping? 6. What are the primary effects of ramping? 7. What are the current ramping standards for British Columbia? 8. How do these standards compare to international standards? 9. What are the key factors that should be considered in preparing new guidelines?
Our answers to these questions are as follows:
1. Flow ramping is defined as a progressive change of discharge in a stream channel. Correspondingly, a ramping rate is defined as the rate of change of discharge, measured as flow per unit time (i.e. m3/s/s or cfs/s).
2. Ramping occurs due to changes in the demand for flow passing through one or more hydraulic turbines, usually as a result of turbine start-up or shut-down, or in response to changes in electrical load (i.e. the demand from the electrical grid to which a
II of III VA103-79/2-1 Revision 0 June 15, 2005
Knight Piésold C O N S U L T I N G
hydroelectric project is connected). The magnitude of the ultimate change in flow due to ramping is dependent on the ramping rate and the lag time.
3. Lag time is the time required for a “parcel” of water to travel from the intake to the powerhouse, either through the natural stream channel, or through the water conveyance system (pipe/tunnel)
4. The primary types of turbine operations causing flow ramping are start-up, shutdown, or response to changes in electrical load. Start-up can either require filling of the water conveyance system, or not, if the system is already filled. Shutdown can either be planned (i.e. for schedule maintenance) or unplanned (in the case of equipment malfunction). Response to load changes involves either increasing or decreasing the amount of flow through the turbine(s).
5. The two primary types of turbines are reaction turbines and impulse turbines. The key difference is that the runner of a reaction turbine is submerged in water and spins due to the effects of pressurized flow, while the runner of an impulse turbine spins in air due to the force of a high pressure jet of water directed at the runner. For run-of-river hydroelectric projects in British Columbia, reaction turbines are primarily the Francis type, and impulse turbines are typically the Pelton type.
6. Though the effects of ramping on aquatic ecosystems vary from site to site, they may be several or all of the following: a. Up-Ramping
i. Bedload scour ii. Sediment deposition iii. Flushing
b. Down-ramping i. Stranding ii. Juvenile Emigration iii. Depleted food sources iv. Inhibited aquatic invertebrate growth v. Aquatic invertebrate drift vi. Egg dewatering vii. Spawning interference
7. The current ramping standards for British Columbia are set forth by Fisheries and Oceans Canada, and include a generic table of maximum allowable rate of change of stage with time (measured in cm/hour). The applicable standard depends on the time of year, and time of day. These standards can be found in Table 6.1.
8. In comparison to ramping standards developed in Washington State by the Washington Department of Fisheries, the BC standards are poor. In particular, they fail to consider many key factors that affect ramping, which may result in either unnecessarily conservative or detrimental ramping rates. These factors include river geomorphology, river users, types of aquatic life present, differences in ramping up versus ramping down, river lag time, natural flow attenuation, flow regime, and natural flow changes. Mainly, the generic standards have no element of site specificity, and therefore have little meaning with respect to a particular run-of-river hydroelectric development.

III of III VA103-79/2-1 Revision 0 June 15, 2005
Knight Piésold C O N S U L T I N G
9. Several key factors or steps should comprise a new ramping rate derivation protocol that is specific to run-of-river hydroelectric developments in British Columbia. These main steps/factors are:
i. Identification of critical sites ii. Identification of species at risk at critical sites iii. Determination of stage-discharge relationship at critical sites iv. Determination of lag time in reach of interest for various flows v. Determination of channel attenuation at different flows vi. Determination of natural flow change rates vii. Derive interim standards with consultation with Fisheries and Oceans
Canada viii. Undertake test ramping and verify/finalize interim standards ix. Protocol documentation x. Develop evaluation criteria, and make available to all proponents
i of ii VA103-79/2-1 Revision 0 June 15, 2005
Knight Piésold C O N S U L T I N G
FISHERIES AND OCEANS CANADA FLOW RAMPING STUDY
STUDY OF RAMPING RATES FOR HYDROPOWER DEVELOPMENTS
(REF. NO. VA103-79/2-1)
TABLE OF CONTENTS
PAGE
EXECUTIVE SUMMARY ..............................................................................................................I
TABLE OF CONTENTS................................................................................................................I
SECTION 1.0 - INTRODUCTION/SCOPE....................................................................................1
SECTION 2.0 - WHAT IS FLOW RAMPING?...............................................................................2 2.1 DEFINITION.............................................................................................................2 2.2 WHY RAMPING OCCURS........................................................................................2
2.2.1 Lag Time......................................................................................................2 2.2.2 Case 1: Turbine Start-up ..............................................................................3 2.2.3 Case 2: Shutdown ........................................................................................3 2.2.4 Case 3: Load Changes.................................................................................3 2.2.5 Exceptions ...................................................................................................4
SECTION 3.0 - OPERATIONAL CAUSES OF FLOW RAMPING .................................................5 3.1 SHUT-DOWN ...........................................................................................................5
3.1.1 Planned Outages .........................................................................................5 3.1.2 Unplanned Outages .....................................................................................5
3.2 START-UP ...............................................................................................................6 3.3 LOAD CHANGES .....................................................................................................6
SECTION 4.0 - FUNCTIONALITY OF HYDROELECTRIC MECHANICAL EQUIPMENT..............8 4.1 THE HYDRAULIC TURBINE.....................................................................................8 4.2 TURBINE INLET VALVE...........................................................................................9 4.3 METHODS OF CONTROLLING RAMPING ..............................................................9
4.3.1 Pelton Turbine Systems .............................................................................10 4.3.2 Francis Turbine Systems............................................................................10 4.3.3 Bypass Valve Arrangement ........................................................................11
SECTION 5.0 - EFFECTS OF FLOW RAMPING .......................................................................12 5.1 INTRODUCTION ....................................................................................................12 5.2 LITERATURE REVIEW...........................................................................................12
SECTION 6.0 - CURRENT PRACTICES ...................................................................................15 6.1 PRACTICES IN BRITISH COLUMBIA.....................................................................15 6.2 PRACTICES IN ONTARIO......................................................................................15
ii of ii VA103-79/2-1 Revision 0 June 15, 2005
Knight Piésold C O N S U L T I N G
6.3 INTERNATIONAL PRACTICES ..............................................................................16
SECTION 7.0 - CRITIQUE OF CURRENT REGULATIONS.......................................................18
SECTION 8.0 - RECOMMENDATIONS .....................................................................................20
SECTION 9.0 - REFERENCES..................................................................................................22
SECTION 10.0 - CERTIFICATION.............................................................................................32
TABLES Table 6.1 Rev 0 Summary of British Columbia Ramping Rates Standards Table 6.2 Rev 0 Summary of Ontario’s Ecosystem Based Approach Table 6.3 Rev 0 Summary of Washington State Ramping Rates Standards
FIGURES Figure 2.1 Rev 0 Ramping Dynamics of Sudden Start-Up Figure 2.2 Rev 0 Dynamics of Continuous Up-Ramping Figure 2.3 Rev 0 Dynamics of Stepped Up-Ramping Figure 2.4 Rev 0 Ramping Dynamics of Sudden Shutdown Figure 2.5 Rev 0 Dynamics of Continuous Down-Ramping Figure 2.5 Rev 0 Dynamics of Stepped Down-Ramping Figure 2.7 Rev 0 Effects of Lag Time on Down Ramping - Downstream of the Tailrace Figure 4.1 Rev 0 Schematic of Reaction (Francis) Turbine Set-up Figure 4.2 Rev 0 Schematic of Impulse (Pelton) Turbine Set-up Figure 4.3 Rev 0 Schematic of Deflector Plate Functionality
1 of 32 VA103-79/2-1 Revision 0 June 15, 2005
Knight Piésold C O N S U L T I N G
FISHERIES AND OCEANS CANADA FLOW RAMPING STUDY
STUDY OF RAMPING RATES FOR HYDROPOWER DEVELOPMENTS
(REF. NO. VA103-79/2-1)
SECTION 1.0 - INTRODUCTION/SCOPE
In recent years, British Columbia has experienced a rapid growth in the private development and operation of run-of-river hydroelectric facilities. The operation of these facilities can result in temporarily rapid changes in flow and discharge in a river, over a reach extending from an intake location to a point below the corresponding powerhouse location. These changes can negatively impact aquatic resources and recreational users, but they may be mitigated through the specification and implementation of ramping controls. At present, there are only numerical ramping rate standards issued by Fisheries and Oceans Canada. However, there is very limited (if any) available supporting documentation or guidelines in British Columbia for developers, operators and regulators. In response to this situation, Fisheries and Oceans Canada retained the services of Knight Piésold Ltd. (KPL) to prepare a report on flow ramping for hydroelectric developments. It is KPL’s understanding that the purpose of this report is to explain the mechanics of ramping, make recommendations on a ramping rate derivation protocol specifically for BC, and explore what options are available for operators/developers to meet these requirements. As KPL has considerable experience with run-of-river hydroelectric projects in British Columbia, this assessment focuses primarily on ramping rates related to such operations. The key principles however, can be applied to hydroelectric projects with different operating characteristics than those of run-of-river projects. These key characteristics can also be applied to any operation that involves water extraction from a river including extraction for industrial, agricultural and domestic use. This study was carried out by first conducting a literature review of current practices both in British Columbia and internationally. This was largely done through a search on the Internet, including searches of major online journal indexes in the civil engineering, water resources engineering, and biology fields. In addition, several professional associates of KPL were contacted as sources of information on current flow ramping practices. In recognition that this document may be of interest to readers from a wide variety of professional backgrounds, an effort has been made to simplify technical discussions as much as possible. However, it is assumed that the reader has some familiarity with the different components and basic operations of a run-of-river hydroelectric project.
2 of 32 VA103-79/2-1 Revision 0 June 15, 2005
Knight Piésold C O N S U L T I N G
SECTION 2.0 - WHAT IS FLOW RAMPING?
2.1 DEFINITION
For the purpose of this study, flow ramping is defined as a progressive change of discharge in a stream channel resulting from the operation of a hydroelectric or other water use facility. Correspondingly, a ramping rate is defined as the rate of change of discharge, measured as flow per unit time (i.e. m3/s/s or cfs/s). Commonly, the rate of change of stage (measured in depth per unit time – i.e. cm/s) is also referred to as a ramping rate, but this is not as useful a definition, since rates of change in stage are directly dependent on the hydraulic control characteristics of a particular channel section. As the control section may vary quite dramatically over relatively short distances within a channel reach, the ramping rate, in terms of stage, can correspondingly vary significantly, so with this definition one must specify the ramping rate for a particular channel location. Flow ramping can be classified into two sub-categories of induced ramping. In some cases, induced ramping is even further categorized as flow alterations and flow fluctuations. Flow alterations can be defined as changes in flow that occur over a long period, generally in the range of weeks to months, and are typically caused by large-scale hydroelectric systems with large water storage capabilities. Flow fluctuations are rapid changes in flow that occur on a much smaller timescale typically ranging from seconds to hours. Run-of-river hydroelectric operations, due to their lack of water storage, primarily cause flow fluctuations. As such, any reference to flow ramping herein will refer to flow fluctuations. 2.2 WHY RAMPING OCCURS
Ramping ultimately occurs due to changes in the demand for flow passing through one or more hydraulic turbines, usually as a result of turbine start-up or shut-down, or in response to changes in electrical load (i.e. the demand from the electrical grid to which a hydroelectric project is connected). The magnitude of the ultimate change in flow due to ramping is dependent on the ramping rate and the lag time. This section briefly defines lag time and provides examples of how the lag time and ramping rate combine to produce changes in flow for each of the start-up, shutdown and load rejection scenarios. 2.2.1 Lag Time
Many run-of-river hydroelectric projects, and especially those with the high head (elevation difference between the intake and powerhouse), currently proposed or being constructed in British Columbia, feature long distances between their intake and the powerhouse tailrace (flow outlet) locations. The term lag time refers to the time that it takes for a “parcel” of water to travel from the intake to the powerhouse. There are two lag times associated with a hydroelectric facility: one for water travelling in the stream and the other for water travelling in the water conveyance system (pipe/tunnel). When the demand for water through the hydraulic turbines is altered, extraction of water at the intake correspondingly changes, and there is a lag or delay for the effects of the change at the intake to be registered in the channel downstream of the powerhouse tailrace.
3 of 32 VA103-79/2-1 Revision 0 June 15, 2005
Knight Piésold C O N S U L T I N G
These effects are best explained with reference to scenarios of turbine start-up, shutdown or load rejection.
2.2.2 Case 1: Turbine Start-up
For a turbine start, water is extracted from the creek at the intake, passed into the pipeline, and transported to the turbine, from whence it is discharged into the tailrace. Correspondingly, flow in the channel just downstream of the intake (often termed “spill”) will decrease by the amount that the turbine flow has increased. If the maximum turbine flow (rated flow) is close to the same quantity as the total creek flow at the intake, the spill into the natural channel will be substantially reduced (see Figure 2.1), at a rate equivalent to the ramping rate of the turbine. Since the penstock lag time is usually less than the channel lag time, the channel flow at the tailrace will not have decreased by the time the turbine discharge is added to it, yielding a significantly increased flow downstream of the powerhouse. If the channel downstream of the powerhouse contains fish spawn or juvenile fish, these could be impacted by the unexpected flow increase, which may be very rapid. Meanwhile, in the natural channel between the intake and the tailrace, decreasing flow could strand resident fish or other organisms on dewatered banks or pools (discussed in more detail in Section 5.2), particularly if the flow change is rapid. Figures 2.2 and 2.3 illustrate the impact of continuous and stepped ramping on the flow regime at the intake, tailrace and downstream of the tailrace due to start-up.
2.2.3 Case 2: Shutdown
For a plant shutdown, the opposite effect of start-up occurs. From steady state, with most of the available river flow water passing through the turbine and very little in the natural channel, the turbine flow is decreased and eventually stopped, and because there is no water storage available at the intake, the entire flow change is spilled into the natural channel at the intake (see Figure 2.4). Due to the lag time required for this spill to reach the tailrace, the channel downstream of the plant will experience a flow reduction, which may potentially strand downstream fish. Meanwhile, recreational users and resident organisms in the natural channel between the intake and tailrace are confronted with a large and possibly rapid increase in flow (see Figure 2.5 and 2.6). The streamflow response to flow ramping, downstream of the tailrace, is not only dependant on the ramping type (ramping up, down, continuous or stepped), but also on the relative time differences between the river lag time, the valve closure time and time step between steps, as illustrated on Figure 2.7.
2.2.4 Case 3: Load Changes
While in operation, the plant and turbine(s) may also be called upon to provide large, rapid load increases (block loading) or decreases (load shedding). Although the effects of these are usually not as severe as rapid starts and stops between zero and full flow, the rapid flow changes and resulting lag times lead to similar effects on fish and other
4 of 32 VA103-79/2-1 Revision 0 June 15, 2005
Knight Piésold C O N S U L T I N G
organisms both downstream of the tailrace and in the natural channel between the intake and tailrace.
2.2.5 Exceptions
It should be noted that not all proposed and operating hydroelectric plants necessarily produce substantial ramping conditions and corresponding adverse effects on recreational opportunities and in-stream aquatic life. If, for example, the turbines are sized (rated) to extract only a small portion of the available creek flow, then most of the flow will be released into the natural channel and rapid changes in the turbine flows may not cause noticeable effects in the creek. In addition, during high flow periods, when flow through the creek is high relative to the maximum turbine flow, abrupt changes in the turbine flow will produce relatively small changes in the flow conditions of the creek. Furthermore, if the watercourse between the intake and tailrace does not contain aquatic life and is not frequented by recreational users, and the powerhouse is located at or downstream of the confluence of a significant tributary stream, ramping effects may not have significant consequences. As well, for many lower head sites the length and nature of the natural channel between the intake and the tailrace yields such a short lag time that the rapid dewatering and flushing effects discussed above may not be significant enough to create a problem. These mitigating factors are usually identified in the Environmental Impact Assessment normally carried out before development is approved to proceed.
5 of 32 VA103-79/2-1 Revision 0 June 15, 2005
Knight Piésold C O N S U L T I N G
SECTION 3.0 - OPERATIONAL CAUSES OF FLOW RAMPING
Flow ramping results from the operational demand of a hydroelectric plant to either increase or decrease the flow to its turbines, and for both time (money) and safety considerations it is generally preferable to make these changes as quickly as possible. However, as the rate of change increases so too does the significance of the ramping effects (in general), so a balance must be found between operational objectives and the need to protect resources in the creek. The following presents a number of different operational scenarios requiring changes in the flow to the turbines. 3.1 SHUT-DOWN
Typically, there are five main scenarios resulting in sudden flow decreases or complete plant shutdown, as described below. These five scenarios can be further categorised as either planned outages or unplanned outages. 3.1.1 Planned Outages
1. To facilitate maintenance of the water conveyance system and the generating equipment the generating equipment must be stopped, and the system de-watered. Typically, routine maintenance is planned to occur during periods when there is insufficient flow in the river and the potential for lost energy production is minimal. In British Columbia, this typically occurs in the late summer or the mid-winter.
2. For load shedding (also mentioned in Section 2.2.4), a decrease in flow is caused by a request to meet a particular load requirement in the electrical grid. The timing of load shedding can be unpredictable, as the electrical load requirements in the grid are typically dynamic, and far beyond the control of the plant operator. Load shedding is not as common for run-of-river hydro developments as it is for storage hydro developments.
3.1.2 Unplanned Outages
1. An outage can occur as a result of insufficient flow in the river to both generate electricity and maintain the minimum instream flow in the diversion reach.
2. As a result of some unexpected equipment malfunction, such as technical difficulties with mechanical or electrical equipment, or an automated operating system (also referred to as “load rejection”), emergency shutdown maybe be initiated. Equipment malfunction could also include loss of transmission services due to tree fall or ice build-up. Under this scenario, immediate plant shutdown is required for protection from further system damage and for immediate repair and maintenance.
3. Lastly, an unplanned outage could include a sudden or impending failure of electro-mechanical equipment, or component of the water conveyance system. Under such a scenario, an emergency shutdown procedure would be initiated to minimize
6 of 32 VA103-79/2-1 Revision 0 June 15, 2005
Knight Piésold C O N S U L T I N G
potential or further damage of the mechanical and electrical equipment, and/or the water conveyance system.
Scenarios 4 and 5 can lead to a condition known as “overspeed”. If an electrical malfunction (fault) occurs in the turbine/generator unit or in the interconnected electrical grid, the protective relaying system will sense the fault and immediately open the generator circuit breaker to disconnect the unit (this is called a “load rejection”). As soon as the unit is disconnected, the generator no longer has an electrical load on it to restrain its speed and the continued water flow through the turbine (connected to the generator by the shaft) will cause the generator to accelerate (known as “overspeed”). It is necessary to rapidly stop the water flow through the turbine by closing either the wicket gates (Francis turbine) or the needle valves (Pelton turbine), before the high centrifugal forces due to the overspeed damage the generator and bearings. Ideally, the closure would be instantaneous, since this would minimize the resulting generator damage.
3.2 START-UP
An equal number of project start-up scenarios could be conceived for a run-of-river operation, however only two scenarios potentially differ with respect to ramping. These two scenarios are summarised below.
1. Start-up after a plant shutdown. In this scenario, the water conveyance system is assumed completely full and pressurized, resulting in immediate ramping effects downstream of the powerhouse when start-up of the turbines and generators commences.
2. Initial start-up, or start-up after an emergency shutdown where dewatering of the water
conveyance system (penstock and/or tunnel) has occurred. Under this scenario, the water conveyance system must be filled and pressurized prior to commencement of the turbine and generator units. This scenario results in an offset flow effect below the tailrace, the dynamics of which largely depend on the time required to fill the water conveyance system, and the lag time of the river.
The dynamics of how these flow quantities change are dependent on the type of hydraulic turbine, which is in turn dependent on the quantity of head and the maximum design flow at a given site. The types of turbines typically used in British Columbian run-of-river hydroelectric sites are discussed in the following sub-sections, along with descriptions of the mechanisms by which they ramp flow. 3.3 LOAD CHANGES
While in operation, the plant and turbine(s) may also be called upon to provide large, rapid load increases (block loading) or decreases (load shedding). The operational procedures for adjusting to load changes are much simpler than for either start-up or shutdown. In this case, flow through the turbine(s) is either increased or decreased through adjusting the needle valves (Pelton units)

7 of 32 VA103-79/2-1 Revision 0 June 15, 2005
Knight Piésold C O N S U L T I N G
or wicket gates (Francis units). In some cases, load increases and decreases may require one or more turbines to either commence or cease operating, in order to maintain the highest efficiency possible. The effects of block loading and load shedding are usually not as severe as rapid starts and stops between zero and full flow, though the severity depends on the magnitude of the load change.
8 of 32 VA103-79/2-1 Revision 0 June 15, 2005
Knight Piésold C O N S U L T I N G
SECTION 4.0 - FUNCTIONALITY OF HYDROELECTRIC MECHANICAL EQUIPMENT
4.1 THE HYDRAULIC TURBINE
The hydraulic turbine is the heart of any hydroelectric power plant. It is the machine that turns the water pressure energy into mechanical energy through a revolving shaft. The shaft connects the turbine to an electromagnetic generator, which in turn transforms the mechanical shaft energy into electrical energy. A turbine consists of a stationary circular steel pipe or spiral casing arranged around a revolving water wheel or runner. The spiral casing is designed to efficiently distribute the water around the circumference of the runner and direct the flow inwards towards the runner buckets. The runner is a steel wheel, connected to a shaft, with buckets arranged around its periphery. The shape and inclination of the buckets alters the direction and velocity of the water, such that hydraulic energy is extracted causing the runner and shaft to turn. There are two principal classes of hydraulic turbines, which are reaction and impulse turbines. Both have a spiral casing and runner, with the primary difference between them being the manner in which water pressure is applied to the runner. Reaction (Francis) Turbines Reaction turbines, which in their most common form are known as Francis turbines, operate while the entire spiral casing and runner are continuously flooded with pressurized water, with flow from the spiral casing into the runner controlled by a series of pivoting vanes called wicket gates. The buckets in a reaction runner operate similar to airfoils to extract both pressure and kinetic energy from the water flow. Figure 4.1 shows the general configuration of a Francis turbine system. Impulse (Pelton) Turbines Impulse turbines, which in their most common form are known as Pelton turbines, operate with the runner in air at atmospheric pressure. The water leaves the spiral casing through nozzles that project the water in high velocity jets towards the runner buckets. All the water pressure energy in the spiral casing is turned into kinetic energy by the nozzles and the runner acts as a high efficiency “paddlewheel”. Highly efficient needle valves are built into the nozzles to control the flow of water to the runner. Figure 4.2 shows the general configuration of a Pelton turbine system. To facilitate understanding and be consistent with colloquial terminology, the terms “Francis” and “Pelton” will be used to generically represent all reaction and impulse turbines, respectively, for the remainder of this discussion. From a ramping standpoint, the most significant difference between the two types of turbines is that the Pelton runner is separated hydraulically from the pressurized spiral casing, so that the runner can be stopped while maintaining the flow through the turbine. This is achieved by inserting deflector plates into the jets to divert the water away from the runner (see Figures 4.2 and 4.3). This is not possible with a Francis turbine since the only way to stop the runner is to

9 of 32 VA103-79/2-1 Revision 0 June 15, 2005
Knight Piésold C O N S U L T I N G
close the wicket gates, which would also stop the flow. Diversion of the water away from the runner can be accomplished, however, by adding a diversion pipe and valve to the spiral casing, which is commonly known as a synchronous bypass valve. With such a valve, the flow can be maintained through (or around) the turbine while the wicket gates are closed and the runner is stopped. The bypass valve is typically connected to the spiral casing. 4.2 TURBINE INLET VALVE
The Turbine Inlet Valve (TIV) is usually a large diameter butterfly or spherical valve located upstream of the turbine, between the spiral casing and the penstock, as shown on Figures 4.1 and 4.2. It is normally used only to isolate the turbine from the spiral casing, so that the spiral casing can be dewatered for maintenance while the penstock is kept full of water, and is rarely used when the turbines are operating. However, for emergencies when the wicket gates or needle valves fail to operate, the TIV would be employed to stop the flow as quickly as possible. In this situation, all flow through the turbines is cut off, so regardless of whether the system operates with Francis or Pelton turbines, significant ramping effects will occur. The only ways to mitigate these ramping effects are:
• With the installation of a bypass valve on the pipe (penstock) upstream of the TIV, so that flow can bypass the TIV; or
• By minimizing the number of potential TIV trips. The emergency described is very rare, and though possible, it would generally not be expected to occur at any time during the operating life of a hydroelectric facility. As such, in the past, run-of-river hydroelectric projects, and particularly those with Pelton turbines, have typically not been required to install a bypass valve upstream of the TIV. The need for such a bypass valve and the justification for its significant expense should be assessed on a case-by-case basis, as it depends on the emergency closure rate of the TIV and the associated ramping effects and possible consequences at a particular site. The maximum closing rate of the TIV is dictated by the pipeline’s ability to withstand pressure changes in the water column caused by the valve closure. These pressure changes, which are known as hydraulic transients or “waterhammer,” are directly proportional to the speed of closure of the valve and the corresponding change in flow rate. If the flow is stopped too rapidly, the resulting waterhammer pressure can exceed the design strength of the penstock material and burst the pipe. Despite this constraint, however, the maximum permissible rate of closure from an engineering design perspective is typically much faster than the ramping rates tolerated by the aquatic resources and recreation users of a creek. 4.3 METHODS OF CONTROLLING RAMPING
As briefly mentioned above, ramping rates can be controlled using the turbine ancillary equipment, namely deflector plates for Pelton turbines and bypass valves for Francis turbines, provided such equipment is designed with sufficient strength and robustness to sustain water diversion and energy dissipation for the long periods of time typical of controlled ramping. The use of such equipment to relieve sudden flow changes adds extra capital cost, but has the
10 of 32 VA103-79/2-1 Revision 0 June 15, 2005
Knight Piésold C O N S U L T I N G
advantage of minimizing surge and waterhammer pressures as well as mitigating the environmental effects. A computer controlled “flow ramping” process can be adopted to control and reduce the rate of flow changes both in the natural channel below the intake and in the natural channel downstream of the tailrace. If this equipment isn’t designed with such an intention, however, the system may not be versatile enough to meet ramping requirements after it has been constructed, without significant upgrade and associated cost. The following presents detailed descriptions of controlled ramping procedures for both Pelton and Francis turbines. 4.3.1 Pelton Turbine Systems
To commence rapid shutdown for a Pelton turbine, the deflectors would be rapidly (1-2 seconds) inserted into the jet flow between the nozzles and runner. This would immediately divert the water away from the runner while the unit is stopped. Meanwhile, if the needle valves are prevented from closing, the jet flow from the nozzles would continue to flow at the same rate against the deflectors and continue to drop into the tailrace, and hence to the downstream natural channel, where no change in flow would be affected. Although the needle valves would be slowly closed anyway, in order to minimize waterhammer (surge) pressures in the upstream penstock (typically five to fifteen minutes closure time for surge minimization), they may be further restrained to provide closure times up to several hours for instream concerns. Since the reduction in flow through the turbine is directly related to the increase in spill from the intake to the natural channel, a long “ramping” down of the flow reduction through the turbine could be matched to the channel lag time to similarly “ramp” up the flow increase in the channel. If this is done properly and slowly enough, the initial change in flow (and water level) in the creek would be quite small and once the lag time has elapsed the decrease in turbine flow would match the increase in channel flow such that no additional net flow change would result. In the natural channel below the intake, the change in flow would still occur, albeit slowly, but given the existence of the hydro facility this reach is likely less significant for aquatic life. For a turbine start and block loading, the opening of the needle valves and increase in jet flow against the runner can similarly be restrained and ramped up over a long period. This time can be matched to the lag time for the resulting decrease in river flow, with minimal changes in flow downstream of the plant and only slow changes in channel flow.
4.3.2 Francis Turbine Systems
The same flow ramping capability and environmental mitigation can be provided to a Francis turbine by adding a bypass valve to either the spiral casing or penstock. This valve can function for surge (waterhammer) relief (as a synchronous bypass valve, as previously discussed), ramping for environmental effect mitigation (where it may be called a “fish bypass”), or both. In either case, the valve operator is linked to the wicket gate operator so that the valve opens as the wicket gates close, or vice versa, to act as a deflector to divert flow away from the runner in order to stop the unit. The bypass valve can then be slowly closed (or opened) to provide similar “flow ramping” as provided by a Pelton turbine’s slow-acting needle valves. It should be noted that while a bypass valve’s
11 of 32 VA103-79/2-1 Revision 0 June 15, 2005
Knight Piésold C O N S U L T I N G
use as a synchronous bypass valve for surge relief may only require partial diversion of the flow, (and thus a smaller valve) the use of the valve as a “fish bypass” will require the valve to be sized and constructed for the full turbine flow rating and power output. This is because this valve must dissipate the same energy as the turbine. This will increase the costs and energy dissipation capability of the valve and its structural support, and requires careful selection and design of the valve system.
4.3.3 Bypass Valve Arrangement
As mentioned in Section 4.2, if emergency TIV closure is required, the nature of the fault usually requires it to be closed as quickly as possible within the surge limits of the penstock design. In these rare but possible cases, neither the deflectors nor a synchronous bypass valve connected to the spiral casing will be able to provide flow ramping for environmental mitigation, since the flow is rapidly stopped before it gets to the flow ramping valve arrangement. Therefore, if long term flow ramping (i.e. for a period in excess of about ten minutes) is required, it will be necessary to provide a bypass valve that is connected to the penstock upstream of the TIV.
12 of 32 VA103-79/2-1 Revision 0 June 15, 2005
Knight Piésold C O N S U L T I N G
SECTION 5.0 - EFFECTS OF FLOW RAMPING
5.1 INTRODUCTION
By definition flow ramping is a progressive change of discharge in a stream channel directly resulting from the operation of a hydroelectric or other water use facility; and is somewhat analogous to rising and falling limbs of a natural storm or spring melt hydrograph. The magnitude, frequency, and duration of these progressive flow changes are determined by site-specific factors related to the physical environment and project operating characteristics including regulatory requirements. Natural stream ecosystems are subjected to natural hydrologic alterations that also result in progressive flow changes in stream channels. In summary, progressive flow changes in streams can potentially result from both natural and project-induced factors; and in specific cases these factors may act in combination. The effects of flow ramping on stream ecosystems must be evaluated in consideration of the natural hydrologic regime in relation to site-specific factors. In the absence of this analysis it is possible to draw conclusions concerning the effects of flow ramping that are out of context. Flow ramping is more of a concern where it induces progressive flow changes that are greater in magnitude, frequency, and duration than those recorded under natural conditions. Consequently, we anticipate that much of the study effort has focussed on situations where flow ramping induces flow changes that greatly exceed those which occur naturally; and that the documented effects of flow ramping on stream ecosystems may be unintentionally biased towards these types of situations. 5.2 LITERATURE REVIEW
The literature review included searches of the internet including major online journal indexes in the civil engineering, water resources engineering, and biology fields. In addition, several professional associates of KPL were contacted as sources of information on current flow ramping practices. As expected, numerous site-specific flow ramping studies have been conducted in association with large-scale storage hydroelectric facilities in the USA and Canada. In some cases these facilities induced major downstream flow reductions that resulted in catastrophic impacts to fish through stranding. No studies were identified that were specific to flow ramping at high-head run-of-river hydroelectric projects or focussed on the effects of incremental flow changes on stream ecosystems under natural conditions. The following list presents a summary of the key effects of flow ramping as identified in the literature review.
1. Increases in Flow: Effects on aquatic habitat due to rapid increases in flow have not been well documented to date. Biological impacts due to up-ramping are primarily caused from river bed scour and deposition at gravel and sand bars, where eggs and
13 of 32 VA103-79/2-1 Revision 0 June 15, 2005
Knight Piésold C O N S U L T I N G
alevins are present. Juvenile fish can also be physically flushed downstream due to increased flow velocities. Flow increases, or up-ramping rates, are typically governed by public safety concerns, as these up-ramping rates to date have typically been more stringent than those derived based on biological impacts.
2. Decreases in Flow: The following summarizes the potential effects of flow decreases on
fish and aquatic invertebrates:
a. Stranding: Stranding is the separation of fish from the free flowing or wetted portion of a river due to a drop in the water level. Stranding can occur as entrapment in a side channel or pool (trapping), by beaching – where fish are caught above the water line as it decreases, leaving them stranded on land; or by subsurface dewatering of interstitial spaces within coarse substrates utilized by fish. In general the potential for stranding is dependent on local site characteristics, fish size, time of year, and light conditions resulting from time of day. Stranding increases dramatically if baseflows drop below a site-specific water level, defined as a minimum critical flow. Streams with long side-channels and low gradient bars potentially exacerbate fish stranding relative to streams confined in a single channel with steep banks. Experiments on brown trout (Salmo trutta) in artificial channels in Norway concluded that water temperature was the most important factor determining the magnitude of stranding, with the highest stranding incidents occurring under conditions that included cold water, coarse substrate, low gradient, and high current velocity. Age 0+ fry were the most susceptible fish size to stranding. The study recorded significant reductions in stranding incidents by lowering the dewatering rate from 60 cm/hr to 20 cm/hr, while rates below 10 cm/hr drastically reduced stranding rates in fry under warm water conditions. These results were obtained based on almost complete dewatering of the artificial channel, and may not be directly comparable to cases where a large percentage of the wetted area is maintained at all times through minimum Instream Flow Requirements (IFRs) in the stream channel. Other studies have documented subsurface stranding of fry and a clear relationship between increased stranding with increasing substrate size. For this reason slowing ramping rates are recommended in the presence of large substrates in combination with cold water.
b. Juvenile Emigration: Studies in the mid-seventies showed that flow fluctuations caused juvenile salmon to emigrate downstream, causing potential overcrowding of spawning habitat downstream, and under utilisation of spawning habitat upstream. Behavioural studies on Atlantic salmon (Salmo salar) and brook trout (Salvelinus fontinalis) in Newfoundland tracked movements of parr and juveniles in response
14 of 32 VA103-79/2-1 Revision 0 June 15, 2005
Knight Piésold C O N S U L T I N G
to artificial flow fluctuations. Fish responded to flow decreases by either maintaining their immediate territories or by moving moderate distances. There were no large scale movements, habitat abandonment, or stranding recorded. This result may in part be due to the provision for maintaining a minimum flow in the stream well in excess of 10% MAD during the experimental trials.
c. Aquatic Invertebrates: In addition to fish, aquatic invertebrates can be potentially impacted by flow fluctuations by standing, drift (separating from the substrate and floating downstream), depleted food sources (such as woody debris for detritus feeders), or inhibited growth (such as algae, which provides a food source for herbivorous invertebrates). Drift rates have increased in response to flow fluctuations in some studies.
d. Egg Dewatering: Should water levels drop too low for extended periods while eggs lie in river substrate, the eggs can desiccate and die. Studies have indicated that salmon eggs have the potential to survive for weeks under dewatered conditions if they remain moist. The potential for this type of impact is minimized through provisions for guaranteed minimum IFRs.
e. Spawning Interference: Past observations have indicated that ramping has affected the spawning habits of chinook salmon (Oncorhynchus tshawytscha). Ramping was observed to cause some chinook to relocate redd digging when flows changed. Opposing conclusions were also made, indicating chinook spawned in areas that were completely dewatered for significant portions of the day. More research is needed in this area in order to make concrete conclusions regarding the impacts of ramping on fish spawning behaviour. The potential for this type of impact is minimized by reducing the frequency of ramping events during fish spawning periods.
15 of 32 VA103-79/2-1 Revision 0 June 15, 2005
Knight Piésold C O N S U L T I N G
SECTION 6.0 - CURRENT PRACTICES
6.1 PRACTICES IN BRITISH COLUMBIA
Currently, ramping rate standards set forth by Fisheries and Oceans Canada provide the only guidance to run-of-river developers and operators for determining ramping rates for proposed or operating hydroelectric projects in British Columbia. These standards provide the basis for the design as well as the operation of their mitigation systems as mentioned in Section 4.3. Table 6.1 summarises these ramping rates standards. Table 6.1 indicates there are two main drivers affecting ramping rates: time of year (and associated fish life stage) and time of day. As such, ramping standards exist for three annual periods, with different standards for day-time and night-time ramping. Independent consultants have also completed site-specific ramping rate assessments for various run-of-river projects in BC, which in some cases has resulted in development of site-specific ramping rate criteria exceeding the Fisheries and Oceans Canada generic standards provided in Table 6.1. The independent studies have taken site-specific factors into consideration for determining an appropriate ramping rate including natural flow changes, fish species present, river geomorphology, river hydrology, lag time and flow regime at time of ramping. It is KPL’s understanding that evaluation and approval of site-specific ramping rates by Fisheries and Oceans Canada has been a difficult and uncertain process, because no protocol currently exists for evaluating independent, site-specific, ramping rate studies. This fact may or may not have been one of the factors that initiated this study. 6.2 PRACTICES IN ONTARIO
Flow Ramping regulations in Ontario fall under the provincial Lakes and Rivers Improvement Act. Under this act, all owners of existing and proposed hydroelectric facilities are required to prepare a Water Management Plan, in accordance to the Water Management Planning Guidelines, developed by the Ontario Ministry of Natural Resources (OMNR). Within these guidelines are Aquatic Ecosystem Guidelines (AEGs), which provide further guidance for the protection and enhancement of aquatic ecosystems that may be affected by a hydroelectric facility. The OMNR’s flow ramping protocol is embedded in a more holistic set of guidelines, namely the Water Management Planning Guidelines. These guidelines provide a framework for determining and summarising all water level and flow regimes associated with a hydroelectric facility including the maximum diverted flow, pre and post-project flows, minimum instream flows, and ramping rates. A detailed description of the Ontario Ministry of Natural Resource’s Aquatic Ecosystem Guidelines can be found online (Reference No. 3). A table from this document is presented in Table 6.2, outlining a summary of the seven-step process for developing ecosystem-based flow and level objectives. As mentioned above, this seven-step process encompasses more than just the determination of appropriate ramping rates, but also includes the determination of the maximum diverted flow, pre and post-project flows, and minimum instream flows. As a result, the
16 of 32 VA103-79/2-1 Revision 0 June 15, 2005
Knight Piésold C O N S U L T I N G
detail provided in the AEGs is somewhat limited, and no detailed step-by-step processes for developing ramping rates for a particular site are provided. The OMNR however, published a report titled Simulating and Characterising Natural Flow Regimes (Reference No. 4), which offers a more detailed description of methodologies available to determine natural flow change indicators through statistical software called IHA (Indicator of Hydrologic Alteration) v.5. The developers of this software have further defined and categorised thirty-two indicators of hydrologic alteration into five groups (Reference No. 7), one of which applies to flow ramping. This group of four indicators summarise the rate and frequency of water condition changes, prior to and after project development. These indicators can then be used to directly compare statistical differences in flow ramping between the natural and regulated scenarios. These statistical results can then be used on combination with the other steps identified in Table 6.2 to develop a draft ramping rate schedule for a particular project. Developing and finalising a ramping rate schedule occurs in a review and consultation process between the project owner and both the OMNR and Fisheries and Oceans Canada. Approval from both these agencies is required before finalisation of the Waterpower Management Plan can occur, and the ramping rate schedule completed. It should be noted that ramping rate protocol for Ontario is not specific to run-of-river projects, but rather encompasses all hydropower, with generally more emphasis on storage hydro. 6.3 INTERNATIONAL PRACTICES
Little information was identified on any international protocol for determining ramping rate standards for run-of-river hydroelectric projects. Though numerous site-specific ramping rate studies were discovered, their applicability to run-of-river projects in British Columbia was deemed marginal, as the majority of the studies were completed for large-scale storage hydro operations, where flow alterations are much larger in magnitude. Guidelines for flow ramping in Washington State, USA were reviewed and can be summarized as a three-stage process. Stage 1: Generic Interim Standards Similar to the standards developed by Fisheries and Oceans Canada, the Washington State Department of Fish and Wildlife has established a table of generic ramping rate standards dependant on time of year (and associated fish life stage), and time of day (daytime and night time rates). These standards are summarized on Table 6.3. The main purpose of the generic standards is to provide interim (or baseline) ramping rate standards early in the consultation process, so that engineers have some preliminary design criteria.
17 of 32 VA103-79/2-1 Revision 0 June 15, 2005
Knight Piésold C O N S U L T I N G
Stage 2: Ramping Rate Studies The Washington State Department of Fish and Wildlife has provided a ramping rate study framework to provide guidance to consultants responsible for preventing or mitigating flow ramping. This framework is summarised below:
1. Identify critical sites. Critical sites are described as areas in a river where there exists a high risk of juvenile salmon stranding, such as near gravel and sand bars, shallow side channels and pools.
2. Determine stage-discharge relationships. Stage-discharge relationships provide the conversion of flow (always known and controlled within a hydroelectric facility) and stage (the underlying factor affecting fish stranding).
3. Determine lag time. The lag time, as mentioned in Section 2.2.1, is the time a “parcel” of water takes to travel in the natural watercourse from the intake to the tailrace. Lag times can also be determined from either the intake or tailrace to each critical site. Several lag times should be determined at different flows.
4. Determine stage attenuation. Commonly referred to as flow routing, stage attenuation refers to the damping (or smoothing) of flow and stage changes as water moves downstream. Stage attenuation should be determined for a range of flows.
Ramping studies are conducted in consultation with the Washington State Department of Fish and Wildlife to ensure critical site selection and study methodology meets their satisfaction. Interim guidelines are recommended from the results of the study, subject to approval by the Washington State Department of Fish and Wildlife. Stage 3: Operational Studies After approval of the interim standards developed from the results of Stage 2, operational ramping testing would be conducted subsequent to project construction. The purpose of post-construction ramping testing is to verify the findings of the study, and to potentially amend any interim standards that do not meet the satisfaction of the Washington State Department of Fish and Wildlife. Ramping criteria would then be finalized for the project after final approval.
18 of 32 VA103-79/2-1 Revision 0 June 15, 2005
Knight Piésold C O N S U L T I N G
SECTION 7.0 - CRITIQUE OF CURRENT REGULATIONS
It is our current understanding that the current ramping rate standards in British Columbia are limited to those discussed in Section 6.1 and shown in Table 6.1. On this basis, KPL believes these standards ignore several key items that could drastically increase or decrease ramping guidelines from river to river. Some of these items have already been discussed in previous sections of this report, but will be reiterated below.
1. River geomorphology. Fish habitat and river hydraulics are primarily governed by river geomorphology, including river slope, substrate type and size, cross-section geometry, and bed activity. Rivers with different geomorphologic conditions would be affected differently by the same ramping rate, and thus ramping rate determination should differ from river to river. The current ramping standards in BC specify a maximum rate of change of stage, which has no significance without determining geomorphologic conditions at critical sites throughout a given river reach.
2. River users. Should a river be used for recreational purposes such as rafting, fishing, whitewater kayaking or swimming, a proponent should consider the potential dangers associated with flow ramping on these parties.
3. Types of aquatic life present. The quantity and diversity of aquatic species can vary vastly in rivers throughout the province. As the current standards make no mention of the types of aquatic life, rivers with rich aquatic resources or endangered species are subject to the same numerical standards as rivers with little aquatic life.
4. Time of year. The current flow ramping standards for BC include ramping rate values for the maximum allowable rate of change of stage for different periods throughout the year. This is an effective way of accounting for variable aquatic behaviour associated with the different life stages of fish present in streams throughout different seasons.
5. Time of day. The current flow ramping standards currently include day-time and night-time standards to account for the different behavioural patterns of fish during these times. This is an effective way of accounting for the diurnal behavioural patterns of fish.
6. Ramping-up or ramping-down. In natural systems, the rising limb of a hydrograph is consistently steeper than the falling limb. The current standards provide only a single rate of change of stage standard for both up-ramping and down-ramping, and therefore do not consider that natural systems are accustomed to higher up-ramping rates than down-ramping rates.
7. River lag time. The river lag time has a significant effect on the stream’s response to plant start-up or shutdown (see Section 2.2.1and Figure 2.3). The current standards show no evidence of considering river lag time in their determination.
19 of 32 VA103-79/2-1 Revision 0 June 15, 2005
Knight Piésold C O N S U L T I N G
8. Natural flow attenuation. Natural streams attenuate or dampen flow ramping due to the local effects of small pools, side channels, change in river cross-section, instream and channel obstructions, and channel roughness. Therefore, a ramping rate measured in the penstock may be significantly dampened when measured in the natural watercourse. The effects of flow attenuation further emphasize the need to identify critical sites in a given river where ramping effects are expected to be highest. As the current standards do not refer to any critical site locations, the effects of natural flow attenuation are not taken into consideration.
9. Flow regime (high flow or low flow). The stream’s response to a ramping rate is directly related to the flow quantity in the creek before ramping begins. Low flows tend to yield longer lag times than high flows, because the stream has an increased capacity to attenuate changes in flow. For this reason, ramping rates can be detrimental to a greater or lesser degree depending on the flow in the creek prior to beginning ramping. No consideration to the flow regime currently exists in the generic numerical standards.
10. Natural Flow Changes. The current standards fail to consider the natural flow regime in a creek. In smaller catchments, there can be a rapid streamflow response to precipitation events, causing the rate of natural flow changes to exceed the generic numerical standards. In this case, less stringent ramping standards may be more appropriate, as the ecosystems supported by the river have become accustomed to those naturally high flow changes. On the opposite side of the spectrum, large catchments, or catchments with natural lakes may exhibit a damped streamflow response. It is possible that rates of natural flow changes never exceed some of the generic numerical standards, and as such, more stringent standards may be more appropriate.
11. Guidance to proponents. There is currently little documentation available regarding the background for the current ramping criteria. Written documentation on the reasoning for ramping rate standards, and the methodology used to determine them, could help proponents mitigate potential impacts earlier in the design process. This will also streamline the ramping rate derivation process.
It is KPL’s belief that the above-mentioned factors that fail to be addressed by the current flow ramping framework are an integral part of any flow ramping regulation, standard or protocol. Having a ramping rate standard or protocol that fails to incorporate these important factors defeats the purpose of having the standard (or protocol) in the first place, especially when neglecting these factors can be to the detriment of aquatic life and habitat, the two key components that Fisheries and Oceans Canada aims to protect.
20 of 32 VA103-79/2-1 Revision 0 June 15, 2005
Knight Piésold C O N S U L T I N G
SECTION 8.0 - RECOMMENDATIONS
Section 6.3 gave a succinct description of the ramping rate derivation protocol for Washington State, under the Washington State Department of Fish and Wildlife. This review has identified this protocol to be thorough, given the current understanding of the effects of flow ramping on Salmonids and other aquatic organisms. It is therefore recommended to use such a protocol as a model for British Columbia, with some slight modifications. These modifications will attempt to create a protocol that encompasses all critical aspects of flow ramping, and provide Fisheries and Oceans Canada with the means to determine, with confidence, site-specific flow ramping criteria for run-of-river hydroelectric developments in British Columbia. The key steps that are recommended to be included in the protocol are described below.
1. Identification of critical sites. Critical sites are most commonly identified as (though are not limited to) sites where juvenile fish are likely to be stranded in the result of stage decrease. This can occur where the river cross-section has a relatively flat slope, typically at a gravel bar or sand bar. Other components of critical sites include side channels or pools, which may be isolated due to stage decrease. The proponent should identify potential critical sites both within the bypass reach and downstream from the tailrace location. Exactly how far downstream critical sites should be identified cannot easily be defined. This boundary should be located far enough downstream, as to ensure that no sites further downstream suffer a higher degree of detriment due to ramping. Following preliminary critical site selection, Fisheries and Oceans Canada personnel should be notified for approval.
2. Identification of aquatic species at risk at critical sites. Fisheries studies are currently
required as a part of the water license application process in British Columbia. These studies typically identify the type of aquatic species present in the river under consideration. The results from these studies can be used to catalogue the species present, as well as those that may have an elevated risk to flow ramping.
3. Determination of stage discharge relationship at critical sites. It is recommended that the
proponent determine a stage-discharge relationship at each critical site. Stage-discharge measurements should identify critical flows, such as threshold depths that may cause trapping and/or stranding in side channels, pools or gravel/sand bars. Stage-discharge relationships will provide a basis for ramping rates by showing what change in depth is produced from what stage in flow.
4. Determination of lag time in reach of interest for various flows. The river lag time, as well
as travel times from the intake/tailrace to any given critical site can be determined through dye tracing. It is recommended that dye studies be conducted over a range of flows to evaluate the effects of discharge on travel time. These will provide a preliminary estimate of necessary duration of flow continuation at the powerhouse.
5. Determination of channel attenuation at different flows. Channel attenuation can be
determined through an analysis of streamflow data, where more than one flow gauge
21 of 32 VA103-79/2-1 Revision 0 June 15, 2005
Knight Piésold C O N S U L T I N G
location exists on a creek, or by numerical modelling. The results of this analysis would ultimately determine a flow routing relationship (or mathematical function) that, when applied to an upstream hydrograph, will predict the downstream hydrograph. This information can be used to determine what ramping rate can be expected at a particular site in the watercourse, resulting from a known ramping rate in the penstock.
6. Determination of natural flow change rates. The determination of natural flow change
rates can be easily computed with streamflow data that has been obtained for the river under consideration. Maximum natural flow change rates (both up-ramping and down-ramping) should be determined on a seasonal and diurnal basis to determine the fluctuations the natural ecosystem has become accustomed to. Maximum natural flow change rates should be computed on several different time intervals such as on minute, hourly and daily time steps. Further, the frequency at which these ramping rates occur should be determined, and compared to the projected magnitude and frequency of induced ramping rates. This type of analysis will help developers and operators develop a ramping rate schedule that best matches the natural flow variability of the river.
7. Derive interim standards. The data obtained from the investigations mentioned above,
should be the basis for site-specific interim ramping rate recommendations provided by the proponent, subject to consultation and review by Fisheries and Oceans Canada. These standards may be structured in a similar way to the current generic standards matrix (see Table 6.1). It is recommended however that this standard matrix include criteria for the flow rate in the natural watercourse prior to beginning ramping, as well as different criteria for up-ramping versus down-ramping.
8. Test ramping and standard verification. If necessary, test ramps should be conducted to
determine flow and stage changes at critical sites, after facility construction at the discretion of Fisheries and Oceans Canada. Test ramps would be the basis for verifying the validity of the interim ramping rate recommendations, and eventually the final operational ramping rates upon final approval from Fisheries and Oceans Canada.
9. Protocol documentation. Should a new protocol be created, it is recommended that
documentation clearly indicating the proponents’ requirements in a clear step-by-step guide are created. This documentation should be made readily available to proponents such that they can be made aware of the protocol in the early stages of their project development. This will not only help the proponent make better decisions regarding a project’s design, it will likely also aid in streamlining ramping rate derivation from conception to approval.
KPL also recommends that evaluation criteria be developed by Fisheries and Ocean Canada so that the approval/rejection process has a large degree of transparency. Transparent evaluation criteria will allow proponents to highlight study components that are critical to the evaluation process, therefore streamlining the review process, and reducing the potential for the completion of insufficient studies.
22 of 32 VA103-79/2-1 Revision 0 June 15, 2005
Knight Piésold C O N S U L T I N G
SECTION 9.0 - REFERENCES
1. Hunter, Mark A. Hydropower Flow Fluctuations and Salmonids: A Review of the Biological Effects, Mechanical Causes, and Options for Mitigation. State of Washington Department of Fisheries, September 1992.
2. Washington State Department of Fish and Wildlife. Instream Flow Study Guidelines.
December 1996. 3. Ontario Ministry of Natural Resources. Water Management Planning Aquatic
Ecosystems Guidelines. January 2003. <http://www.owa.ca/AEG_Jan2003.pdf> Accessed April 10, 2005.
4. Metcalfe RA, Smakhtin VY, and Krezek C, Simulating and Characterising Natural Flow
Regimes. Waterpower Project Science Transfer Report 1.0, Ontario Ministry of Natural Resources. 2003. <http://www.trentu.ca/wscproject/wpscinfo/pdfs/WPSTR_1_0.pdf> Accessed April 10, 2005.
5. Ontario Ministry of Natural Resources. The Waterpower Science Strategy:
Understanding Stream Processes and the Effects of Altered Flow Regimes on Riverine Ecosystems. Version 1.0. <http://www.trentu.ca/wscproject/wpscinfo/pdfs/strat1.pdf> Accessed April 10, 2005.
6. Richter BD, Baumgartner JV, Wigington R, and Braun DP. How much water does a river
need? Blackwell Publishing Ltd. 1997. Freshwater Biology. 37:231-249. 7. Richter BD, Baumgartner JV, Powell J and Braun DP. A Method for Assessing
Hydrologic Alteration within Ecosystems. Conservation Biology August 1996; 10(4):1163-1174.
8. Canadian Electricity Association. Considering Fish and Fish Habitat in Existing
Hydroelectric Operations and Maintenance: Electricity Industry Practices July 2001. <http://www.canelect.ca/english/Pdfs/RevCEA.pdf>. Accessed May 2, 2005.
9. Cascade Heritage Power Park Project Committee. Project Report Specifications for the
Powerhouse Energy Corp. Cascade Heritage Power Park Project. January 6, 2000. 10. Quadra Planning Consultants Ltd., Regional Consulting Ltd., and Linda Nolan.
Preliminary Review of Fisheries Conservation Gains within BC Hydro’s Water Use Planning Process. May 2004.
11. Tom G. Brown. Floodplains, flooding, and salmon rearing habitats in British Columbia: A
review. Fisheries and Oceans Canada. 2002.
23 of 32 VA103-79/2-1 Revision 0 June 15, 2005
Knight Piésold C O N S U L T I N G
12. Entrix, Inc. Russian River Biological Assessment, Appendix C. September 29, 2004. <http://www.spn.usace.army.mil/ets/rrsection7/Appendix_C.pdf>. Accessed May 3, 2005.
13. Two-dimensional fish habitat modelling for assessing instream flow requirements.
Integrated water resources management. Selected papers from an International Symposium on Integrated Water Resources Management, University of California, Davis, California, USA, April 2000.
14. ACOE 1999. Work to date on the development of the VARQ flood control operation at
Libby Dam and Hungry Horse Dam. U.S. Army Corps of Engineers, Northwestern Division, North Pacific Region, Portland, OR. 83 pp. plus appendices.
15. Acreman M, Dunbar MJ. Defining environmental river flow requirements - a review.
Hydrology and Earth System Sciences October 2004;8(5):861-876. 16. Allan JD. Stream ecology: structure and function of running waters. London; New York:
Chapman & Hall; 1995. 17. Almodóvar A, G.N. G. Effects of a small hydropower station upon brown trout Salmo
trutta L. in the River Hoz Seca (Tagus basin, Spain) one year after regulation. Regulated Rivers: Research & Management September/October 1999:477-484.
18. Arthington AH, Pusey BJ. Flow restoration and protection in Australian rivers. River
Research and Applications September - December 2003; 19(5-6):377-395. 19. Arthington AH, Rall JL, Kennard MJ, Pusey BJ. Environmental flow requirements of fish
in Lesotho rivers using the DRIFT methodology. River Research and Applications September - December 2003;19(5-6):641-666.
20. Bain, MB, Finn, JT, Booke, HE. Streamflow regulation and fish community structure.
Ecology April 1988; 69(2):382-392. 21. Baran P, Delacoste M, Dauba F, Lascaux JM, Belaud A. Effects of reduced flow on
brown trout (Salmo trutta L.) populations downstream dams in French Pyrenees. Regulated Rivers: Research & Management 1995;10(3-4):347-361.
22. Barrella W, Petrere Jr M. Fish community alterations due to pollution and damming in
Tietê and Paranapanema rivers (Brazil). River Research and Applications January/February 2003;19(1):59-76.
23. Belyaev LS, Syrov YP. Optimization Of The Stream Flow Regulation By The
Hydroelectric Stations Reservoirs With The Help Of Mathematical Models. 13th Congress International Association Hydraulic Research, Proceedings, August – September 1969;1:17-23.
24 of 32 VA103-79/2-1 Revision 0 June 15, 2005
Knight Piésold C O N S U L T I N G
24. Bernardo JM, Alves MH. New perspectives for ecological flow determination in semi-arid regions: a preliminary approach. Regulated Rivers: Research & Management January - June 1999;15(1-3):221-229.
25. Bratrich C, Truffer B, Jorde K, Markard J, Meier W, Peter A, Schneider M, Wehrli B.
Green hydropower: a new assessment procedure for river management. River Research and Applications December 2004;20(7):865-882.
26. Brown LR, Ford T. Effects of flow on the fish communities of a regulated California river:
Implications for managing native fishes. River Research and Applications July - August 2002; 18(4):331-342.
27. Bunn SE, Arthington AH. Basic principles and ecological consequences of altered flow
regimes for aquatic biodiversity. Environmental Management 2002;30(4):492-507. 28. Bunt CM, Cooke SJ, Katopodis C, Mckinley RS. Movement and summer habitat of brown
trout (Salmo trutta) below a pulsed discharge hydroelectric generating station. Regulated Rivers: Research & Management September/October 1999;15(5):395-403.
29. Canadian Electrical Association. Biological Mitigative Measures for Canadian Hydro
Facilities. Canadian Electrical Association, No. 156 G 315.237.: Acres Consulting Services Ltd; 1984.
30. Cardwell H, Jager HI, Sale MJ. Designing instream flows to satisfy fish and human water
needs. Journal of Water Resources Planning and Management - ASCE October 1996;122(5):356-363.
31. Castleberry DT, J.C. Cech, D.C. Erman, D. Hankin, M. Healey, G.M. Kondolf, M. Mangel,
M. Mohr, P.B. Moyle, J. Nielsen, T.P. Speed, and J.G. Williams. Uncertainty and instream flow standards. Fisheries 1996.;21(8):20-21.
32. Cerný J, Copp GH, Kovác R, Gozlan R, Vilizzi L. Initial impact of the Gabccaroníkovo
hydroelectric scheme on the species richness and composition of 0+ fish assemblages in the Slovak flood plain, River Danube. River Research and Applications December 2003;19(7):749-766.
33. Collier M, Webb RH, Schmidt JC. Dams and rivers: a primer on the downstream effects
of dams. Tucson, Ariz. Denver, CO: U.S. Dept. of the Interior U.S. Geological Survey, Branch of Information Services [distributor]; 1996.
34. Cowell CM, Stoudt RT. Dam-induced modifications to upper Allegheny River streamflow
patterns and their biodiversity implications. Journal of the American Water Resources Association February 2002; 38(1):187-196.
25 of 32 VA103-79/2-1 Revision 0 June 15, 2005
Knight Piésold C O N S U L T I N G
35. Cumming GS. The impact of low-head dams on fish species richness in Wisconsin, USA. Ecological Applications October 2004;14(5):1495-1506.
36. Cushman RM. Review of ecological effects of rapidly varying flows downstream of
hydroelectric facilities. North American Journal of Fisheries Management; 5:330-339. 37. Driver PD, Harris JH, Closs GP, Koen TB. Effects of flow regulation on carp (Cyprinus
carpio L.) recruitment in the Murray-Darling Basin, Australia. River Research and Applications February - March 2005;21(2-3):327-335.
38. Faler MP, Miller LM, Welke KI. Effects of variation in flow on distributions of northern
squawfish in the Columbia River below McNary Dam. North American Journal of Fisheries Management 1988;8(1):30-35.
39. Flannery MS, Peebles EB, Montgomery RT. A percent-of-flow approach for managing
reductions of freshwater inflows from unimpounded rivers to Southwest Florida estuaries. Estuaries December 2002; 25(6B):1318-1332.
40. Flodmark LE, Urke HA, Halleraker JH, Arnekleiv JV, Vollestad LA, Poleo AB. Cortisol and
glucose responses in juvenile brown trout subjected to a fluctuating flow regime in an artificial stream. Journal of Fish Biology 2002; 60(1): 238-248.
41. Fraley, J.J., B. Marotz, J. Decker-Hess, W. Beattie, and R. Zubik. 1989. Mitigation,
compensation, and future protection for fish populations affected by hydropower development in the upper Columbia system, Montana, USA. Regulated Rivers: Research and Management 3:3-18.
42. Gandolfi C, Guariso G, Togni D. Optimal flow allocation in the Zambezi River system.
Water Resources Management 1997; 11(5):377-393. 43. Gehrke PC, Astles KL, Harris JH. Within-catchment effects of flow alteration on fish
assemblages in the Hawkesbury-Nepean River system, Australia. Regulated Rivers: Research & Management January - June 1999;15(1-3):181-198.
44. Gehrke PC, Harris JH. Regional-scale effects of flow regulation on lowland riverine fish
communities in New South Wales, Australia. Regulated Rivers: Research & Management July - October 2001; 17(4-5): 369-391.
45. Gibbins CN, Acornley RM. Salmonid habitat modelling studies and their contribution to
the development of an ecologically acceptable release policy for Kielder Reservoir, North-east England. Regulated Rivers: Research & Management May/June 2000; 16(3): 203-224.
26 of 32 VA103-79/2-1 Revision 0 June 15, 2005
Knight Piésold C O N S U L T I N G
46. Gibbins CN, Soulsby C, Jeffries MJ, Acornley R. Developing ecologically acceptable river flow regimes: a case study of Kielder reservoir and the Kielder water transfer system. Fisheries Management & Ecology; 8(6):463.
47. Government of Australia Environmental Flow Guidelines, May 27, 1999.
<http://www.environment.act.gov.au/files/environmentalflowguidelines.pdf>. Accessed May 2, 2005.
48. Grange N, Whitfield AK, De Villiers CJ, Allanson BR. The response of two South African
east coast estuaries to altered river flow regimes. Aquatic Conservation: Marine and Freshwater Ecosystems May/June 2000; 10(3):155-177.
49. Halleraker JH, Saltveit SJ, Harby A, Arnekleiv JV, Fjeldstad HP, Kohler B. Factors
influencing stranding of wild juvenile brown trout (Salmo trutta) during rapid and frequent flow decreases in an artificial stream.
50. Halls AS, Welcomme RL. Dynamics of river fish populations in response to hydrological
conditions: a simulation study. River Research and Applications 15 December 2004; 20(8):985-1000.
51. Harpman DA. Glen Canyon Dam, Colorado River Storage Project, Arizona. The Short-
Run Economic Cost of Environmental Constraints on Hydropower Operations. Bureau of Reclamation, Denver, CO. Economics Group; 1997.
52. Harpman DA. Assessing the Short-Run Economic Cost of Environmental Constraints on
Hydropower Operations at Glen Canyon Dam. Land Economics 1999; 75(3):390-401. 53. Hill MT, Platts WS, Beschta RB. Ecological and geomorphological concepts for instream
flow and out-of-channel flow requirements. Rivers 1991; 2(3):198-210. 54. ISAB. 1997b. Ecological impacts of the flow provisions of the Biological Opinion for
endangered Snake River salmon on resident fishes in the Hungry Horse, and Libby systems in Montana, Idaho, and British Columbia. Independent Scientific Advisory Board. Report 97-3 for the Northwest Power Planning Council and National Marine Fisheries Service. Portland, OR.
55. Jacques Whitford Environment AIL, and T. R. Payne and Associates. Evaluation of
Instream Flow Needs Assessment Methodologies in Newfoundland. Report to the Canada - Newfoundland Agreement Reporting Water Resource Management and the Green Plan, Habitat Action Plan. 1996.
56. Jarvekulg R. Influence of dams to the fish fauna of rivers. Frey T, editor. Tartu: IM Saare;
2003.
27 of 32 VA103-79/2-1 Revision 0 June 15, 2005
Knight Piésold C O N S U L T I N G
57. Jowett IG. Instream flow methods: a comparison of approaches. Regulated Rivers: Research and Management 1997; 13:115-127.
58. Kondolf G, M., Larsen EW, Williams JG. Measuring and modeling the hydraulic
environment for assessing instream flows. North American Journal of Fisheries Management 2000; 20(4):1016-1028.
59. Lamb BL. “Quantifying instream flows: matching policy and technology.” In
L.J. MacDonnell, T.A. Rice, and S.J. Shupe (eds.), Instream Flow Protection in the West. Denver, CO: Natural Resources Law Centre, University of Colorado School of Law.; 1989.
60. Lamond BF, Boukhtouta A. Neural Approximation for the Optimal Control of a Hydroplant
with Random Inflows and Concave Revenues. Journal of Energy Engineering;131(1):72. 61. Lewis AF, Mitchell AC, Prewitt CM. Evaluation of the effectiveness of water release as a
mitigation to protect fish habitat. Report prepared for the Canadian Electrical Association by Triton Environmental Consultants Ltd. and E.A. Engineering Science and Technology. CEA Report 9118 G 878. Montreal, Canada, TECL.; 1994.
62. Lytle DA, Poff NL. Adaptation to natural flow regimes. Trends in Ecology and Evolution
February 2004; 19(2):94-100. 63. Mann CC, Plummer, Mark L. Ecology: Can Science Rescue Salmon? Science; 289:716-
719. 64. Marchetti MP, Moyle PB. Effects of flow regime on fish assemblages in a regulated
California stream. Ecological Applications April 2001;11(2):530-539. 65. Marotz BL, Gustafson D, Althen C, Lonon B. Integrated operational rule curves for
Montana reservoirs and application for other Columbia River storage projects. P.O. Box 755040 205 O'Neill Bldg. Fairbanks AK 99775-5040, [URL http //www.uaf.edu/seagrant/]: University of Alaska Sea Grant; 1999.
66. Marotz, B. and C. Muhlfeld. 2000. Evaluation of minimum flow requirements in the South
Fork Flathead River downstream of Hungry Horse Dam, Montana. Montana Wetted Perimeter Method. Montana Fish, Wildlife & Parks, Kalispell, Montana. Prepared for Bonneville Power Administration. 28 pp.
67. McCully P. Silenced rivers: the ecology and politics of large dams. London; New
YorkNew York: Zed Books; Distributed in the USA exclusively by Palgrave; 2001. 68. Watercourse alterations: technical guidelines -- Rev [microform.]. New Brunswick.
Environmental Planning & Sciences Branch, Canada. Dept. of Fisheries & Oceans. Fredericton: Dept. of the Environment, Environmental Planning & Sciences Branch; 1994.
28 of 32 VA103-79/2-1 Revision 0 June 15, 2005
Knight Piésold C O N S U L T I N G
69. Oliveira JM, Ferreira MT, Pinheiro AN, Bochechas JH. A simple method for assessing
minimum flows in regulated rivers: the case of sea lamprey reproduction. Aquatic Conservation: Marine and Freshwater Ecosystems September/October 2004; 14(5):481-489.
70. PacifiCorp. Evaluation of Ramping Effects on Fish Downstream of Link Dam, Keno Dam,
J.C. Boyle Dam, J.C. Boyle Powerhouse, and Copco No. 2 Dam. Final Working Draft. Klamath Hydroelectric Project Study Plans (FERC Project No. 2082) August 2003. < http://www.pacificorp.com/File/File22039.pdf>
71. Parasiewicz P, Schmutz S, Moog O. The effect of managed hydropower peaking on the
physical habitat, benthos and fish fauna in the River Bregenzerach in Austria. Fisheries Management and Ecology 1998;5(5):403-417.
72. Paragamian, V. L. 2000. The effect of variable flows on burbot spawning migrations in the
Kootenai River, Idaho, USA, and Kootenay Lake, British Columbia, Canada, after construction of the Libby Dam. Pages 111-123 in V. L. Paragamian and D. W. Willis, editors. Burbot: biology, ecology, and management. American Fisheries Society, Fisheries Management Section, Publication Number 1, Bethesda.
73. Poff, N, LeRoy, AJD. The Natural Flow Regime: A Paradigm for River Conservation and
Restoration. Bioscience 1997; 47(11):769-784. 74. Pollino CA, Feehan P, Grace MR, Harr BT. Fish communities and habitat changes in the
highly modified Goulburn Catchment, Victoria, Australia. Marine and Freshwater Research 2004; 55(8):769-780.
75. Propst D.L., Gido KB. Responses of native and nonnative fishes to natural flow regime
mimicry in the San Juan River. Transactions of the American Fisheries Society July 2004; 133(4):922-931.
76. Reiser DW, Wesche TA, Estes C. Status of instream flow legislation and practices in
North America. Fisheries (Bethesda) 1989; 14(2):22-29. 77. Resh VH, and nine others. The role of disturbance in stream ecology. The North
American Benthological Society 1988; 7(4):433-455. 78. Richter BD, Baumgartner JV, Braun DP, Powell J. A spatial assessment of hydrologic
alteration within a river network. Regulated River: Research and Management July - August 1998; 14:329-40.
79. Salman SMA. Sharing Rivers for Peace, Development, and Security. Analysis of the
Recommendations of the World Commission on Dams. Water International 2001; 26(2):283-288.
29 of 32 VA103-79/2-1 Revision 0 June 15, 2005
Knight Piésold C O N S U L T I N G
80. Saltveit SJ, Halleraker JH, Arnekleiv JV, Harby A. Field experiments on stranding in
juvenile atlantic salmon (Salmo salar) and brown trout (Salmo trutta) during rapid flow decreases caused by hydropeaking. Regulated Rivers: Research & Management July - October 2001; 17(4-5):609-622.
81. Scruton DA, Ledrew LJ. A retrospective assessment of the flow regulation of the West
Salmon River, Newfoundland, Canada. Fisheries Management and Ecology 1997; 4(6):467-480.
82. Scruton DA, Ollerhead LMN, Clarke KD, Pennell C, Alfredsen K, Harby A, Kelley D. The
behavioural response of juvenile Atlantic salmon (Salmo salar) and brook trout (Salvelinus fontinalis) to experimental hydropeaking on a Newfoundland (Canada) river.
83. Shiau JT, Wu F. Assessment of hydrologic alterations caused by Chi-Chi diversion weir
in Chou-Shui Creek, Taiwan: opportunities for restoring natural flow conditions. River Research and Applications July 2004; 20(4):401-412.
84. Shiau JT, Wu FC. Feasible diversion and instream flow release using range of variability
approach. Journal of Water Resources Planning and Management - ASCE September - October 2004; 130(5):395-404.
85. Skarr, D., J. DeShazer, L.Garrow, T. Ostrowski and B. Thornberg. 1996. Quantification of
Libby Reservoir levels needed to enhance reservoir fisheries. Investigations of fish entrainment through Libby dam, 1990-1994. Final Report. Montana Department of Fish, Wildlife and Parks - Region 1. Prepared for Bonneville Power Administration. Project Number 83-467.
86. Stalnaker C, Lamb BL, Henriksen J, Bovee K, Bartholow J. The Instream Flow
Incremental Methodology: A primer for IFIM. US Department of the Interior, National Biologic Service, Biological Report 29. 1995.
87. Stanford JA, et al. A general protocol for restoration of regulated rivers. Regulated River:
Research and Management 1996; 12:391-413. 88. Stewardson MJ, Gippel CJ. Incorporating flow variability into environmental flow regimes
using the flow events method. River Research and Applications September - December 2003; 19(5-6):459-472.
89. Svensson BS. Hydropower and instream flow requirements for fish in Sweden. Fisheries
Management and Ecology 2000; 7(1-2):145-155. 90. Tennant DL. Instream flow regimes for fish, wildlife, recreation, and related environmental
resources. In J.F. Osborn and C.H. Allman (eds.). Proceedings of the Symposium and
30 of 32 VA103-79/2-1 Revision 0 June 15, 2005
Knight Piésold C O N S U L T I N G
Specialty Conference on Instream Flow Needs.; 1976; Bethesda, Maryland. American Fisheries Society.
91. Tharme RE. A global perspective on environmental flow assessment: emerging trends in
the development and application of environmental flow methodologies for rivers. River Research and Applications September - December 2003; 19(5-6):397-441.
92. Turgeon A. Optimal daily operation of reservoirs subject to probabilistic flood constraints.
25 Bridge St. Billerica MA 01821: Computational Mechanics Inc.; 2003. 93. Van Winkle W, Coutant CC, Jager HI, Mattice JS, Orth DJ, Otto RG, Railsback SF, Sale
MJ. Uncertainty and instream flow standards: Perspectives based on hydropower research and assessment. Fisheries 1997; 22(7):21-22.
94. Vehanen T, Bjerke PL, Heggenes J, Huusko A, Maki-Petays A. Effect of fluctuating flow
and temperature on cover type selection and behaviour by juvenile brown trout in artificial flumes. Journal of Fish Biology 2000; 56(4):923-937.
95. Weisberg SB, Burton WH. Enhancement of fish feeding and growth after an increase in
minimum flow below the Conowingo Dam. North American Journal of Fisheries Management 1993; 13(1):103-109.
96. Whiting PJ. Streamflow necessary for environmental maintenance. Annual Review of
Earth and Planetary Sciences 2002; 30:181-206. 97. Whittaker D, Shelby B. Managed flow regimes and resource values: Traditional versus
alternative strategies. Rivers 2000; 7(3):233-244. 98. Wood AJ, Wollenberg BF. Power generation, operation, and control. New York: J. Wiley
& Sons; 1996. 99. Wright, A. 1996. Review of Columbia River operating criteria. Report to National Marine
Fisheries Service and Bonneville Power Administration by Al Wright Consulting, Portland, OR.
100. Young LM. Fish Habitat and Flow: What's the Connection? Commonwealth of
Pennsylvania, Fish and Boat Commission <http://sites.state.pa.us/PA_Exec/Fish_Boat/anglerboater/2001/ma2001/habtflow.htm>. Accessed May 2, 2005.
101. Forrest W. Olson, CH2M HILL. Downramping Regime for Power Operation to Minimize
Stranding of Salmonid Fry in the Sultan River Henry M. Jackson Hydroelectric Project Snohomish County, Washington FERC No. 2157. October 1990. <http://www.snopud.com/Content/External/Documents/relicensing/Fish/DownrampRegimeRptOct1990.pdf>. Accessed May 3, 2005.

31 of 32 VA103-79/2-1 Revision 0 June 15, 2005
Knight Piésold C O N S U L T I N G
102. California Department of Water Resources, Division of Environmental Services. Redd
Dewatering and Juvenile Steelhead and Chinook Salmon Stranding in the Lower Feather River, 2002-2003. July 17, 2003. <http://orovillerelicensing.water.ca.gov/pdf_docs/F10_Task_3C_interim_report.pdf>. Accessed May 3, 2005.


M:\1\03\00079\02\A\Data\[RampingGuidelines.xls]Table 6.3 rA Rev'd Mar/24/05
Time of Year Life Stage History Day Ramp Rate Night Ramp Rate
April 1 - July 31 Fry Emergence 0 - 2.5 cm/hr 2.5 - 5 cm/hr
August 1 - October 31 Rearing until temp < 5 C 0 - 2.5 cm/hr 5 - 10 cm/hr
November 1 - March 31 Winter Rearing 0 cm/hr 0 - 5 cm/hr
Notes:1) Ramp rate refers to change in stage.
SUMMARY OF BRITISH COLUMBIA RAMPING RATES STANDARDS
Print Jun/27/05 13:41:01
TABLE 6.1
FISHERIES AND OCEANS CANADAFLOW RAMPING STUDY
STUDY OF RAMPING RATES FOR HYDROELECTRIC DEVELOPMENTS
Rev 0 - Issued in Final
Knight PiésoldC O N S U L T I N G
Page 1 of 1
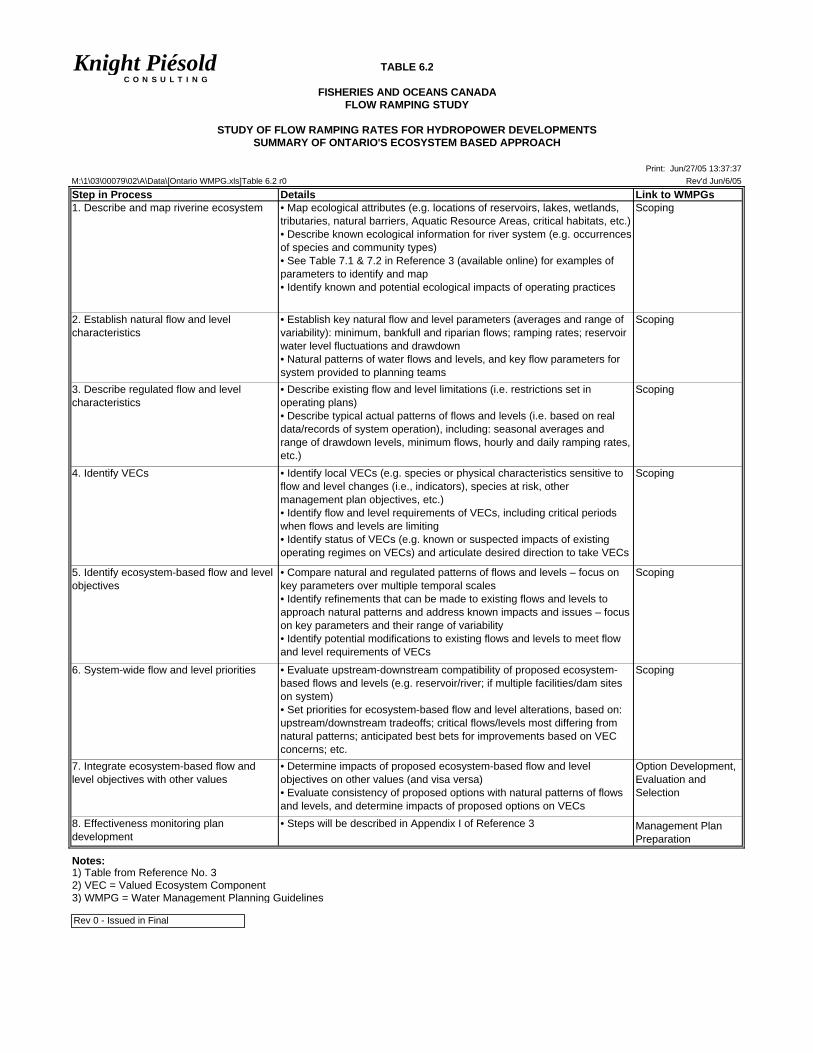
TABLE 6.2
FISHERIES AND OCEANS CANADAFLOW RAMPING STUDY
STUDY OF FLOW RAMPING RATES FOR HYDROPOWER DEVELOPMENTSSUMMARY OF ONTARIO'S ECOSYSTEM BASED APPROACH
Print: Jun/27/05 13:37:37M:\1\03\00079\02\A\Data\[Ontario WMPG.xls]Table 6.2 r0 Rev'd Jun/6/05
Step in Process Details Link to WMPGs1. Describe and map riverine ecosystem • Map ecological attributes (e.g. locations of reservoirs, lakes, wetlands,
tributaries, natural barriers, Aquatic Resource Areas, critical habitats, etc.)• Describe known ecological information for river system (e.g. occurrences of species and community types)• See Table 7.1 & 7.2 in Reference 3 (available online) for examples of parameters to identify and map• Identify known and potential ecological impacts of operating practices
Scoping
2. Establish natural flow and level characteristics
• Establish key natural flow and level parameters (averages and range of variability): minimum, bankfull and riparian flows; ramping rates; reservoir water level fluctuations and drawdown• Natural patterns of water flows and levels, and key flow parameters for system provided to planning teams
Scoping
3. Describe regulated flow and level characteristics
• Describe existing flow and level limitations (i.e. restrictions set in operating plans)• Describe typical actual patterns of flows and levels (i.e. based on real data/records of system operation), including: seasonal averages and range of drawdown levels, minimum flows, hourly and daily ramping rates, etc.)
Scoping
4. Identify VECs • Identify local VECs (e.g. species or physical characteristics sensitive to flow and level changes (i.e., indicators), species at risk, other management plan objectives, etc.)• Identify flow and level requirements of VECs, including critical periods when flows and levels are limiting• Identify status of VECs (e.g. known or suspected impacts of existing operating regimes on VECs) and articulate desired direction to take VECs
Scoping
5. Identify ecosystem-based flow and level objectives
• Compare natural and regulated patterns of flows and levels – focus on key parameters over multiple temporal scales• Identify refinements that can be made to existing flows and levels to approach natural patterns and address known impacts and issues – focus on key parameters and their range of variability• Identify potential modifications to existing flows and levels to meet flow and level requirements of VECs
Scoping
6. System-wide flow and level priorities • Evaluate upstream-downstream compatibility of proposed ecosystem-based flows and levels (e.g. reservoir/river; if multiple facilities/dam sites on system)• Set priorities for ecosystem-based flow and level alterations, based on: upstream/downstream tradeoffs; critical flows/levels most differing from natural patterns; anticipated best bets for improvements based on VEC concerns; etc.
Scoping
7. Integrate ecosystem-based flow and level objectives with other values
• Determine impacts of proposed ecosystem-based flow and level objectives on other values (and visa versa)• Evaluate consistency of proposed options with natural patterns of flows and levels, and determine impacts of proposed options on VECs
Option Development, Evaluation and Selection
8. Effectiveness monitoring plan development
• Steps will be described in Appendix I of Reference 3Draft Water Management Plan Preparation
Notes:1) Table from Reference No. 32) VEC = Valued Ecosystem Component3) WMPG = Water Management Planning Guidelines
Rev 0 - Issued in Final
Knight PiésoldC O N S U L T I N G

M:\1\03\00079\02\A\Data\[RampingGuidelines.xls]Table 6.3 rA Rev'd Mar/24/05
Time of Year Life Stage History Day Ramp Rate Night Ramp Rate
February 16 to June 15 Salmon Fry No Ramping 2 inches/hour
June 16 to October 31 Steelhead and Trout Fry 1 inch/hour 1 inch/hour
November 1 to February 15 Not Indicated in Standards 2 inches/hour 2 inches/hour
Notes:1) Ramp rate refers to change in stage.
SUMMARY OF WASHINGTON RAMPING RATES STANDARDS
Print Jun/27/05 13:41:01
TABLE 6.3
FISHERIES AND OCEANS CANADAFLOW RAMPING STUDY
STUDY OF RAMPING RATES FOR HYDROELECTRIC DEVELOPMENTS
Rev 0 - Issued in Final
Knight PiésoldC O N S U L T I N G
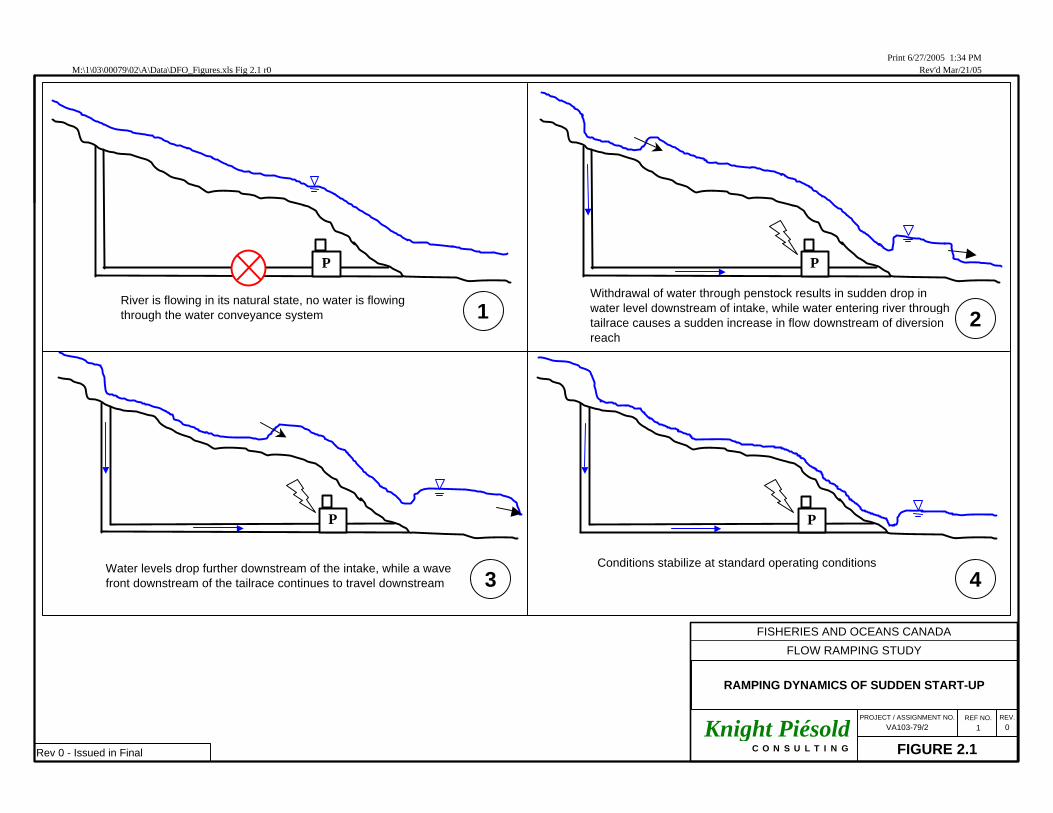
M:\1\03\00079\02\A\Data\DFO_Figures.xls Fig 2.1 r0Print 6/27/2005 1:34 PM
Rev'd Mar/21/05
Rev 0 - Issued in Final
RAMPING DYNAMICS OF SUDDEN START-UP
FIGURE 2.1
FISHERIES AND OCEANS CANADA
FLOW RAMPING STUDY
REV.
0 PROJECT / ASSIGNMENT NO.
VA103-79/2REF NO.
1 Knight Piésold C O N S U L T I N G
River is flowing in its natural state, no water is flowing through the water conveyance system
Withdrawal of water through penstock results in sudden drop in water level downstream of intake, while water entering river through tailrace causes a sudden increase in flow downstream of diversion reach
Water levels drop further downstream of the intake, while a wave front downstream of the tailrace continues to travel downstream
Conditions stabilize at standard operating conditions
P
1 2
3 4
P P
P
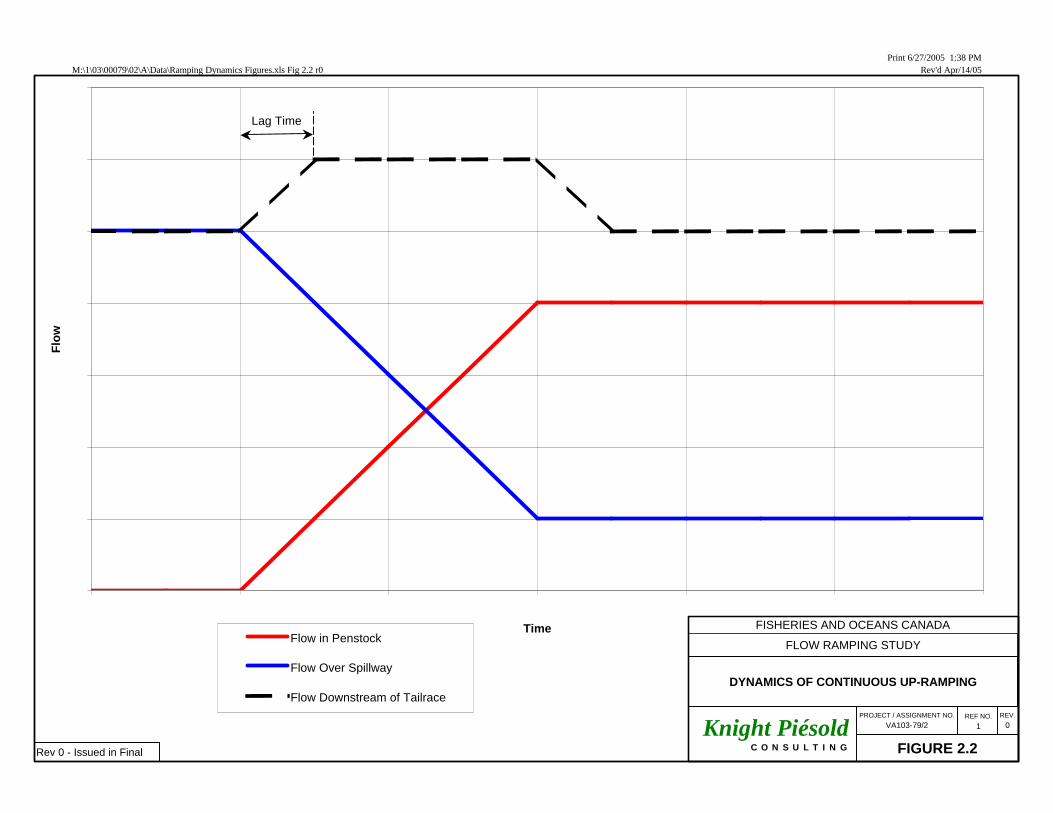
M:\1\03\00079\02\A\Data\Ramping Dynamics Figures.xls Fig 2.2 r0Print 6/27/2005 1:38 PM
Rev'd Apr/14/05
0
5
10
15
20
25
30
35
-1.0 0.0 1.0 2.0 3.0 4.0 5.0
Time
Flo
w
Flow in Penstock
Flow Over Spillway
Flow Downstream of Tailrace
Rev 0 - Issued in Final
DYNAMICS OF CONTINUOUS UP-RAMPING
FIGURE 2.2
FISHERIES AND OCEANS CANADA
FLOW RAMPING STUDY
REV.
0 PROJECT / ASSIGNMENT NO.
VA103-79/2REF NO.
1 Knight Piésold C O N S U L T I N G
Lag Time
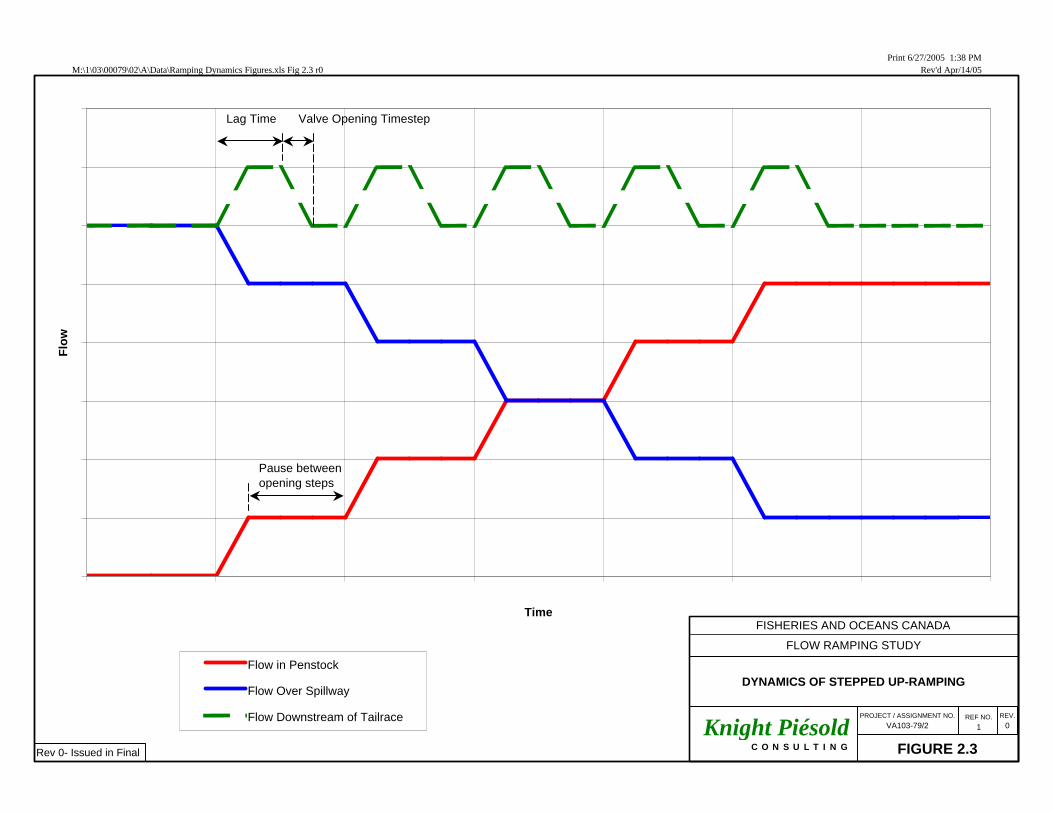
M:\1\03\00079\02\A\Data\Ramping Dynamics Figures.xls Fig 2.3 r0Print 6/27/2005 1:38 PM
Rev'd Apr/14/05
0
5
10
15
20
25
30
35
40
-1.0 0.0 1.0 2.0 3.0 4.0 5.0 6.0Time
Flo
w
Flow in Penstock
Flow Over Spillway
Flow Downstream of Tailrace
Rev 0- Issued in Final
DYNAMICS OF STEPPED UP-RAMPING
FIGURE 2.3
FISHERIES AND OCEANS CANADA
FLOW RAMPING STUDY
REV.
0 PROJECT / ASSIGNMENT NO.
VA103-79/2REF NO.
1 Knight Piésold C O N S U L T I N G
Lag Time Valve Opening Timestep
Pause between opening steps
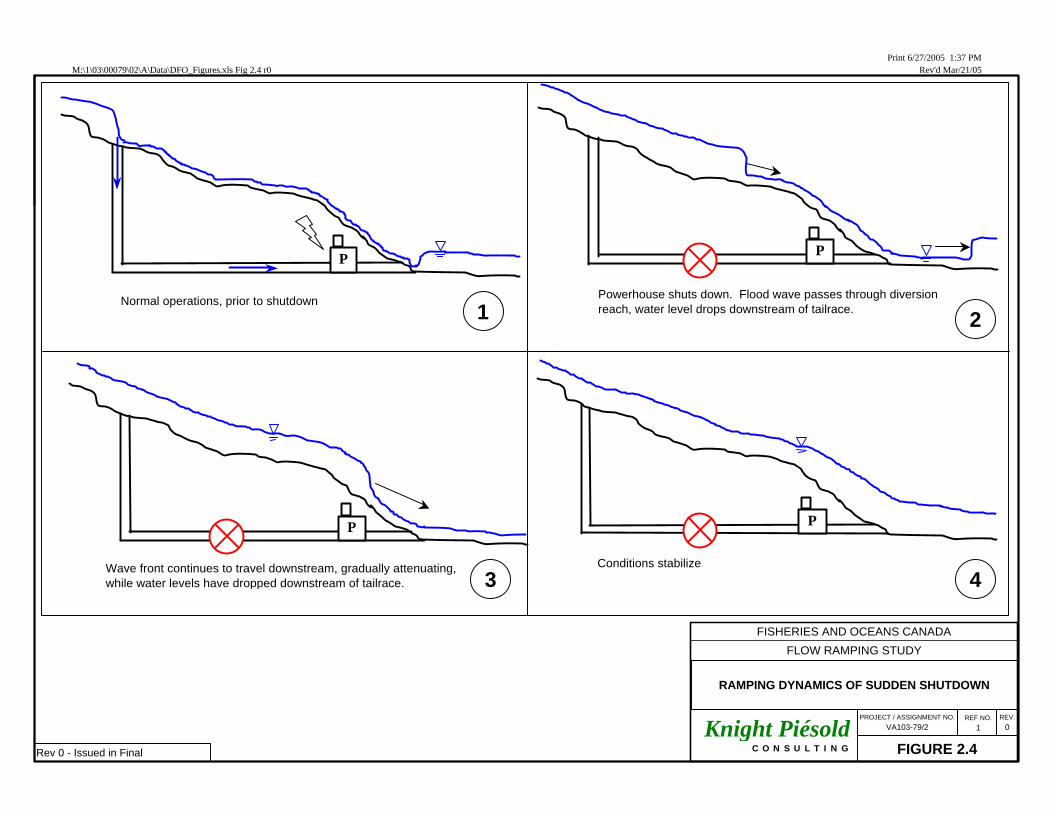
M:\1\03\00079\02\A\Data\DFO_Figures.xls Fig 2.4 r0Print 6/27/2005 1:37 PM
Rev'd Mar/21/05
Rev 0 - Issued in Final
RAMPING DYNAMICS OF SUDDEN SHUTDOWN
FIGURE 2.4
FISHERIES AND OCEANS CANADA
FLOW RAMPING STUDY
REV.
0 PROJECT / ASSIGNMENT NO.
VA103-79/2REF NO.
1 Knight Piésold C O N S U L T I N G
Normal operations, prior to shutdown Powerhouse shuts down. Flood wave passes through diversion reach, water level drops downstream of tailrace.
P
Wave front continues to travel downstream, gradually attenuating, while water levels have dropped downstream of tailrace.
Conditions stabilize
P P
P
1 2
3 4
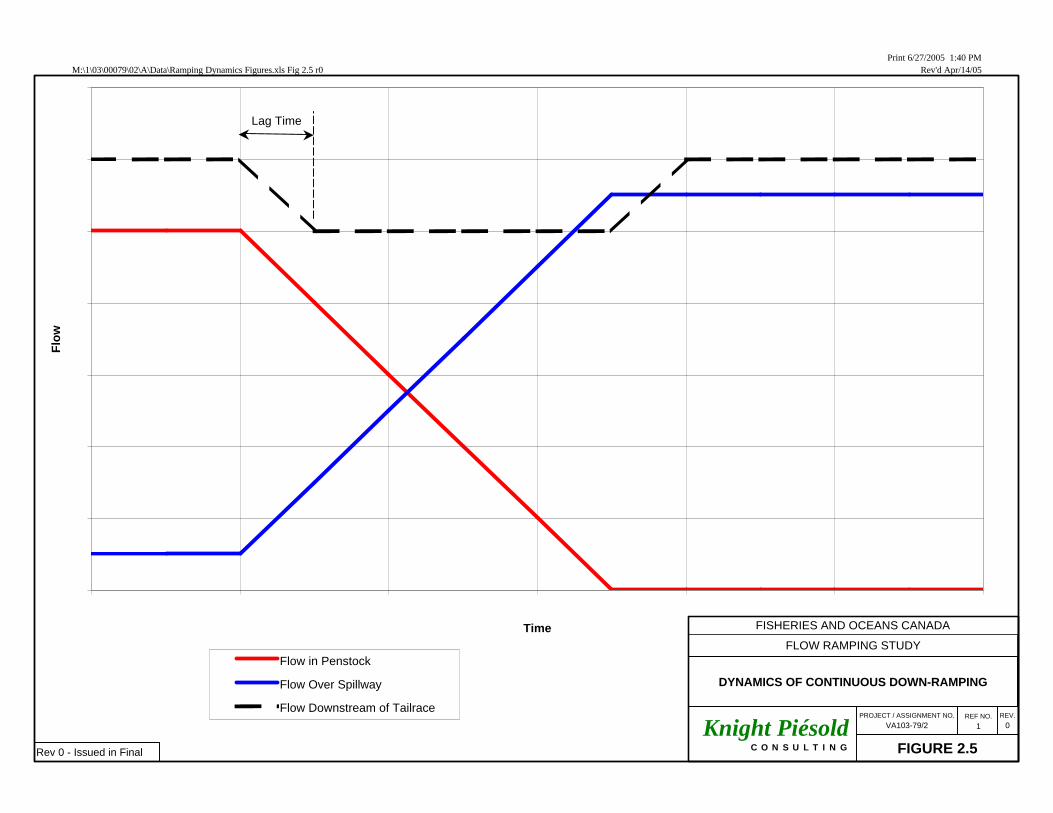
M:\1\03\00079\02\A\Data\Ramping Dynamics Figures.xls Fig 2.5 r0Print 6/27/2005 1:40 PM
Rev'd Apr/14/05
0
5
10
15
20
25
30
35
-1.0 0.0 1.0 2.0 3.0 4.0 5.0
Time
Flo
w
Flow in Penstock
Flow Over Spillway
Flow Downstream of Tailrace
Rev 0 - Issued in Final
DYNAMICS OF CONTINUOUS DOWN-RAMPING
FIGURE 2.5
FISHERIES AND OCEANS CANADA
FLOW RAMPING STUDY
REV.
0 PROJECT / ASSIGNMENT NO.
VA103-79/2REF NO.
1 Knight Piésold C O N S U L T I N G
Lag Time
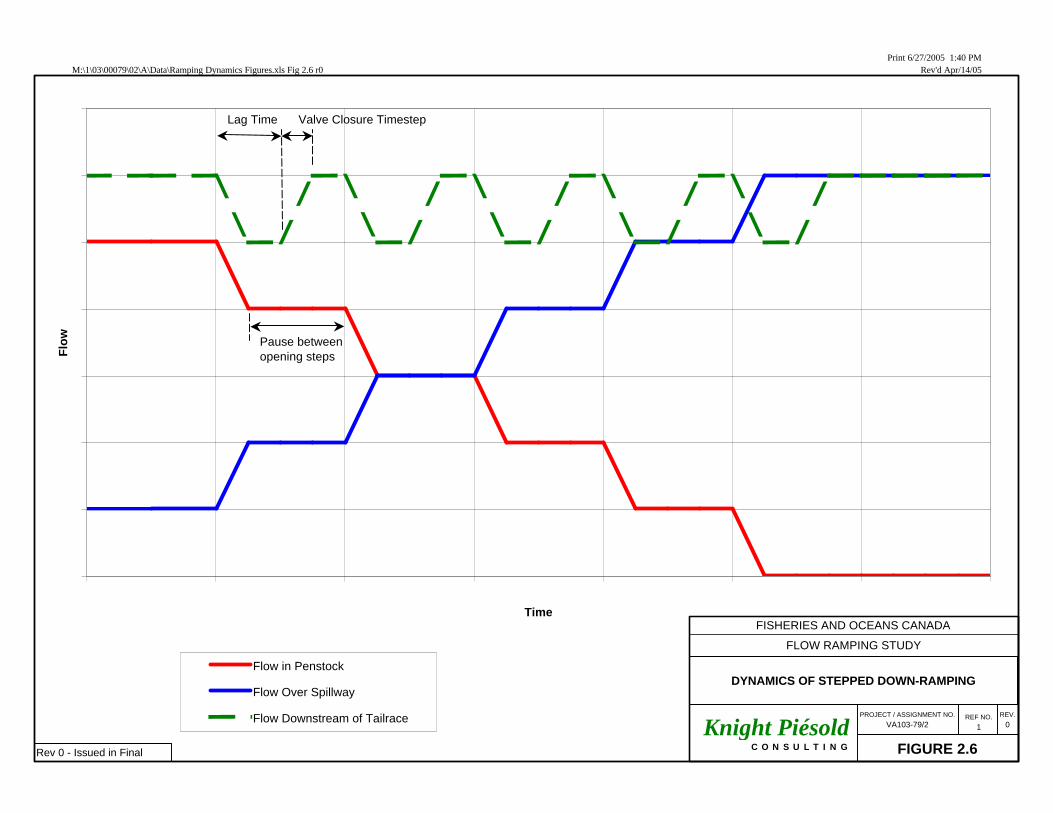
M:\1\03\00079\02\A\Data\Ramping Dynamics Figures.xls Fig 2.6 r0Print 6/27/2005 1:40 PM
Rev'd Apr/14/05
0
5
10
15
20
25
30
35
-1.0 0.0 1.0 2.0 3.0 4.0 5.0 6.0Time
Flo
w
Flow in Penstock
Flow Over Spillway
Flow Downstream of Tailrace
Rev 0 - Issued in Final
DYNAMICS OF STEPPED DOWN-RAMPING
FIGURE 2.6
FISHERIES AND OCEANS CANADA
FLOW RAMPING STUDY
REV.
0 PROJECT / ASSIGNMENT NO.
VA103-79/2REF NO.
1 Knight Piésold C O N S U L T I N G
Lag Time Valve Closure Timestep
Pause between opening steps
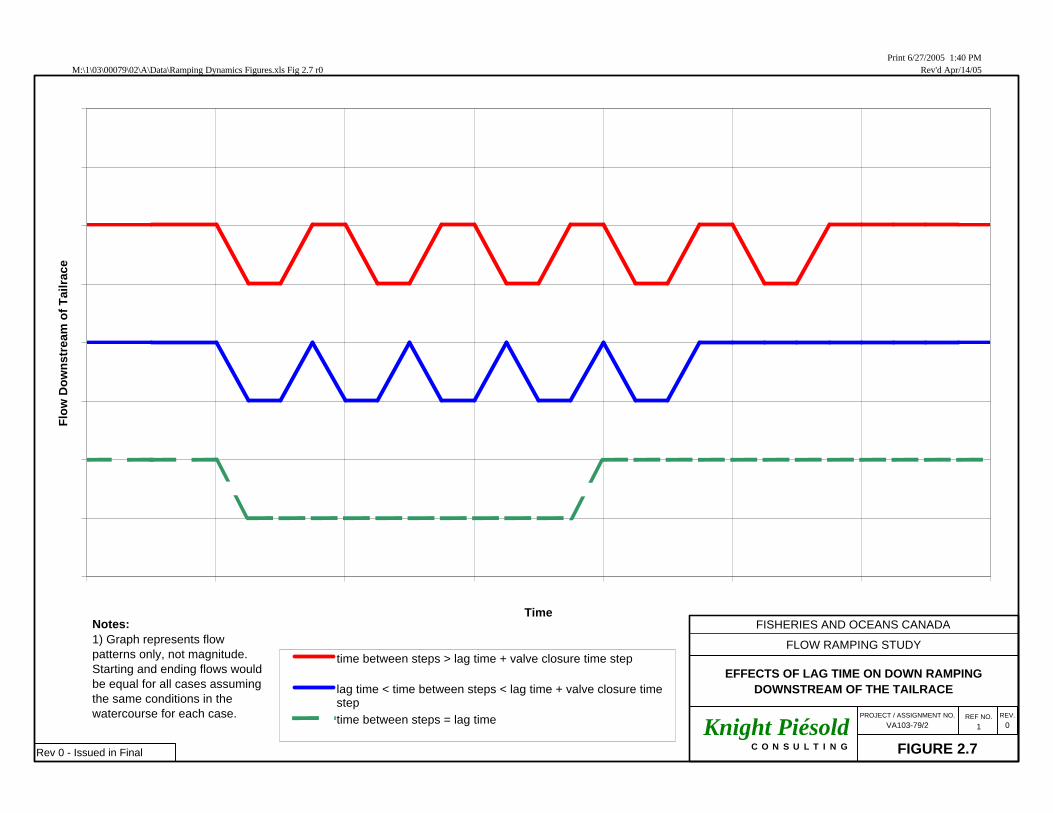
M:\1\03\00079\02\A\Data\Ramping Dynamics Figures.xls Fig 2.7 r0Print 6/27/2005 1:40 PM
Rev'd Apr/14/05
0
5
10
15
20
25
30
35
40
-1.0 0.0 1.0 2.0 3.0 4.0 5.0 6.0Time
Flo
w D
ow
nst
ream
of
Tai
lrac
e
time between steps > lag time + valve closure time step
lag time < time between steps < lag time + valve closure timesteptime between steps = lag time
Rev 0 - Issued in Final
EFFECTS OF LAG TIME ON DOWN RAMPING DOWNSTREAM OF THE TAILRACE
FIGURE 2.7
FISHERIES AND OCEANS CANADA
FLOW RAMPING STUDY
REV.
0 PROJECT / ASSIGNMENT NO.
VA103-79/2REF NO.
1 Knight Piésold C O N S U L T I N G
Notes:1) Graph represents flow patterns only, not magnitude. Starting and ending flows would be equal for all cases assuming the same conditions in the watercourse for each case.
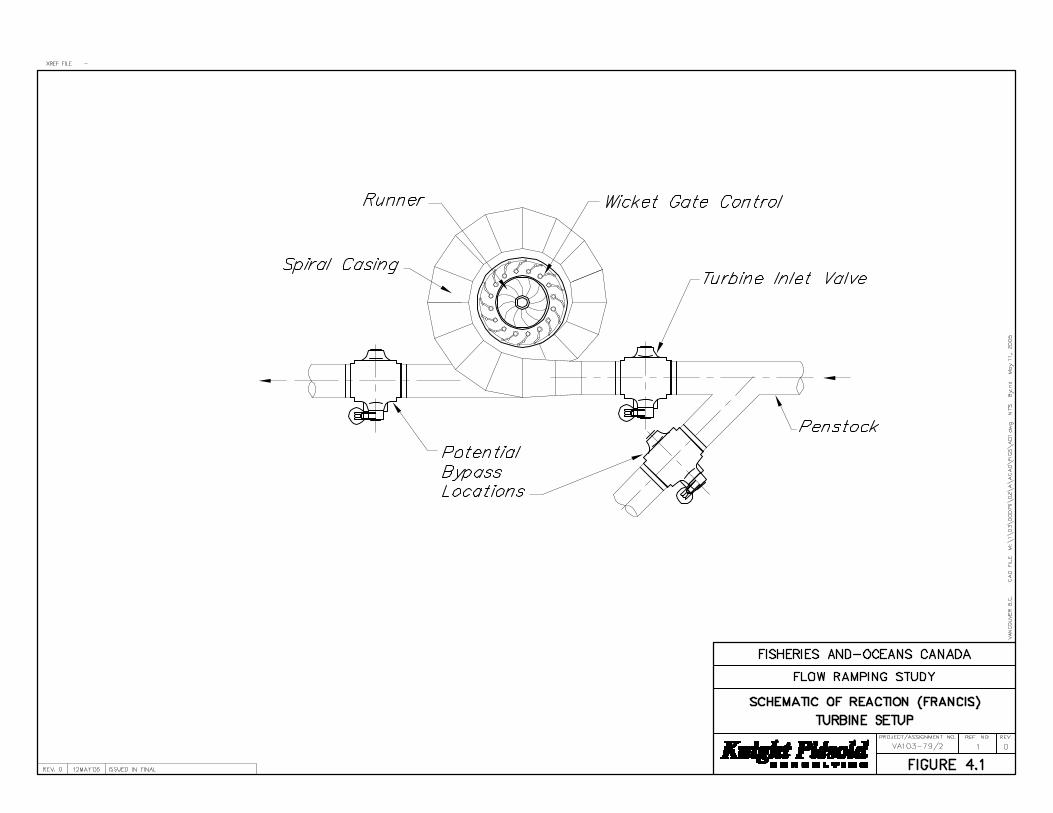
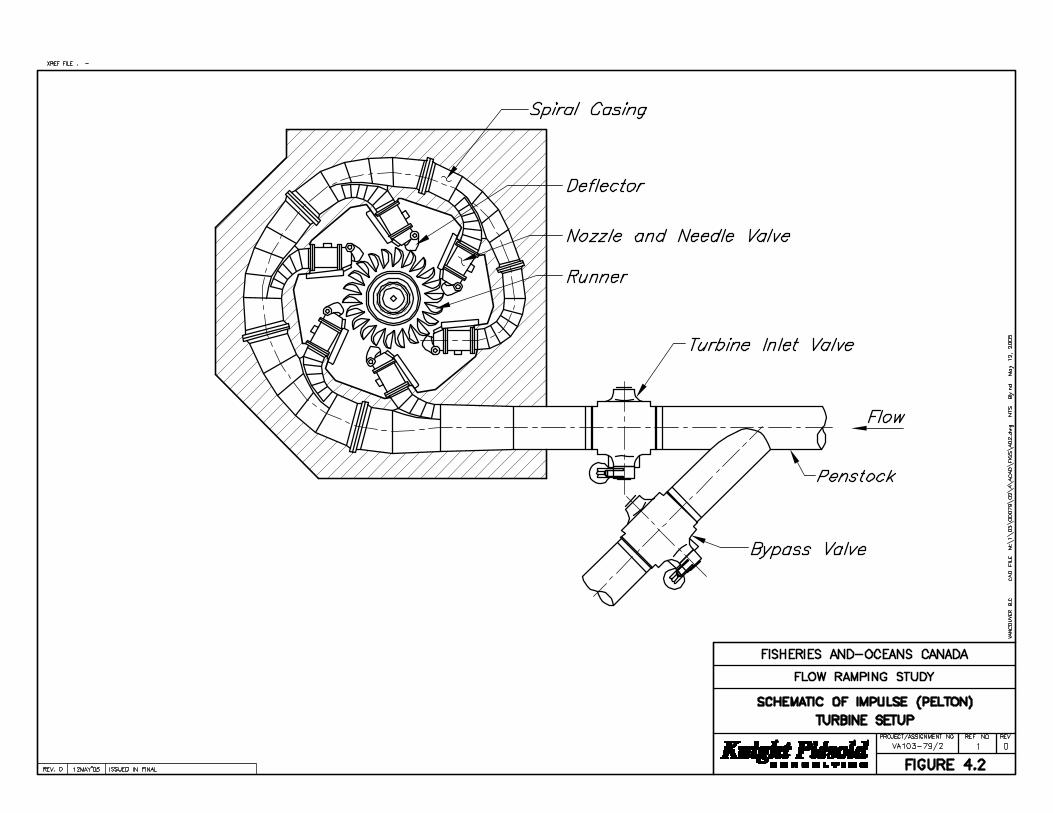

M:\1\03\00079\02\A\Data\DFO_Figures.xls Fig 4.3 r0Print 6/28/2005 8:15 AM
Rev'd Mar/20/04
SCHEMATIC OF DEFLECTOR PLATE FUNCTIONALITY
FIGURE 4.3
FISHERIES AND OCEANS CANADA
FLOW RAMPING STUDY
REV.
0 PROJECT / ASSIGNMENT NO.
VA103-79/2REF NO.
1 Knight Piésold C O N S U L T I N GRev 0 - Issued in Final
Runner
Deflector
Deflected Flow
Nozzle and Needle Valve