Embed Size (px)
Citation preview
Refractory Effects of the N1 Event-‐Related Potential in Experienced Cochlear 1 Implant Patients 2
Christopher D. Cowper-‐Smith1, Janet Green1, Heather Maessen2, 3 Manohar Bance3, & Aaron J. Newman1,4 4
5 6 7
1. Department of Psychology, Dalhousie University, Halifax, Nova Scotia, 8 Canada 9
2. Nova Scotia Hearing and Speech Centers, Halifax, Nova Scotia, Canada 10
3. Division of Otolaryngology, Capital Health District. Department of Surgery, 11 School of Human Communication Disorders, and School of Biomedical 12 Engineering, Dalhousie University, Halifax, Nova Scotia 13
4. Departments of Psychiatry, Surgery (Division of Otolaryngology), and 14 Pediatrics (Division of Neurology), Dalhousie University, Halifax, Nova Scotia 15
16
This research was funded by the Nova Scotia Health Research Foundation. AJN was 17 supported by the Canada Research Chairs program. CCS was supported by a CGS 18 Scholarship from Canadian Institutes of Health Research. 19 20 21 22 IN PRESS — INTERNATIONAL JOURNAL OF AUDIOLOGY 23 DOI: 10.3109/14992027.2012.743044 24 25 26
For Correspondence: 27 Aaron J. Newman 28 Department of Psychology 29 Box 15000 30 Dalhousie University 31 Halifax, NS B3H 4R2 32 Canada 33 Tel: +1-‐902-‐494-‐6959 34 E-‐mail: [email protected] 35
36
Auditory Refractory Period in Cochlear Implant Patients
2
Abstract 37 38
Objective: To determine if CI patients exhibit a temporal processing deficit for 39 auditory stimuli, by examining refractory effects of the N1 event-‐related potential 40 (ERP) component. 41
Design: Cochlear implant patients and normally hearing controls were tested in an 42 auditory refractory period paradigm while ERP recordings were collected across the 43 scalp. Participants were presented with brief 500 Hz tones that were separated by 44 inter-‐stimulus intervals (ISIs) of 500, 1000, or 3000 ms. The amplitude of the N1 45 was examined as a function of ISI within each group. 46
Study Sample: Ten adult CI patients and 13 age-‐matched normally hearing controls 47 were tested. Patients had long-‐lasting severe or profound sensorineural hearing loss 48 prior to implantation, and a minimum of 2 years experience with CI activation. 49
Results: Unlike normally hearing controls, CI users showed no refractory effect for 50 tones at 500 ms ISIs compared to 1000 ms. However, similar to controls, recovery 51 from refractoriness was observed in anterior locations at 3000 ms. 52
Conclusion: The refractory period threshold, defined as the minimum ISI where 53 different N1 amplitudes are elicited, is greater than 1000ms in CI patients; at least 54 double that of normally hearing controls. 55 56 57 58 59 60 61 62 63 64 Keywords: Cochlear Implant, EEG, hearing loss, auditory evoked potential (AEP), 65 auditory refractory period 66 67 Acronyms & Abbreviations: cochlear implants (CIs); elecroencephalography 68 (EEG); event related potentials (ERPs); late auditory evoked potential (LAER); 69 hearing in noise test (HINT); inter-‐stimulus-‐interval (ISI); independent components 70 analysis (ICA); linear mixed effects (LME) 71 72 73
Auditory Refractory Period in Cochlear Implant Patients
3
The current most effective rehabilitative option for severe to profound 74
sensorineural hearing loss, and some forms of auditory neuropathy is surgical, using 75
cochlear implants (CIs) (Isaacson, 2010). The success of CI treatment remains highly 76
variable, and is affected by many variables including the level, laterality, and 77
duration of hearing loss. Following deafness greater than 4 years, adults treated 78
with CIs often exhibit only moderate improvements in speech comprehension, 79
which typically plateau within 1 year of implantation, and thereafter remain 80
independent of the duration of CI experience. Improvements in speech 81
comprehension that do occur are better for closed-‐set (constrained) tasks, and 82
worse for open-‐set task performance (for review, see Peterson et al. 2010). 83
The limited capacity for speech comprehension improvements in CI recipients with 84
prior long-‐term deafness may arise from deprivation and/or nonuse of the auditory 85
cortex (cf. Kral et al. 2007). Prolonged lack of auditory stimulation may lead to 86
reduced responsiveness and less precise tuning of neural responses to sound. As 87
well, some evidence suggests takeover of auditory association cortices by visual 88
processing, at least in the case of congenital deafness (Buckley et al. 2011; Lomber 89
et al. 2010). Either or both of these phenomena could contribute to less-‐than-‐ideal 90
outcomes of cochlear implantation in deaf adults. 91
One contributor to speech comprehension deficits in CI users might be reduced 92
temporal acuity, since speech comprehension depends on the ability to represent 93
rapidly changing sequences of sound. Consistent with temporal processing deficits, 94
Auditory Refractory Period in Cochlear Implant Patients
4
unilateral CI users exhibit increased gap detection thresholds (e.g. Garadat et al. 95
2011), reflecting difficulty in detecting brief acoustic transients. In addition, bilateral 96
CI users appear to depend on interaural level rather than interaural time differences 97
in sound localization tasks, suggesting that temporal cues are not effectively 98
transmitted or used (Aronoff et al. 2010). Finally, many CI recipients exhibit a 99
reduced ability to detect changes in stimulus duration, as well as stimulus frequency 100
and intensity (Sandmann et al. 2010). 101
A well-‐established approach for studying the time course of cortical responses to 102
auditory information is to measure event-‐related potentials (ERPs), which are the 103
summed electrical potentials of large fields of coherently-‐activated neurons as 104
recorded from the scalp. One component of this is the so-‐called late auditory evoked 105
response (LAER). The LAER is a complex of 3 components, P1-‐N1-‐P2, which peak in 106
healthy adults at approximately 50, 100, and 200 ms after an onset, change (e.g. of 107
frequency or intensity), or offset of an auditory stimulus (Martin et al. 2008; Woods 108
1995). Modulation of LAER amplitude and latency occurs as a function of stimulus 109
intensity, frequency, and duration in normally hearing adults (Rosburg et al. 2002; 110
Woods 1995). The LAER is also thought to critically underlie mechanisms 111
responsible for normal speech perception, and it is reliably elicited and modulated 112
by acoustic changes in naturally occurring speech sounds (Martin et al. 2008). 113
Moreover, auditory neuropathy patients (who exhibit speech-‐comprehension 114
deficits that are disproportionately large when compared to their absolute pure-‐115
Auditory Refractory Period in Cochlear Implant Patients
5
tone hearing loss), exhibit entirely absent or distorted LAERs as a consequence of 116
disrupted neural synchrony (Cowper-‐Smith et al. 2010). 117
In an effort to understand speech-‐comprehension deficits following cochlear 118
implantation, several groups have investigated the LAER in CI users (e.g. Gilley et al. 119
2008; Hoppe et al. 2001; Sandmann et al. 2010; Sharma et al. 2007; Zhang et al. 120
2010). Although CI users may demonstrate similar modulations of the LAER by 121
stimulus intensity and frequency changes (Hoppe et al. 2001), their responses tend 122
to be reduced in amplitude and increased in latency (relative to normally-‐hearing 123
people; Ponton et al. 2001; Sharma et al. 2005), an effect that is consistent with 124
reduced or slowed neural responsiveness to modulations in sound stimuli. 125
One aspect of the neural response to sound that has not been extensively 126
investigated is refractoriness in CI users. The amplitude of the P1-‐N1-‐P2 complex, 127
and particularly the N1, is monotonically reduced with declining interstimulus 128
intervals (ISI) when brief, consecutive auditory stimuli are presented (Budd et al. 129
1998; Coch et al. 2005; Friesen & Picton, 2010; Martin et al. 2008; Woods 1995). The 130
decline in N1 amplitude with decreasing ISIs appears to be closely related to 131
behavioral thresholds for the detection of distinct stimuli at short ISIs; below the ISI 132
where two distinct stimuli can be discriminated, no N1 is observed for the second 133
stimulus (Coch et al. 2005; Fitzpatrick et al. 1999). Budd et al. (1998) showed that 134
the modulation of N1 amplitude by ISI is more consistent with refractoriness than 135
with habituation. As such, this N1 effect reflects “temporal limitations inherent in 136
Auditory Refractory Period in Cochlear Implant Patients
6
the physiochemical mechanisms underlying N1 generation” (Budd et al., 1998, p. 137
52), and not habituation to specific stimulus characteristics that may be 138
counteracted by an orienting response to a novel stimulus. Moreover, while N1 139
latency may be related to the speed of the onset of neural processing, the refractory 140
period effect represents a different measure of the speed of neural responsiveness, 141
related to how quickly the system can recover. It is reasonable to expect that this 142
speed of recovery is critical to the processing of tightly-‐spaced temporal acoustic 143
cues, such as speech perception. As such, it is of interest whether CI users show 144
extended refractory responses. 145
Previous work has investigated refractory effects in the auditory responses of CI 146
users. Zhang et al., (2009) demonstrated a non-‐linear recovery function of the LAEP 147
in CI users; in contrast, young healthy controls showed a linear pattern of recovery 148
where increasing ISI was associated with larger N1-‐P2 amplitudes. This result is 149
consistent with the disruption of refractory effects in auditory cortex of CI users. 150
Zhang et al., (2010) subsequently reported refractory effects on the N1-‐P2 complex 151
in CI users using trains of stimuli separated by 700 ms, which were more 152
pronounced in those with higher speech comprehension scores. Finally, Friesen and 153
Picton (2010) showed that CI users’ N1-‐P2 complexes exhibit refractory effects at 154
500 ms ISI relative to 3000 ms ISI. However, none of these studies compared CI 155
users to age-‐matched normally hearing controls. Furthermore, although Zhang et al. 156
(2009) examined the LAEP across several different levels of ISI, they only reported 157
Auditory Refractory Period in Cochlear Implant Patients
7
data from a single electrode location (Cz), and used ISIs that were 700 ms or longer. 158
Consequently, it remains unclear whether CI users’ LAER responses have a different 159
“time constant” of recovery for shorter ISIs (which might be particularly important 160
for speech sounds) that relates to their poorer temporal acoustic processing, and if 161
so, whether this is true across multiple electrode locations. 162
In the present study we therefore examined the distribution and amplitude of the 163
N1 component of the LAER as a function of auditory ISI in a group of experienced CI 164
users (> 2 years with an activated implant), compared to normally hearing controls. 165
Our analyses focused on the N1, because it is a sensitive measure of temporal 166
processing and stimulus detection, and is the most reliably elicited component of 167
the LAER by an auditory stimulus onset in both normally-‐hearing adults and CI 168
patients with high open-‐set speech comprehension (Hoppe et al. 2001; Martin et al. 169
2008; Schmidt et al. 2005). Given evidence for slower temporal responses and 170
impaired temporal processing of acoustic stimuli in CI users, we predicted that CI 171
users would show increased refractoriness of the N1 (i.e., less recovery of N1 172
amplitude at short ISIs) compared with normally-‐hearing people. Such a finding 173
would be consistent with auditory temporal processing deficits in CI users. 174
Methods 175
Participants 176
Ten adult unilateral CI users (mean age = 47, ranging from 22 to 69) and 14 177
approximately age-‐matched control subjects (mean age = 42, ranging from 22 to 66) 178
Auditory Refractory Period in Cochlear Implant Patients
8
with normal or corrected-‐to-‐normal vision were tested. All controls and 10 of 11 179
patients were right handed (Oldfield, 1971). Participants reported no history of 180
developmental, neurological, or psychiatric disorders (other than hearing loss in the 181
CI group). Patients had a minimum of 2 years of experience with an activated CI 182
(mean experience = 6.1 years, ranging from 2 to 11 years), and all had experienced 183
chronic severe or profound sensorineural hearing loss prior to implantation. 184
Patients’ mean time since their subjective onset of hearing loss was 31.2 years, 185
(ranging from 15–49 years), while the mean time since the onset of profound 186
hearing loss was 19 years (ranging from 1–49 years), although for some or all of this 187
time, most patients used some form or forms of hearing aid. When hearing outcomes 188
were considered at a plateau by their audiologist, CI users were tested for open-‐set 189
speech comprehension using the Hearing in Noise Test (HINT; Nilsson et al. 1994). 190
Individual background information for each patient is provided in Table 1. All 191
participants gave written, voluntary consent. Participants were compensated $20.00 192
for their participation. This study was approved by the Capital District Health 193
Authority (CDHA) Research Ethics Board. 194
Stimuli 195
Stimuli were 500 Hz tones (standards) and a spoken syllable, /ba/ (targets; 196
recorded from a male voice). All stimuli were 50ms in duration and were presented 197
as bursts without onset or offset ramps; the speech syllable was trimmed and 198
compressed slightly to shorten it to 50 ms. 199
Auditory Refractory Period in Cochlear Implant Patients
9
Stimulus Delivery 200
The stimulus presentation program was built in Matlab software using the 201
Psychophysics toolbox (Brainard 1997). Auditory stimuli were delivered free-‐field 202
from speakers mounted on either side of the television screen. Sounds were 203
presented at each subject’s most comfortable listening level (MCL), which ranged 204
between 50 and 60 dB SPL, and was determined based on participant feedback. 205
Although we allowed a small range of intensity levels to ensure participants could 206
hear the stimuli, we were not concerned that stimulus intensity would affect the 207
amplitude of the N1 based on recent work demonstrating that the amplitude of the 208
N1 response is not systematically varied by stimulus intensity between 30 and 80 209
dB SPL (Czarniak, 2012). This procedure was successfully employed in recent 210
studies examining refractory effects in CI users (Friesen & Picton, 2010; Zhang et al., 211
2010). 212
Protocol 213
Participants were seated in a sound-‐attenuating booth, centered approximately 110 214
cm away from a 46” Samsung LN46A650 LCD television screen. Participants were 215
instructed to maintain visual fixation on a centrally presented fixation cross (0.5 216
visual degrees in height and width) while listening to the auditory stimuli. A total of 217
550 stimuli were presented in a single, continuous stimulus train during the 218
experiment; 500 of these (91%) were standards (tones), while the other 50 (9%) 219
were targets (syllables). Of the 500 standards, only 450 were used in the LAER 220
Auditory Refractory Period in Cochlear Implant Patients
10
analysis; the trials that immediately followed each target (50 in total) were 221
discarded to ensure that any responses evoked by the syllabic stimuli did not affect 222
the data used in the LAER analysis. The ISI between each pair of tones was 223
randomized. Of the 450 standards used in the LAER analysis, 150 were preceded by 224
each ISI (500, 1000, and 3000 ms); the tones following targets were all preceded by 225
a 1000 ms ISI. Targets were preceded by equal numbers of each of the three ISIs. 226
Participants were instructed to respond to the target stimuli (the syllable /ba/) as 227
quickly and accurately as possible by pressing a button on a gamepad with their 228
right hand. While refractory effects on the LAER can be obtained in the absence of 229
attention (Friesen & Picton, 2010), we reasoned that the directing attention to the 230
stimuli would serve to amplify the evoked neural responses. 231
Data Collection and Preprocessing 232
EEG Recording. Two types of EEG caps were used for collection of ERP data: a 60-‐233
channel Electro-‐Cap International (ECI; Ohio) system and a 66-‐channel Advanced 234
Neuro Technology (ANT; Enschende, The Netherlands) system. This was 235
necessitated by a failure of some ANT caps partway through the data collection 236
phase of our study; all other data collection equipment (amplifiers, recording 237
computers, etc.) was held constant across all participants. A total of 4 patients and 6 238
controls were run with the ECI caps, while the remaining 6 patients and 8 controls 239
were run with the ANT caps. The two recording caps had 56 electrode positions in 240
common; only these electrode positions (shown in Figure 1) were used in the 241
Auditory Refractory Period in Cochlear Implant Patients
11
analyses. While we did not expect that the choice of cap would affect data quality, 242
we note that since roughly equal numbers of people in each group were run with 243
each cap type, any differences should not contribute to any observed within-‐ or 244
between-‐group differences. 245
For each participant, it was not possible to record EEG from some electrodes due to 246
interference from the CI transducer; data from these electrodes were interpolated 247
during post-‐processing (see below). Electrodes were also placed above and below 248
the left eye and on the outer canthi of both eyes to monitor for ocular artifacts. The 249
EEG was sampled and digitized at a rate of 256 Hz using a ANT model Refa8-‐64 250
amplifier, amplified by a factor of 20, lowpass filtered at 69.12 Hz and recorded on a 251
computer (Dell Inspiron 6000) using ASA Recorder software (ANT). 252
Insert Figure 1 about here 253
Offline, EEG data were digitally filtered using a finite impulse response filter, first 254
with a high pass cutoff of 0.5Hz and then with a low pass cutoff of 40Hz in EEGLAB 255
Version 9.02 (Delorme et al. 2004). Continuous EEG data was segmented into 256
epochs that started 250 ms prior to, and lasted 600ms after, each stimulus tone 257
(speech syllables were used as targets for the purpose of maintaining subjects’ 258
attention to the stimuli, but ERP to these were not of interest in this study). Epochs 259
in which excessive noise artifact was observed were semi-‐automatically identified 260
(using a maximum peak-‐to-‐peak amplitude threshold tailored to each participant’s 261
dataset, combined with visual inspection) and removed from subsequent analyses. 262
Auditory Refractory Period in Cochlear Implant Patients
12
Data were next submitted to independent component analysis (ICA) in EEGLAB 263
(Delorme & Makeig, 2004). Components identified in ICA that contained CI artifact, 264
ocular artifacts, or noise isolated to a single electrode were identified and 265
subsequently removed. As described previously, ICA effectively removes CI artifact 266
in ERP data with no, or minimal, residual artifact (Castaneda-‐Villa & James, 2008; 267
Debener et al. 2008; Gilley, Sharma & Dorman, 2008; Martin, 2007; Viola et al., 2011; 268
Zhang et al. 2010). Viola et al. (2011) further showed that removal of CI artifact does 269
not distort the cortical ERPs. It is also worth noting that even if any residual CI 270
artifact had remained in our data, its effects would be negligible due to the design of 271
the study: we compared within-‐subjects differences in the amplitude of the N1 LAER 272
component between identical acoustic stimuli that varied only in their ISI. Thus, as 273
Friesen & Picton (2010) demonstrated, CI artifacts will cancel out in such 274
subtractions since they are highly stable across repetitions of the same stimuli. 275
Statistical Analysis 276
N1 ERP data were extracted as an adaptive mean amplitude, calculated from an 277
average of 7 data points centered on the peak amplitude value (i.e. 3 samples before 278
and 3 samples after the peak value were included) within a 70–140 ms time window 279
following stimulus presentation. This time window was chosen based on the timing 280
of the N1 in the previous literature, as well as visual inspection of the ERP 281
waveforms. 282
Auditory Refractory Period in Cochlear Implant Patients
13
These data were extracted for each trial, at each electrode, from each participant 283
and submitted to linear mixed effects (LME) modelling (Baayen et al. 2008; Pinheiro 284
et al. 2000) using the function lmer() from the lme4 library in R version 2.10 285
(http://www.R-‐project.org). LME is a relatively recent approach in computational 286
statistics based on restricted maximum-‐likelihood estimation. The use of LMER for 287
EEG data analyses was promoted by Bagiella, Sloan, & Heitja (2000), and has been 288
applied recently by our own lab (Newman et al. 2011) and several other groups. 289
LME models are a form of the general linear model including both fixed effects and 290
random effects parameters. LME modeling offers several advantages over more 291
traditional GLM approaches (Baayen et al. 2008; Bagiella et al. 2000; Pinheiro and 292
Bates 2000), which deal appropriately with unbalanced data, missing data, and non-‐293
sphericity, and increase the accuracy and generalizability of the parameter 294
estimates. For a detailed discussion of the advantages of LME modelling in ERP data 295
analysis, please see Newman et al. (2011) and Bagiella et al. (2000). 296
Identification of the optimal mixed-‐effects model was performed for the dependent 297
measure N1 amplitude through a series of iterative tests in which progressively 298
simpler models were systematically compared to more complex models using log-‐299
likelihood ratio testing (Baayen, et al., 2008; Pinheiro & Bates, 2000). Starting with 300
the most sophisticated mixed-‐effects model (including the interaction among all 301
fixed effects, and all lower-‐order interactions), interactions that did not explain a 302
significant amount of variance were removed in a stepwise manner, one at a time. A 303
Auditory Refractory Period in Cochlear Implant Patients
14
simpler model (i.e. which excluded a non-‐significant interaction from the previous 304
model) was accepted if the log-‐likelihood test did not reveal a significant difference 305
between the next-‐most complex model. This process continued until the simplest 306
model was identified, defined as the model that had the fewest factors and 307
interactions, while accounting for more variance than the next less-‐complex model. 308
This process was first conducted for the random effects structure of the model, then 309
for the fixed effects structure. Using the simplest model, potential main effects and 310
interactions were examined using F tests. Significant interactions were further 311
analyzed using polynomial contrast sets. Denominator degrees of freedom (df) were 312
calculated as the number of data points minus the number of degrees of freedom 313
used up by the fixed effects and the number of random effects in the model. This 314
allowed the use of lower-‐bound probability values. 315
Target detection accuracy data was analyzed using generalized linear mixed 316
modeling, as implemented in the glmm() function in R, using the logit link function 317
to assume the variance follows a binomial distribution (Faraway, 2006). This is a 318
form of logistic regression using maximum likelihood estimation as in LME. LMER 319
was used to compare reaction time (RT) data between groups and across each level 320
of ISI, using the same procedures described for the ERP data above. 321
Auditory Refractory Period in Cochlear Implant Patients
15
Results 322
Behavioral Data 323
The optimal generalized linear mixed model for the accuracy data included both 324
fixed effects factors Group and ISI, and a random effects structure that accounted for 325
subject-‐specific variance at each level of ISI. Accuracy was significantly better in the 326
control group compared to CI users, z = -‐2.02, p < .05. 327
The optimal LMER model for RT data included both fixed effects factors, Group and 328
ISI, and random effects for subjects. There was a significant interaction between 329
group and ISI, F(2,664) = 3.5, p < .05, although there were neither main effects of group, 330
F(1,664) = 0.83 p = .36, nor ISI, F(1,664) = 1.83, p = .16. Investigation of the interaction 331
with post hoc tests did not reveal significant differences between the groups for any 332
ISI. Rather, the interaction appeared to stem from the fact that for normally hearing 333
controls, RTs were reliably slower at the 3000 ms ISI than at either the 1000 ms, t= 334
2.5, p < .01, or 500 ms, t = 2.74, p < .01, ISIs. 335
ERP Data 336
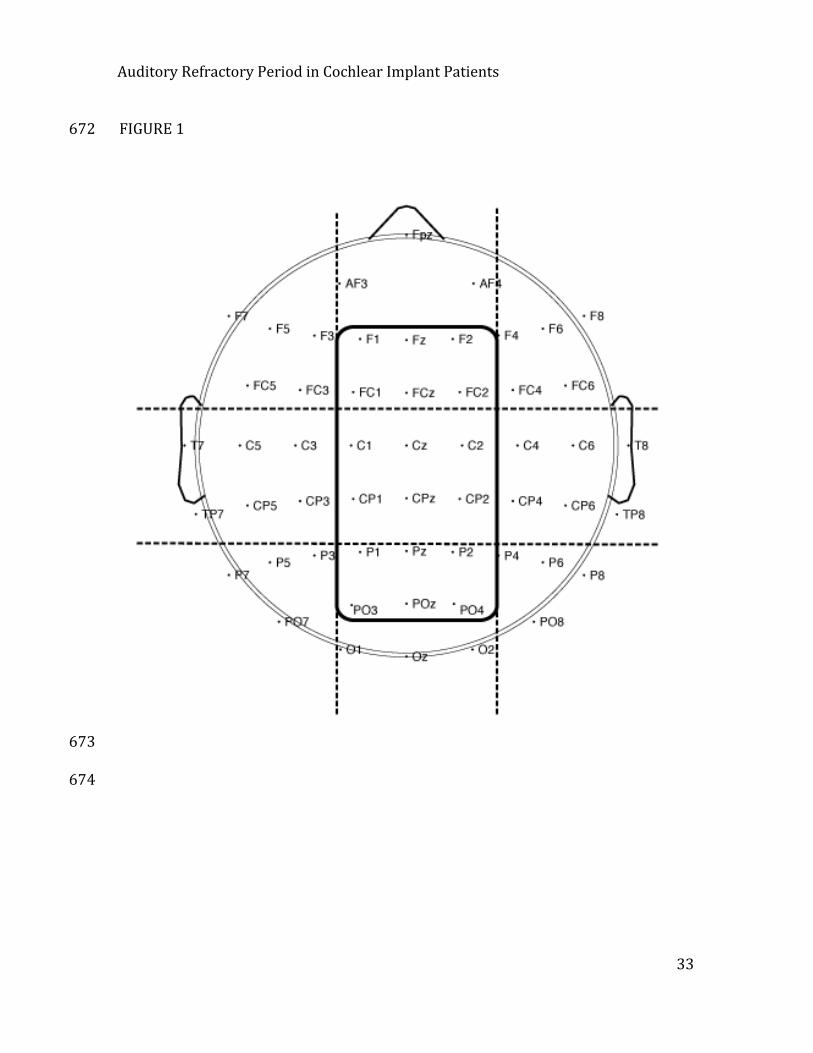
The tones reliably elicited P1-‐N1-‐P2 components in both normally hearing controls 337
and CI users. Figure 2 shows the group-‐average LAERs for controls and CI users at 338
the 6 midline electrodes, where the N1 component was largest. In controls, these 339
plots revealed pronounced N1 effects across all levels of ISI at anterior electrode 340
sites (Fz, FCz, Cz, and CPz), a relatively diminished N1 at Pz and little or no N1 at the 341
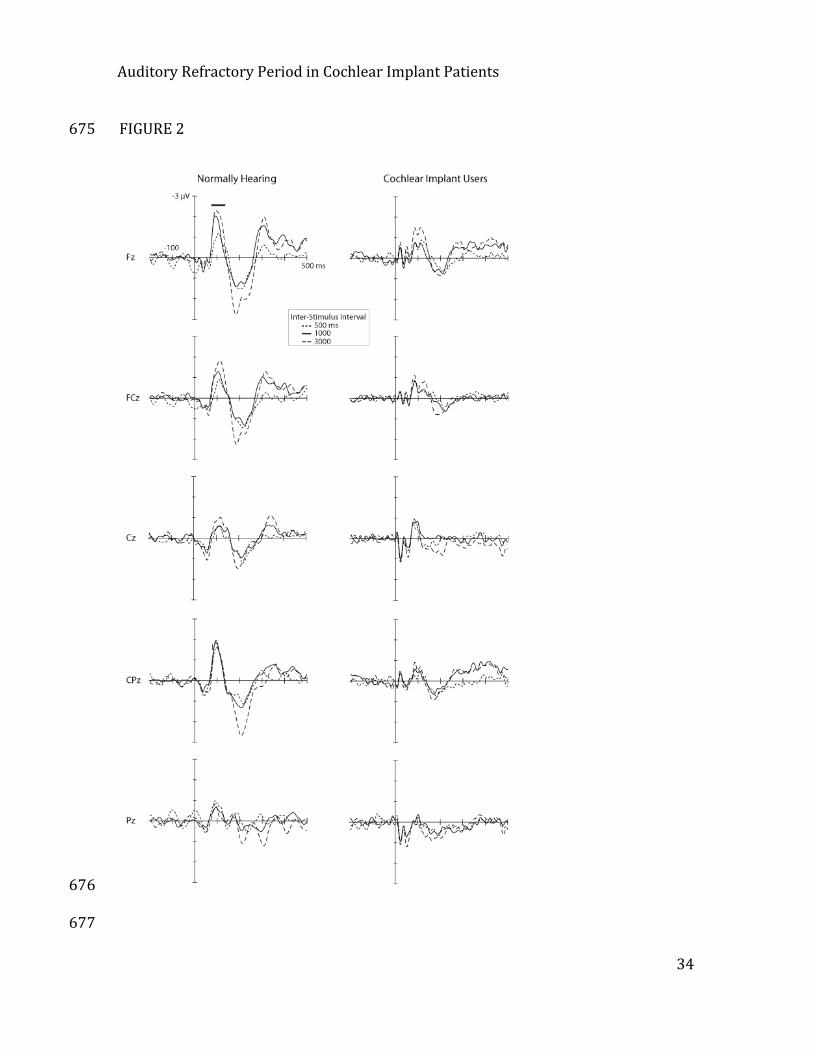
most posterior electrode, POz. The distribution of the N1 at each ISI is also shown in 342
Auditory Refractory Period in Cochlear Implant Patients
16
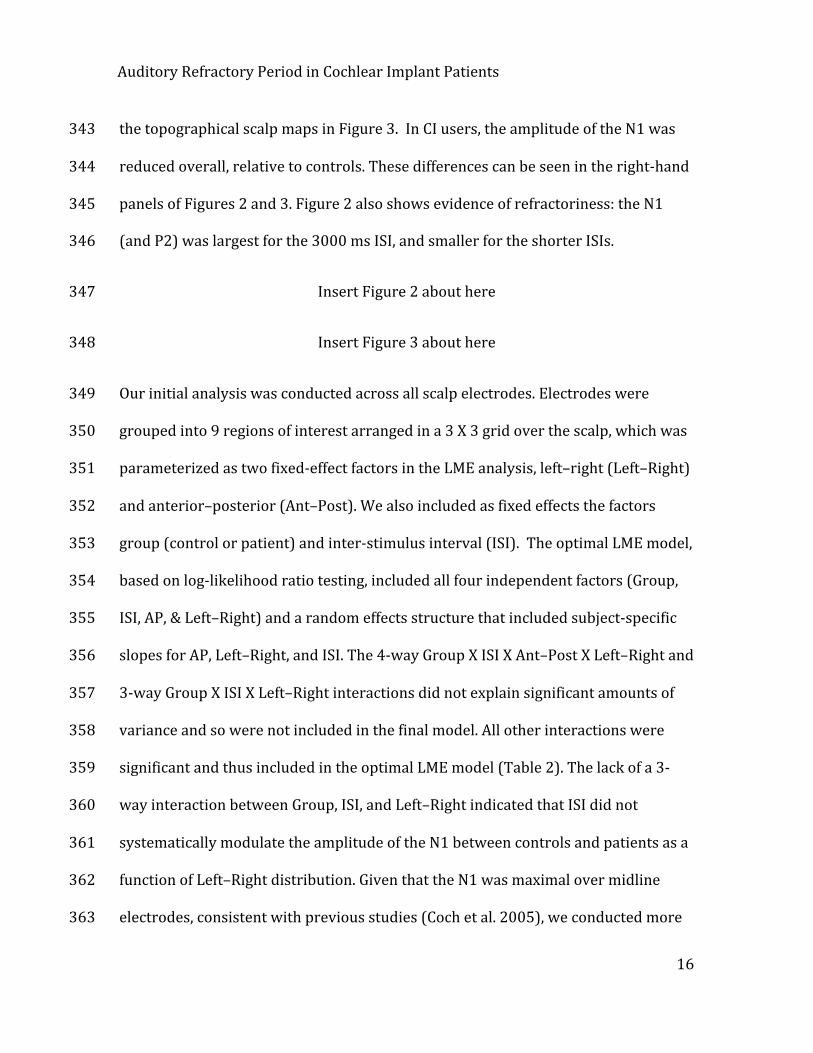
the topographical scalp maps in Figure 3. In CI users, the amplitude of the N1 was 343
reduced overall, relative to controls. These differences can be seen in the right-‐hand 344
panels of Figures 2 and 3. Figure 2 also shows evidence of refractoriness: the N1 345
(and P2) was largest for the 3000 ms ISI, and smaller for the shorter ISIs. 346
Insert Figure 2 about here 347
Insert Figure 3 about here 348
Our initial analysis was conducted across all scalp electrodes. Electrodes were 349
grouped into 9 regions of interest arranged in a 3 X 3 grid over the scalp, which was 350
parameterized as two fixed-‐effect factors in the LME analysis, left–right (Left–Right) 351
and anterior–posterior (Ant–Post). We also included as fixed effects the factors 352
group (control or patient) and inter-‐stimulus interval (ISI). The optimal LME model, 353
based on log-‐likelihood ratio testing, included all four independent factors (Group, 354
ISI, AP, & Left–Right) and a random effects structure that included subject-‐specific 355
slopes for AP, Left–Right, and ISI. The 4-‐way Group X ISI X Ant–Post X Left–Right and 356
3-‐way Group X ISI X Left–Right interactions did not explain significant amounts of 357
variance and so were not included in the final model. All other interactions were 358
significant and thus included in the optimal LME model (Table 2). The lack of a 3-‐359
way interaction between Group, ISI, and Left–Right indicated that ISI did not 360
systematically modulate the amplitude of the N1 between controls and patients as a 361
function of Left–Right distribution. Given that the N1 was maximal over midline 362
electrodes, consistent with previous studies (Coch et al. 2005), we conducted more 363
Auditory Refractory Period in Cochlear Implant Patients
17
detailed analyses that were restricted to the midline electrodes and that included 6 364
Ant-‐Post levels. 365
Each Ant-‐Post level in the midline analyses included three electrodes (treated as 366
repeated measures of that level) aligned in the same row, which we refer to here 367
using the nomenclature of the International 10-‐20 System (see Figure 1). The 368
optimal model included fixed effects factors group, ISI, and Ant–Post, and a random-‐369
effects structure that accounted for subject-‐specific variance in the distribution of 370
effects over the Ant–Post dimension and across levels of ISI. Main effects of Group, 371
F(1, 129983)= 6.38, p < .01, ISI, F(2, 129983) = 24.54, p < .001, and Ant–Post, F(5, 129983) = 372
6.93, p < .001, were qualified by a significant 3-‐way interaction, Group X ISI X Ant–373
Post, F(10, 129983)=4.80, p < .0001, which confirmed the findings of the analysis over all 374
electrodes, that the refractory effects were modulated by both group and electrode 375
position. 376
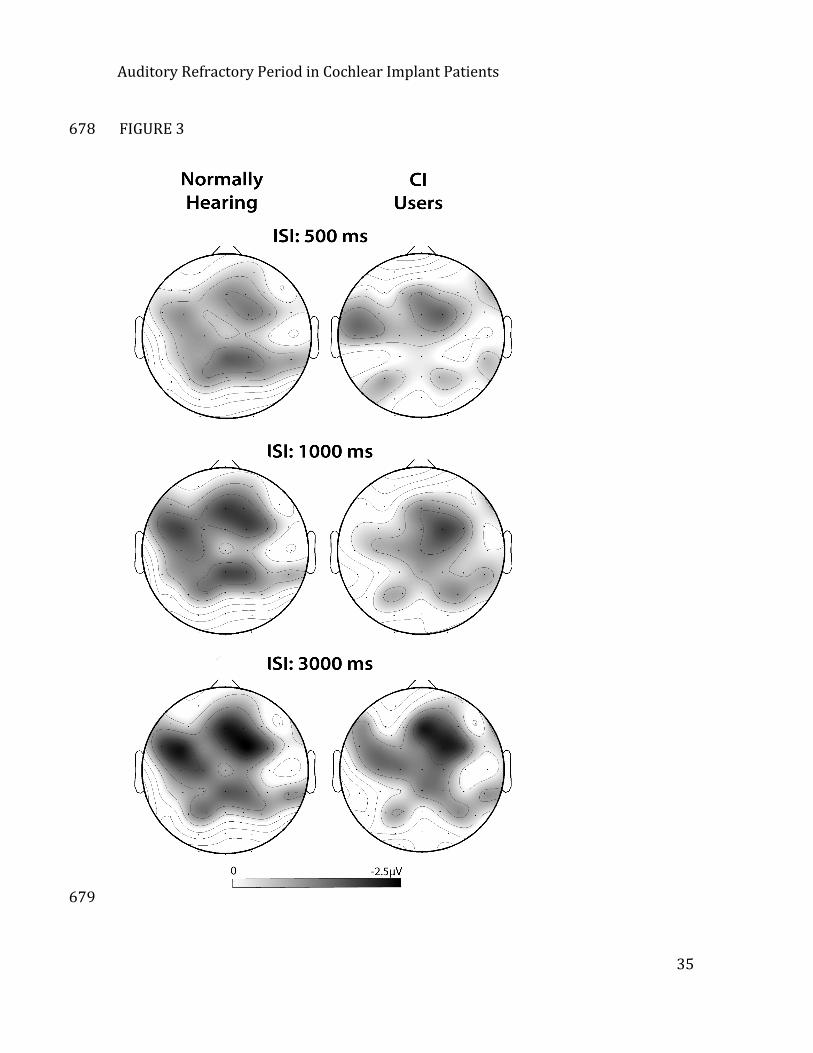
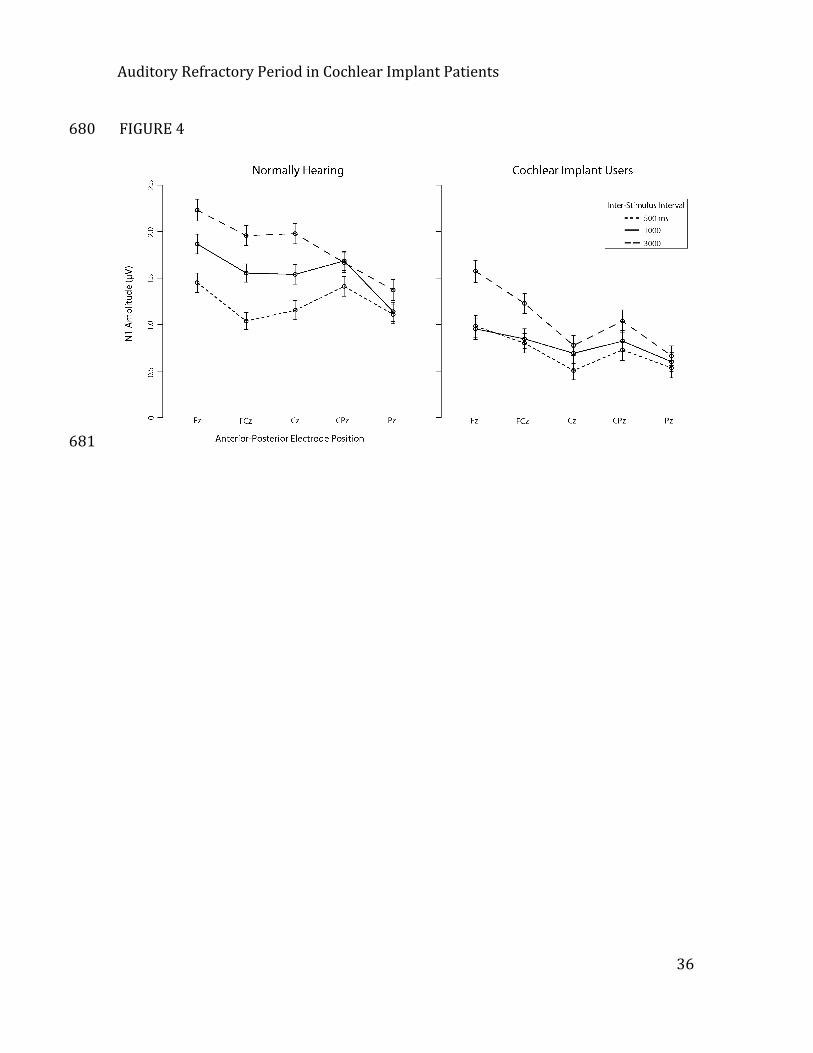
Mean amplitudes across the electrodes at each ROI are shown in Figure 4. In order 377
to further explore the distribution of ERP effects in each group along the Ant–Post 378
dimension, and test our predictions that ISI would modulate ERP amplitude 379
parametrically (with increasing N1 amplitudes from 500 – 3000 ms), we conduced 380
pairwise contrasts between adjacent levels of ISI, for controls and patients 381
separately at each level of Ant–Post; Sidak corrections were applied to p values to 382
correct for multiple comparisons (number of comparisons arising from contrasting 383
ISI 500 vs 1000, and 1000 vs 3000 [2], multiplied by levels of Ant–Post [6], 384
Auditory Refractory Period in Cochlear Implant Patients
18
multiplied by groups [2] = 24). Normally-‐hearing controls showed the expected 385
refractory effects, with significantly (p < .05, corrected) greater N1 amplitude at 386
3000 compared to 1000 ms, and at 1000 compared to 500 ms ISIs, at the 2 most 387
anterior levels of Ant–Post (F, FC, C), as well as at the next-‐most anterior level (CP) 388
for the 1000 vs. 500 ms comparison. In contrast, CI users showed no significant 389
differences in the amplitude of the N1s elicited by tones at 500 and 1000 ms ISIs, 390
but significant differences between 1000 and 3000 ms ISIs the 2 most anterior 391
levels (F, FC). Detailed statistics are presented in Table 3. 392
Insert Figure 4 about here 393
Discussion 394
The present study compared the temporal response properties of auditory 395
processing using an ERP measure of LAER refractoriness in experienced CI users 396
relative to normally hearing controls. Auditory refractoriness is considered a 397
measure of how quickly physiochemical mechanisms underlying the LAER can 398
recover from the processing of a sound event (Budd et al. 1998), and therefore 399
provides a useful tool for the study of one dimension of temporal processing in the 400
auditory system. Given the documented deficits of temporal processing in people 401
who received CIs as adults (e.g. Aronoff et al. 2010; Garadat et al. 2011; Sandmann et 402
al. 2010), we predicted longer refractory periods in CI users than normally hearing 403
Auditory Refractory Period in Cochlear Implant Patients
19
controls, reflecting slowed recovery and thus decreased temporal sensitivity of 404
auditory cortical responses1. 405
The data confirmed our hypothesis. Normally hearing controls showed recovery of 406
N1 amplitudes at 1000 relative to 500 ms ISIs over frontal and central-‐parietal 407
midline electrodes (positions F, FC, C, and CP), and additional recovery between 408
1000 and 3000 ms ISIs at the more frontal electrodes (F, FC, and C). In contrast, CI 409
users showed no reliable differences in N1 amplitude between 500 and 1000 ms. 410
Rather, recovery was only evident between the 1000 and 3000 ms ISIs, and these 411
differences were restricted to the more frontal electrode positions (levels F, and FC 412
only). 413
Coch et al. (2005) found that the lower limit of the refractory period, defined as the 414
minimum ISI capable of eliciting different N1 amplitudes, is likely somewhere 415
between 200 and 500 ms in normally hearing individuals. Correspondingly, we 416
expected to observe progressively larger N1 amplitudes for stimuli separated by 417
500, 1000, and 3000 ms in normally hearing controls, and indeed this is what we 418
found. However, the present data indicate that the lower limit of the refractory 419
period is longer in CI patients than normally hearing controls. Specifically, because 420
500 and 1000 ms ISIs elicited equivalent N1 amplitudes across all 6 levels of the 421
1 It is important to note that our results reflect decreased temporal resolution of the cortical response, rather than a broader deficit in temporal processing. For example, while the CI and the subcortical auditory processing system may be able to represent rapidly changing temporal information, our results suggest that temporal processes appear to be disrupted at higher levels of processing.
Auditory Refractory Period in Cochlear Implant Patients
20
Ant–Post dimension, the lower limit of the refractory period in CI users must be 422
greater than 1000 ms; i.e., over double that of normally hearing controls. These data 423
add to previous findings using similar paradigms. Zhang et al. (2010) showed 424
refractoriness for stimuli separated by 700 ms, but only relative to the first stimulus 425
of a train, which would have had a particularly long ISI preceding it. Friesen and 426
Picton (2010) contrasted 500 and 3000 ms ISIs and found refractory effects in CI 427
users, as we did, but did not test the intermediate 1000 ms ISI nor did they have a 428
normally-‐hearing control group. The present results support our prediction that CI 429
users would exhibit disrupted neural refractory processes. These data suggest the 430
presence of a temporal processing deficit (cf. Fitzpatrick et al. 1999) whereby the 431
LAERs of CI users do not differentiate between tones separated by 500 or 1000 ms. 432
This suggests a slowed recovery period of the neural generators of the N1 433
component, which are primarily located in the superior temporal gyrus (Woods, 434
1995). 435
In addition to a heightened lower limit of the refractory period, the scalp 436
distribution of N1 refractory period effects appeared to be more focal in CI users: 437
refractory effects were found at frontal, central, and central-‐parietal electrode sites 438
in normally hearing people but only at frontal sites in CI users. As described in the 439
introduction, depriving the auditory cortex of acoustic information is likely to result 440
in long-‐lasting reductions in connectivity, and impaired decoding of sound 441
information delivered by a CI. The more focal distribution of the N1 over the scalp in 442
Auditory Refractory Period in Cochlear Implant Patients
21
CI users may be the consequence of a reduced cortical area responsive to sound, 443
and/or reduced neural synchrony leading to both reduced amplitude and spatial 444
extent. Another possibility is that the orientation of dipoles in auditory cortex is 445
altered in a way that results in a more focal distribution of the N1 in CI users. 446
Given that our patients all had a minimum of 2 years’ experience with their CI 447
activated, and research demonstrating that the most dramatic changes in hearing 448
abilities occur within the first year post-‐implantation (Peterson et al. 2010), our 449
data are consistent with the view that the neuroplastic capacity of the auditory 450
system of adult CI users is limited. This could result from cross-‐modal take-‐over of 451
the auditory cortex by visual processing functions (Sandmann et al., 2012), from 452
reduced spontaneous activity and unusually high synchrony of electrically evoked 453
activity in the auditory nerve (e.g. Pagialonga et al., 2010), or some combination of 454
these factors. Consequently, adult CI recipients appear unlikely to undergo complete 455
recovery on a neurophysiological level. 456
Interestingly, these persistent deficits in temporal processing at the 457
electrophysiological level occurred even in the context of relatively good hearing —458
most of our participants had speech comprehension scores of 90% or above. This 459
result must be interpreted cautiously, since the HINT sentences were administered 460
in quiet, and presentation of the same sentences in noise (or other tests that better 461
simulated real-‐world listening conditions) may have revealed poorer performance 462
relative to people with normal hearing. We note that two of our participants had 463
Auditory Refractory Period in Cochlear Implant Patients
22
dramatically poorer speech comprehension scores than the others; however when 464
we repeated the statistical analyses with these two subjects omitted, the pattern of 465
results did not change. Thus while the small sample size and bimodal distribution of 466
HINT scores did not lend these data to a correlational analysis between the N1 467
refractory period effects and HINT scores, we found no evidence that the 468
electrophysiological effects were closely related to speech comprehension in quiet. 469
Conclusion 470
The present findings reveal a temporal auditory processing deficit in CI users, 471
evidenced through a disruption of normal refractory effects. In particular, the 472
refractory period threshold, defined as the minimum ISI where different N1 473
amplitudes are elicited, is greater than 1000ms in CI patients; at least double that of 474
normally hearing controls. 475
Future Directions 476
While evidence for a temporal processing deficit in CI users were provided from the 477
lack of differential N1 amplitudes observed between stimuli separated by 500 or 478
1000 ms in the present study, a more thorough characterization of this temporal 479
processing deficit may be advantageous. Specifically, although the present data 480
indicate the refractory threshold of CI users, i.e. the minimum ISI required to evoke 481
different N1 amplitudes, is somewhere between 1000 and 3000ms, the precise 482
timing of the refractory threshold remains an open question. Establishing the lower 483
limit of refractory period effects in individual patients may be useful for optimizing 484
Auditory Refractory Period in Cochlear Implant Patients
23
CI stimulation parameters in an attempt to compensate for the altered temporal 485
resolution of auditory processing, thereby promoting perception of temporally-‐486
defined sound information. Moreover, it is likely that the modulation of N1 487
amplitude by ISI may be different depending on the types of auditory stimuli 488
presented; such a proposal is supported by research demonstrating different N1 489
amplitudes for stimuli of different frequencies (Martin et al. 2008; Woods 1995). 490
Future research may therefore aim to determine the minimum ISI required for 491
larger N1 amplitudes using a variety of different stimulus types. Of particular 492
relevance to CI users, it may be useful to adapt the present task to utilize naturally 493
occurring speech sounds (such as the presentation of a brief vowel sound). 494
The present data provide a further basis for future work aiming to improve the CI 495
signal delivered to the auditory nerve in order to enhance the delivery and 496
processing of sound information reliant on temporal acuity. Currently, several lines 497
of research in animal models are focused on replicating normal neural 498
responsiveness to sound information delivered via CI in the auditory nerve, 499
brainstem, and cortex (e.g. Loquet et al., 2004). While this line of research can allow 500
for detailed explorations of neurophysiological responses to CI stimulation in animal 501
models, it is equally important to determine if relatively normal patterns of auditory 502
processing activity can be obtained in human CI users. The present paradigm may 503
be adopted for this purpose in future studies, in an effort to determine if different 504
patient etiologies, CI stimulation parameters and/or rehabilitation approaches 505
Auditory Refractory Period in Cochlear Implant Patients
24
during speech therapy are effective in replicating relatively normal LAER 506
amplitudes and distributions. Using this approach, it may be possible to further 507
improve CI treatment outcome. 508
509
510
Auditory Refractory Period in Cochlear Implant Patients
25
References 511
Albrecht, R., Suchodoletz, W., Uwer, R. 2000. The development of auditory 512 evoked dipole source activity from childhood to adulthood. Clin Neurophysiol, 513 111, 2268-‐2276. 514
Aronoff, J. M., Yoon, Y. S., Freed, D. J., et al. 2010. The use of interaural time and 515 level difference cues by bilateral cochlear implant users. J Acoust Soc Am, 127, 516 EL87-‐92. 517 Baayen, R. H., Davidson, D. J., Bates, D. M. 2008. Mixed-‐effects modeling with 518 crossed random effects for subjects and items. J Mem Lang, 59, 390-‐412. 519
Bagiella, E., Sloan, R. P., Heitjan, D. F. 2000. Mixed-‐effects models in 520 psychophysiology. Psychophysiology, 37, 13-‐20. 521
Brainard, D. H. 1997. The Psychophysics Toolbox. Spat Vis, 10, 433-‐436. 522
Buckley, K. A., Tobey, E. A. 2011. Cross-‐modal plasticity and speech perception in 523 pre-‐ and postlingually deaf cochlear implant users. Ear Hear, 32, 2-‐15. 524
Budd, T. W., Barry, R. J., Gordon, E., et al. 1998. Decrement of the N1 auditory 525 event-‐related potential with stimulus repetition: habituation vs. refractoriness. 526 Int J Psychophysiol, 31, 51-‐68. 527
Coch, D., Skendzel, W., Neville, H. J. 2005. Auditory and visual refractory period 528 effects in children and adults: an ERP study. Clin Neurophysiol, 116, 2184-‐2203. 529
Cowper-‐Smith, C. D., Dingle, R. N., Guo, Y., et al. 2010. Synchronous auditory 530 nerve activity in the carboplatin-‐chinchilla model of auditory neuropathy. J 531 Acoust Soc Am, 128, EL56-‐62. 532
Czarniak, L.J. 2011. Effect of stimulus intensity on cortical potentials in cochlear 533 implant recipients. Doctoral dissertation. Retrieved from 534 http://digitalcommons.wustl.edu 535
Debener, S., Mullinger, K. J., Niazy, R. K., et al. 2008. Properties of the 536 ballistocardiogram artefact as revealed by EEG recordings at 1.5, 3 and 7 T static 537 magnetic field strength. Int J Psychophysiol, 67, 189-‐199. 538 Delorme, A., Makeig, S. 2004. EEGLAB: an open source toolbox for analysis of 539 single-‐trial EEG dynamics including independent component analysis. J Neurosci 540 Methods, 134, 9-‐21. 541 Faraway, J.J. 2006. Extending the linear model with R. Chapman & Hall/CRC, 542 Boca Raton, FL. 543
Fitzpatrick, D. C., Kuwada, S., Kim, D. O., et al. 1999. Responses of neurons to 544 click-‐pairs as simulated echoes: auditory nerve to auditory cortex. J Acoust Soc 545 Am, 106, 3460-‐3472. 546
Auditory Refractory Period in Cochlear Implant Patients
26
Friesen, L., & Picton, T. A method for removing cochlear implant artifact. Hear 547 Res, 259, 95-‐106. 548
Garadat, S. N., Pfingst, B. E. 2011. Relationship between gap detection thresholds 549 and loudness in cochlear-‐implant users. Hear Res, 275, 130-‐138. 550
Gates, G. A., Cooper, J. C., Jr., Kannel, W. B., et al. 1990. Hearing in the elderly: the 551 Framingham cohort, 1983-‐1985. Part I. Basic audiometric test results. Ear Hear, 552 11, 247-‐256. 553
Gilley, P. M., Sharma, A., Dorman, M. F. 2008. Cortical reorganization in children 554 with cochlear implants. Brain Res, 1239, 56-‐65. 555
Goodin, D. S., Squires, K. C., Henderson, B. H., et al. 1978. Age-‐related variations in 556 evoked potentials to auditory stimuli in normal human subjects. 557 Electroencephalogr Clin Neurophysiol, 44, 447-‐458. 558
Hoppe, U., Rosanowski, F., Iro, H., et al. 2001. Loudness perception and late 559 auditory evoked potentials in adult cochlear implant users. Scand Audiol, 30, 560 119-‐125. 561
Kral, A., Eggermont, J. J. 2007. What's to lose and what's to learn: development 562 under auditory deprivation, cochlear implants and limits of cortical plasticity. 563 Brain Res Rev, 56, 259-‐269. 564
Lomber, S. G., Meredith, M. A., Kral, A. 2010. Cross-‐modal plasticity in specific 565 auditory cortices underlies visual compensations in the deaf. Nat Neurosci, 13, 566 1421-‐1427. 567 Martin, B. A., Tremblay, K. L., Korczak, P. 2008. Speech evoked potentials: from 568 the laboratory to the clinic. Ear Hear, 29, 285-‐313. 569
Newman, A. J., Tremblay, A., Nichols, E. S., et al. in press. The Influence of 570 Language Proficiency on Lexical Semantic Processing in Native and Late 571 Learners of English. J Cogn Neurosci. 572 Nilsson, M., Soli, S. D., Sullivan, J. A. 1994. Development of the Hearing in Noise 573 Test for the measurement of speech reception thresholds in quiet and in noise. J 574 Acoust Soc Am, 95, 1085-‐1099. 575 Paglialonga, A., Fiocchi, S., Ravanzzani, P., Tognola, G. 2010. Enhancement of 576 neural stochastic firing in cochlear implant stimulation by the addition of noise: 577 a computational study on the influence of stimulation settings and spontaneous 578 activity. Comput Biol Med 40, 597-‐606. 579
Pang, E. W., Taylor, M. J. 2000. Tracking the development of the N1 from age 3 to 580 adulthood: an examination of speech and non-‐speech stimuli. Clin Neurophysiol, 581 111, 388-‐397. 582
Auditory Refractory Period in Cochlear Implant Patients
27
Pantev, C., Dinnesen, A., Ross, B., et al. 2006. Dynamics of auditory plasticity after 583 cochlear implantation: a longitudinal study. Cereb Cortex, 16, 31-‐36. 584
Peterson, N. R., Pisoni, D. B., Miyamoto, R. T. 2010. Cochlear implants and spoken 585 language processing abilities: review and assessment of the literature. Restor 586 Neurol Neurosci, 28, 237-‐250. 587 Pinheiro, J. C., Bates, D. M. 2000. Mixed-‐effects models in S and S-‐PLUS. New York: 588 Springer-‐Verlag. 589
Ponton, C. W., Eggermont, J. J. 2001. Of kittens and kids: altered cortical 590 maturation following profound deafness and cochlear implant use. Audiol 591 Neurootol, 6, 363-‐380. 592
Ponton, C. W., Eggermont, J. J., Kwong, B., et al. 2000. Maturation of human 593 central auditory system activity: evidence from multi-‐channel evoked potentials. 594 Clin Neurophysiol, 111, 220-‐236. 595 Reuben, D. B., Walsh, K., Moore, A. A., et al. 1998. Hearing loss in community-‐596 dwelling older persons: national prevalence data and identification using simple 597 questions. J Am Geriatr Soc, 46, 1008-‐1011. 598 Rosburg, T., Haueisen, J., Sauer, H. 2002. Stimulus duration influences the dipole 599 location shift within the auditory evoked field component N100m. Brain Topogr, 600 15, 37-‐41. 601 Sandmann, P., Kegel, A., Eichele, T., et al. 2010. Neurophysiological evidence of 602 impaired musical sound perception in cochlear-‐implant users. Clin Neurophysiol, 603 121, 2070-‐2082. 604
Sandmann, P., Diller, N., Eichele, T., et al. 2012. Visual activation of auditory 605 cortex reflects maladaptive plasticity in cochlear implant users. Brain 135, 555-‐606 568. 607
Schmidt, R., Kaftan, H., Hosemann, W., et al. 2005. [Changes of the late 608 acoustically evoked potentials in postlingually deaf patients with cochlear 609 implants]. Laryngorhinootologie, 84, 182-‐186. 610
Sharma, A., Dorman, M. F., Kral, A. 2005. The influence of a sensitive period on 611 central auditory development in children with unilateral and bilateral cochlear 612 implants. Hear Res, 203, 134-‐143. 613
Sharma, A., Gilley, P. M., Dorman, M. F., et al. 2007. Deprivation-‐induced cortical 614 reorganization in children with cochlear implants. Int J Audiol, 46, 494-‐499. 615
Tonnquist-‐Uhlen, I., Borg, E., Spens, K. E. 1995. Topography of auditory evoked 616 long-‐latency potentials in normal children, with particular reference to the N1 617 component. Electroencephalogr Clin Neurophysiol, 95, 34-‐41. 618
Auditory Refractory Period in Cochlear Implant Patients
28
Viola, F.C., Thorne, J.D., Bleeck, S., Eyles, J., Debener, S. 2011. Uncovering auditory 619 evoked potentials from cochlear implant users withi independent components 620 anallysis. Brain and Behav, 48 1470-‐1480. 621 Woods, D. L. 1995. The component structure of the N1 wave of the human 622 auditory evoked potential. Electroencephalogr Clin Neurophysiol Suppl, 44, 102-‐623 109. 624
Yueh, B., Shapiro, N., MacLean, C. H., et al. 2003. Screening and management of 625 adult hearing loss in primary care: scientific review. JAMA, 289, 1976-‐1985. 626 Zhang, F., Samy, R.N., Anderson, J.M., Houston, L. Recovery of the late auditory 627 evoked potential in cochlear implant users and normally hearing listeners. J Am 628 Acad Audiol, 20, 397-‐408. 629 Zhang, F., Anderson, J., Samy, R., et al. 2010. The adaptive pattern of the late 630 auditory evoked potential elicited by repeated stimuli in cochlear implant users. 631 Int J Audiol, 49, 277-‐285. 632
633
Auditory Refractory Period in Cochlear Implant Patients
29
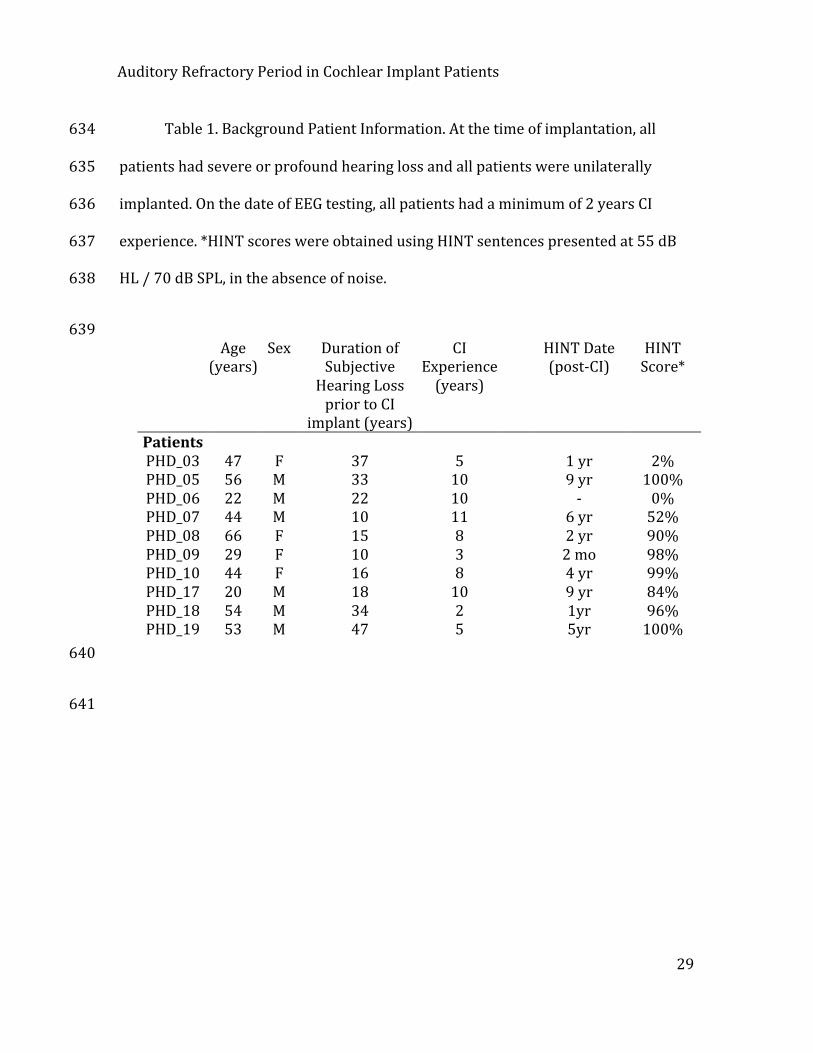
Table 1. Background Patient Information. At the time of implantation, all 634
patients had severe or profound hearing loss and all patients were unilaterally 635
implanted. On the date of EEG testing, all patients had a minimum of 2 years CI 636
experience. *HINT scores were obtained using HINT sentences presented at 55 dB 637
HL / 70 dB SPL, in the absence of noise. 638
639
Age (years)
Sex Duration of Subjective Hearing Loss prior to CI
implant (years)
CI Experience (years)
HINT Date (post-‐CI)
HINT Score*
Patients PHD_03 47 F 37 5 1 yr 2% PHD_05 56 M 33 10 9 yr 100% PHD_06 22 M 22 10 -‐ 0% PHD_07 44 M 10 11 6 yr 52% PHD_08 66 F 15 8 2 yr 90% PHD_09 29 F 10 3 2 mo 98% PHD_10 44 F 16 8 4 yr 99% PHD_17 20 M 18 10 9 yr 84% PHD_18 54 M 34 2 1yr 96% PHD_19 53 M 47 5 5yr 100%
640
641
Auditory Refractory Period in Cochlear Implant Patients
30
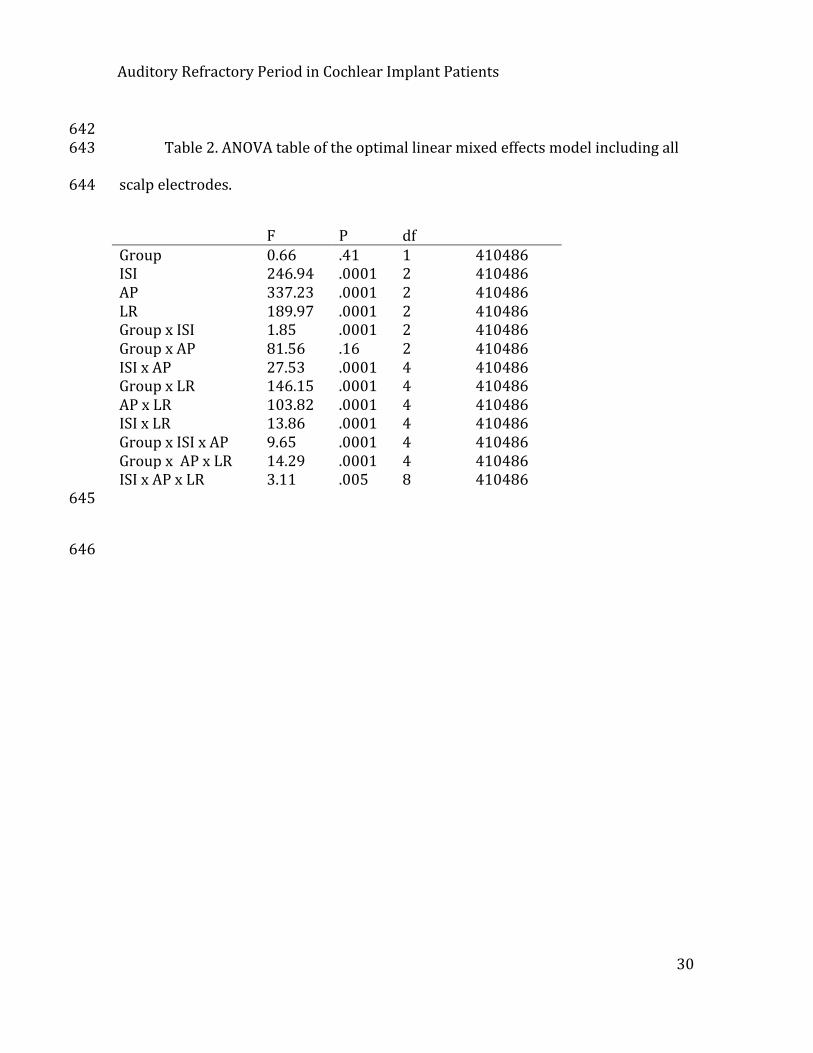
642 Table 2. ANOVA table of the optimal linear mixed effects model including all 643
scalp electrodes. 644
F P df Group 0.66 .41 1 410486 ISI 246.94 .0001 2 410486 AP 337.23 .0001 2 410486 LR 189.97 .0001 2 410486 Group x ISI 1.85 .0001 2 410486 Group x AP 81.56 .16 2 410486 ISI x AP 27.53 .0001 4 410486 Group x LR 146.15 .0001 4 410486 AP x LR 103.82 .0001 4 410486 ISI x LR 13.86 .0001 4 410486 Group x ISI x AP 9.65 .0001 4 410486 Group x AP x LR 14.29 .0001 4 410486 ISI x AP x LR 3.11 .005 8 410486
645
646
Auditory Refractory Period in Cochlear Implant Patients
31
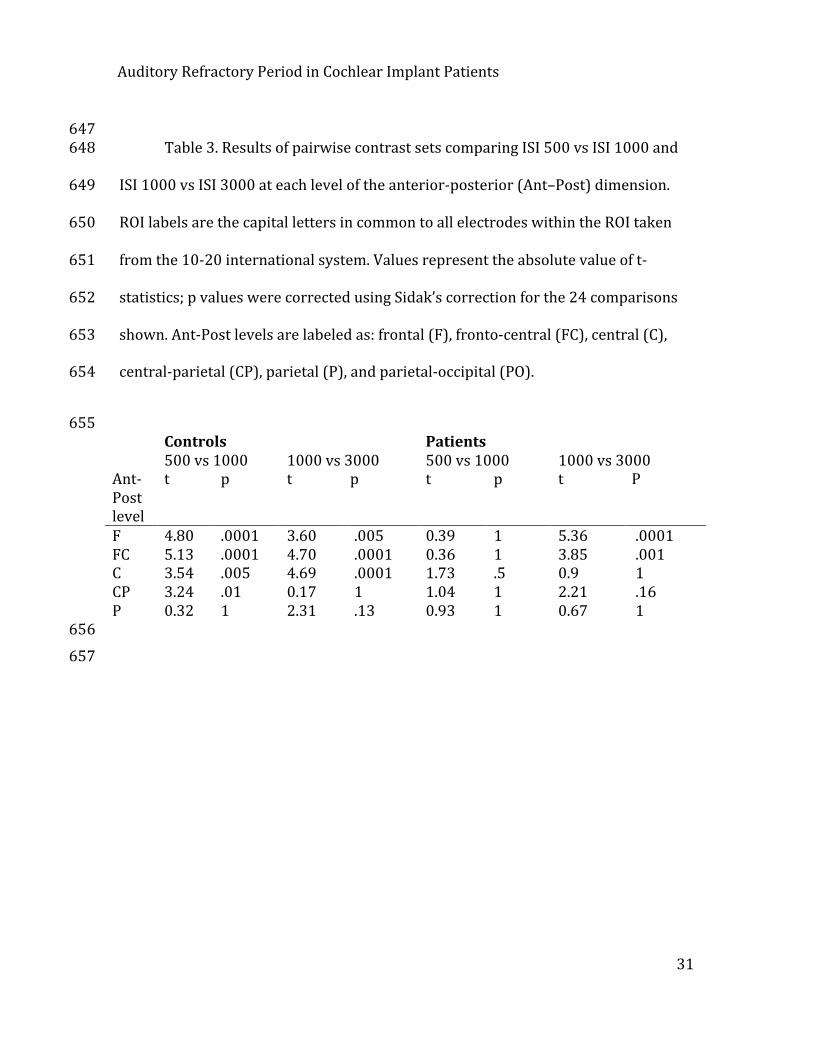
647 Table 3. Results of pairwise contrast sets comparing ISI 500 vs ISI 1000 and 648
ISI 1000 vs ISI 3000 at each level of the anterior-‐posterior (Ant–Post) dimension. 649
ROI labels are the capital letters in common to all electrodes within the ROI taken 650
from the 10-‐20 international system. Values represent the absolute value of t-‐651
statistics; p values were corrected using Sidak’s correction for the 24 comparisons 652
shown. Ant-‐Post levels are labeled as: frontal (F), fronto-‐central (FC), central (C), 653
central-‐parietal (CP), parietal (P), and parietal-‐occipital (PO). 654
655 Controls Patients 500 vs 1000 1000 vs 3000 500 vs 1000 1000 vs 3000 Ant-‐Post level
t p t p t p t P
F 4.80 .0001 3.60 .005 0.39 1 5.36 .0001 FC 5.13 .0001 4.70 .0001 0.36 1 3.85 .001 C 3.54 .005 4.69 .0001 1.73 .5 0.9 1 CP 3.24 .01 0.17 1 1.04 1 2.21 .16 P 0.32 1 2.31 .13 0.93 1 0.67 1
656
657
Auditory Refractory Period in Cochlear Implant Patients
32
Figure Captions 658
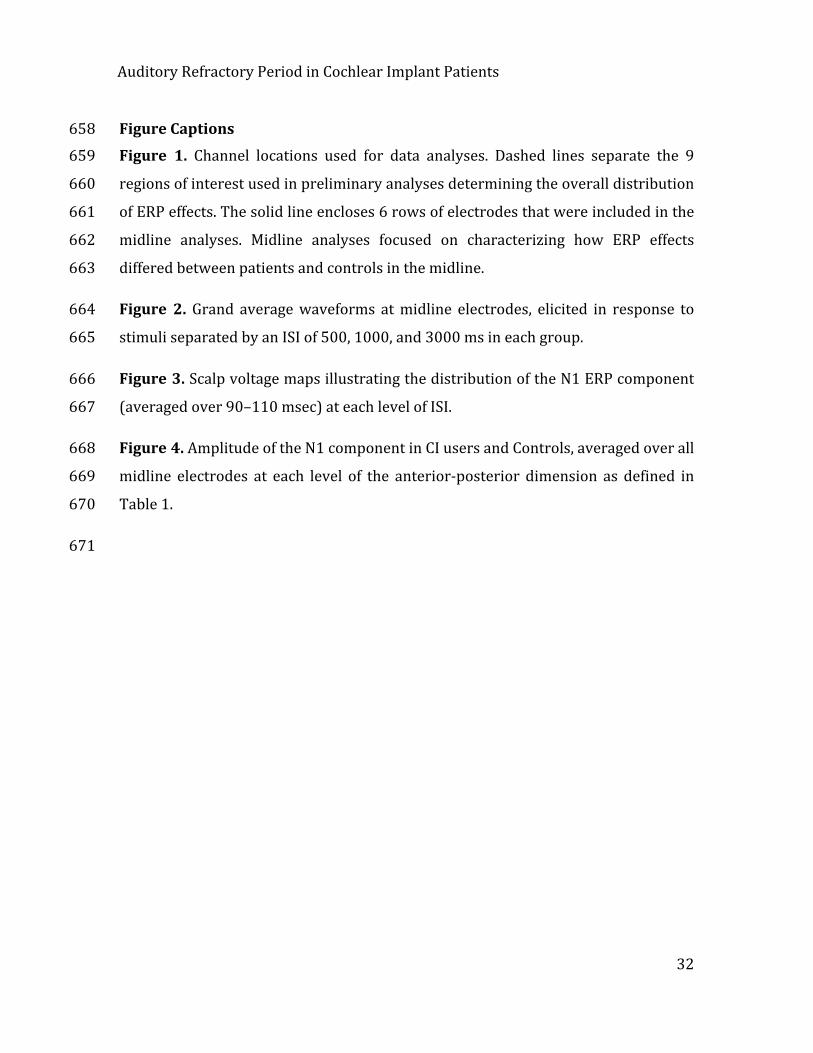
Figure 1. Channel locations used for data analyses. Dashed lines separate the 9 659
regions of interest used in preliminary analyses determining the overall distribution 660
of ERP effects. The solid line encloses 6 rows of electrodes that were included in the 661
midline analyses. Midline analyses focused on characterizing how ERP effects 662
differed between patients and controls in the midline. 663
Figure 2. Grand average waveforms at midline electrodes, elicited in response to 664
stimuli separated by an ISI of 500, 1000, and 3000 ms in each group. 665
Figure 3. Scalp voltage maps illustrating the distribution of the N1 ERP component 666
(averaged over 90–110 msec) at each level of ISI. 667
Figure 4. Amplitude of the N1 component in CI users and Controls, averaged over all 668
midline electrodes at each level of the anterior-‐posterior dimension as defined in 669
Table 1. 670
671
Auditory Refractory Period in Cochlear Implant Patients
33
FIGURE 1 672
673
674
Auditory Refractory Period in Cochlear Implant Patients
34
FIGURE 2 675
676
677
Auditory Refractory Period in Cochlear Implant Patients
35
FIGURE 3 678
679
Auditory Refractory Period in Cochlear Implant Patients
36
FIGURE 4 680
681


![V P V U R gq ^ ý u;Vóÿ d u;S:Wßÿ ^ WS S:Wß0]0nÿ ) N …...N N N N N N N N N N N N N N N N N N N N N N N N N N N N N N N N N P N1 N1 N1 N1 N1 N1 N1 N1 N1 N1 N1 N1 P P P N1 N1](https://img.pdfslide.us/doc/110x75/5fbf575d848b0b7e9575f4b2/v-p-v-u-r-gq-uv-d-usw-ws-sw00n-n-n-n-n-n-n-n-n-n.jpg)


![Pandemic Influenza H1 N1 & H5 N1 V2[1]](https://img.pdfslide.us/doc/110x75/546c3dddb4af9f8e2c8b50a1/pandemic-influenza-h1-n1-h5-n1-v21.jpg)