Embed Size (px)
Citation preview
1Radiometer Medical ApS, Åkandevej 21, DK-2700 Brønshøj, Tel: +45 38 27 38 27, www.radiometer.com
The Siggaard-Andersen acid-base
chart
2
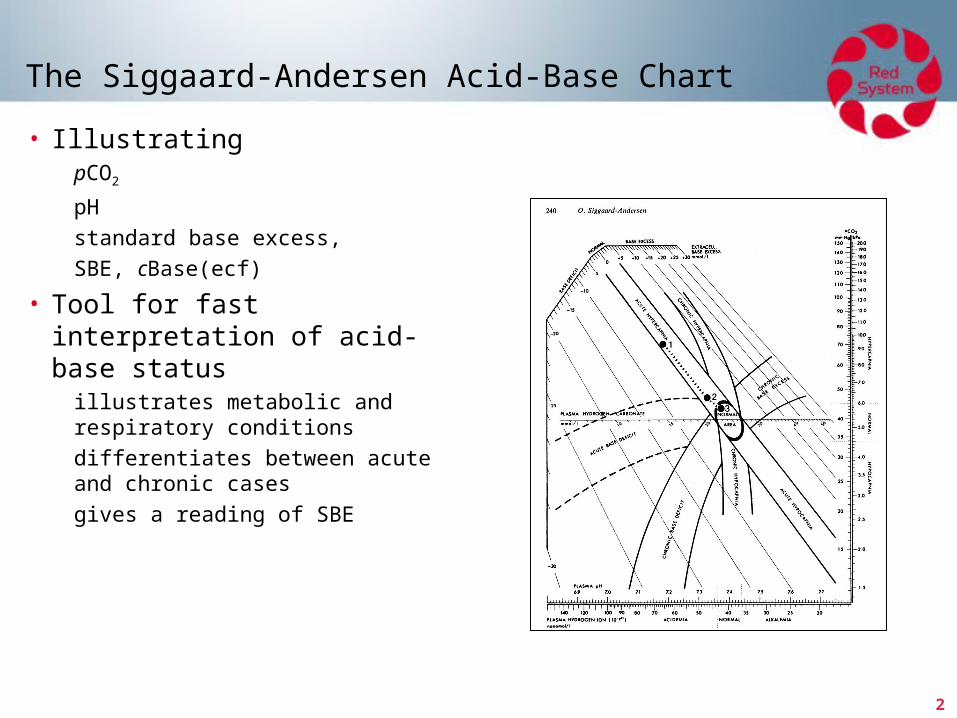
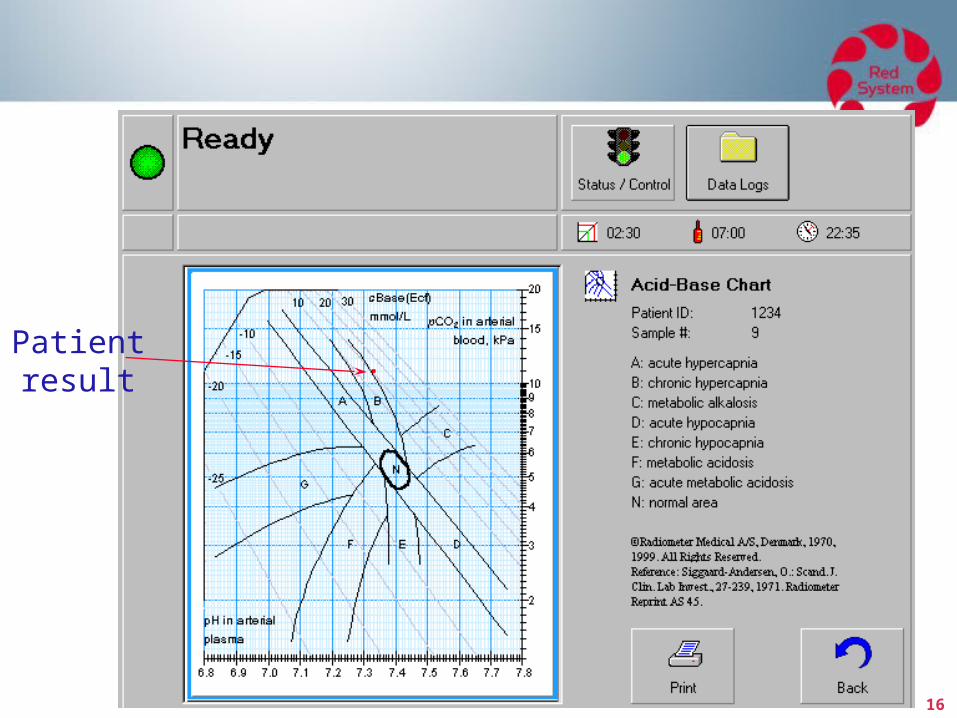
The Siggaard-Andersen Acid-Base Chart
• Illustrating pCO2
pH standard base excess,SBE, cBase(ecf)
• Tool for fast interpretation of acid-base status illustrates metabolic and respiratory conditions
differentiates between acute and chronic cases
gives a reading of SBE
3
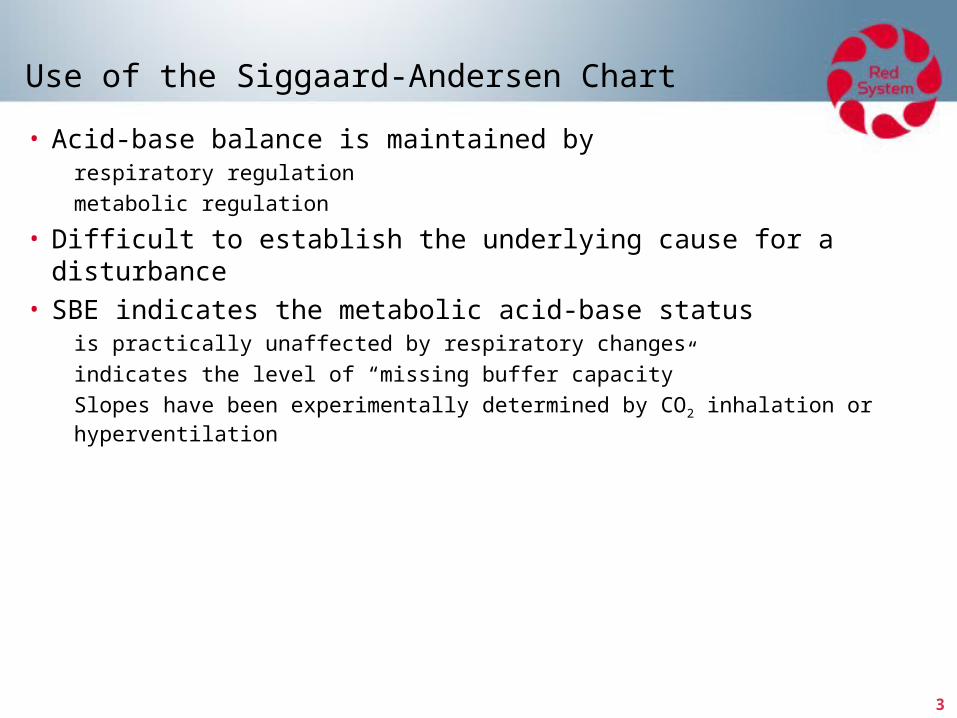
Use of the Siggaard-Andersen Chart
• Acid-base balance is maintained by respiratory regulation metabolic regulation
• Difficult to establish the underlying cause for a disturbance • SBE indicates the metabolic acid-base status
is practically unaffected by respiratory changes indicates the level of “missing buffer capacity” Slopes have been experimentally determined by CO2 inhalation or
hyperventilation
4
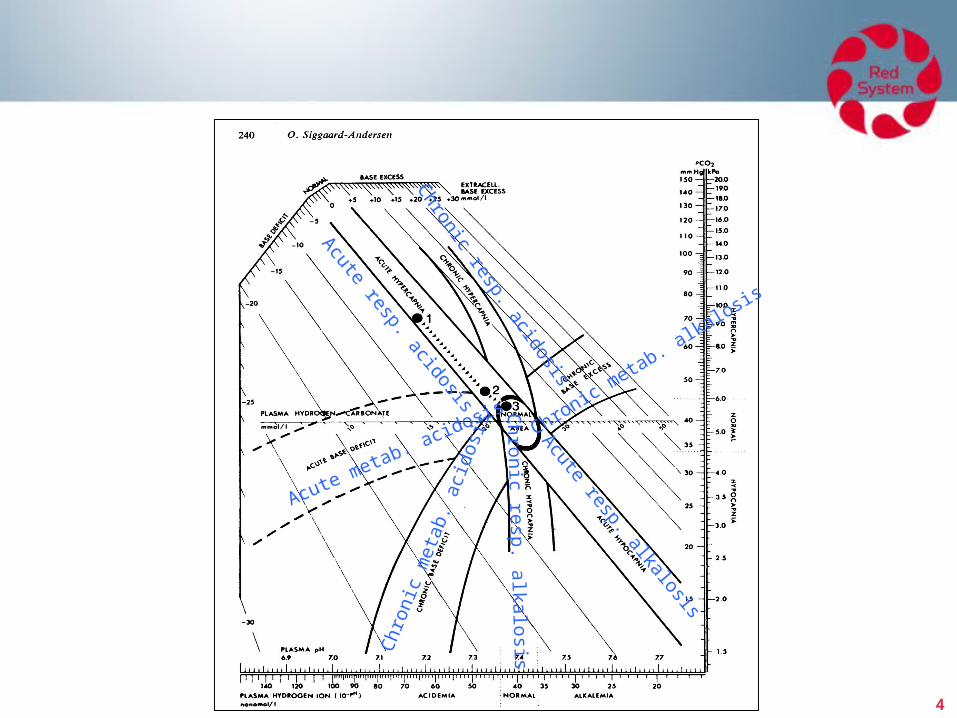
Acute resp. alkalosis
Acute resp. acidosisAcute metab. acidosis Chronic m
etab. alkalosis
Chronic resp. a
lkalosisC
hron
ic m
etab
. aci
dosi
s
Chronic resp. acidosis
5
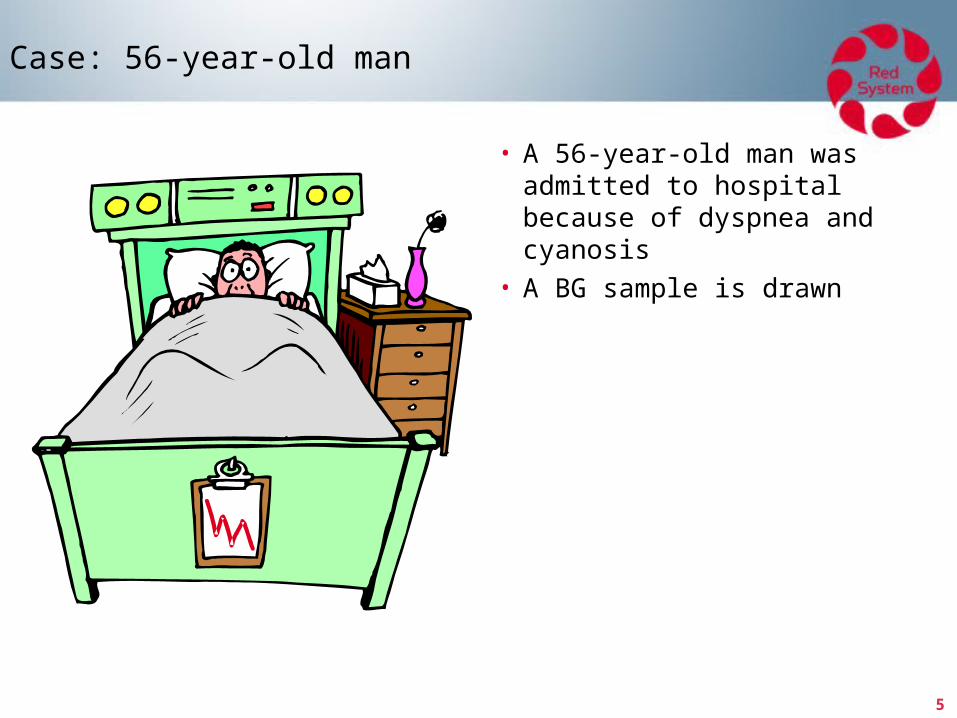
Case: 56-year-old man
• A 56-year-old man was admitted to hospital because of dyspnea and cyanosis
• A BG sample is drawn
6
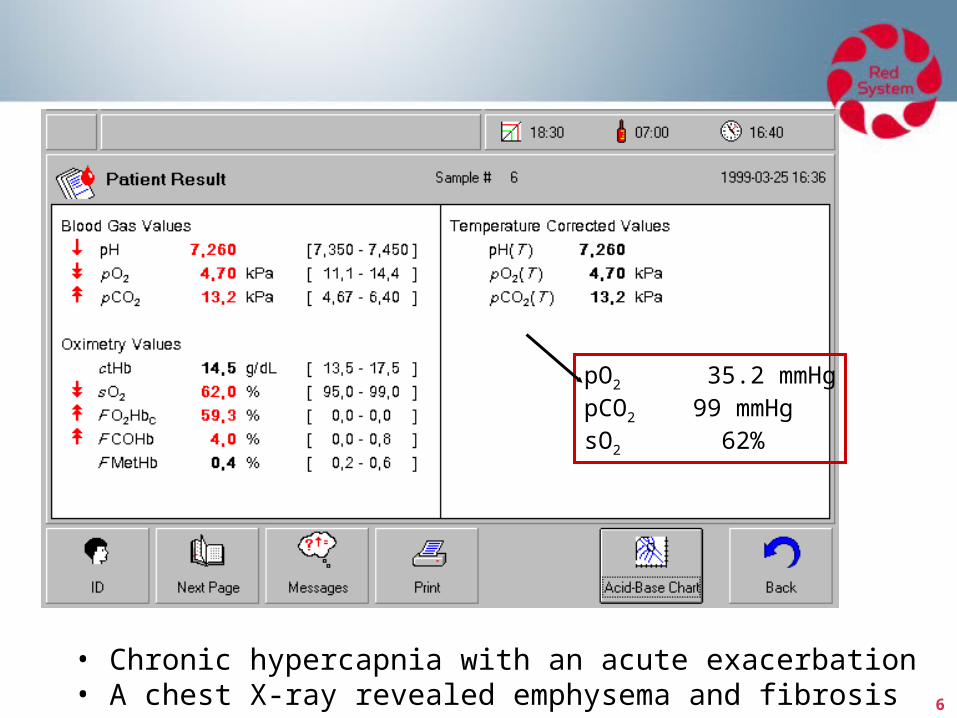
• Chronic hypercapnia with an acute exacerbation• A chest X-ray revealed emphysema and fibrosis
pO2 35.2 mmHgpCO2 99 mmHgsO2 62%
7
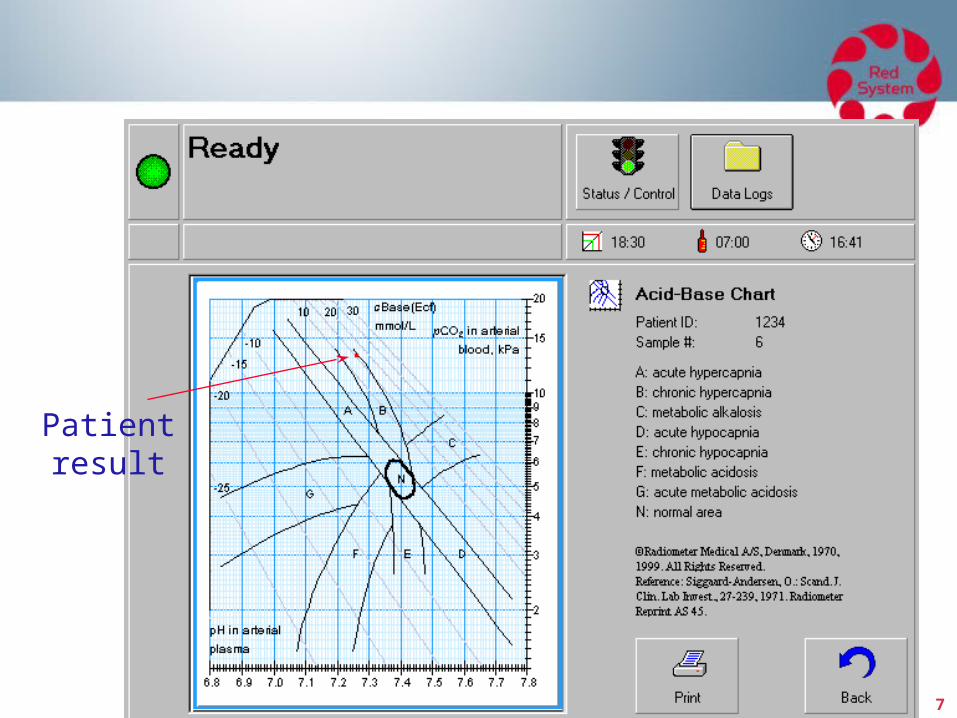
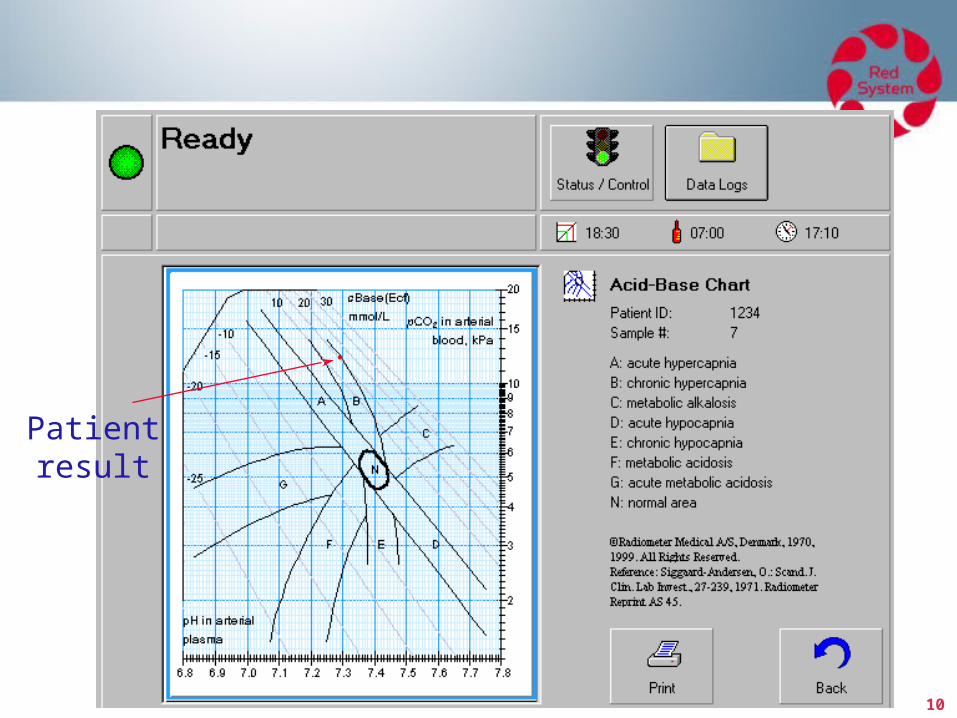
Patientresult
8
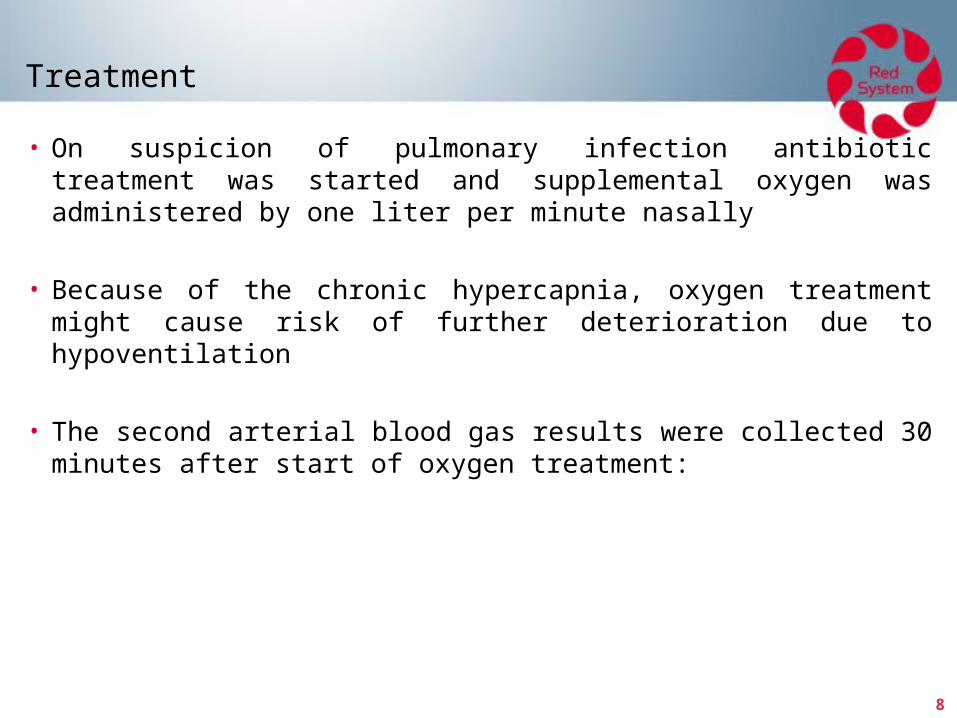
Treatment
• On suspicion of pulmonary infection antibiotic treatment was started and supplemental oxygen was administered by one liter per minute nasally
• Because of the chronic hypercapnia, oxygen treatment might cause risk of further deterioration due to hypoventilation
• The second arterial blood gas results were collected 30 minutes after start of oxygen treatment:
9
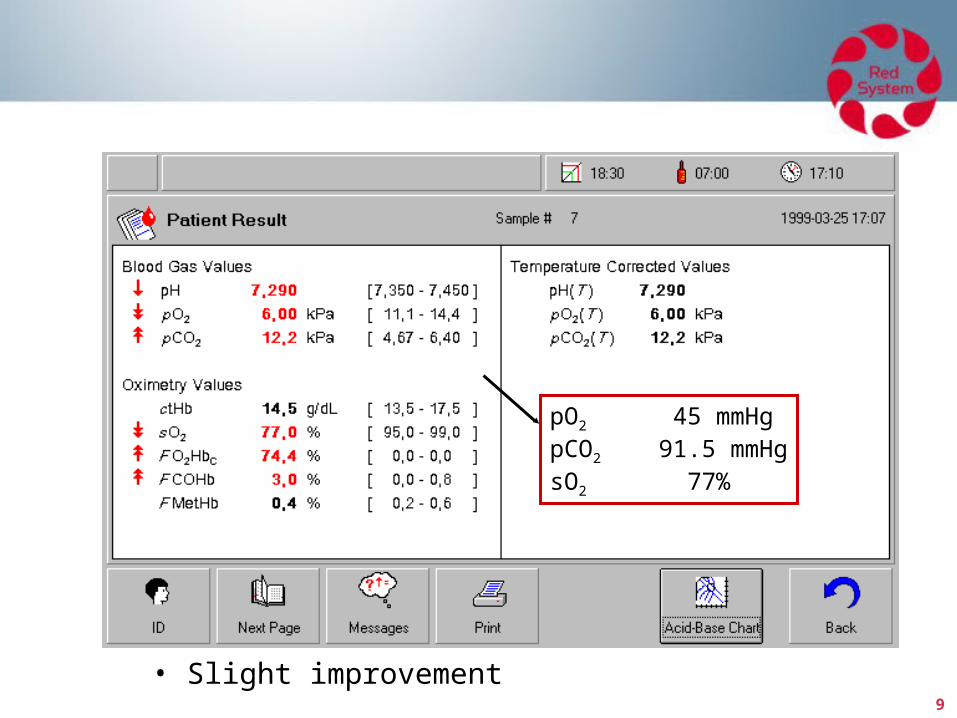
• Slight improvement
pO2 45 mmHgpCO2 91.5 mmHgsO2 77%
10
Patientresult
11
Treatment
• The oxygen supply was increased to two liters per minute
• Another 30 minutes later the third blood gas status was measured:
12
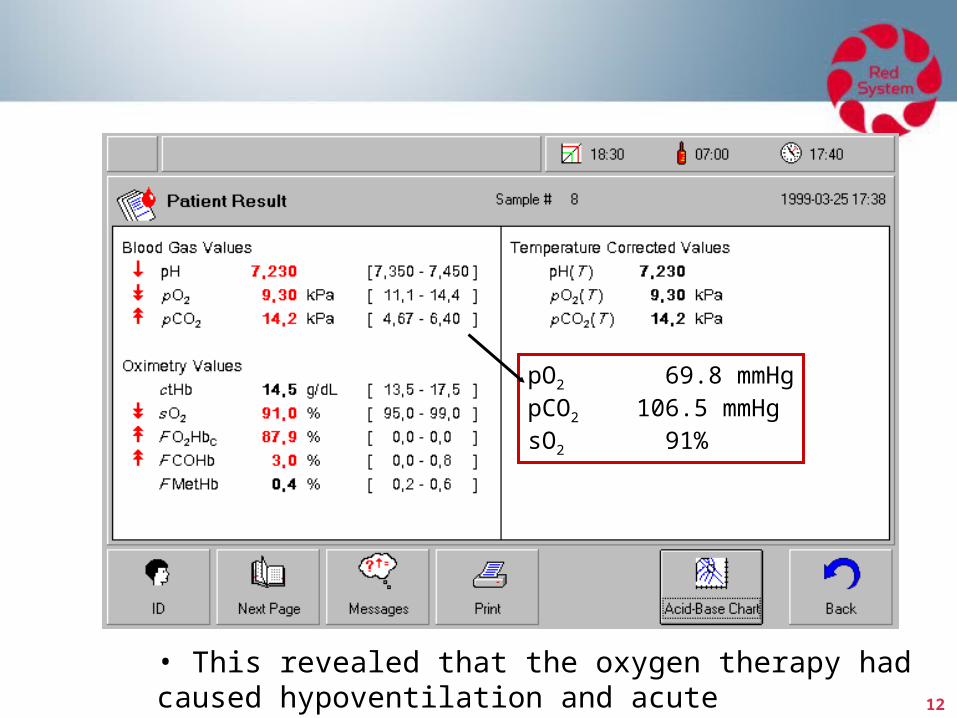
• This revealed that the oxygen therapy had caused hypoventilation and acute hypercapnia
pO2 69.8 mmHgpCO2 106.5 mmHgsO2 91%
13
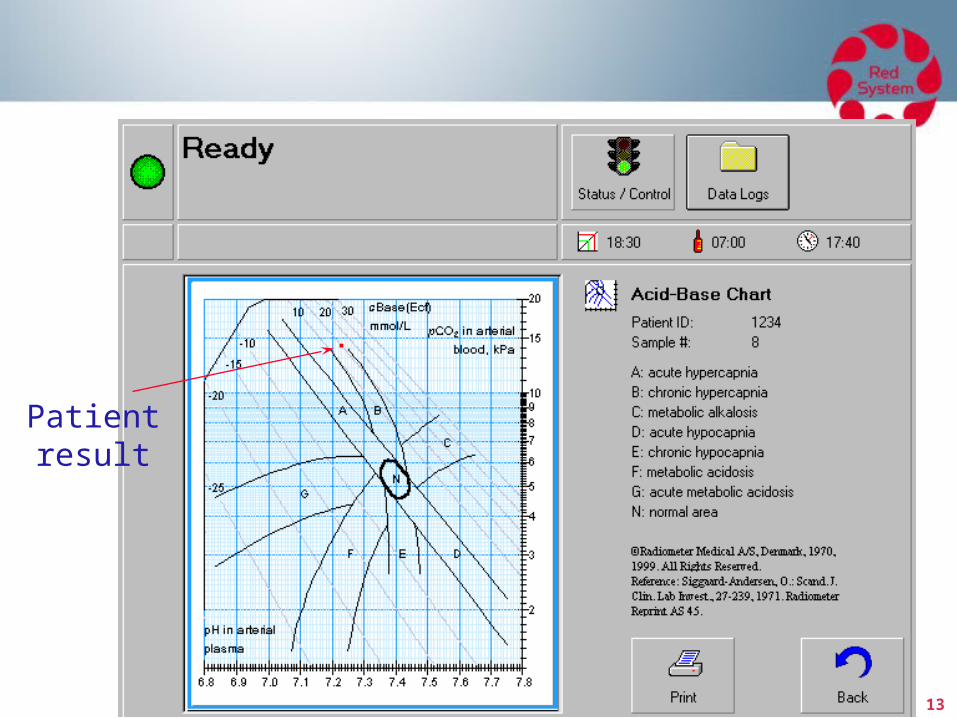
Patientresult
14
Treatment
• The oxygen flow was therefore decreased to one liter per minute again
• During the next hours the arterial blood gas status gradually improved
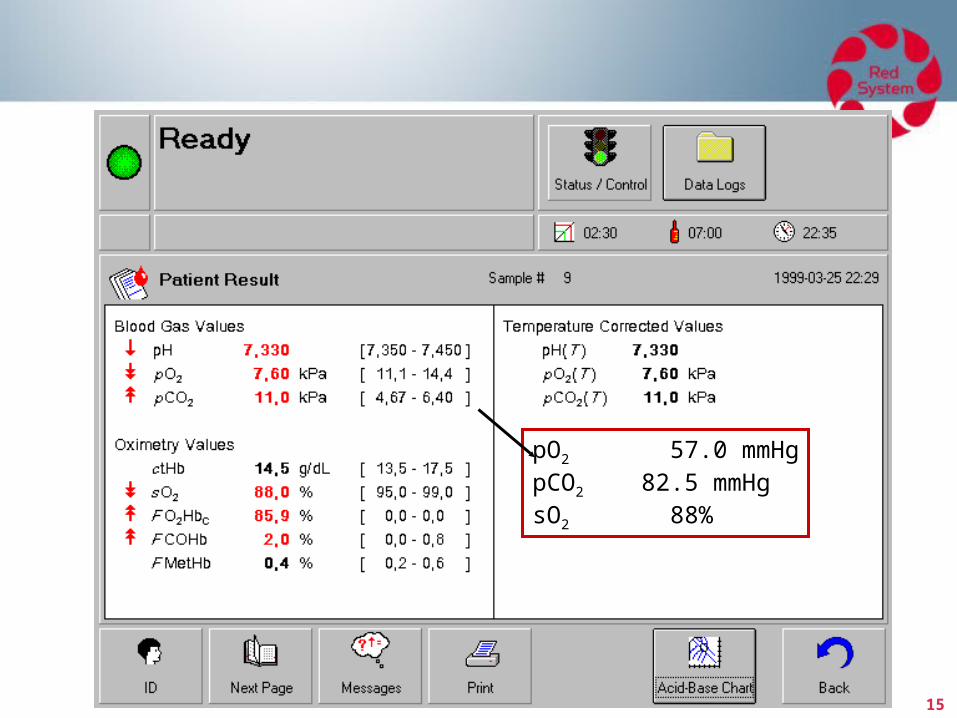
• Six hours after admission, the patient’s blood gas status turned out to be:
15
pO2 57.0 mmHgpCO2 82.5 mmHgsO2 88%
16
Patientresult
17
Conclusion - Acid-Base Chart
• This case shows the importance of fast and correct interpretation of the acid-base status
• If the chronic component of the initial arterial blood gas status had been misjudged, the patient would have been given more supplemental oxygen, and this could have caused severe hypoventilation or even respiratory arrest

18Radiometer Medical ApS, Åkandevej 21, DK-2700 Brønshøj, Tel: +45 38 27 38 27, www.radiometer.com