Embed Size (px)
Citation preview
1
R.12-03-014: LTPP Track II Workshop – Operating Flexibility Modeling Results
Patrick Young Analyst, Generation & Transmission Planning
California Public Utilities Commission
August 26, 2013

2
Remote Access
2
Call in:
Phone #: 866-812-8481 Passcode: 9058288#
Remember to use *6 on your phone to mute or unmute: Upon entry to the call, please place yourself on mute, and remain on mute unless you are asking a question
WebEx:
Meeting Number: 748 742 472 Meeting Password: LTPP
https://van.webex.com/van/j.php?ED=217130507&UID=491292852&PW=NNTYyYTRhMmM0&RT=MiM0
33
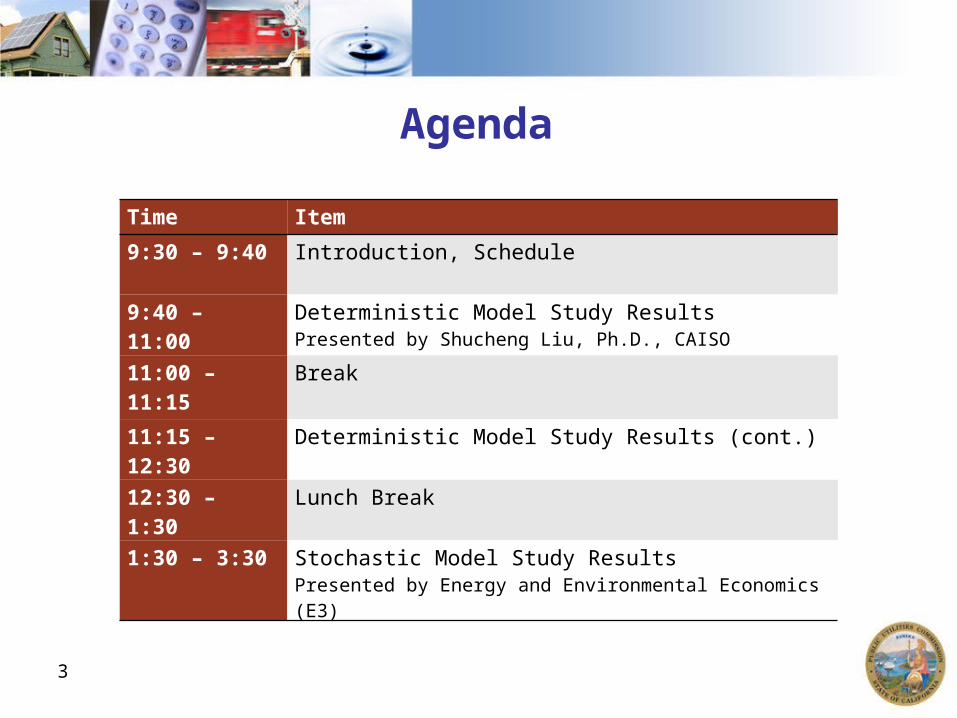
Agenda
Time Item
9:30 – 9:40 Introduction, Schedule
9:40 – 11:00 Deterministic Model Study Results Presented by Shucheng Liu, Ph.D., CAISO
11:00 – 11:15 Break
11:15 – 12:30 Deterministic Model Study Results (cont.)
12:30 – 1:30 Lunch Break
1:30 – 3:30 Stochastic Model Study ResultsPresented by Energy and Environmental Economics (E3)
44
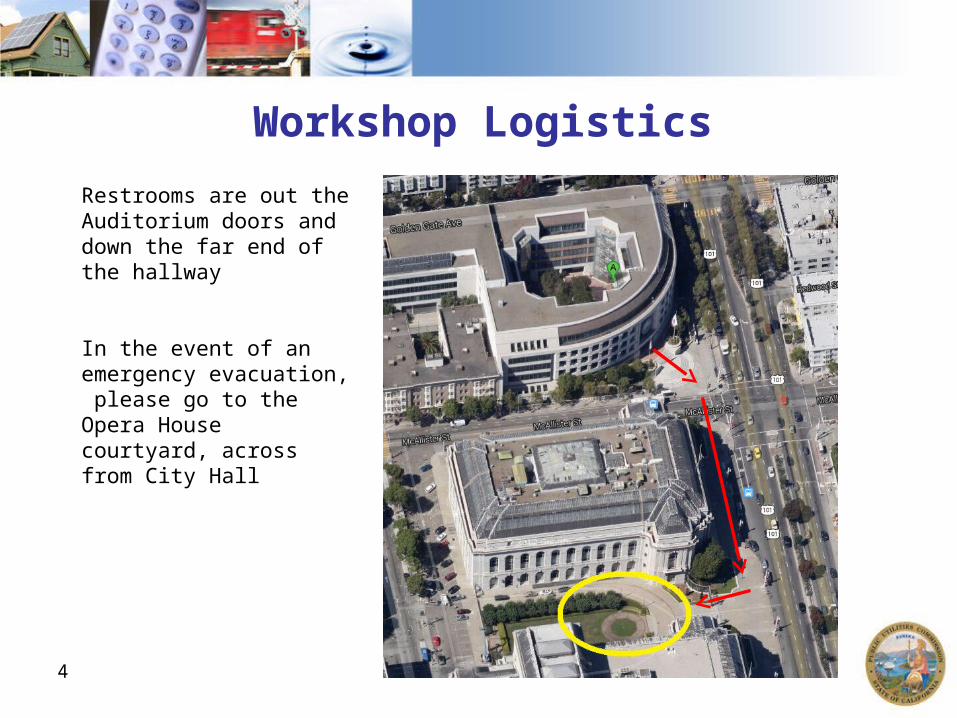
Workshop Logistics
Restrooms are out the Auditorium doors and down the far end of the hallway
In the event of an emergency evacuation, please go to the Opera House courtyard, across from City Hall

55
LTPP ScheduleAugust
26 Track II Workshop: ISO Operational Flexibility modeling resultsTrack IV Opening Testimony due: SCE LCR modeling results
September
4 Prehearing Conference: Track II and Track IV procedural issues
18 Track II Workshop: SCE Operational Flexibility modeling results
20 Track II Opening Testimony due: ISO and SCE
23 Track IV Opening Testimony due: All other Parties
October
7 Track IV Rebuttal Testimony due: All Parties Track IV: Last day to request evidentiary hearings
Late Oct. Track IV: Evidentiary hearings if necessary
November
1 Track II Opening Testimony due: All other Parties
15 Track II Rebuttal Testimony due: All Parties
6
Thank you!For Additional Information:
http://www.cpuc.ca.gov/PUC/energy/Procurement/LTPP/ltpp_history.htm

Review of Scenario Assumptions and Deterministic Results
CPUC LTPP Track 2 Workshop
August 26, 2013
Shucheng Liu, Ph.D.
Principal, Market Development
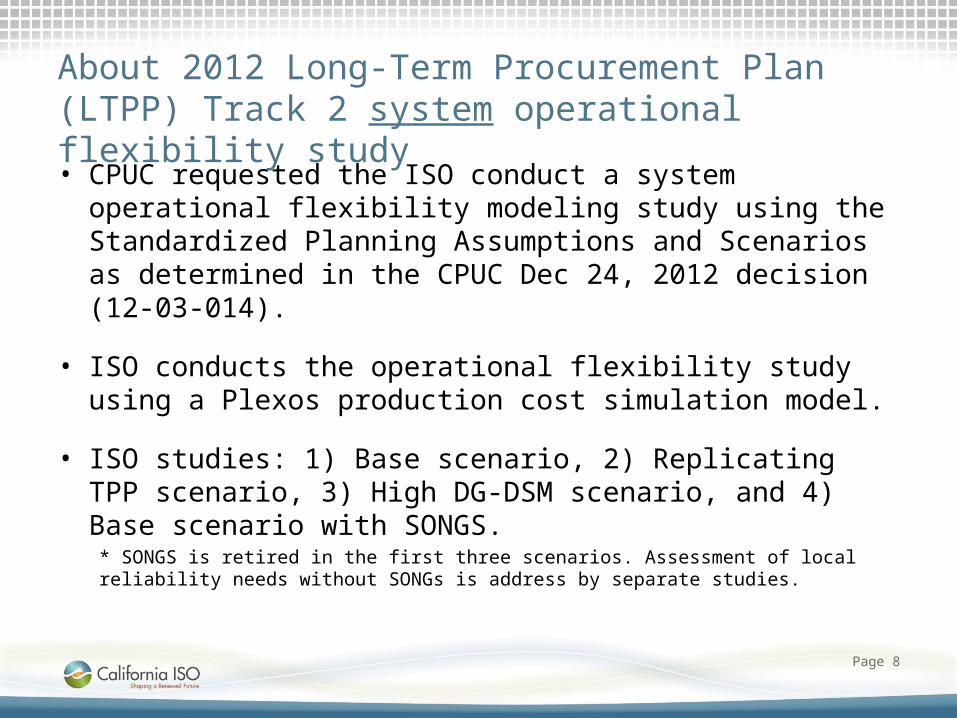
About 2012 Long-Term Procurement Plan (LTPP) Track 2 system operational flexibility study
• CPUC requested the ISO conduct a system operational flexibility modeling study using the Standardized Planning Assumptions and Scenarios as determined in the CPUC Dec 24, 2012 decision (12-03-014).
• ISO conducts the operational flexibility study using a Plexos production cost simulation model.
• ISO studies: 1) Base scenario, 2) Replicating TPP scenario, 3) High DG-DSM scenario, and 4) Base scenario with SONGS.
* SONGS is retired in the first three scenarios. Assessment of local reliability needs without SONGs is address by separate studies.
Page 8
Agenda
• Model data sources
• Scenario assumption comparison
• Preliminary deterministic simulation results
Page 9
Model Data Sources
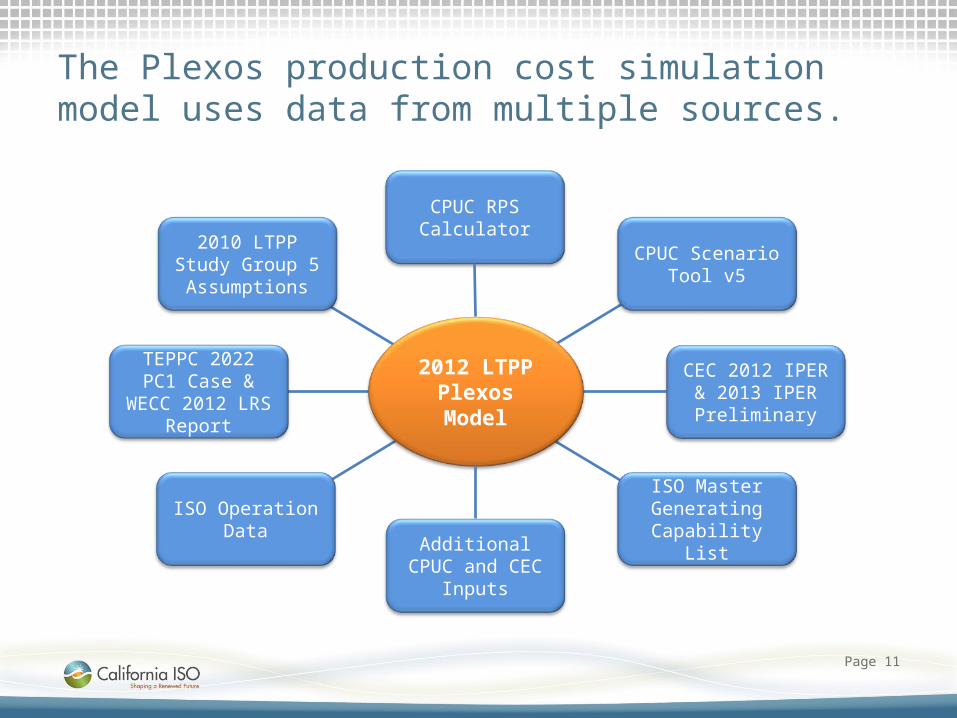
The Plexos production cost simulation model uses data from multiple sources.
Page 11
CPUC RPS Calculator
2012 LTPP Plexos Model
2010 LTPPStudy Group 5Assumptions
CPUC Scenario Tool v5
CEC 2012 IPER & 2013 IPER Preliminary
TEPPC 2022 PC1 Case & WECC
2012 LRS Report
ISO Master Generating
Capability List
ISO Operation Data
Additional CPUC and CEC Inputs

Load forecasts and load shapes are drawn from several data sources.
Page 12
ISO 2009-2011 Pump Load
Profiles
CPUC Scenario Tool v5
TEPPC 2022 PC1 Case & WECC
2012 LRS Report
WECC All Load Shapes
CEC 2012 IPER
CA Load Forecast & Incremental
Adjustment
Outside CALoad Forecast
CA Load Profiles
Outside CALoad Profiles
Load Forecast (MW)
Region Load Forecast* Inc. EE**Small PV Self-Generation**
Inc Small PV** Addl Adjt***Pumping Load****
Total Load
IID 1,196 -102 0 0 0 0 1,094LDWP 7,705 -1,094 0 0 0 0 6,611PG&E_BAY 9,916 -484 276 0 0 0 9,708PG&E_VLY 14,499 -707 350 0 0 -417 13,725SCE 26,294 -1,593 552 0 -19 -638 24,596SDGE 5,536 -318 186 0 -5 0 5,398SMUD 5,152 -591 0 0 0 -85 4,477TIDC 648 0 0 0 0 0 648CAISO 56,245 -3,103 1,364 0 -24 -1,055 53,427CA 70,946 -4,890 1,364 0 -24 -1,140 66,256
Load Forecast (GWh)
Region Load Forecast* Inc. EE**Small PV Self-Generation**
Inc Small PV** Addl Adjt***Pumping Load****
Total Load
IID 4,533 -278 0 0 0 0 4,255LDWP 32,942 -2,718 0 0 0 0 30,224PG&E_BAY 52,945 -2,590 891 0 0 0 51,246PG&E_VLY 66,565 -3,256 1,131 0 0 -5,076 59,364SCE 117,073 -7,464 1,688 0 0 -6,894 104,403SDGE 25,700 -1,473 531 0 0 -5 24,753SMUD 20,211 -1,717 0 0 0 -555 17,939TIDC 2,900 0 0 0 0 0 2,900CAISO 262,283 -14,783 4,240 0 0 -11,975 239,766CA 322,869 -19,496 4,240 0 0 -12,530 295,083
* CEC 2012 IPER Form 1.5a and 1.5b** CPUC Scenario Tool V4 and CEC IPER 2013 Preliminary. Samll- PV Self-Generation MW is output at peak-load hour of each region.*** CPUC Dec 24, 2012 decision**** CPUC Scenario Tool V4 and 2009-2011 average of ISO operation data. MW values are pump loads at peak load hours of the regions.

California renewable generation portfolios follow the CPUC scenario definitions.
Page 13
CPUC Renewable Generation
Shapes
CA Renewable Generation
Profiles
CPUC RPS Calculator
TEPPC 2022 PC1 Case &
WECC 2012 LRS Report
Outside CARenewable Generation
Profiles
CA Resources portfolios

Generation resource information is primarily taken from TEPPC 2022 PC1 Case.
Page 14
CPUC Scenario Tool v4
TEPPC 2022 PC1 Case & WECC
2012 LRS Report
CA Resources &
Characteristics
Outside CAResources &
Characteristics
ISO Master Generating
Capability List
CA Demand
Response
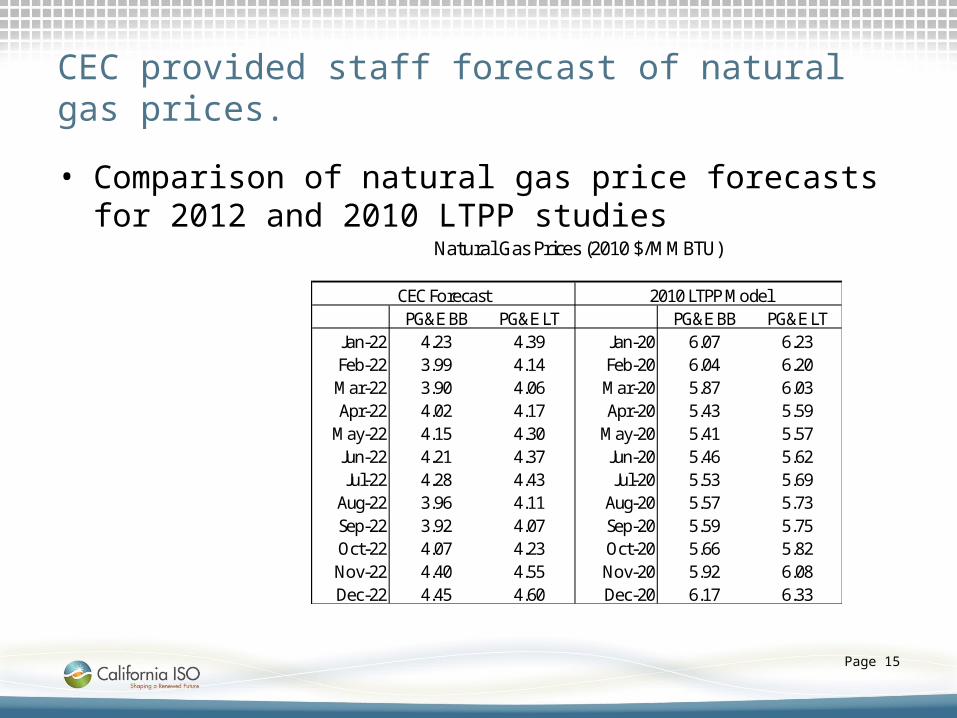
CEC provided staff forecast of natural gas prices.
• Comparison of natural gas price forecasts for 2012 and 2010 LTPP studies
Page 15
Natural Gas Prices (2010 $/MMBTU)
CEC Forecast 2010 LTPP ModelPG&E BB PG&E LT PG&E BB PG&E LT
Jan-22 4.23 4.39 Jan-20 6.07 6.23Feb-22 3.99 4.14 Feb-20 6.04 6.20Mar-22 3.90 4.06 Mar-20 5.87 6.03Apr-22 4.02 4.17 Apr-20 5.43 5.59
May-22 4.15 4.30 May-20 5.41 5.57Jun-22 4.21 4.37 Jun-20 5.46 5.62Jul-22 4.28 4.43 Jul-20 5.53 5.69
Aug-22 3.96 4.11 Aug-20 5.57 5.73Sep-22 3.92 4.07 Sep-20 5.59 5.75Oct-22 4.07 4.23 Oct-20 5.66 5.82Nov-22 4.40 4.55 Nov-20 5.92 6.08Dec-22 4.45 4.60 Dec-20 6.17 6.33
Scenario Assumption Comparison
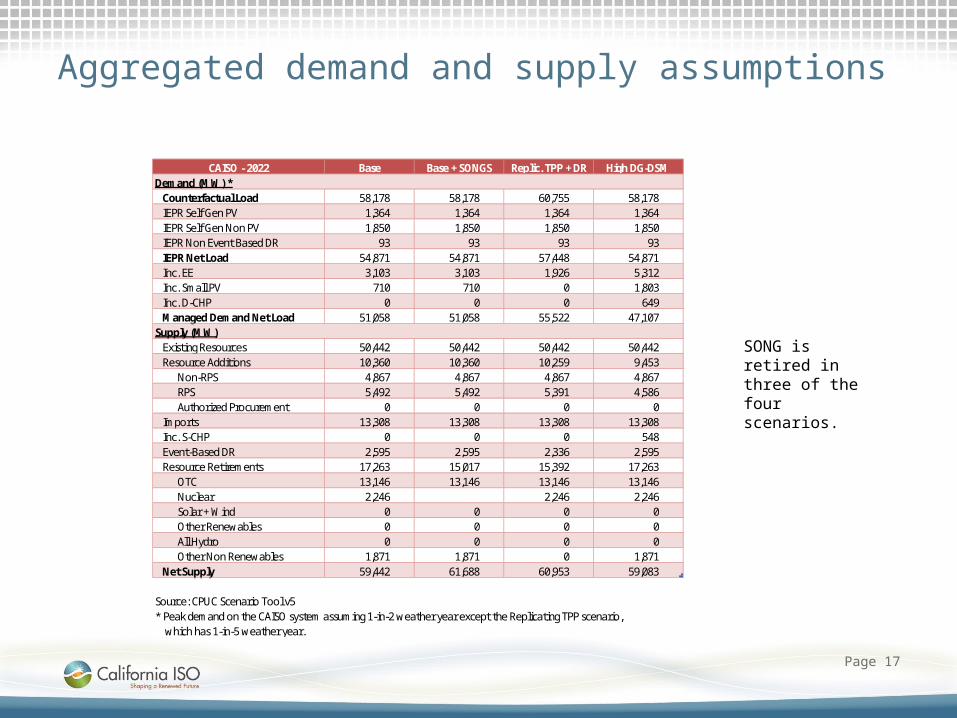
Aggregated demand and supply assumptions
Page 17
CAISO - 2022 Base Base + SONGS Replic. TPP + DR High DG-DSMDemand (MW) *
Counterfactual Load 58,178 58,178 60,755 58,178IEPR Self Gen PV 1,364 1,364 1,364 1,364IEPR Self Gen Non PV 1,850 1,850 1,850 1,850IEPR Non Event Based DR 93 93 93 93IEPR Net Load 54,871 54,871 57,448 54,871Inc. EE 3,103 3,103 1,926 5,312Inc. Small PV 710 710 0 1,803Inc. D-CHP 0 0 0 649Managed Demand Net Load 51,058 51,058 55,522 47,107
Supply (MW)Existing Resources 50,442 50,442 50,442 50,442Resource Additions 10,360 10,360 10,259 9,453
Non-RPS 4,867 4,867 4,867 4,867RPS 5,492 5,492 5,391 4,586Authorized Procurement 0 0 0 0
Imports 13,308 13,308 13,308 13,308Inc. S-CHP 0 0 0 548Event-Based DR 2,595 2,595 2,336 2,595Resource Retirements 17,263 15,017 15,392 17,263
OTC 13,146 13,146 13,146 13,146Nuclear 2,246 2,246 2,246Solar + Wind 0 0 0 0Other Renewables 0 0 0 0All Hydro 0 0 0 0Other Non Renewables 1,871 1,871 0 1,871
Net Supply 59,442 61,688 60,953 59,083
Source: CPUC Scenario Tool v5* Peak demand on the CAISO system assuming 1-in-2 weather year except the Replicating TPP scenario, which has 1-in-5 weather year.
SONG is retired in three of the four scenarios.

Base scenario load forecast and adjustments
Page 18
Base ScenarioLoad
Forecast*Inc. EE**
Embedded Small PV**
Inc CHP** Addl Adjt***Pumping Load****
Total Load
Load Forecast (MW)IID 1,196 -102 0 0 0 0 1,094LDWP 7,705 -1,094 0 0 0 0 6,611PG&E_BAY 9,916 -484 276 0 0 0 9,708PG&E_VLY 14,499 -707 350 0 0 -417 13,725SCE 26,294 -1,593 552 0 -19 -638 24,596SDGE 5,536 -318 186 0 -5 0 5,398SMUD 5,152 -591 0 0 0 -85 4,477TIDC 648 0 0 0 0 0 648CAISO 56,245 -3,103 1,364 0 -24 -1,055 53,427CA 70,946 -4,890 1,364 0 -24 -1,140 66,256
Load Forecast (GWh)IID 4,533 -278 0 0 0 0 4,255LDWP 32,942 -2,718 0 0 0 0 30,224PG&E_BAY 52,945 -2,590 891 0 0 0 51,246PG&E_VLY 66,565 -3,256 1,131 0 0 -5,076 59,364SCE 117,073 -7,464 1,688 0 0 -6,894 104,403SDGE 25,700 -1,473 531 0 0 -5 24,753SMUD 20,211 -1,717 0 0 0 -555 17,939TIDC 2,900 0 0 0 0 0 2,900CAISO 262,283 -14,783 4,240 0 0 -11,975 239,766CA 322,869 -19,496 4,240 0 0 -12,530 295,083
* CEC 2012 IPER Form 1.5a and 1.5b** CPUC Scenario Tool V5 and CEC IPER 2013 Preliminary, and Inc CHP is peak load impact at 70% capacity factor*** CPUC Dec 24, 2012 decision**** CPUC Scenario Tool V5 and 2009-2011 average of ISO operation data. MW values are pump loads at peak load hours of the regions.
* CEC 2012 IPER Form 1.5a and 1.5b. Base and High DG-DSM scenarios have 1-in-2 weather year while Replicating TPP scenario has 1-in-5 weahter year** CPUC Scenario Tool V5 and CEC IPER 2013 Preliminary, and Inc CHP is peak load impact at 70% capacity factor*** CPUC Dec 24, 2012 decision**** CPUC Scenario Tool V5 and 2009-2011 average of ISO operation data. MW values are pump loads at peak load hours of the regions.

High DG-DSM scenario load forecast and adjustments
Page 19
High DG-DSM ScenarioLoad
Forecast*Inc. EE**
Embedded Small PV**
Inc CHP** Addl Adjt***Pumping Load****
Total Load
Load Forecast (MW)IID 1,196 -126 0 -11 0 0 1,059LDWP 7,705 -1,351 0 -81 0 0 6,274PG&E_BAY 9,916 -915 276 -114 0 0 9,163PG&E_VLY 14,499 -1,150 350 -167 0 -417 13,114SCE 26,294 -2,711 552 -303 -19 -638 23,175SDGE 5,536 -535 186 -64 -5 0 5,117SMUD 5,152 -714 0 -49 0 -85 4,304TIDC 648 0 0 -7 0 0 641CAISO 56,245 -5,312 1,364 -649 -24 -1,055 50,569CA 70,946 -7,502 1,364 -797 -24 -1,140 62,847
Load Forecast (GWh)IID 4,533 -334 0 -104 0 0 4,095LDWP 32,942 -3,298 0 -756 0 0 28,888PG&E_BAY 52,945 -3,855 891 -1,231 0 0 48,751PG&E_VLY 66,565 -4,847 1,131 -1,547 0 -5,076 56,226SCE 117,073 -11,040 1,688 -2,721 0 -6,894 98,106SDGE 25,700 -2,039 531 -597 0 -5 23,589SMUD 20,211 -2,043 0 -464 0 -555 17,149TIDC 2,900 0 0 -67 0 0 2,833CAISO 262,283 -21,781 4,240 -6,096 0 -11,975 226,672CA 322,869 -27,456 4,240 -7,486 0 -12,530 279,637
* CEC 2012 IPER Form 1.5a and 1.5b** CPUC Scenario Tool V5 and CEC IPER 2013 Preliminary, and Inc CHP is peak load impact at 70% capacity factor*** CPUC Dec 24, 2012 decision**** CPUC Scenario Tool V5 and 2009-2011 average of ISO operation data. MW values are pump loads at peak load hours of the regions.
* CEC 2012 IPER Form 1.5a and 1.5b. Base and High DG-DSM scenarios have 1-in-2 weather year while Replicating TPP scenario has 1-in-5 weahter year** CPUC Scenario Tool V5 and CEC IPER 2013 Preliminary, and Inc CHP is peak load impact at 70% capacity factor*** CPUC Dec 24, 2012 decision**** CPUC Scenario Tool V5 and 2009-2011 average of ISO operation data. MW values are pump loads at peak load hours of the regions.

Replicating TPP scenario load forecast and adjustments
Page 20
Replicating TPP ScenarioLoad
Forecast*Inc. EE**
Embedded Small PV**
Inc CHP** Addl Adjt***Pumping Load****
Total Load
Load Forecast (MW)IID 1,269 -73 0 0 0 0 1,196LDWP 8,032 -910 0 0 0 0 7,122PG&E_BAY 10,277 -309 276 0 0 0 10,244PG&E_VLY 15,225 -457 350 0 0 -417 14,701SCE 27,461 -973 552 0 -19 -638 26,383SDGE 5,922 -187 186 0 -5 0 5,916SMUD 5,330 -482 0 0 0 -85 4,763TIDC 677 0 0 0 0 0 677CAISO 58,885 -1,926 1,364 0 -24 -1,055 57,244CA 74,193 -3,391 1,364 0 -24 -1,140 71,002
Load Forecast (GWh)IID 4,533 -195 0 0 0 0 4,338LDWP 32,941 -2,005 0 0 0 0 30,936PG&E_BAY 52,945 -1,633 891 0 0 0 52,203PG&E_VLY 66,565 -2,419 1,131 0 0 -5,076 60,201SCE 117,073 -4,222 1,688 0 0 -6,894 107,645SDGE 25,700 -807 531 0 0 -5 25,419SMUD 20,211 -1,300 0 0 0 -555 18,355TIDC 2,900 0 0 0 0 0 2,900CAISO 262,283 -9,081 4,240 0 0 -11,975 245,468CA 322,868 -12,581 4,240 0 0 -12,530 301,997
* CEC 2012 IPER Form 1.5a and 1.5b** CPUC Scenario Tool V5 and CEC IPER 2013 Preliminary, and Inc CHP is peak load impact at 70% capacity factor*** CPUC Dec 24, 2012 decision**** CPUC Scenario Tool V5 and 2009-2011 average of ISO operation data. MW values are pump loads at peak load hours of the regions.
* CEC 2012 IPER Form 1.5a and 1.5b. Base and High DG-DSM scenarios have 1-in-2 weather year while Replicating TPP scenario has 1-in-5 weahter year** CPUC Scenario Tool V5 and CEC IPER 2013 Preliminary, and Inc CHP is peak load impact at 70% capacity factor*** CPUC Dec 24, 2012 decision**** CPUC Scenario Tool V5 and 2009-2011 average of ISO operation data. MW values are pump loads at peak load hours of the regions.

California RPS net short calculation
Page 21
All Values in GWh for the Year 2022 FormulaBase
ScenarioHigh DG-DSM
ScenarioReplicating TPP
Scenario1 Statewide Retail Sales - June 2012 IEPR12 Final 301,384 301,384 301,3842 Non RPS Deliveries (CDWR, WAPA, MWD) 12,530 12,530 12,5303 Retail Sales for RPS 3=1-2 288,854 288,854 288,8544 Additional Energy Effi ciency 19,543 27,457 19,5435 Additional Rooftop PV 2,159 5,480 2,1596 Additional Combined Heat and Power 0 7,486 07 Adjusted Statewide Retail Sales for RPS 7=3-4-5-6 267,152 248,431 267,1528 Total Renewable Energy Needed For RPS 8=7*33% 88,160 81,982 88,160
Existing and Expected Renewable Generation9 Total In-State Renewable Generation 40,305 40,305 40,30510 Total Out-of-State Renewable Generation 13,950 13,950 12,60011 Procured DG (not handled in Calculator) 1,110 1,110 1,31912 SB 1122 (250 MW of Biogas) 1,75313 Total Existing Renewable Generation for CA RPS 13=9+10+11+12 55,364 55,364 55,97614 Total RE Net Short to meet 33% RPS In 2022 (GWh) 14=8-13 32,796 26,618 32,184
Source: CPUC Scenario Tool v5

California RPS renewable portfolios
Page 22
Biomass
Geothermal
Small Hydro
Solar PVLarge Solar
PVSmall Solar
PVSolar
ThermalWind Total
Base ScenarioCapacity (MW) 1,321 3,636 1,530 1,503 5,728 2,183 2,140 9,766 27,805Energy (GWh) 9,418 21,555 7,228 2,329 13,111 4,384 4,813 25,323 88,161In-State Energy 7,815 18,468 7,189 1,507 11,284 4,384 4,813 14,422 69,881Out-State Energy 1,604 3,087 40 822 1,827 0 0 10,901 18,280
High DG-DSM ScenarioCapacity (MW) 1,318 3,159 1,530 1,503 3,966 3,961 1,525 9,467 26,428Energy (GWh) 9,397 18,114 7,228 2,329 9,167 7,869 3,375 24,502 81,983In-State Energy 7,794 15,027 7,189 1,507 7,341 7,869 3,375 13,601 63,703Out-State Energy 1,604 3,087 40 822 1,827 0 0 10,901 18,280
Replicating TPP ScenarioCapacity (MW) 1,571 3,596 1,530 1,713 5,685 2,082 2,140 9,759 28,075Energy (GWh) 11,016 21,084 7,224 2,635 12,817 4,179 4,813 24,392 88,160In-State Energy 9,568 18,180 7,188 1,718 11,184 4,179 4,813 14,402 71,232Out-State Energy 1,448 2,904 36 918 1,633 0 0 9,990 16,928

70% of out-state RPS renewable generation is imported into California in all scenarios.
• The shift from Hourly Schedule to Intra-Hour Schedule reflect combination of FERC Order 764 and Energy Imbalance Market
• The scheduling assumptions affect Regulation and Load-Following requirements calculated in Step 1
Page 23

Step 1 regulation and load following requirement calculation uses t-30 minute forecast errors.
Page 24
Solar and Wind Forecast Errors (as percentage of installed capacity)Scenario Type Persistent Hour 0<=CI<0.2 0.2<=CI<0.5 0.5<=CI<0.8 0.8<=CI<=1
Base DG PV t-30 min H12-16 1.4% 2.7% 2.4% 1.2%Base Small PV t-30 min H12-16 1.6% 4.1% 4.9% 1.5%Base Large PV t-30 min H12-16 3.0% 4.3% 3.7% 1.6%Base Solar Thermal t-30 min H12-16 4.1% 7.4% 5.7% 1.9%Base Wind t-30 min All 2.3% 2.2% 1.9% 2.1%
High DG-DSM DG PV t-30 min H12-16 0.0% 3.0% 2.8% 1.8%High DG-DSM Small PV t-30 min H12-16 3.3% 3.3% 2.8% 1.2%High DG-DSM Large PV t-30 min H12-16 3.7% 7.5% 10.4% 3.0%High DG-DSM Solar Thermal t-30 min H12-16 5.2% 9.0% 6.6% 2.1%High DG-DSM Wind t-30 min All 2.4% 2.3% 2.0% 2.2%Replicating TPP DG PV t-30 min H12-16 0.0% 2.9% 3.8% 2.2%Replicating TPP Small PV t-30 min H12-16 3.4% 2.7% 2.5% 1.0%Replicating TPP Large PV t-30 min H12-16 2.4% 5.7% 4.8% 2.4%Replicating TPP Solar Thermal t-30 min H12-16 4.1% 7.4% 5.7% 1.9%Replicating TPP Wind t-30 min All 2.2% 2.1% 1.8% 2.1%
Load Forecast Errors (standard deviation, MW)*Scenario Load Time Hour Spring Summer Fall Winter
All RTPD t-30 min All 228 333 410 252All RTD t-5 min All 103 189 258 118
* Calculated based on the ISO 2012 operation data
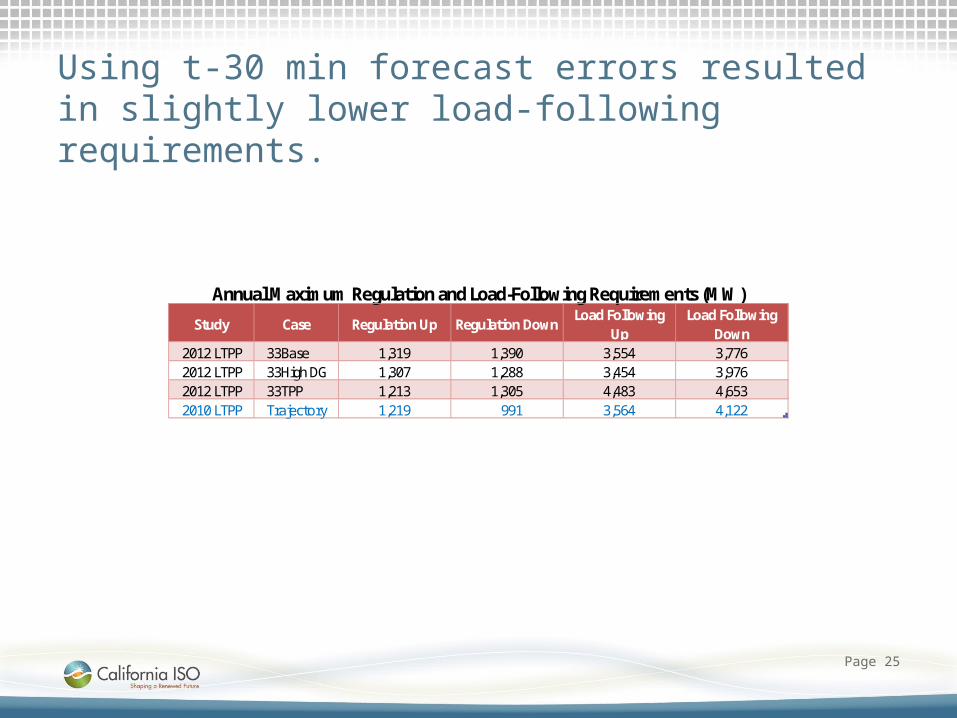
Using t-30 min forecast errors resulted in slightly lower load-following requirements.
Page 25
Annual Maximum Regulation and Load-Following Requirements (MW)
Study Case Regulation Up Regulation DownLoad Following
UpLoad Following
Down2012 LTPP 33Base 1,319 1,390 3,554 3,7762012 LTPP 33High DG 1,307 1,288 3,454 3,9762012 LTPP 33TPP 1,213 1,305 4,483 4,6532010 LTPP Trajectory 1,219 991 3,564 4,122

SCIT and California import limits
Page 26
(MW) Summer PeakSummerOff-Peak
Non-Summer Peak
Non-Summer Off-Peak
Base ScenarioSCIT Limit 13,665 10,260 11,295 8,447CA Import Limit 13,865 10,460 11,495 8,647
High DG-DSM ScenarioSCIT Limit 13,853 10,896 11,635 8,804CA Import Limit 14,053 11,096 11,835 9,004
Replicating TPP ScenarioSCIT Limit 13,692 10,575 11,356 8,505CA Import Limit 13,892 10,775 11,556 8,705

Demand response resource capacity, triggering prices, and availabilities
Page 27
CategoryPrice
($/MWh)Max Capacity
(MW)Available
HourDaily EnergyLimit (GWh)
Monthly Energy Limit (GWh)
Base and High DG-DSM ScenarioLow Cost 137 939 H12-18 3.85Mid Cost 600 939 H12-18 19.06High Cost 1,000 717 AllTotal 2,595 3.85 19.06
Replicating TPP ScenarioLow Cost 137 845 H12-18 3.47Mid Cost 600 845 H12-18 17.16High Cost 1,000 646 AllTotal 2,336 3.47 17.16
Note: The demand response assumptions were made in 2010 LTPP study and scaled proportionally to match the total capacity in the 2012 LTPP Track 2 study scenarios.

Preliminary Deterministic Simulation Results
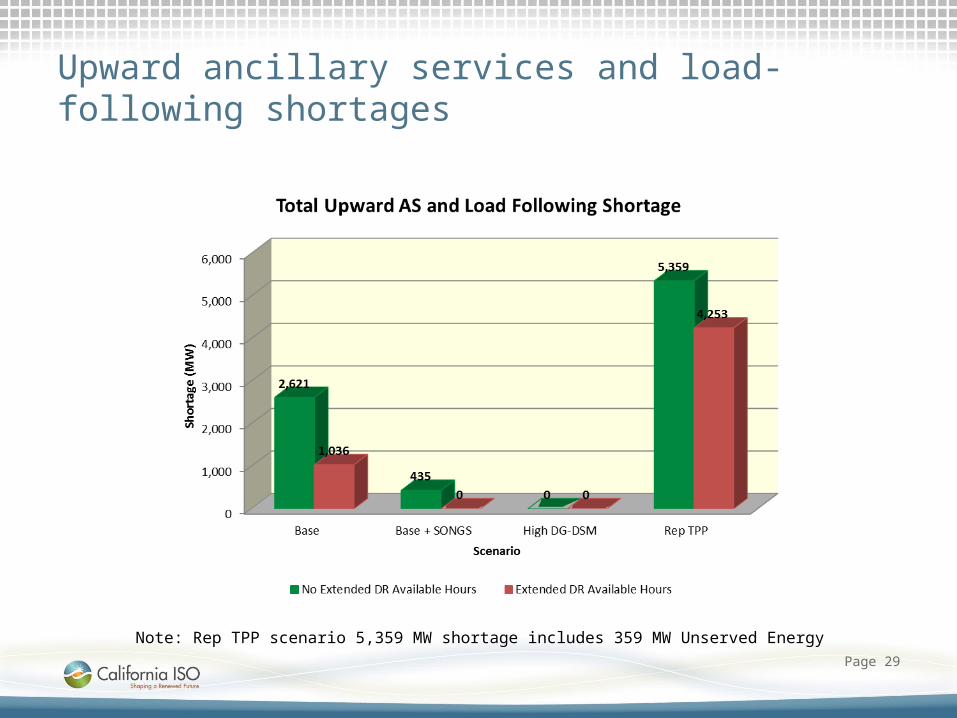
Upward ancillary services and load-following shortages
Page 29
Note: Rep TPP scenario 5,359 MW shortage includes 359 MW Unserved Energy

Number of hours with upward ancillary services and load-following shortages
Page 30

Annual CO2 emission by California generation
Page 31

Average CO2 emission from California generation
Page 32
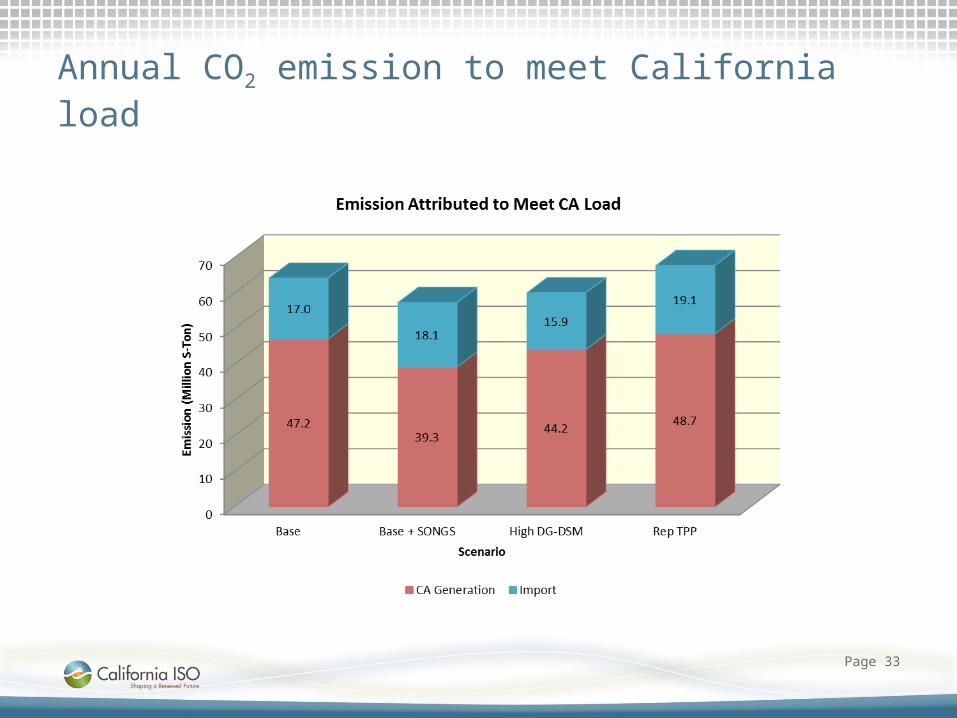
Annual CO2 emission to meet California load
Page 33
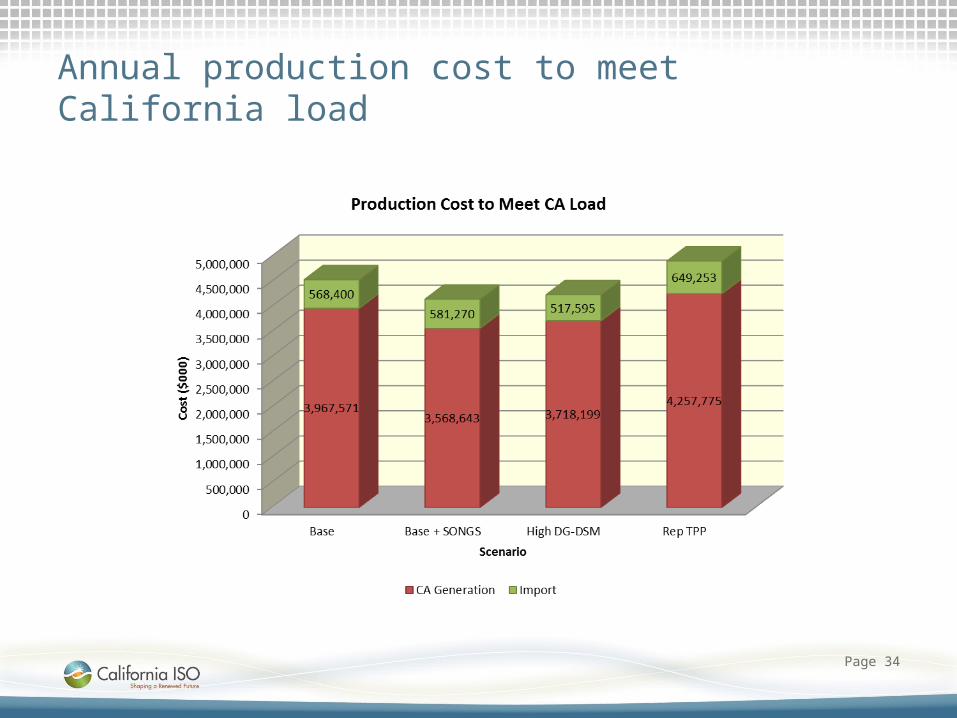
Annual production cost to meet California load
Page 34

The ISO annual total net import
Page 35

The ISO maximum net import and export
Page 36
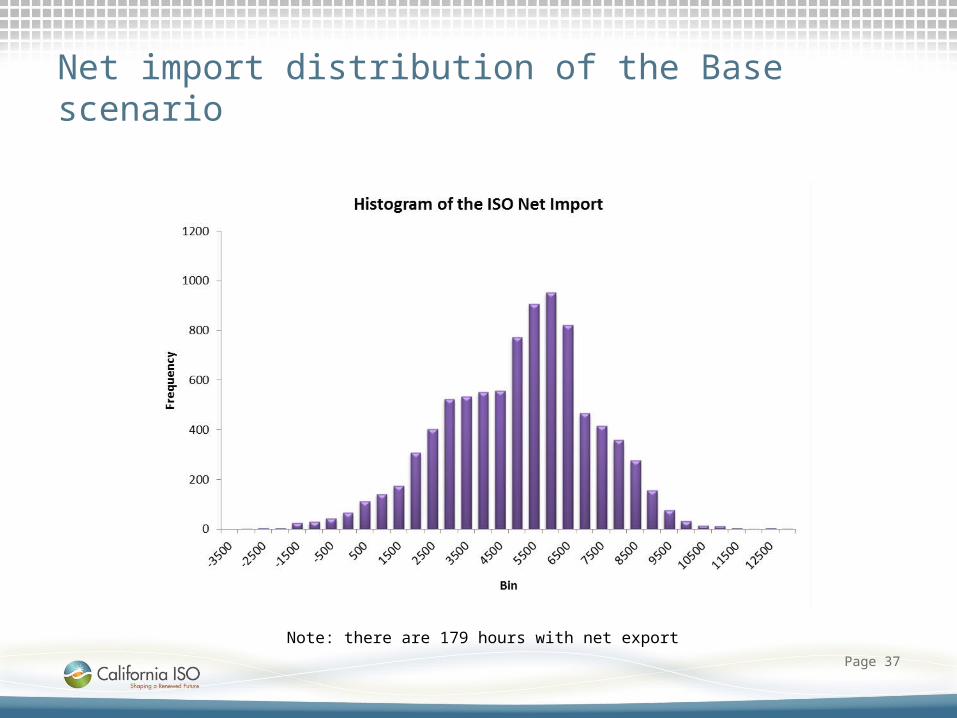
Net import distribution of the Base scenario
Page 37
Note: there are 179 hours with net export
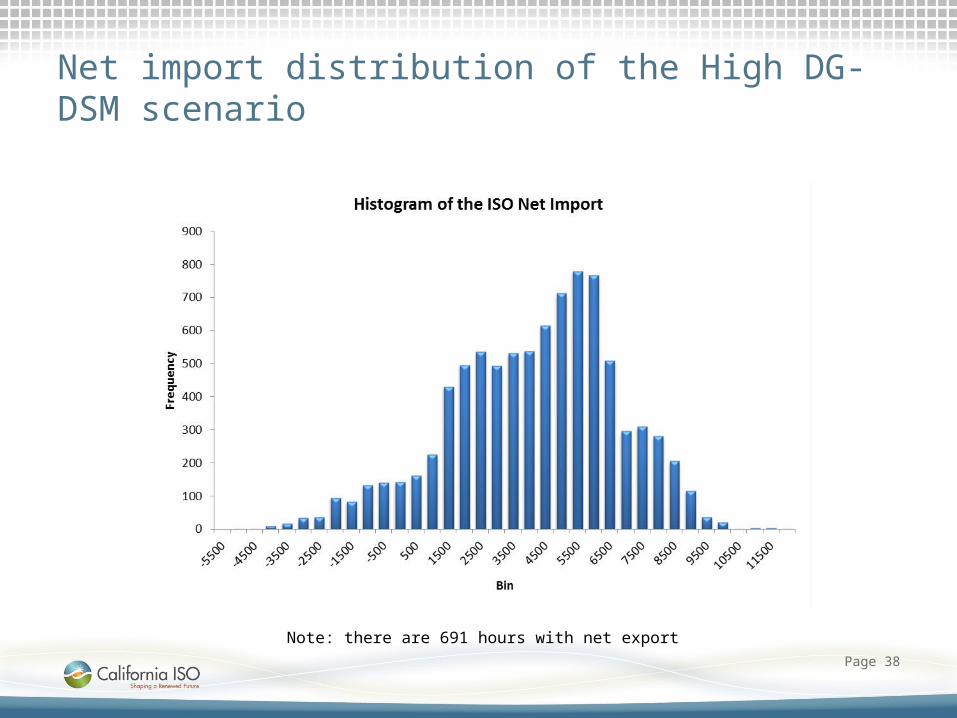
Net import distribution of the High DG-DSM scenario
Page 38
Note: there are 691 hours with net export
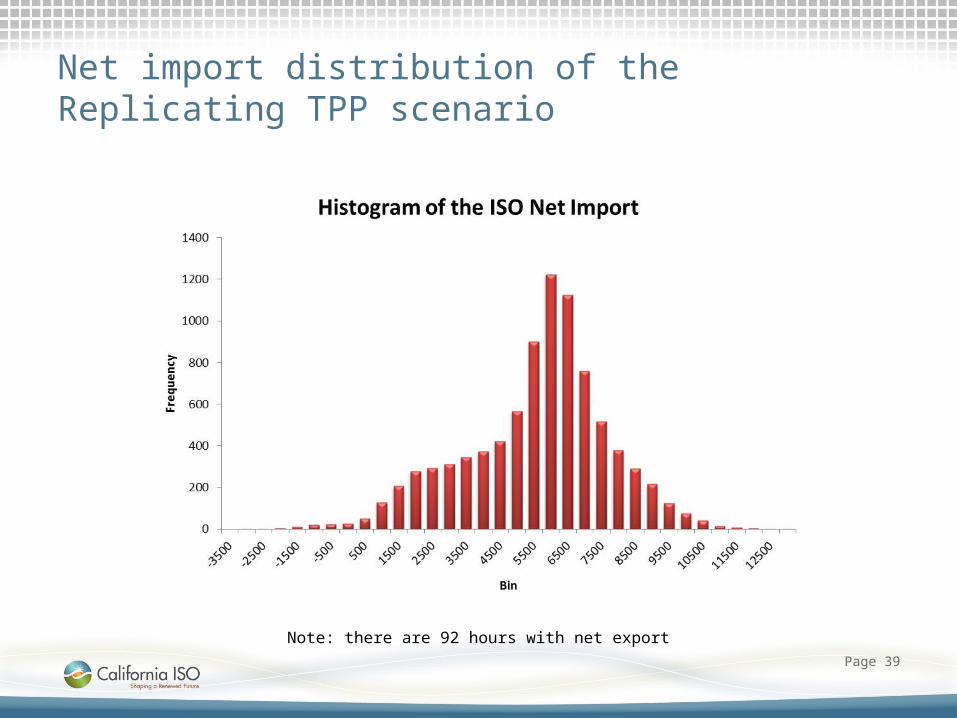
Net import distribution of the Replicating TPP scenario
Page 39
Note: there are 92 hours with net export

California annual average capacity factors of selected types of units
Page 40
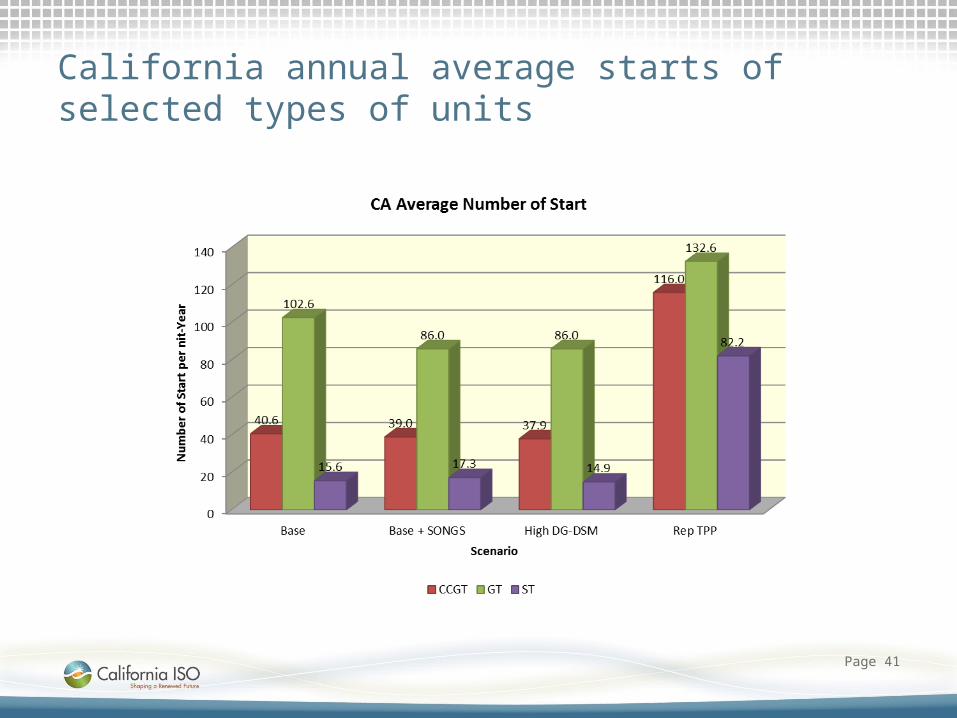
California annual average starts of selected types of units
Page 41

ISO energy balance on peak-load day in the Replicating TPP scenario
Page 42

Available capacity is insufficient on peak-load day in the Replicating TPP scenario.
Page 43
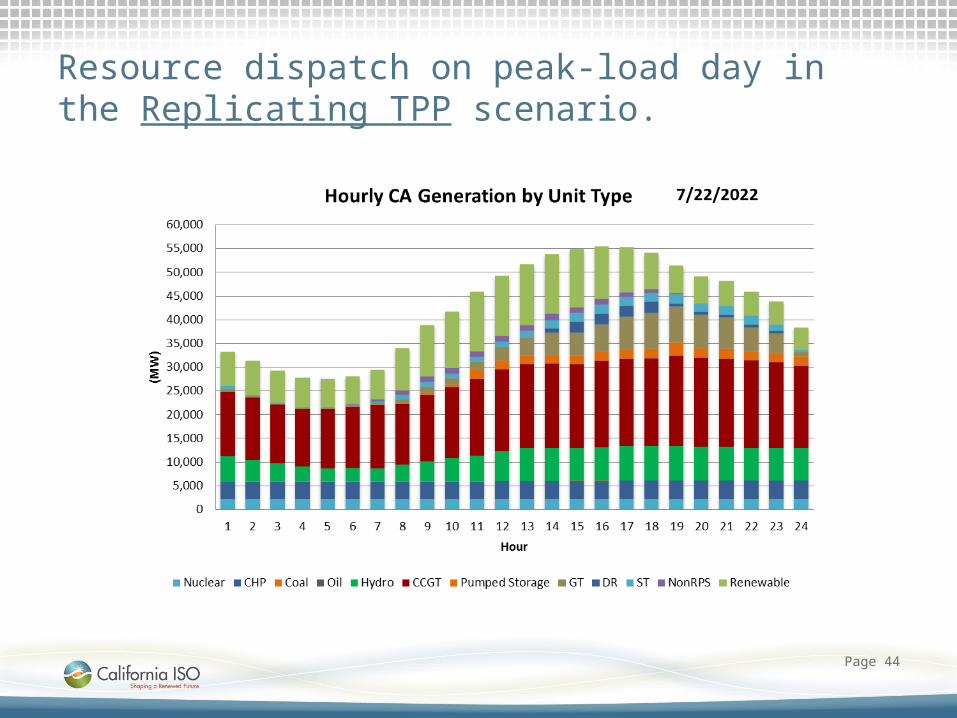
Resource dispatch on peak-load day in the Replicating TPP scenario.
Page 44
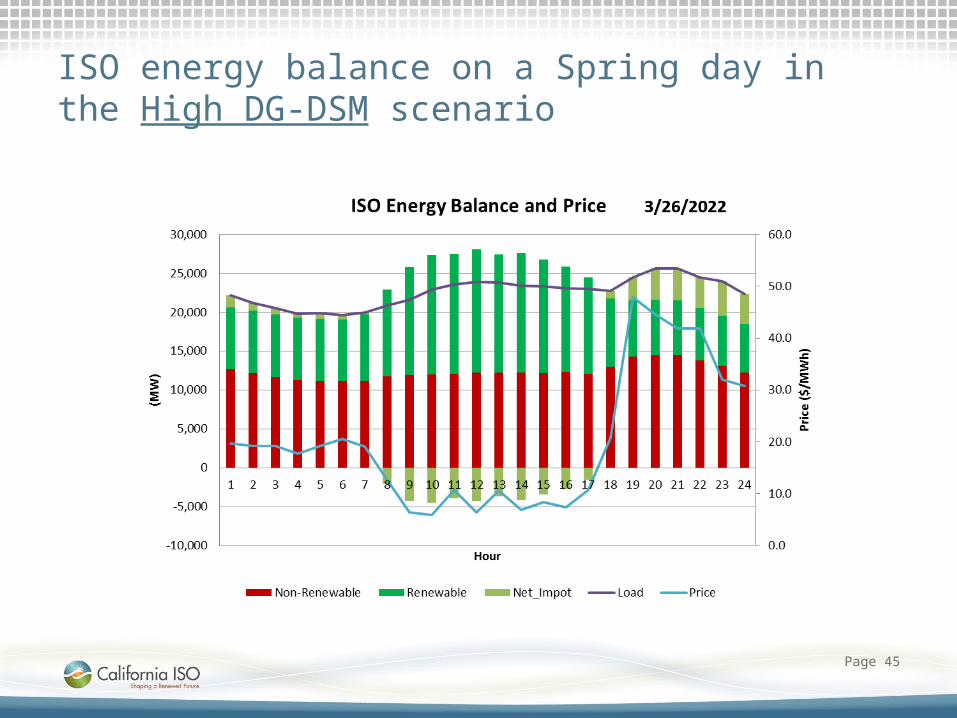
ISO energy balance on a Spring day in the High DG-DSM scenario
Page 45

Takeaway based on the preliminary results:
• Demand response program should revised to extend and reduce shortage window
• Local capacity requirements without SONGs is a separate assessment but should be considered into residual system shortage results
• Assessment of alternatives needs to be considered
Page 46