Embed Size (px)
Citation preview

Simulation of fatigue cracks propagation in a wheel plate : Application to the inspection step determination
F. BUMBIELER1, R. HAMAM1&2, S. POMMIER2, F. COCHETEUX1
1SNCF : Agence d’Essai Ferroviaire 21, avenue Salvador Allende - France - 94407 Vitry-sur-Seine 2 Laboratoire de Mécanique et Technologie – 61, Avenue du Président Wilson – France - 94 235
CACHAN Cedex
Abstract
The control of running gears of the railway rolling stock is based on three fundamental aspects : design, manufacture and maintenance. Maintenance has to define the surveillance intervals to apply in commercial service. Currently those are only defined by experience feedback. The aim of SNCF (French Railway Company) is to determine them using Fracture Mechanics concepts in order to satisfy to European interoperability of rolling stock. The present study concerns the propagation of fatigue cracks in wheel plates. The aim is to model the fatigue crack growth rate, the external loads of the wheel being the input data of the model, the output data being the length / depth evolutions of a crack subjected to these loads. The variable nature of the applied loads makes difficult the use of traditional propagation laws like the Paris law. An incremental approach, including a propagation law and a plastic blunting law, was thus developed in order to take into account the loading history. This new approach, requiring a limited number of material characterization tests, make possible to simulate the propagation of a fatigue crack in a wheel plate subjected to real solicitations (measured during test runs). This approach shows a good agreement with fatigue tests performed on specimens subjected to different types of variable amplitude loadings.
Introduction
In accordance with the UIC DT405 document [1], three great categories of railway wheel failures are usually distinguished:
• Subsurface cracks propagation due to Hertz pressure at the wheel/rail contact which can initiate shelling ;
• Radial fracture of braked wheels initiated on thermal cracks on the running surface ; • Circumferential fatigue cracks on the wheel plate ;
An example of this last case, which is the subject of the present paper, is proposed on figure 1. The initiation of such cracks are usually due to the presence of a notch on the surface created during the manufacture of the wheel (forging defects) or after ballast impacts.
Figure 1 – example of a circumferential fatigue crack on a wheel plate
Fatigue crack
Today, the inspection intervals applied in maintenance to avoid wheel fractures in commercial service are determined from the operating feedback. This method implies two unanswered questions:
• What is the safety margin of our maintenance strategy? • Is this method directly applicable on a foreign railway network (interoperability)?
To answer these two questions, SNCF Company is developing a maintenance strategy based on Linear Elastic Fracture Mechanics (LEFM) concepts. The maintenance step to apply in commercial service can be defined as the time (or the number of kilometers) needed for a fatigue crack to grow from a length a100% for which 100% of cracks can be detected with the Non Destructive Testing (NDT) used in maintenance, to a critical length ac determined from the fracture toughness of the material (figure 2). The overall methodology is detailed in the first part of this paper.
Figure 2 – definition of the inspection intervals to apply in maintenance
The main difficulty of our approach consists in the simulation of the fatigue crack growth in the wheel plate subjected to real loading conditions (variable amplitude loadings). An incremental model, presented in the second part of the paper, has therefore been developed. The last part of the paper is dedicated to the model validation including experimental results obtained on specimens subjected to various loading conditions.
Overall methodology
The first step consists in the determination of the service loads which are expressed as vertical (FQ) and transversal (FY) forces applied by the rail to the wheel. The time evolution of FQ and FY can be determined for a rolling stock during test runs representing specific traffics (straight and curved track segments, loaded or empty vehicles …). Stress tensor time evolution in the most critical parts of the wheel can then be obtained by elastic Finite Elements calculations, so that the entire life of the wheel is defined in terms of stress time evolution. This work has been done for a freight car wheel and is presented in [2]. An example of calculated radial and circumferential stress evolution at a point located in the plate / hub linking of the wheel is proposed on figure 3, for a straight track segment and loaded configuration at the speed of 120 km/h. Each fatigue cycle corresponds to one wheel rotation.
km
Fracture
ac
Crack length
Inspection interval
amin
a100%
NDT detection threshold
Detection of 100% of the defects
Critical length

Figure 3 – radial and circumferential stress versus time for a loaded freight car in straight track running The second step consists in the wheel material and crack geometry characterization. The propagation model developed needs only the knowledge of the cyclic elastic-plastic behavior law and the Paris Erdogan law (constant amplitude load) at one given load ratio R. The shape of the fatigue crack has to be defined. According to SNCF feedback, fatigue cracks that initiate on wheel plates can be considered as semi elliptical cracks. The Probability Of Detection (POD) of such cracks has to be determined for a given size and for the different NDT used in maintenance to define the a100% parameter. Benyon et al. [3] have obtained the evolution of the POD of a crack in a railway axle versus the crack depth for three different techniques: magnetic particles inspection, eddy current and ultrasonic testing, the most reliable being the magnetic particle method (figure 4). The same work has to be done for cracks in wheels.
Figure 4 – POD of a crack in a railway axle from Benyon et al. [3]
Finally a 3D Stress Intensity Factor (SIF) calculation method has to be used to calculate KI (according to our feedback, only mode 1 propagation is considered) at different points of the crack front. Then the propagation law (incremental model) can be applied to simulate the crack depth and length evolution versus kilometers and, following, the inspection interval (as explained on figure 2). The overall methodology is summarized in figure 5.
Radial Circumferential
Stress (MPa)

I ncremental model
Crack geometry material
load
3D SIF calculation
km
F racture a c
Crack length
Inspection interval
a 100% POD
Material KIC
Figure 5 – overall strategy for inspection interval determination
The incremental fatigue crack growth model
Some recent studies on fatigue cracks propagation in railway components have been published these last five years. Most of them concern axles and wheels and consider only constant amplitude loadings so that the traditional Paris Erdogan law (da/dN=C∆Keff
m, da/dN being the crack growth rate in mm/cycle, ∆Keff being the difference between the maximal value of the SIF and the opening SIF Kop, C and m being material constants) can be used ([4] for axles, [5] for wheels). To simulate the fatigue crack propagation in an axle subjected to real loading, Zerbst & al. [6] use the NASGRO expression which is a modified Paris law that describes all the sections of the da/dN - Keff diagram, not only the Paris range, and simplify the loading sequence in several blocks of various stress amplitudes with a constant loading ratio equal to -1. In the case of the wheel the real loading is much more complex than for an axle (biaxial stress state, variable R ratios) so that counting methods to define characteristic blocks are difficult to apply. Moreover, the loading history is no more guaranteed in such methods. For these reasons an incremental model has been developed so as to be able to deal directly with the time evolution loading. The incremental crack growth model used in this study has been developed by Pommier & al. [7]. This model consists in two laws, a cracking law and a blunting law, and rests on the assumption that the displacement field in the K-dominance area can be approximated as the sum of an elastic part and a plastic part. The analysis of the displacements fields by FEM gives the following expression for the total (elastic-plastic) displacement of the crack faces in the normal direction ([8] and figure 7):

( ) ( ) ρπθ σσ +== =+∞ 1., Kélastique
EFyIy rUKrU i (1)
i
IK σσ +∞ being the SIF applied to the crack, ( ) 1=Kélastique
EFy rU being the elastic displacement field for a SIF
equal to 1 and ρ the plastic blunting. Along the crack plane, and under plane strain conditions, equation (1) becomes:
( )dtdr
EdtdK
dtrdu
Iy ρπ
νπθ+
−==
241, 2
(2)
- The cracking law of the model derives from the ∆CTOD equation. It is a relationship between the crack growth rate and the crack tip blunting rate and it contains a single adjustable parameter α:
ρ
α=d a dd t d t
(3)
This law is based on the mechanism of the formation of fatigue striation on fracture surfaces as proposed by Pelloux [9] (figure 6). Pelloux suggested that Stage II fatigue crack growth occurs by plastic blunting during the tensile part of the fatigue cycle and resharpening at unloading. The crack extent is then proportional to the crack tip opening displacement (∆CTOD) which is close to the striation spacing. The main difference in our approach is that the displacement field is considered to be the sum of an elastic part and a plastic part. Only the plastic part is taken into account into eq. (3). To adjust the parameter α, one fatigue crack growth experiment at least is necessary.
Figure 6 - Fatigue striation and crack growth mechanism according to Pelloux [8] - The second part of the model is the blunting law, it gives the evolution of crack tip blunting versus the applied SIF, the material behaviour and the geometry of the cracked structure. This law is an elastic-plastic constitutive behaviour for the cracked structure. It is defined through a system of derivative equations which can be summarized as: ( ) ( )( )parametersmaterialtVtKf
dtd
It
,, int=ρ (4)
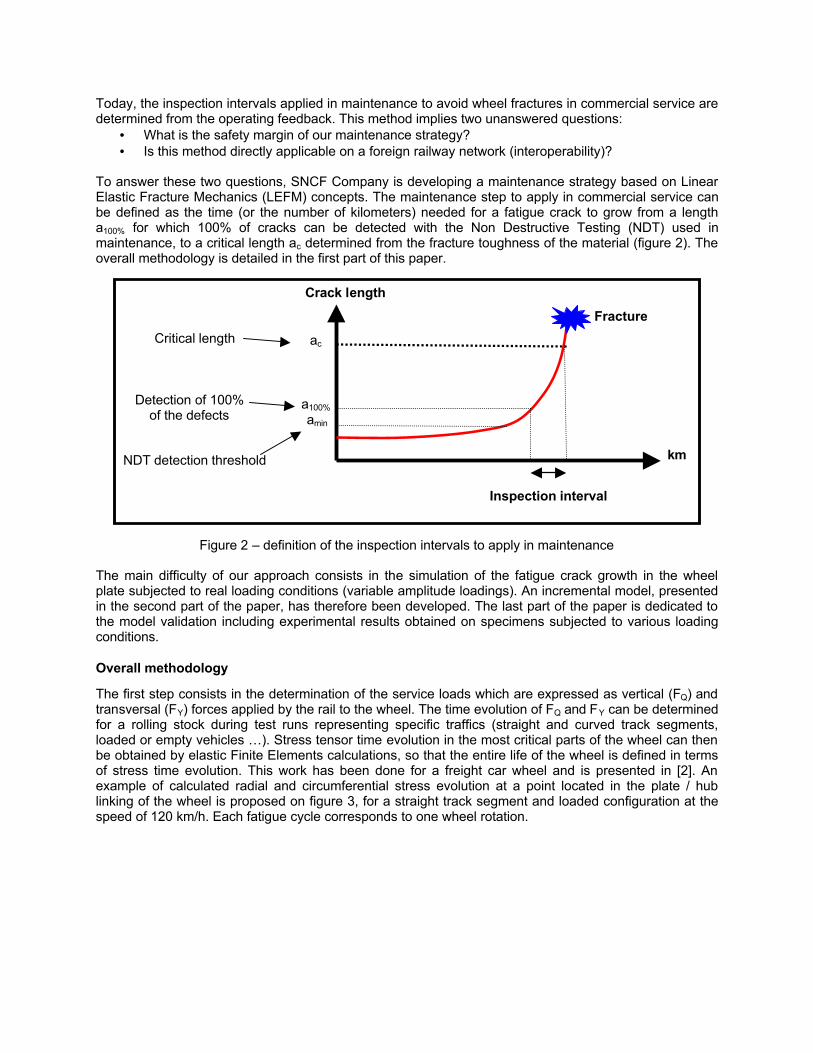
Where, Vint is a set of internal variables whose evolution laws are also provided. Blunting law equations are determined using the finite element method (FEM). Strain controlled push-pull tests have been performed, and the elastic-plastic constitutive behaviour of the material was determined. Then the FEM is employed as an unzooming technique so as to determine the elastic-plastic constitutive behaviour of the cracked structure. The finite element model employed for this purpose (Fig. 7) consists in a square sheet of 1000*1000 mm² with a centre crack of length 2a=20mm. Because of the symmetries,
only one quarter of the specimen is meshed. The mesh size in the refinement region near the crack tip is around 25 µm. Plane strain conditions are employed.
Figure 7 - Displacement of the crack faces as calculated using the finite element method
The stress applied on the finite element model is biaxial Sxx=Syy, so as to keep the T stress equal to zero. The effect of the T-stress was also analyzed but is the object of another publication [10]. For each load increment, the variation of the displacement normal to the crack plane uy is recorded from r/a=0 up to r/a=0.1 (figure 7). The best fit, according to equation (2), for dKI/dt and dρ/dt is determined using the least square method and the displacements calculated by the FEM. Figure 8 shows an example of the computation of KI and ρ , for different applied stresses. Except for the elements within the crack tip plastic zone, the approximation proposed in eq (2) appears to be appropriate. It is interesting to notice that the value of the SIF as calculated using this method is not exactly the “elastic” one because it contains also the stress intensity factor arising from internal stresses within the crack tip plastic zone. However, the difference is neglected. As a matter of fact, it typically remains below 10% of the “elastic” stress intensity factor when ρ remains below 0.7 µm. Since ρ is in the order of magnitude of a striation spacing, 0.7 µm is an upper bound for ρ.
Figure 8 - Example of computation of ρ and K I for different applied stresses, the displacement of the crack
faces as calculated using the FEM in elastic-plastic conditions, is plotted against the displacement as calculated in elastic conditions. A linear relation between them appears to be valid. KI is the slope of the
linear regression, while ρ is the coordinate at the origin. The evolution of crack tip blunting can now be plotted versus the applied SIF during a fatigue cycle (figure 9). During the first part of the curve (0à1), there is no significant variation of ρ, this part is therefore considered as an elastic domain for the cracked structure. Then the SIF increases with ρ (1à2), it is interpreted as an hardening phase, which corresponds also to the increase of the monotonic plastic zone size. If the cracked structure is unloaded, at the very beginning ρ doesn’t vary (2à3). Again this is considered as an elastic domain for the cracked structure, then plastic blunting occurs but in the reverse

direction (3à4) down to the contact point between the crack faces (point 4). If the cracked structure is now reloaded, an elastic domain is encountered (4à5), before plastic blunting occurs. In 6, the rate of “hardening” dK/dρ changes abruptly and recovers the value it had in 2. Finally, it is considered that there are two distinct regimes of plasticity, that corresponding to cyclic plasticity within the cyclic plastic zone (2à4à6) and that corresponding to the extent of the monotonic plastic zone (0à2 and 6à7). For each plastic zone, internal variables are introduced that define the position and the size of the elastic domain of the cracked structure. The “hardening phases” are defined through the evolutions of these internal variables as a function of ρ and a.
Figure 9 - Evolution of the crack tip blunting versus SIF
Therefore two yield surfaces are introduced, one for the monotonic plastic zone and one for the cyclic plastic zone. Each yield surface is defined through two internal variables, the position and the size of the elastic domain corresponding to each plastic zone. And for each internal variable, two partial derivative equations are provided, one is the derivative with respect to ρ and the other one with respect to a. The shape of the equations and the parameters in these equations are determined using the K-ρ curves generated using the FEM under various loading conditions.
Wheel material and model parameters identification
The wheel material under analysis is a ER7T ferrito-pearlitic steel defined in the EN13262 European standard. Chemical composition is given in table 1.
Maximal values (%) C Si Mn P S Cr Cu Mo Ni V Cr+Mo+Ni
0,52 0,4 0,8 0,02 0,02 0,3 0,3 0,08 0,3 0,06 0,5 Table 1 – chemical composition of the ER7T steel
Two types of tests have been necessary to identify the model parameters:
• one strain controlled push-pull test to identify the elastic-plastic constitutive behaviour of the material, which is employed in the FEM in order to derive the elastic-plastic constitutive behaviour of the cracked structure ;
• one constant amplitude fatigue crack growth experiment on a CCT specimen to adjust the parameter α in the cracking law (3).
The specimens have been taken from the plate of a TGV wheel in the radial direction. The plastic-cyclic material parameters have been identified using a Chaboche model with three non-linear kinematics hardening and one non-linear isotropic hardening terms (figure 10). A Griffith crack has been then modeled with the identified material and the crack tip blunting has been recorded versus the SIF for simple loading cases. An automated identification protocol has been developed with Abaqus code, in order to identify automatically the parameters of the constitutive equation for the cracked structure. Then the incremental model was implemented in a FORTRAN code and was employed to simulate the
constant amplitude fatigue crack growth experiment. The exponent of the Paris law as calculated using the model stems directly from the blunting law, while the C parameter should be adjusted so as to fit the experiment by tuning the parameter α in the cracking law.
Figure 10 – hardening loops for cyclic tests (simulation and experiments)
Model validation
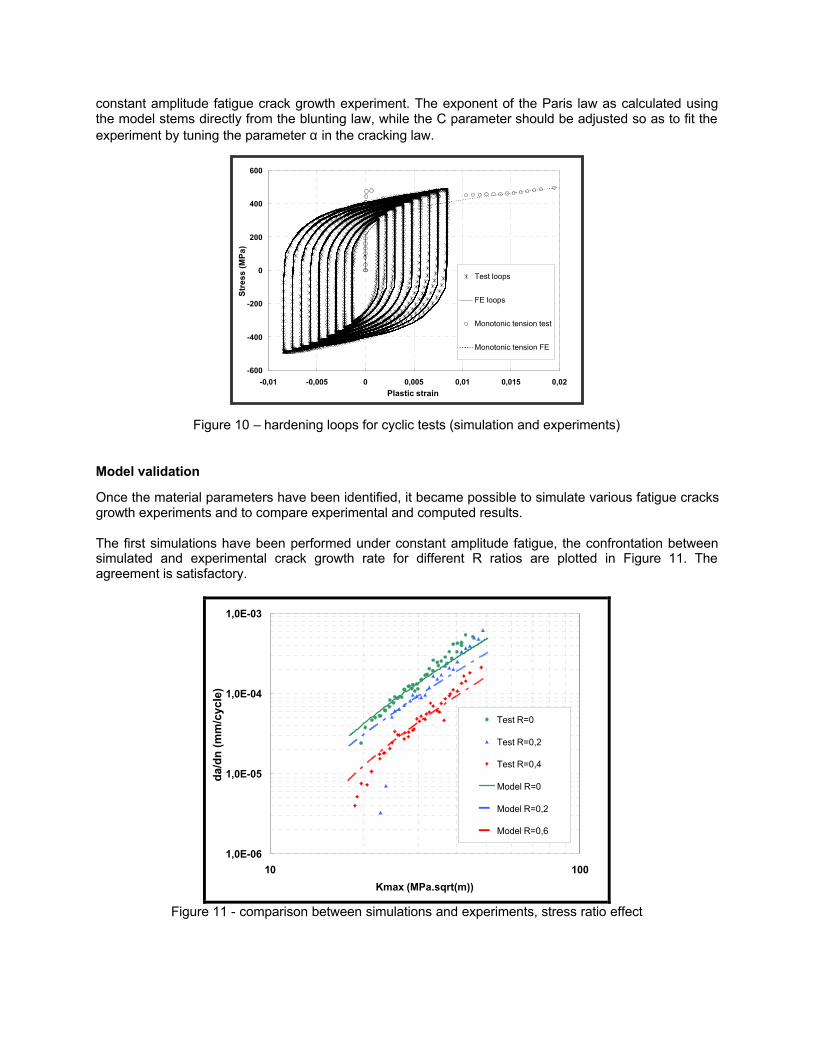
Once the material parameters have been identified, it became possible to simulate various fatigue cracks growth experiments and to compare experimental and computed results. The first simulations have been performed under constant amplitude fatigue, the confrontation between simulated and experimental crack growth rate for different R ratios are plotted in Figure 11. The agreement is satisfactory.
1,0E-06
1,0E-05
1,0E-04
1,0E-03
10 100Kmax (MPa.sqrt(m))
da/d
n (m
m/c
ycle
)
Test R=0
Test R=0,2
Test R=0,4
Model R=0
Model R=0,2
Model R=0,6
Figure 11 - comparison between simulations and experiments, stress ratio effect
-600
-400
-200
0
200
400
600
-0,01 -0,005 0 0,005 0,01 0,015 0,02Plastic strain
Stre
ss (M
Pa)
Test loops
FE loops
Monotonic tension test
Monotonic tension FE

Secondly, the retardation effect associated with a single overload was studied. The crack extent after one overload is plotted in figure 12 with an overload factor (Kpeak/Kmax) equal to 1, 1.5 and 1.8. The experimental results are compared with the simulations. The agreement is satisfactory but it seems that the retardation effect in the simulation appears earlier than in the experiments.
0
3
6
9
12
15
18
21
24
0 80000 160000 240000 320000 400000 480000Number of cycles
Cra
ck le
ngth
(mm
)
Test (without overload)
Test (overload 1,5)
Test (overload 1,8)
Model (without overload)
Model (overload 1,5)
Model (overload 1,8)
Figure 12 - comparison between simulation and experiments, overload retardation effect
Crack growth tests have then been performed for complicated block loading. The first type of test consisted in studying the influence of the number of overloads (of magnitude 1.5) in repeated blocks on the crack growth rate. The block contains 100 cycles with a varying number of grouped overloads (0, 1 and 10 overloads). Figure 13 shows the predicted crack growth rate for the three studied blocks.
1,0E-07
1,0E-06
1,0E-05
1,0E-04
1,0E-03
10 100Kmax (MPa.sqrt(m))
da/d
n (m
m/c
ycle
)
Test (without overload)
Test (1 ol. + 99 cycles)
Test (10 ol. + 990 cycles)
Model (without overload)
Model (1 ol. + 99 cycles)
Model (10 ol. + 90 cycles)
Figure 13 - influence of the number of overloads

Finally the influence of the distribution of the overloads in the repeated block has also been studied. Three types of blocks with 1 % of overload have been simulated and are constituted as follows: 1+99, 10+990 and 100+9900 cycles. In such a case, overloads are applied while the crack is still under the influence of the previous block of overloads. However, a good agreement between experiments and computations is still obtained (Figure 14).
1,0E-07
1,0E-06
1,0E-05
1,0E-04
1,0E-03
10 100Kmax (MPa.sqrt(m))
da/d
n (m
m/c
ycle
)
Test without overload
Test (1 ol. + 99 cycles)
Test (10 ol. + 990 cycles)
Test (100 ol. + 9900 cycles)
Model without overload
Model (1 ol. + 99 cycles)
Model (10 ol. + 990 cycles)
Model (100 ol. + 9900 cycles)
Figure 14 - influence of the overloads apparition order
The 3D SIF calculation method proposed by Pommier et al. [11], based on the body force method, has been tested to the wheel material. Four points bending fatigue tests under constant amplitude loading and –1 load ratio have been performed on notched specimen taken from a TGV wheel. Two different thickness have been tested : 5 and 15 mm, to estimate the influence of the stress gradient in the specimen. A crack front marking technique, consisting in increasing from –1 to 0,5 the load ratio during 50000 cycles, has been used to determine the evolution of the shape of the crack. The crack propagation law used to simulate the crack growth is the Paris law obtained on a CCT specimen with R=-1. The results obtained for a 15 mm thick specimen subjected to σmax = 230 MPa are presented in figure 15. A good agreement between experimental results and simulation is observed.
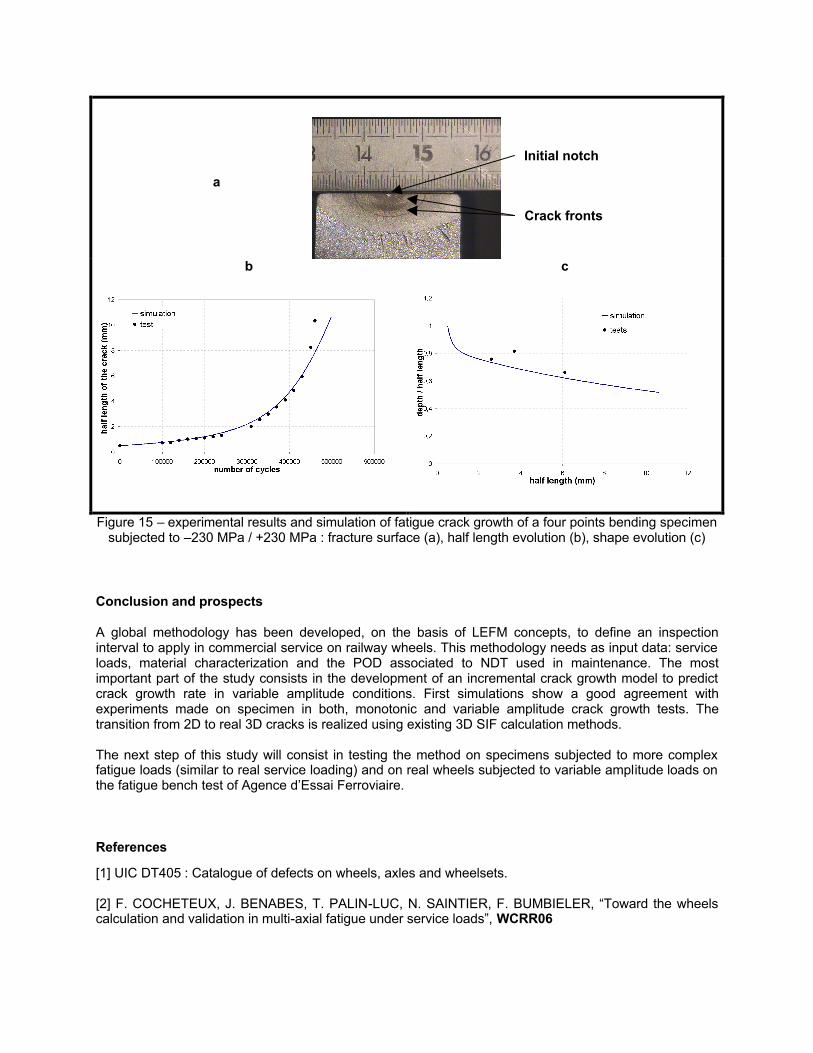
Figure 15 – experimental results and simulation of fatigue crack growth of a four points bending specimen subjected to –230 MPa / +230 MPa : fracture surface (a), half length evolution (b), shape evolution (c)
Conclusion and prospects
A global methodology has been developed, on the basis of LEFM concepts, to define an inspection interval to apply in commercial service on railway wheels. This methodology needs as input data: service loads, material characterization and the POD associated to NDT used in maintenance. The most important part of the study consists in the development of an incremental crack growth model to predict crack growth rate in variable amplitude conditions. First simulations show a good agreement with experiments made on specimen in both, monotonic and variable amplitude crack growth tests. The transition from 2D to real 3D cracks is realized using existing 3D SIF calculation methods. The next step of this study will consist in testing the method on specimens subjected to more complex fatigue loads (similar to real service loading) and on real wheels subjected to variable amplitude loads on the fatigue bench test of Agence d’Essai Ferroviaire.
References
[1] UIC DT405 : Catalogue of defects on wheels, axles and wheelsets. [2] F. COCHETEUX, J. BENABES, T. PALIN-LUC, N. SAINTIER, F. BUMBIELER, “Toward the wheels calculation and validation in multi-axial fatigue under service loads”, WCRR06
b
c
Crack fronts
a
Initial notch

[3] JA. BENYON, AS. WATSON, “The use of Monte Carlo analysis to increase axle inspection interval”, 13th International Wheelset Congress, Rome – Italy 2001 [4] S. BERETTA, A. GHIDINI, F. LOMBARDO, “Fracture mechanics and scale effects in the fatigue of railway axles”, Engineering Fracture Mechanics, volume 72 (2005) [5] M. KUNA, M. SPRINGMANN, K. MADLER, P. HUBNER, G. PUSCH, “Fracture Mechanic based design of a railway wheel made of austempered ductile iron”, Engineering Fracture Mechanics, volume 72 (2005) [6] U. ZERBST, M. VORMWALD, C. ANDERSCH, K. MADLER, M. PFUFF, “The development of a damage tolerance concept for railway components and its demonstration for a railway axle”, Engineering Fracture Mechanics, volume 72 (2005) [7] S. POMMIER, M. RISBET, “Partial-derivative equations for fatigue crack growth in metal”, International Journal of Fracture, 131, 79-106 (2005). [8] R. HAMAM, S. POMMIER, F. BUMBIELER, “Modélisation de la fissuration des toiles de roues ferroviaires soumises à un chargement de service“, CFM XVII – Congrès Français de Mécanique, Troyes – France (2005) [9] R.M.N. PELLOUX, “Mechanisms of formation of ductile fatigue striations”, Transactions of ASM, 62 (1969) [10] R. HAMAM, S. POMMIER, F. BUMBIELER, “Mode I fatigue crack growth under biaxial loading”, International Journal of Fatigue, 27 (2005). [11] S. POMMIER, C. SAKAE, Y. MURAKAMI, “An empirical stress intensity factor set of equations for a semi-elliptical crack in a semi-infinite body subjected to a polynomial stress distribution“, International Journal of Fatigue, 21 (1999)


![WELCOME [uic.org]](https://img.pdfslide.us/doc/110x75/61a6465f4246cf27e5128763/welcome-uicorg.jpg)