Embed Size (px)
Citation preview

1
QUEUES

2
Definition
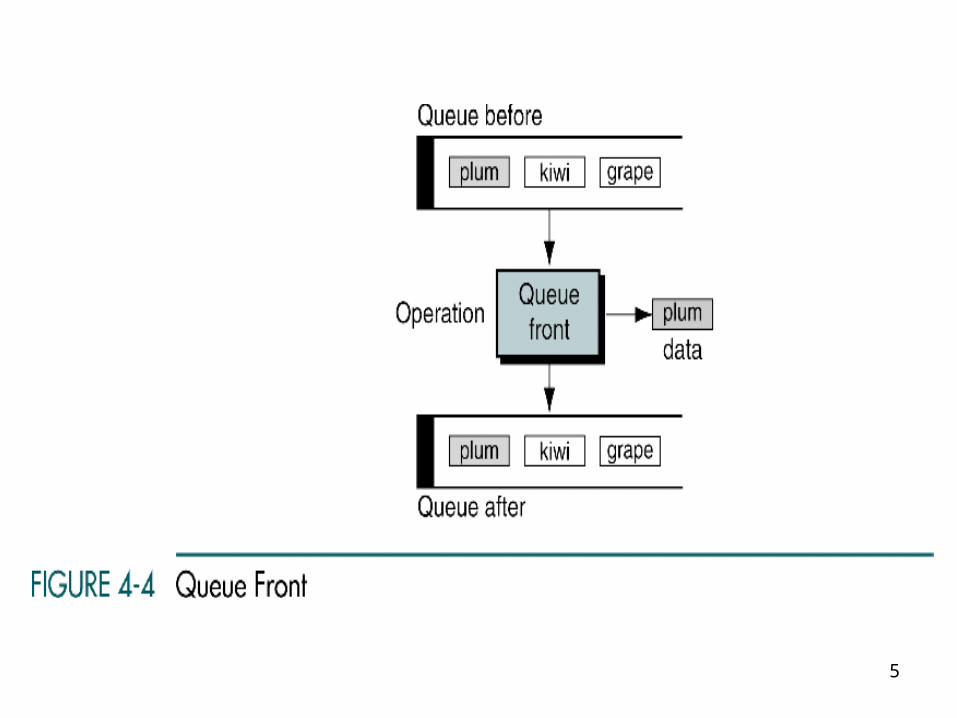
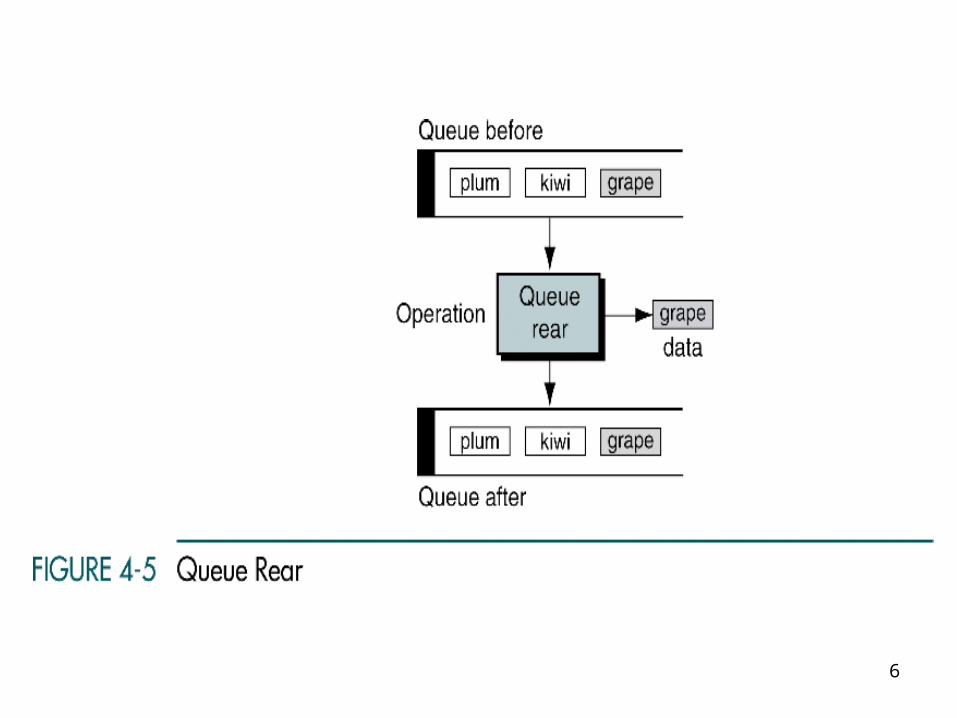
• A queue is a linear list in which data can only be inserted at one end, called the rear, and deleted from the other end, called the front.
• Hence, the data are processed through the queue in the order in which they are received (first in first out – FIFO)

3

4
5
6

7

8
(Continued)

9

10
11

12
(Continued)

13

14

15

16

17
18

19

20

21
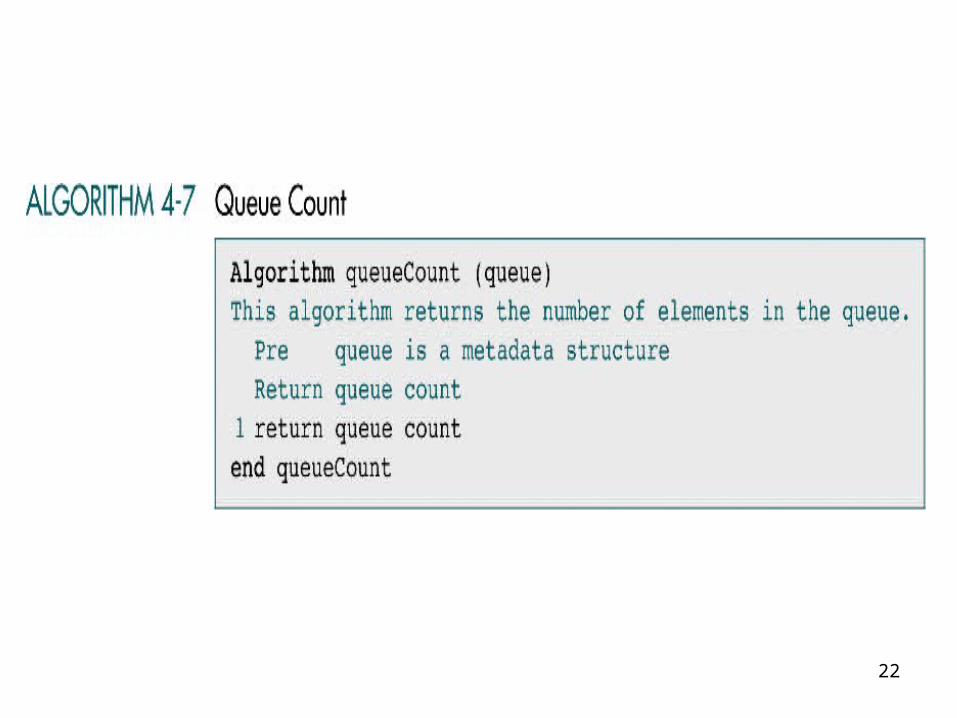
22

23

24

25

26

27
28
QUEUING THEORY
Queuing Theory is a field of applied mathematics and computer science
that is used to predict the performance of queues

29
Queuing Theory
• A single-server queue can provide service to only one customer at a time (hot food vendor on street corner).
• A multi-server queue can provide service to many customers at a time (bank, post-office).
• Multiqueues – multiple single-server queues (a grocery store).
• A customer is any person or thing needing the service.
• The service is any activity needed to accomplish the required result.

30
Queuing Theory
• The rate at which customers arrive in the queue for service is known as the arrival rate. It may be random or regular.
• Service time is the average time required to complete the processing of a customer request.

31
Queuing Theory
• In an ideal situation, customers would arrive at a rate that matches the service time.
• However, things are seldom ideal. Sometimes the server can be idle because there are no customers to be served. At other times there will be many customers to be served.
• If we can predict the patterns, we may be able to minimize idle servers and waiting customers.
32
Queuing Theory
• One of the main tasks in Queuing Theory is to predict such patterns.
• Specifically, it attempts to predict queue time (which is defined as the average length of time customers wait in the queue), the average size of the queue, and the maximum queue size.
• These predictions are based on the two factors: the arrival rate and the average service time (the average of the total service time between idle periods)

33
Queuing Theory
• Given queue time and service time, we know response time, - a measure of the average time from the point at which customers enter the queue until the moment they leave the server.

34

35
Queuing Theory
• The two factors that most affect the performance of queues are the arrival rate and the service time.

36
4-5 Queue Applications
We develop two queue applications. The first shows how to use a queue to categorize data. The second is a queue simulator, which is an excellent tool to simulate the performance and toincrease our understanding of its operation.
• Categorizing Data• Queue Simulation
37
Categorizing Data
• Categorizing Data is the rearrangement of data without destroying their basic sequence.
• As an example: suppose, it is necessary to rearrange a list of numbers grouping them, while maintaining original order in each group (multiple-queue application).

38
Categorizing Data
Initial list of numbers:
3 22 12 6 10 34 65 29 9 30 81 4 5 19 20 57 44 99
We need to categorize them into four different groups:
Group 1: less than 10
Group 2: between 10 and 19
Group 3: between 20 and 29
Group4: 30 and greater
| 3 6 9 4 5 | 12 10 19 | 22 29 20 | 34 65 30 81 57 44 99

39
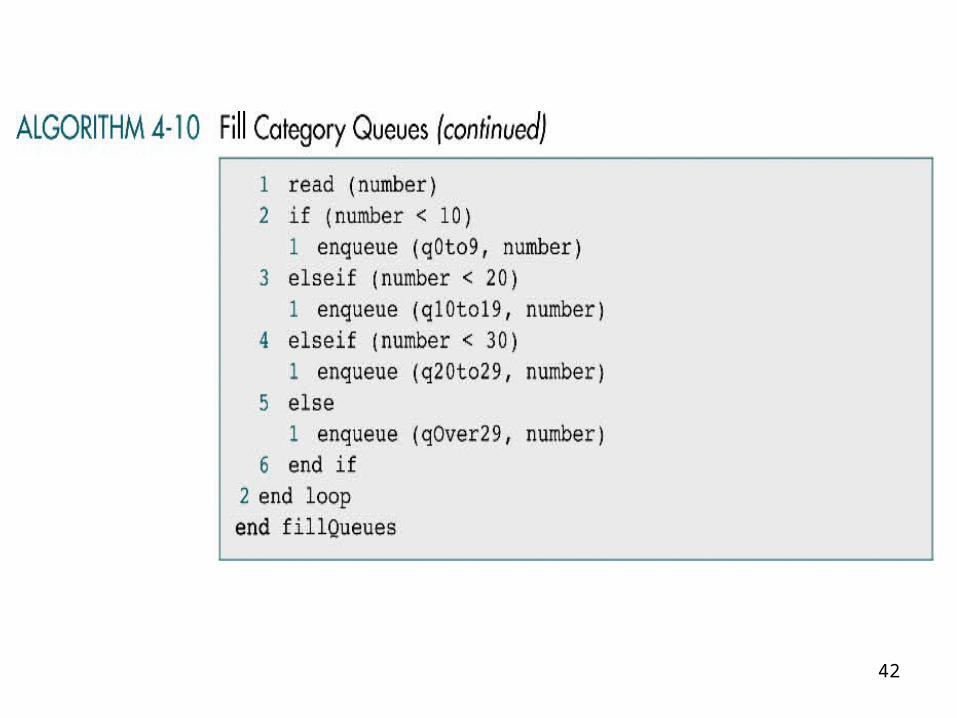
Categorizing Data
• The solution: we build a queue for each of the four categories. We than store the numbers in the appropriate queue as we read them.
• After all the data have been processed, we print each queue to demonstrate that we categorized data correctly.

40

41
42

43

44

45
(Continued)

46
Queue Simulation
• Queue simulation is a modeling activity used to generate statistics about the performance of queues.
• We will build a model of a single-server queue.

47
Queue Simulation
• Let us simulate a saltwater taffy store on a beach board-walk.
• The store has one window, and a clerk can service only one customer at a time. The store also ships boxes of taffy anywhere in the country. The time to serve customers varies between 1 and 10 minutes.
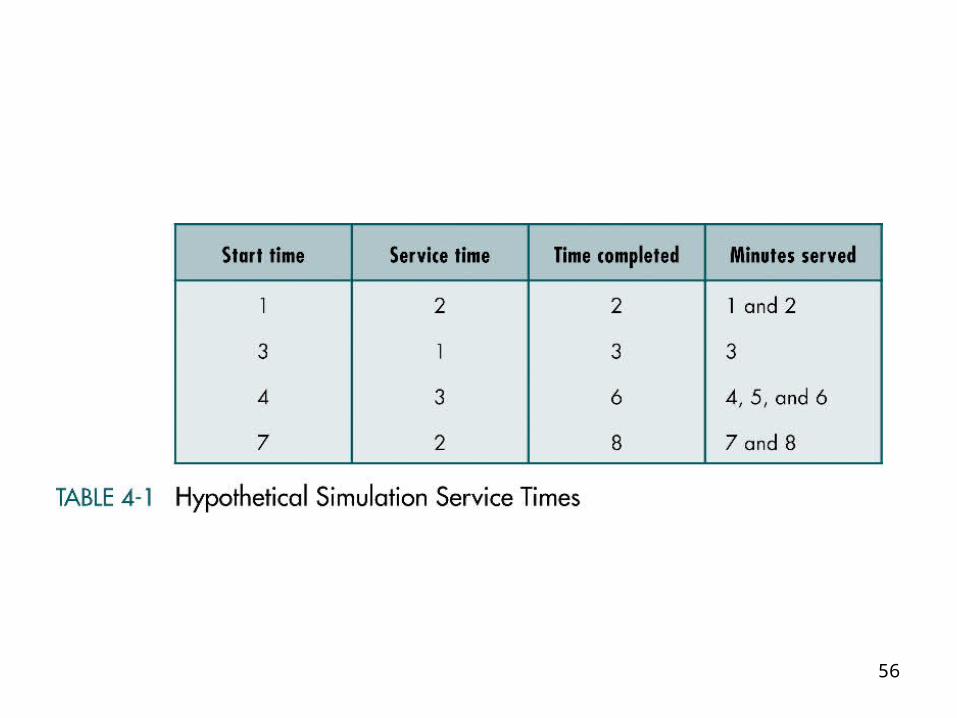
• We will study the store’s activity over a hypothetical day. The store is open 8 hours per day, 7 days a week. To simulate a day, we build a model that runs for 480 minutes (8x60=480).
• We assume that events start and stop in 1-minute interval.

48
Queue Simulation
• We assume that, on average, a customer arrives every 4 minutes. We simulate the arrival rate using a random-number generator that returns a value between 1 and 4. It the number is 4, a customer has arrived.
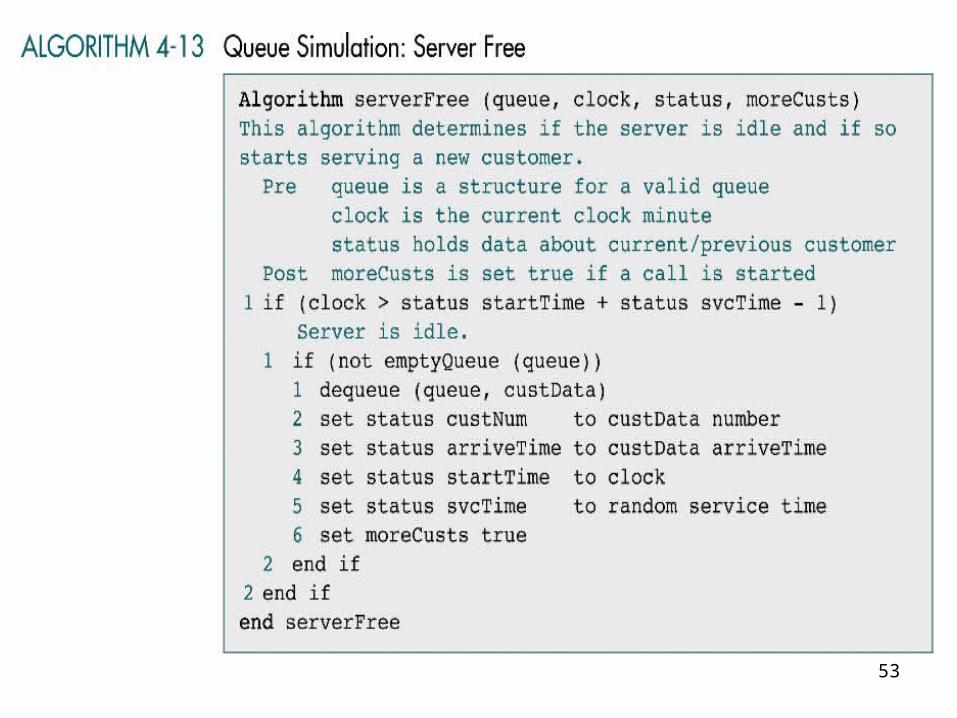
• We start processing a customer when the server is idle.
• In each minute of the simulation, the simulator needs to determine whether the clerk is busy or idle. If it is idle, the next customer in the queue can be served. If it is busy, the waiting customers remain in the queue.

49
Queue Simulation
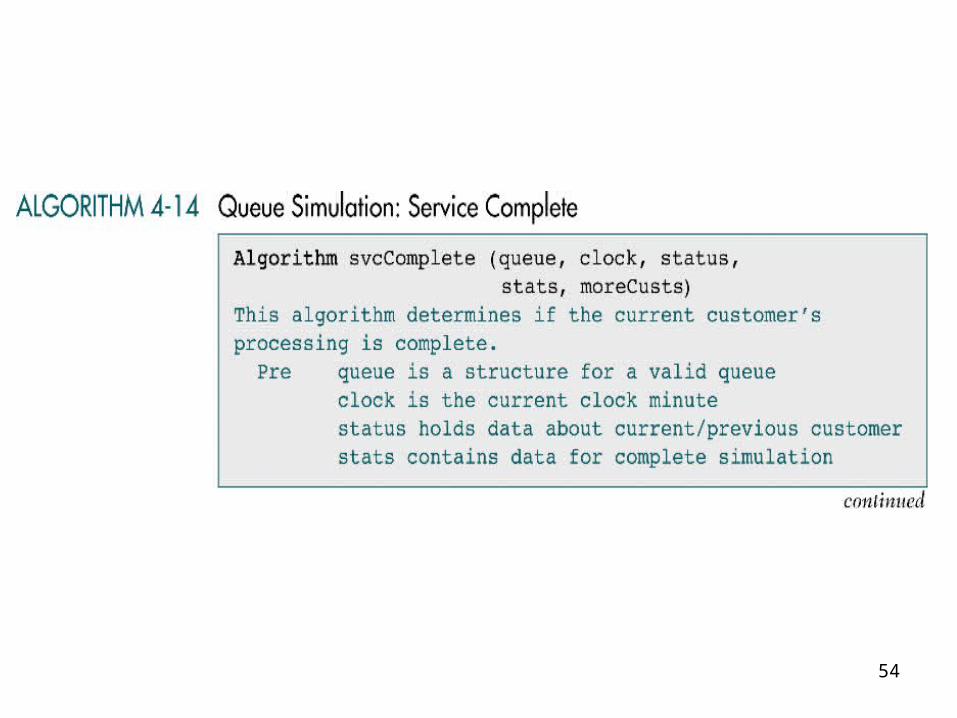
• At the end of each minute, the simulation determines whether it has completed the processing for the current customer.
• The processing time for the current customer is simulated by a random-numbers generator when the customer processing is started. Then, for each customer, we loop the required number of minutes to complete the transaction.
• When the customer has been completely served, we gather statistics about the sale and set the server to an idle state.

50

51

52
53
54

55
56

57

58