Embed Size (px)
Citation preview
1
Quality of Service (QoS), Quality of Experience (QoE) and Performance
Joachim [email protected]
OPTICOM, Germany
ITU Workshop on “Performance, Quality of Service and Quality of Experience of
Emerging Networks and Services”(Athens, Greece 7-8 September 2015)
2
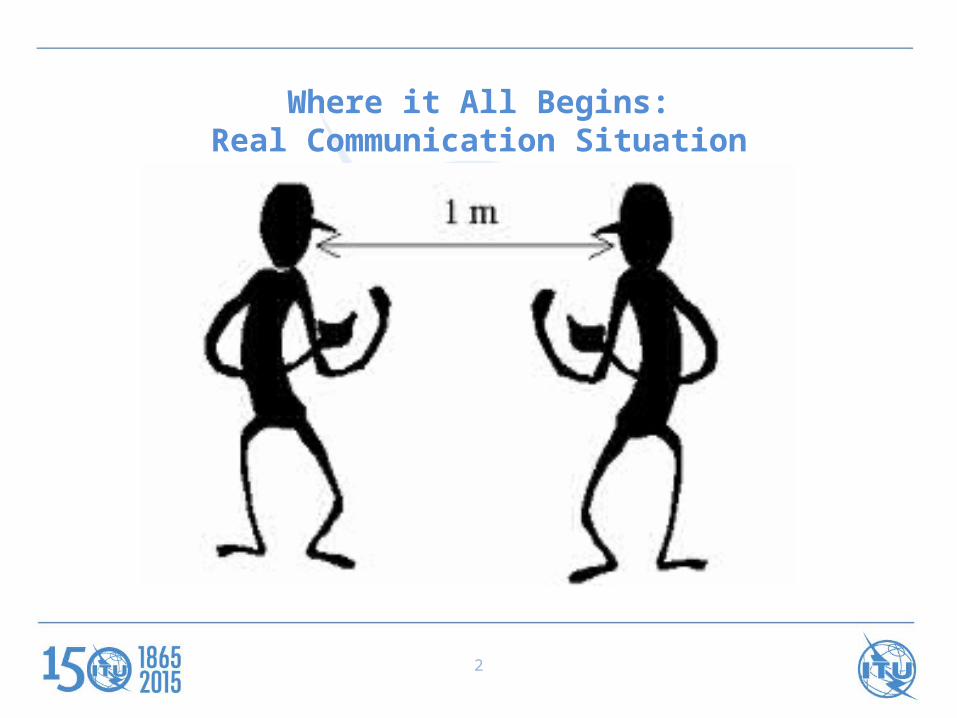
Where it All Begins:Real Communication Situation
3
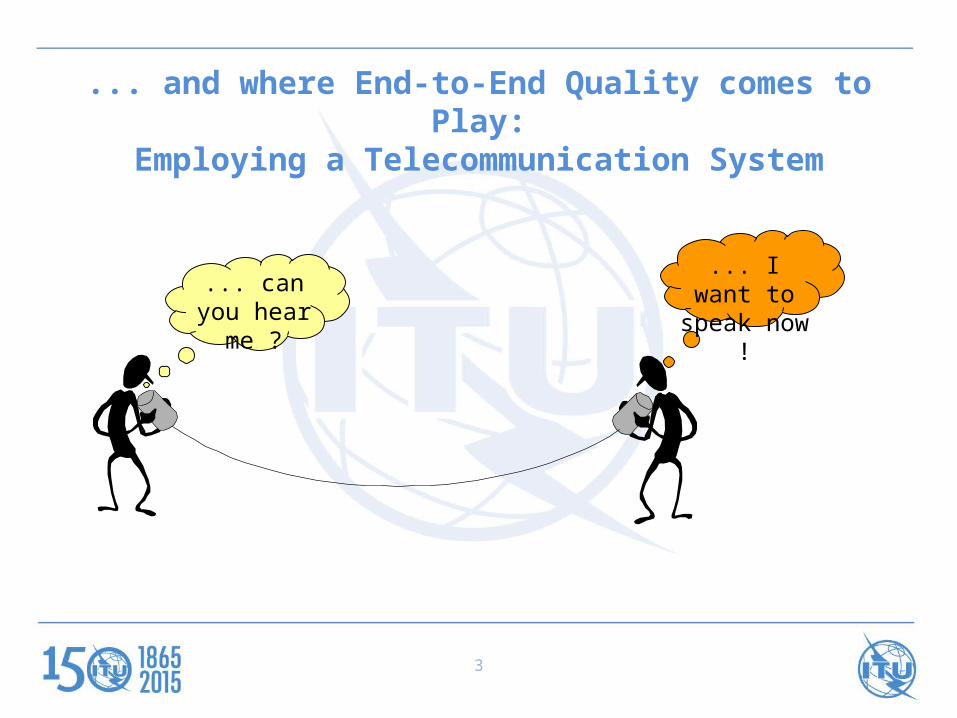
... and where End-to-End Quality comes to Play:Employing a Telecommunication System
... can you hear me ?
... I want to speak now !
4
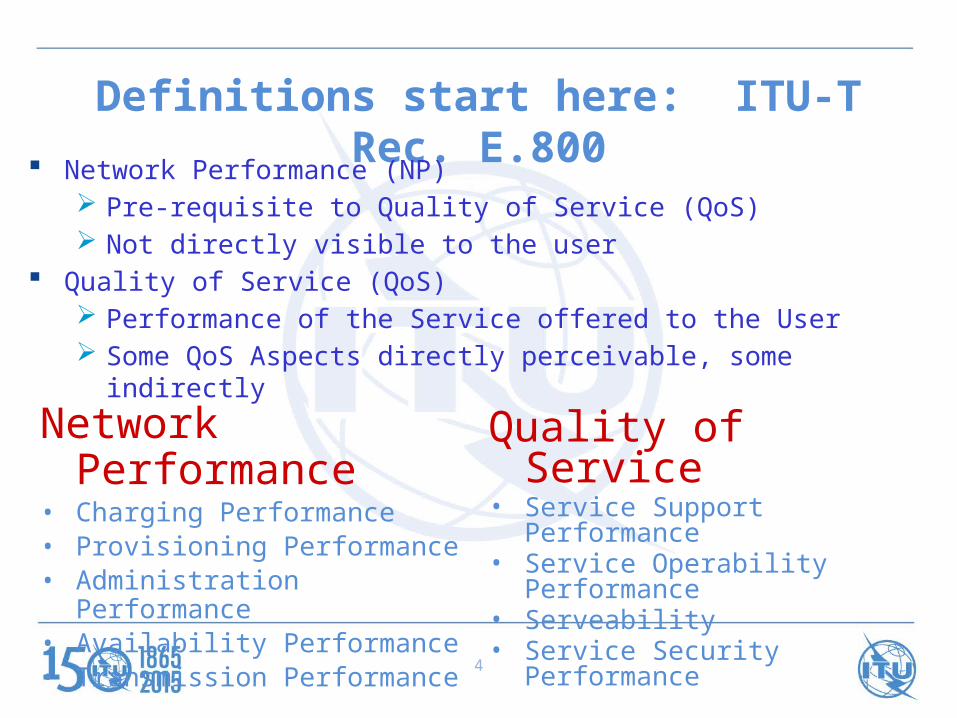
Definitions start here: ITU-T Rec. E.800
Quality of Service• Service Support Performance• Service Operability Performance• Serveability• Service Security Performance
Network Performance• Charging Performance• Provisioning Performance• Administration Performance• Availability Performance• Transmission Performance
Network Performance (NP) Pre-requisite to Quality of Service (QoS) Not directly visible to the user
Quality of Service (QoS) Performance of the Service offered to the User Some QoS Aspects directly perceivable, some indirectly
5
Four Viewpoints of QoS
• Consistent Approach to QoS– Well-defined and Relevant (e.g. Customer-affecting)– Used to Plan and Deploy Networks– Includes Monitoring Service Quality
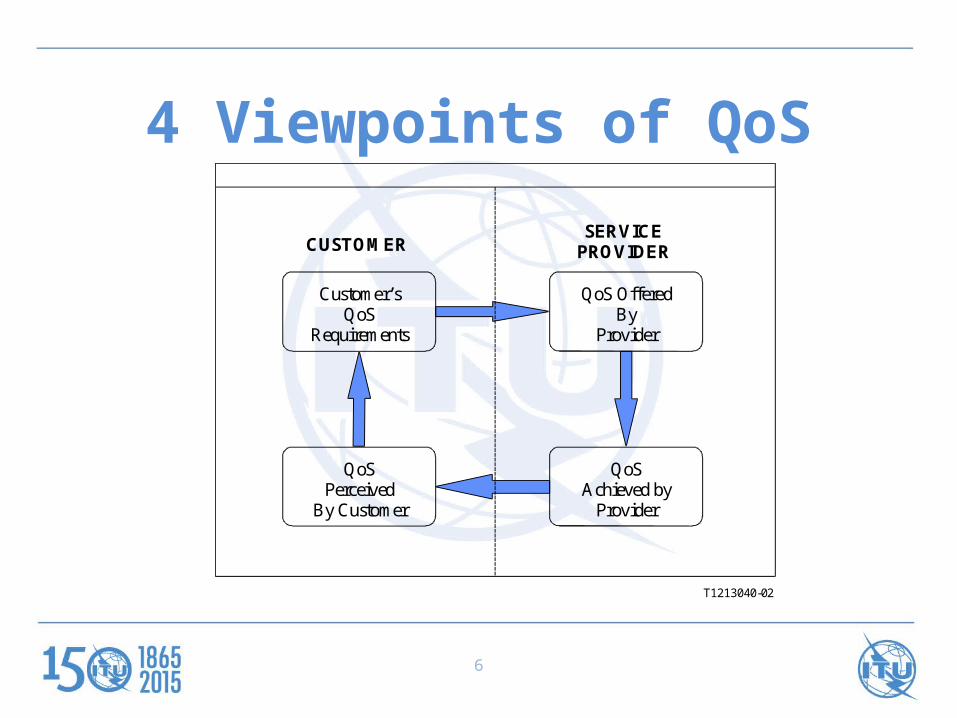
• ITU-T Rec. G.1000 defines four Viewpoints of QoS– Customer's QoS Rrequirements– Service provider's offerings of QoS (or targeted QoS)– QoS achieved or delivered– Customer survey ratings of QoS
• Ideally there would be 1:1 Correspondence between Delivered QoS and Perceived QoS
6
4 Viewpoints of QoS
T1213040-02
CUSTOMER
Customer’sQoS
Requirements
QoSPerceived
By Customer
QoS OfferedBy
Provider
QoSAchieved by
Provider
SERVICE PROVIDER
7
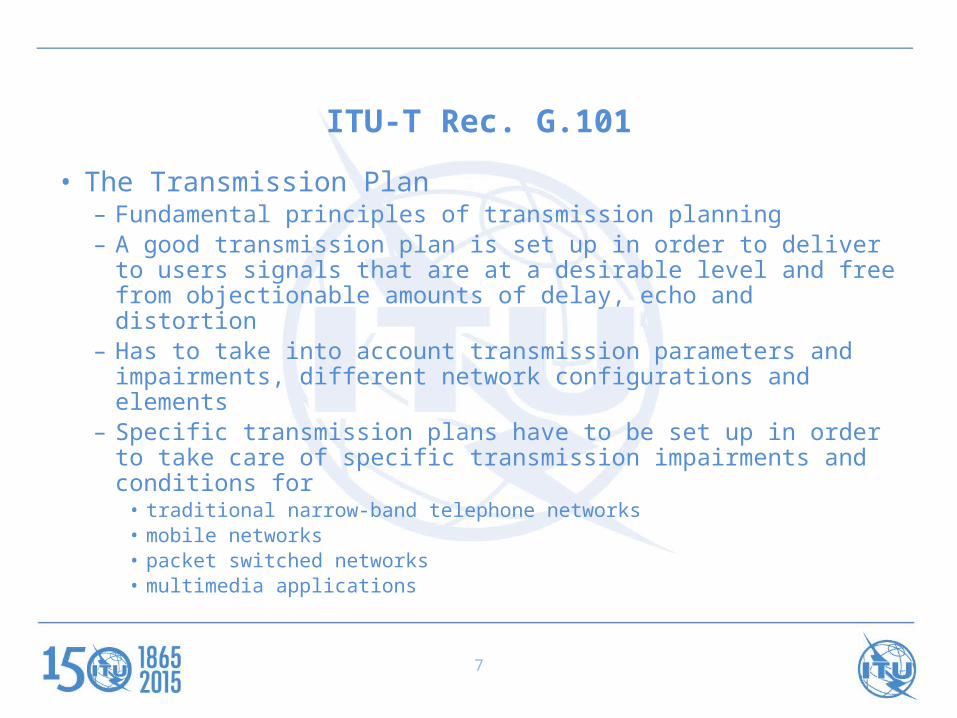
ITU-T Rec. G.101
• The Transmission Plan– Fundamental principles of transmission planning– A good transmission plan is set up in order to deliver to users
signals that are at a desirable level and free from objectionable amounts of delay, echo and distortion
– Has to take into account transmission parameters and impairments, different network configurations and elements
– Specific transmission plans have to be set up in order to take care of specific transmission impairments and conditions for
• traditional narrow-band telephone networks• mobile networks• packet switched networks• multimedia applications
8
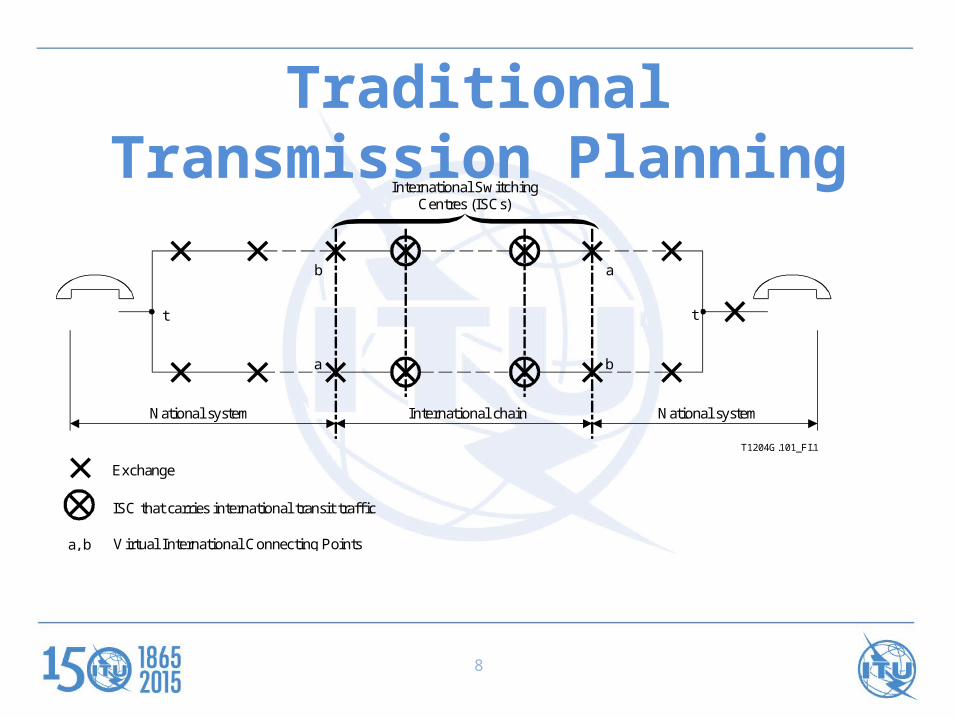
Traditional Transmission Planning
t t
a
b a
b
T1204G.101_FI.1
International SwitchingCentres (ISCs)
National system National systemInternational chain
Exchange
ISC that carries international transit traffic
a, b Virtual International Connecting Points
9
Transmission Planning Today
• ITU-T Rec. G.108: Transmission Planning with the E-Model
• Traditional transmission planning methodologies no longer flexible enough to account for new factors
10
Transmission Planning Challenges - 1
– Multinational networks require planning which takes into account regional differences in loss plan requirements and inter-network transmission plans
– Due to liberalization of the telecommunication markets (e.g. in Europe) there are no longer laid down ranges of values for transmission parameters by regulation
– The changing scenario in the public network operator domain is impacting transmission performance
11
Transmission Planning Challenges - 2
– G.108 is applicable to the use of new technology within the networks, including wireless (cordless or mobile), IP transmission etc.
– G.108 provides planning methods and contains necessary information and tools which will enable the planner to design the network transmission plan
– Guidelines and planning examples are based on the use of the E-Model
12
E-Model - ITU-T Rec. G.107
• Computational model for use in transmission planning • Assessing the combined effects of variations in several
transmission parameters that affect conversational quality of 3.1 kHz handset telephony
• Covers also packet loss• For many combinations of high importance to transmission
planners, the E-model can be used with confidence• Caution must be exercised when using the E-model for
some conditions
13
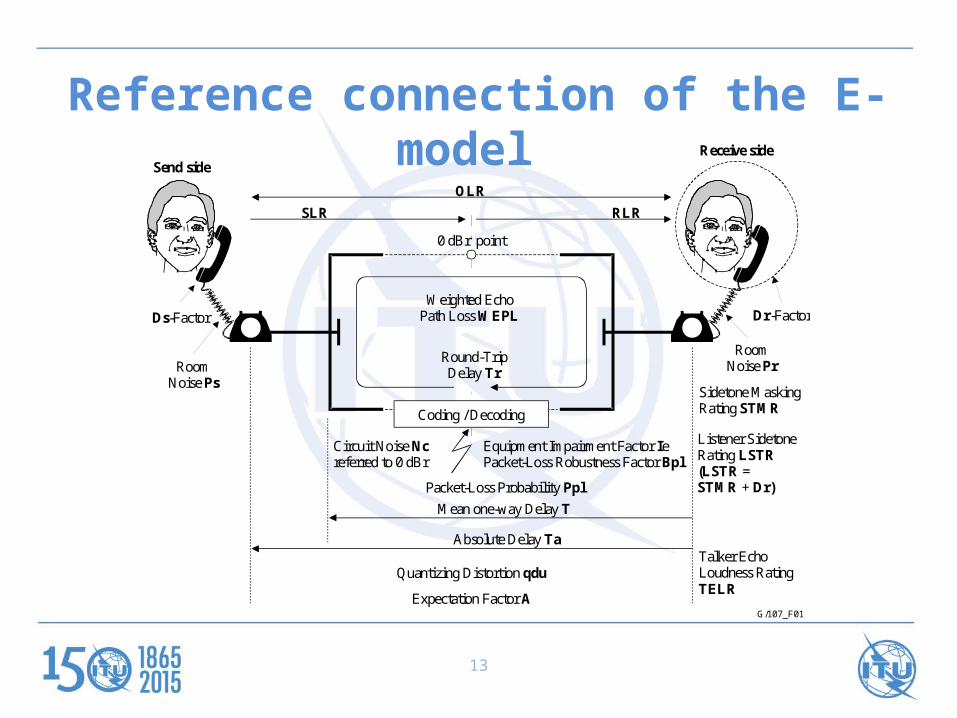
Reference connection of the E-model
G/107_F01
Quantizing Distortion qdu
Expectation Factor A
Mean one-way Delay T
Absolute Delay Ta
SLR RLR
OLR
0 dBr point
Ds-Factor
Circuit Noise Nc referred to 0 dBr
RoomNoise Ps
Weighted Echo Path Loss WEPL
Round-TripDelay Tr
Send sideReceive side
Listener SidetoneRating LSTR(LSTR =STMR + Dr)
Talker EchoLoudness RatingTELR
Sidetone MaskingRating STMR
RoomNoise Pr
Dr-Factor
Equipment Impairment Factor IePacket-Loss Robustness Factor Bpl
Coding / Decoding
Packet-Loss Probability Ppl
14
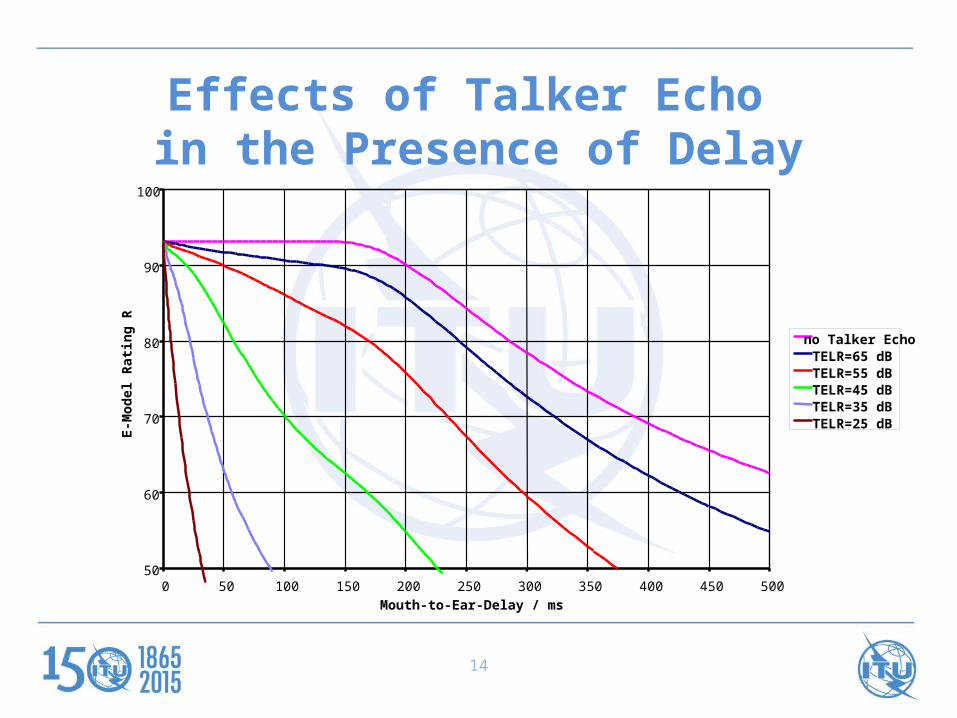
Effects of Talker Echo in the Presence of Delay
50
60
70
80
90
100
0 50 100 150 200 250 300 350 400 450 500
Mouth-to-Ear-Delay / ms
E-M
od
el R
atin
g R
no Talker EchoTELR=65 dBTELR=55 dBTELR=45 dBTELR=35 dBTELR=25 dB
15
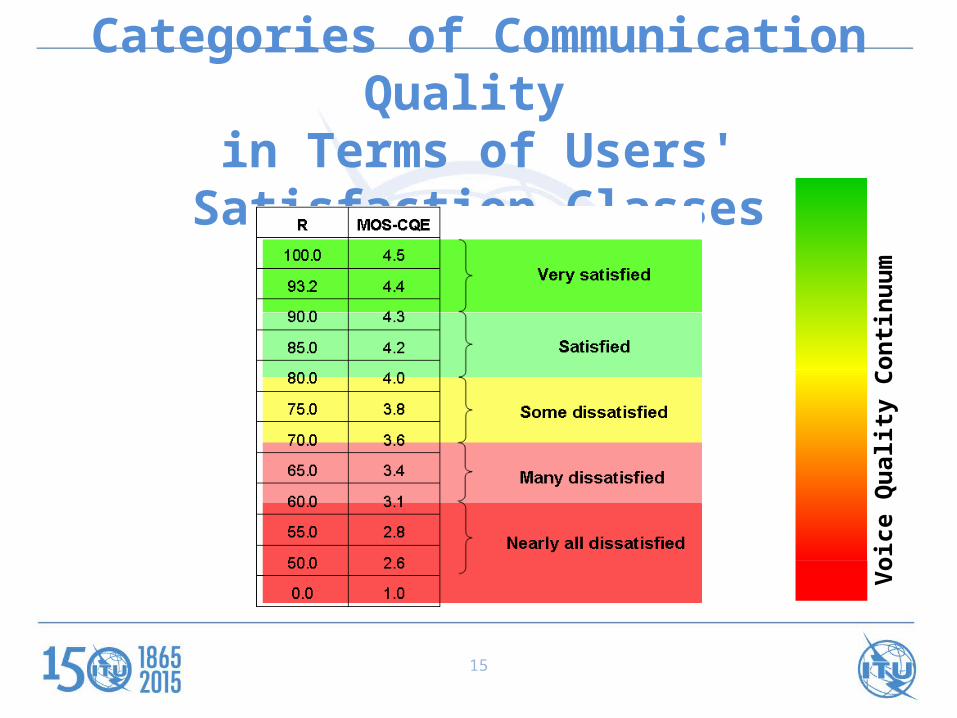
Categories of Communication Quality in Terms of Users' Satisfaction Classes
Vo
ice
Qu
alit
y C
on
tin
uu
m
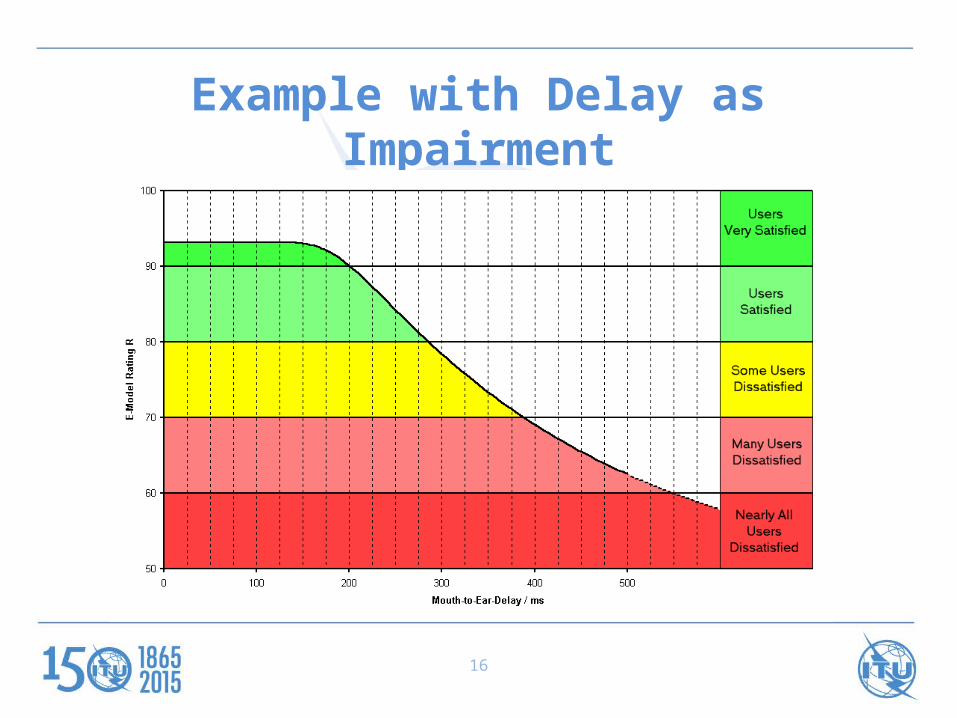
16
Example with Delay as Impairment
17
QoE Definition
• ITU-T Rec. G.100 / P.10 defines– Quality of Experience (QoE): The overall acceptability
of an application or service, as perceived subjectively by the end-user.
– NOTE 1 – Quality of experience includes the complete end-to-end system effects (client, terminal, network, services infrastructure, etc.).
– NOTE 2 – Overall acceptability may be influenced by user expectations and context.
18
QoE Implications
• QoE includes „everything“– Many aspects out of control of Operators– Includes Terminal Aspects– Conext and Environment of the User
• Proper QoS and NP– Technical pre-requisites– For achieving desired QoE
19
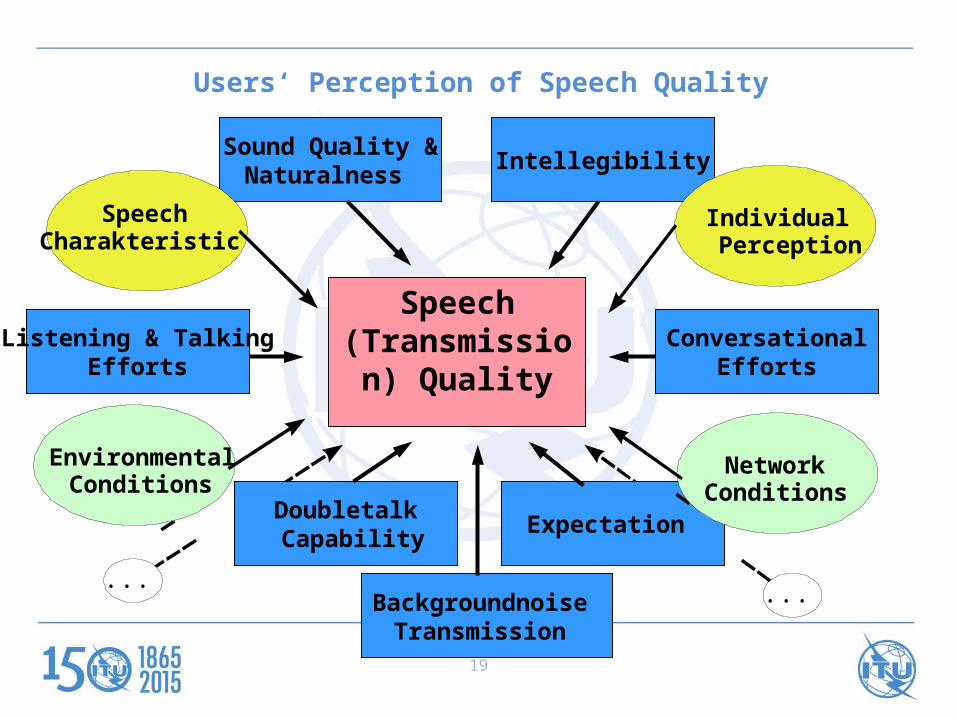
Users‘ Perception of Speech Quality
Speech(Transmission)
Quality
... ...
Sound Quality &Naturalness
Intellegibility
Listening & TalkingEfforts
ConversationalEfforts
Doubletalk Capability
Expectation
Backgroundnoise Transmission
SpeechCharakteristic
Individual Perception
NetworkConditions
EnvironmentalConditions
20
Motivation for Multimedia Quality - 1
• Quality as perceived by the User – A Promotional Factor for the Market
• User compares Quality of New Telecommunication Services– With Quality experienced in the Past– With other Telecommunication Service offers– With Quality experienced for Entertainment
Services
21
Motivation for Multimedia Quality
• Individual Quality Threshold– Users try new Service only few times ( ~ 3x … 5x )– If Quality below Indivdual Threshold Users give up– e.g. Download of a Website takes too long
• User remembers this experience• Will try a few times and conclude this as Static Effect:
"This website is not useable - let's try the Offer of the Competitor…"
22
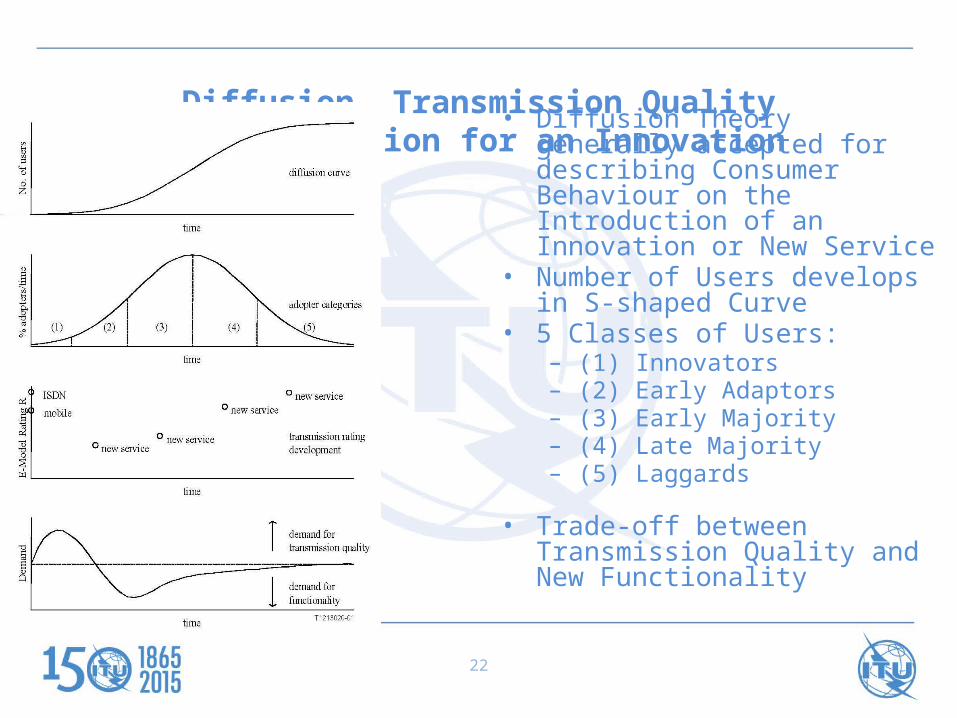
Diffusion, Transmission Qualityand Expectation for an Innovation
• Diffusion Theory generally accepted for describing Consumer Behaviour on the Introduction of an Innovation or New Service
• Number of Users develops in S shaped Curve‑
• 5 Classes of Users:– (1) Innovators– (2) Early Adaptors– (3) Early Majority– (4) Late Majority– (5) Laggards
• Trade-off between Transmission Quality and New Functionality
23
Changes in Users' Behaviour - 1
• Users tend to be much more reluctant to accept lower quality– This is quoted frequently
• True for some sorts of social calls• Definitively NOT true for sensible business calls
– Does it help network operators when defining QoS for their network ?• High quality has to be provided when demanded by business customers or
other sensible clients• But the distribution of quality acceptance over time and areas cannot be
matched with the occurrence of impairments in the network
– Not really useful for designing networks
23
24
Changes in Users' Behaviour - 2
• Users switch between different communication devices– Wireline, wireless, PC, PDA etc– Depending on place, task, purpose
• And depending on QUALITY
24
25
Key Parameters affecting MM Quality
• Media Distortion• End-to-End Delay• Echo Effects• Information Loss• Background Noise Distortion• Loss of Synchronization between Media
Streams
26
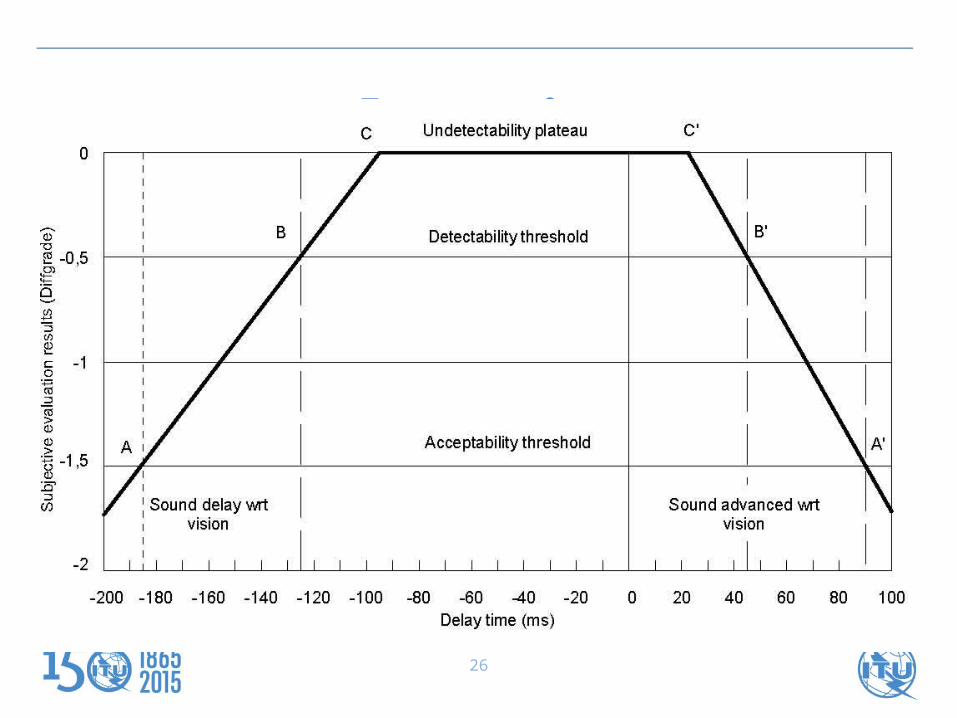
Example: Lip Sync
27
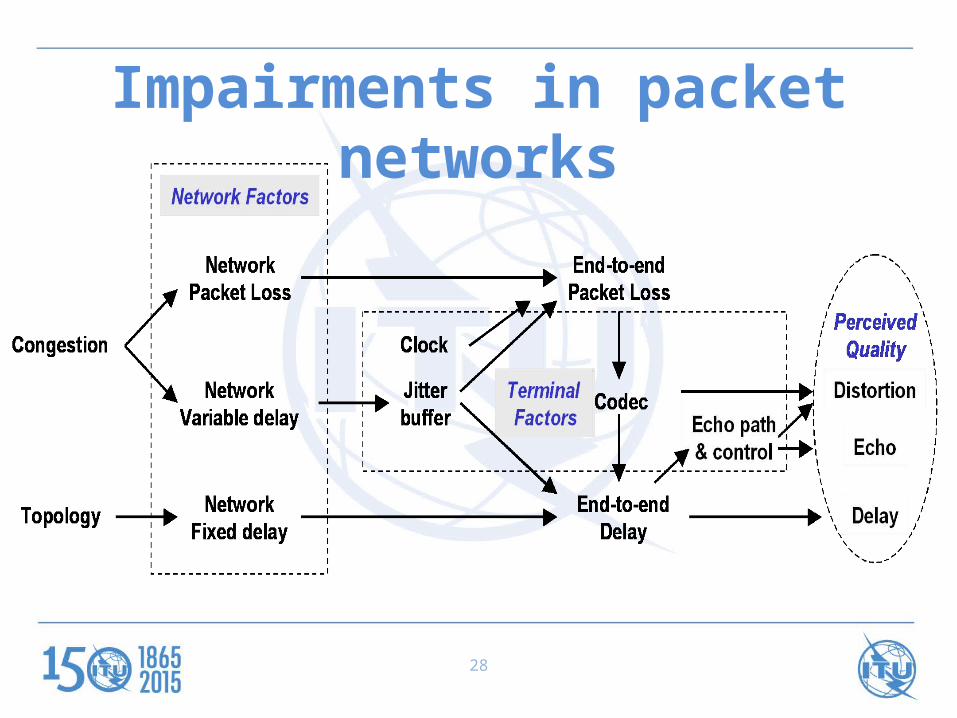
Impairments in packet networks• Distinction between Effects
– that occur in the Network and– Mechanisms in the Terminals that are affected
• Terminals can be used to correct for the Effects in the Network
• Remaining Issues are:– End-to-End Delay is increased when compensating for
other Effects– Loss of Information can be Concealed but Not Recovered
28
Impairments in packet networks
29
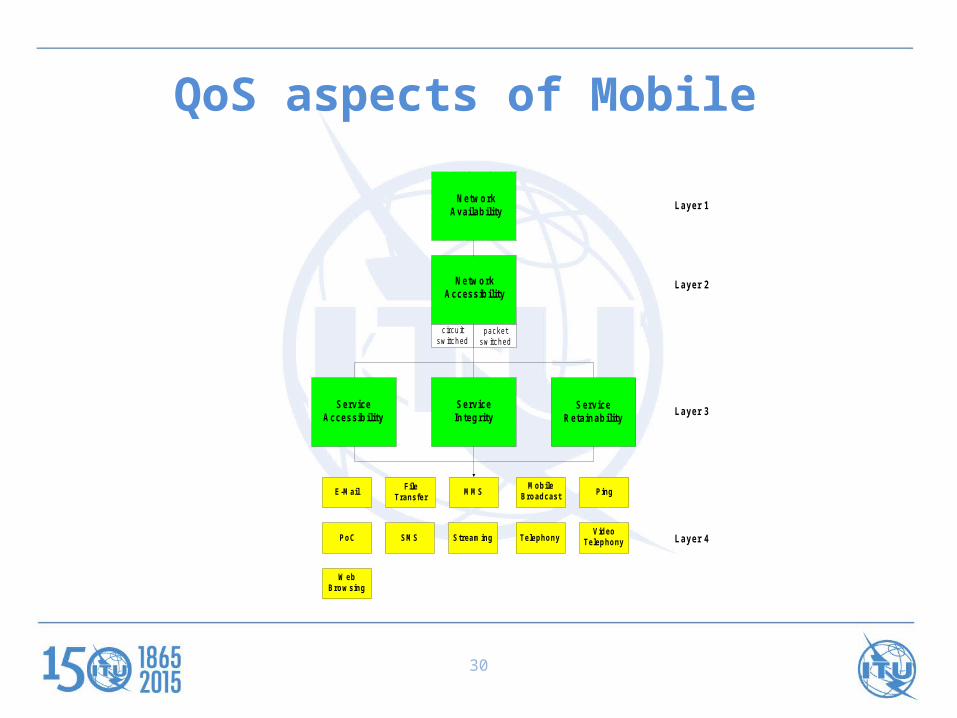
QoS Layers in Mobile• QoS model for mobile has four layers.• First layer is the Network Availability
– defines QoS rather from the viewpoint of the service provider than the service user
• Second layer is the Network Access– from user's point of view basic requirement for all the other QoS
aspects and parameters• Third layer contains other QoS aspects
– Service Access, Service Integrity & Service Retainability• Different services are located in the fourth layer
– Their outcome are the QoS parameters as perceived by the user
30
QoS aspects of Mobile
Netw orkAccessibility
c ircuitsw itched
packetsw itched
ServiceAccessibility
ServiceIntegrity
ServiceRetainability
TelephonySMS
PingFile
TransferMMS
Netw orkAvailability
VideoTelephony
WebBrow sing
StreamingPoC
MobileBroadcast
Layer 2
Layer 3
Layer 4
Layer 1
31
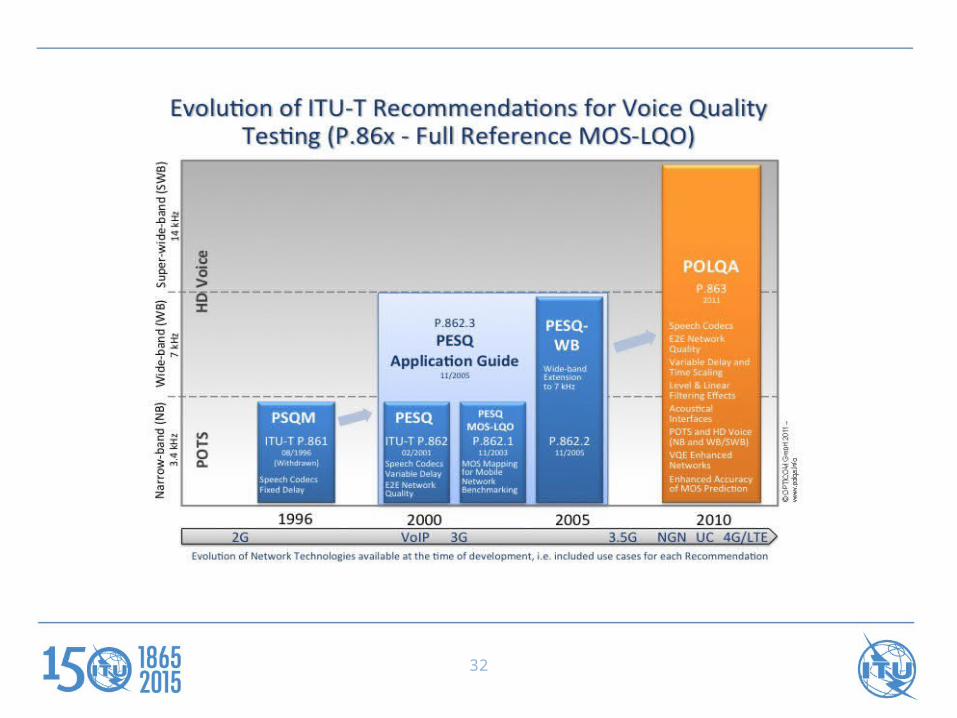
POLQA™ - Rec. P.863• The limitations of existing standards that are now addressed by POLQA
– CDMA– Chinese 3G TD-SCDMA
• POLQA offers immediate, strong support for testing of new wideband 4G/LTE networks delivering HD-quality voice services
• Tests carried out during the POLQA evaluation included future technologies such as– Unified Communications– Next Gen Networks– 4G/LTE– HD Voice, i.e. "wide-band" and "super-wide-band"
• See POLQA: The Next Generation in Voice Quality Testing http://www.polqa.info
32
33
POLQA Introduction - (c) OPTICOM GmbH 2010 33
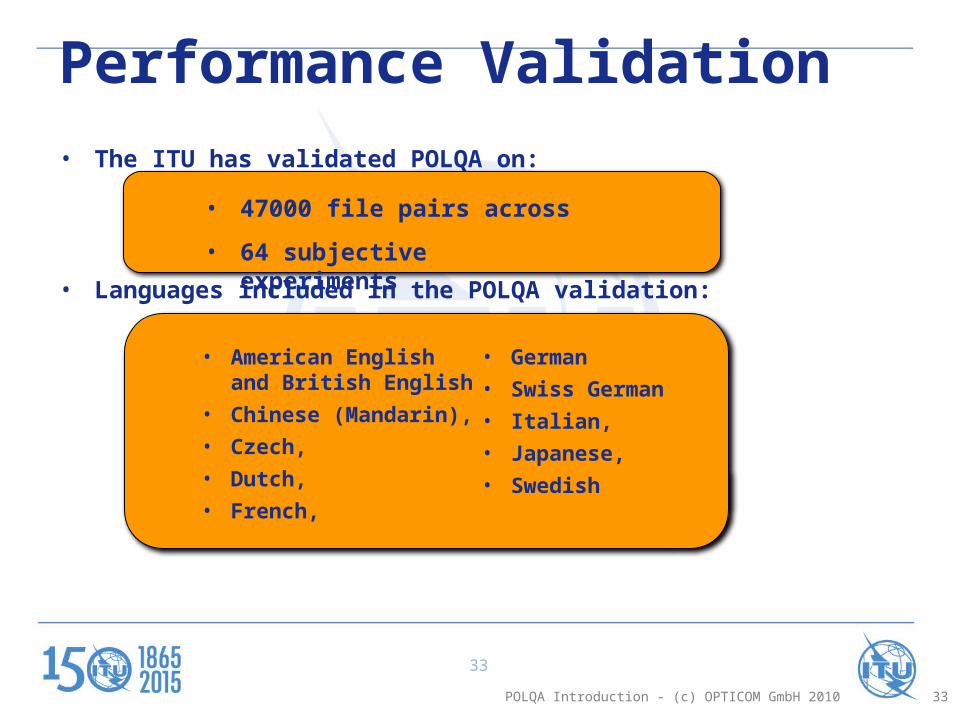
Performance Validation• The ITU has validated POLQA on:
• Languages included in the POLQA validation:
• German • Swiss German• Italian,• Japanese,• Swedish
• American English and British English
• Chinese (Mandarin),• Czech,• Dutch,• French,
• 47000 file pairs across
• 64 subjective experiments
34
Confidence Intervalls for Different Sample Sizes (1)
• Effect of different sample sizes in a measurement campaign– based on the Pearson-Clopper formulas for calculation of confidence
intervals– valid in a generic way and even for small sample sizes– for higher sample numbers, the calculation of confidence intervals based
on the approximation of a normal distribution can be applied– Three different graphs are depicted: Sample sizes in the range:
• between 100 and 1 100 samples;• between 1 100 and 2 100 samples; and• between 1 000 and 11 000 samples.
35
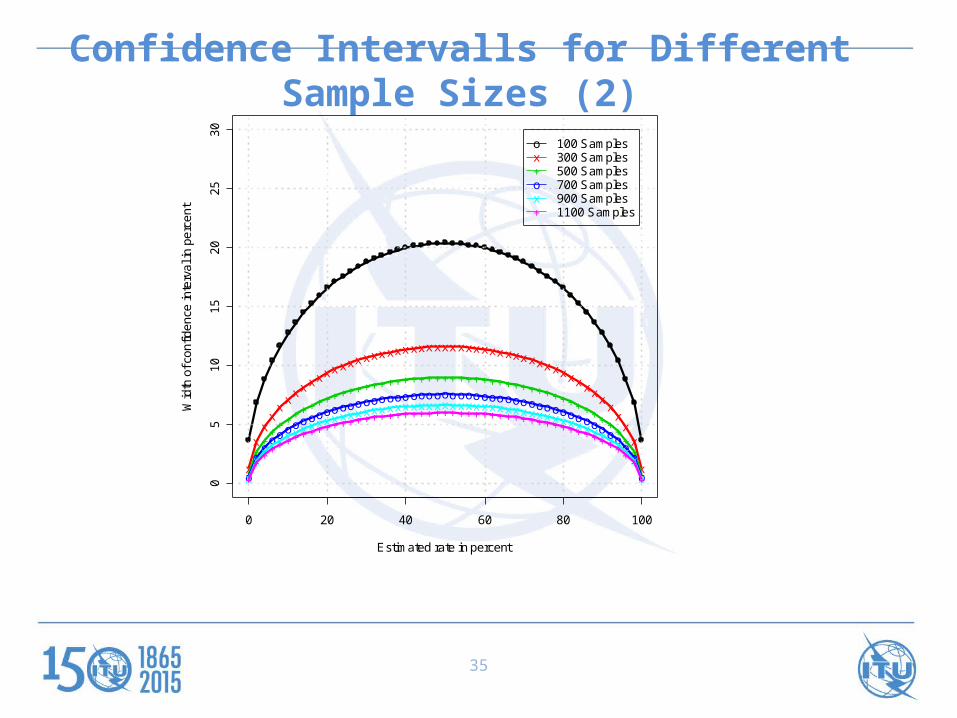
Confidence Intervalls for Different Sample Sizes (2)
0 20 40 60 80 100
05
10
15
20
25
30
Width of confidence interval for fixed sample size (Pearson-Clopper)
Estimated rate in percent
Wid
th o
f co
nfid
enc
e in
terv
al i
n pe
rce
nt
x
xx
xx
xxx xxxx xxx xxx xxx xxx xxx xxx xxx xxx xxx xxxx xxxx
xx
x
x+
++
++++++++++++++++++++++++++++++++++++++++++++
++
+
+o
oo
oooooooooooooooooooooooooooooooooooooooooooooo
o
ox
xx
xx xxx xxxx xxx xxx xxx xxx xxx xxx xxx xxx xxx xxxx xxx xxx
x
x++
++++++++++++++++++++++++++++++++++++++++++++++++
+
ox+ox+
100 Samples300 Samples500 Samples700 Samples900 Samples1100 Samples
36
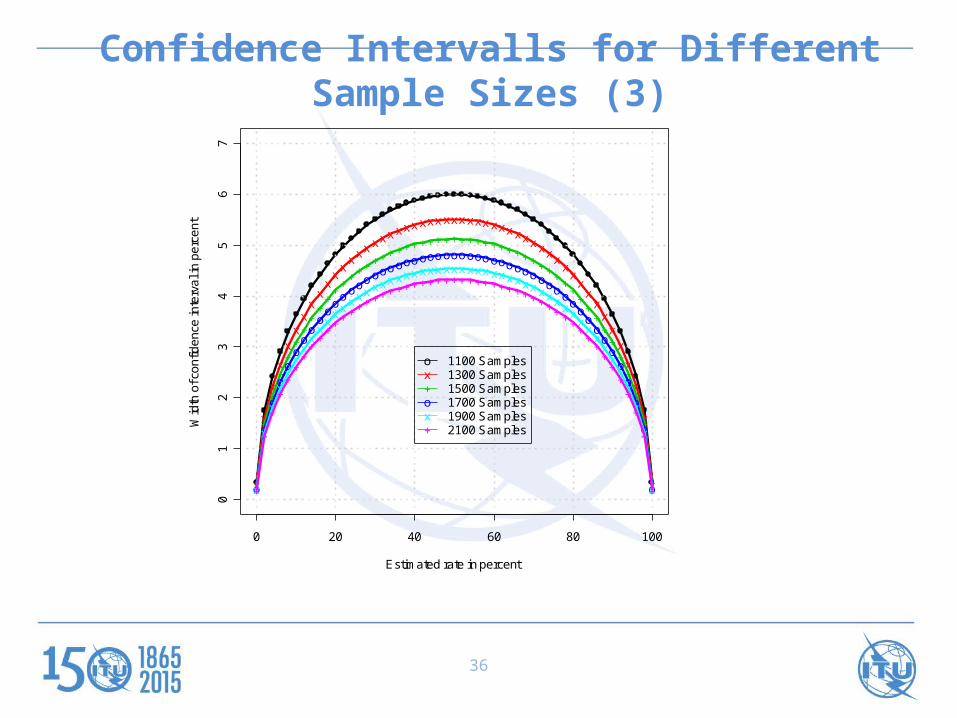
Confidence Intervalls for Different Sample Sizes (3)
0 20 40 60 80 100
01
23
45
67
Width of confidence interval for fixed sample size (Pearson-Clopper)
Estimated rate in percent
Wid
th o
f co
nfid
en
ce in
terv
al i
n p
erc
en
t
x
x
x
x
xx
xx
xx
xx
xxx xxx xxx xxx xxx xxx xxx xxx xxxx
xx
xx
xx
x
x
x
x
x+
+
+
++
++
++
++
++++++++++++++++++++++++++++
++
++
++
++
+
+
+
+o
o
o
oo
oo
oo
oo
oooooooooooooooooooooooooooooo
oo
oo
oo
o
o
o
ox
x
x
xx
xx
xx
xxx xxx xxx xxx xxx xxx xxx xxx xxx xxx xx
xx
xx
xx
x
x
x
x+
+
+
++
++
++
++++++++++++++++++++++++++++++++
++
++
++
+
+
+
+
ox+ox+
1100 Samples1300 Samples1500 Samples1700 Samples1900 Samples2100 Samples
37
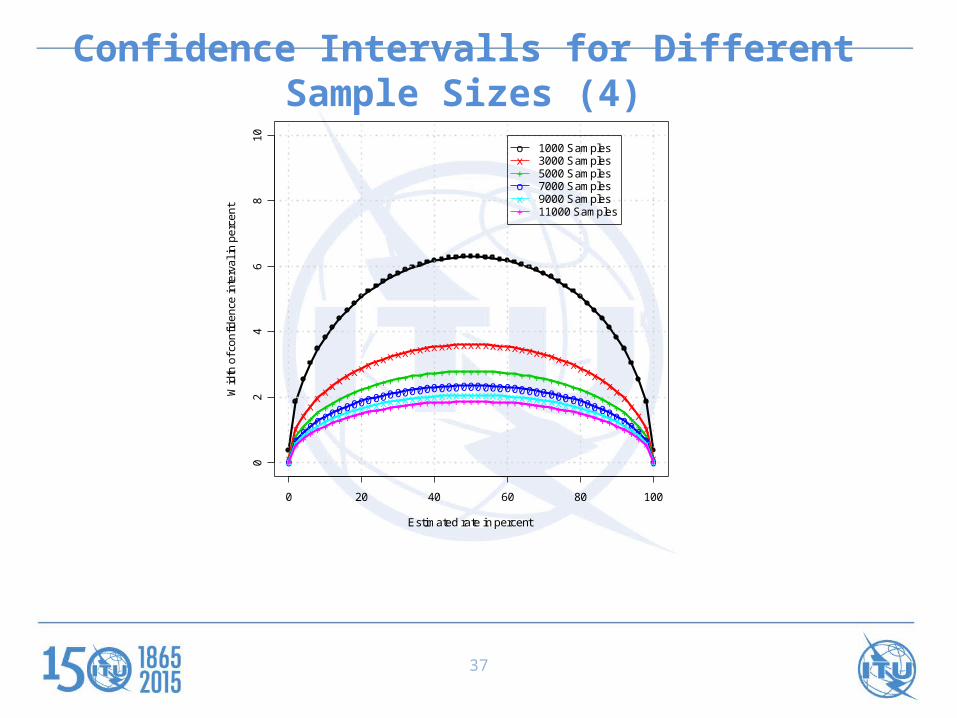
Confidence Intervalls for Different Sample Sizes (4)
0 20 40 60 80 100
02
46
81
0
Width of confidence interval for fixed sample size (Pearson-Clopper)
Estimated rate in percent
Wid
th o
f co
nfid
en
ce in
terv
al i
n p
erc
en
t
x
xx
xx
xxx xxxx xxx xxx xxx xxx xxx xxx xxx xxx xxx xxxx xxxx
xx
x
x+
++
++++++++++++++++++++++++++++++++++++++++++++
++
+
+0
00
0000000000000000000000000000000000000000000000
0
0x
xxxx xxx xxxx xxx xxx xxx xxx xxx xxx xxx xxx xxx xxxx xxx xxx
x
x+
++++++++++++++++++++++++++++++++++++++++++++++++
+
+
ox+ox+
1000 Samples3000 Samples5000 Samples7000 Samples9000 Samples11000 Samples
38
KPIs based on Network Counters
• Vendor specific = network internal KPIs– different strategies
• how to count network events• which events are included in which counter(s)
• Requires knowledge of specific system– specialists with detailed system knowledge– testing the counters
• documentation may be faulty• approach to counter change with system update
• Mobile operators struggling with this– most operator live in a multi vendor environment– counters from different vendors cannot be directly compared– requires continous attention and a strategy
39
KPIs from Users' Perspective = KQIs
• Key Quality Indicators (KQIs) = external indicators– can be assessed in the Field
• For Monitoring, Regulation etc.– a subset can be selected
• applicable across all vendors & operators• not limited to mobile, but also good for broadband
40
KPIs versus KQIs• Sometimes confused
– KPIs = internal indicators• part of network performance• based on network counters• essential for operation, maintenance, business model• could be reported, audited etc.• however, meaningless when out of context
– KQIs = external indicators• basis for QoS assessment as perceived by the user• vendor independant• operator independant• ideal to compare different operators on a statistical basis• cannot be reported from the system itself• requires some kind of field testing, drive, walk etc.