Embed Size (px)
Citation preview

1
QoI-aware Analysis of Wireless Networks
Horia Vlad Balan∗, Ahmed Bahjat†, Ramesh Govindan∗, Thomas LaPorta†,
Kostas Psounis∗ and Ram Ramanathan‡
∗ University of Southern California † Pennsylvania State University ‡ Raytheon
BBN Technologies
Abstract
For a class of applications in which users make decisions based on information synthesized from
different inputs, the quality of experience (QoE) of the user correlates directly with the Quality of
Information (QoI), rather than the number of bits, delivered by the network. Today networks are used
to retrieve information in a variety of modalities including text, images, video and audio, for a variety
of purposes. If the QoI received is not sufficient for its purpose, a user is likely to be unable to have
their queries sufficiently answered; if, on the other hand, a higher QoI than required is provided, more
network resources may be occupied thus increasing the delay to many users on a network. The effect
of QoI on network capacity and scalability is not well understood.
We present a simple framework for a QoI-aware approach to analyzing networks. We introduce
the notion of a QoI-rate function for an application, and apply it in two directions. First, we give a
number of examples of QoI-rate functions, show how a QoI-rate functions can be extended to multiple
applications, and demonstrate how operational capacity regions can be derived with multiple QoI flows.
Next, we consider the impact of the desired QoI on the scalability of networks. Our key findings are:
1) real-world application QoI typically has a complex, non-linear relationship to rate; 2) QoI-awareness
can significantly alter the estimate of operational capacity and scalability of a network.
I. INTRODUCTION
Several emerging applications fit a pattern in which a user presents a query or a task to a
piece of software, which in turn gathers information relevant to the task from a network of
Research was sponsored by the Army Research Laboratory and was accomplished under Cooperative Agreement Number
W911NF-09-2-0053.

2
mobile devices, and processes that information to produce a response. The user typically uses
that response to make a decision (e.g., decide on a subsequent course of action, or to request
additional information).
One application that fits this pattern is mission planning in tactical settings, where a mission
commander might require both real-time surveillance as well as historical information about
a particular city or an area, in order to decide on the logistics of an operation. A civilian
application that potentially fits this pattern is crowd-sourcing, where a user wants to perform
a specific task (e.g., a social scientist interested in documenting the behavior of children in a
park, or crowds during events), and recruits participants with smartphones to provide audio,
video or images of relevance to the specific task. Other similar examples include participatory
sensing-type applications for detecting damaged infrastructure or for surveillance, or the DARPA
balloon-hunt challenge which was designed to inspire crowd sourcing to perform complicated
tasks.
In this setting, which is the focus of our paper, the quality of information extracted from the
network directly impacts the quality of experience (QoE) of the user (because it directly affects
the decision made by the user). For example, if a poor quality video or image is submitted by
a participant for the documentation task described above, the social scientist may not be able to
accurately observe the social dynamics within the crowd. Conversely, for some tasks (such as the
balloon-hunt), it might suffice to get a single image of a balloon, rather than a high-definition
video. In this case, sending the image can conserve network resources for other tasks being
concurrently performed. These examples motivate an approach where the network delivers the
requisite information needed to make a decision, an approach we call Quality of Information
(QoI)-aware networking.
Before describing QoI, we note that it is qualitatively different from QoS (Quality of Service):
in the latter, the network is agnostic to the information being delivered and only understands
the performance characteristics required for that information (e.g., throughput, delay, jitter). It is
easy to find scenarios where a QoS based approach cannot deliver the same QoI (and, in turn,
the same QoE), as an approach that explicitly takes QoI into account.
In this paper, we explore the problem of understanding and controlling the QoI delivered by
a network. More specifically, we explore the capacity of networks in terms of their ability to
deliver information of the minimum quality required by a user or application.

3
We examine the impact of QoI on the scalability of networks considering that networks are
used by many different types of applications and that multi-media information is often required.
QoI[1] characterizes the information delivered to the application. We discuss QoI in more detail
in Section III, including the concepts of QoI functions and QoI-to-Rate translations. Using
these definitions, we examine two broad questions: 1) how does QoI, or a QoI-to-rate function,
compose over multiple applications and media, and what is the operational information-carrying
capacity in a multi-application QoI setting; and 2) how is the scalability of a network impacted
by QoI considerations, specifically, in a regular WiFi mesh network?
Using examples drawn from diverse applications including motion detection, face recognition,
fingerprint recognition, image recognition and optical character recognition we illustrate how
QoI-aware network analysis can yield insights. In particular, we show that operational capacity
regions can be constructed for multiple flows with different QoI, and show that the desired QoI
can have a dramatic impact on the scalability of the network.
II. RELATED WORK
To date, QoI has been applied in different ways to networks [12], [5], for example when
characterizing data coming from a sensor network [1], [2]. More generally, QoI has been used
to assist in data retrieval or to facilitate sharing stored data [11]. Unlike these approaches, ours
incorporates information quality directly into the design of a network. Applications may specify
a desired QoI, and the network seeks to deliver this QoI efficiently.
The capacity and scalability of wireless networks has been extensively studied from a theoret-
ical viewpoint both asymptotically, see, for example, [4], [3], and non-asymptotically, e.g., [6].
More recently, in [13], a formulation for in-practice scalability is given. However, these works
do not consider the Quality of Information (QoI) in their formulation. Our work is unique in
that it considers capacity regions and scalability in the context of QoI and presents a preliminary
framework for handling them.
Several research efforts have addressed network resource allocation considering application
utility. In particular the Network Utility Maximization (NUM) approach, originally proposed in
[7], [8], [9] defines an optimization framework that provides convergence to optimum network
parameters, based on flow-specific merit or utility functions. However, these approaches define
utility based on a network metric such as rate, under resource constraints. In our work we define

4
the quality of information based on a composite of many metrics, both contextual and intrinsic.
III. QOI: USER AND APPLICATION PERSPECTIVE
QoI will be valued differently by different users and applications. This reflects the fact that
different users require information of different quality depending on their goals, e.g., the questions
they are trying to answer. Different applications require information of different quality to work
properly. Different users and applications may also require information in different modalities.
Consider the following example. A user is doing research to buy a home in a distant location
in an attempt to reduce the number of houses they will have to visit in person. To start, a query
may be issued to get text descriptions of available real estate. Based on certain criteria, the user
may narrow down the list and then request a series of images of properties of interest. The
purpose of these images is to get a general impression of the different houses. As the list is
further narrowed the attention of the user may be on finer details of the homes to understand
their condition. This would require higher quality images to see stains from water leaks or age.
Finally, the user may desire video, and if available, audio from web cams in the neighborhood to
determine traffic, neighborhood noise, as well as nearby facilities and stores. Depending on their
interests, (e.g., reading store signs) the required quality of the video may vary. Each successive
query requires information in a potentially different modality and at a different quality.
If the highest QoI is always delivered, network resources are wasted, thus degrading the
experience of the user due to longer download times, and perhaps other users if congestion
occurs. If information of insufficient quality is delivered, the user may have to issue additional
queries or be unable to adequately reduce their list.
To support the specification of QoI by users, the labeling of information, both stored and
that being retrieved in real time, and to allow the optimization of network control to deliver the
maximum operational information content capacity we provide several definitions.
QoI is a composite, multi-dimensional metric that captures the trade-offs of several components
to characterize the information ultimately delivered to the application. QoI is composed of both
intrinsic and contextual metrics. Intrinsic metrics are those that are valued independently of the
use of the information. For example, the freshness of information, i.e., its age, is a function
of when the information was generated and will have the same value regardless of the use of
the information. Contextual metrics are a function of the use of the information. For example,

5
completeness depends on the use of information. If a photo is being used to count people in a
room, it is only complete if it contains all the people in the room; if its use is to determine if
at least one person is in the room, then it is complete if it shows enough of the room to see a
single person.
Requested QoI is defined as the QoI requested by a user when issuing a query. Delivered
QoI represents the QoI delivered to the user, either by retrieval of information in real-time or
by retrieving information from a database. Requested QoI will be fully specified, including both
intrinsic and contextual attributes, because the requestor has knowledge of the application. If
the information source and delivery nodes also have knowledge of the QoI requirements and
application, then the delivered QoI may also be fully specified. Information that is stored will
have only intrinsic attributes specified because it may be used by future applications with their
own intrinsic requirements. However, it could be tagged with descriptors that allow contextual
attributes to be derived.
In general, QoI may be represented as a vector or a function. Vectors are appropriate to use
when the values of the metrics in the vector represent a fixed value. For example, the delivered
QoI will be a vector because the values of the metrics are known. Likewise, requested QoI
may be a vector if the metrics are specified in terms of minimum acceptable values. The QoI
values for stored information will also be a vector, but the vector may not be fully populated as
discussed above.
QoI functions allow a requestor of information to define the relationships and trade-offs
between QoI metrics. For example, the QoI may degrade as precision of information decreases,
but increase as the delay in retrieving the information, called timeliness, decreases. Consider the
case of an image. By compressing the image, timeliness is improved but precision is degraded.
A QoI function allows the specification to quantify this tradeoff. When using a QoI function,
requested QoI may be in the form of QoI(metrics) >= Q. This, in effect, defines a surface of
acceptable QoI. In our examples, for simplicity, we use a QoI function to determine a scalar.
To set network controls and determine network scalability, we must translate QoI require-
ments into allocated network resources. In this paper we consider transmission resources. To
accommodate resource assignment, we translate QoI requirements into a required network rate
using a QoI-Rate function (QRF). The QRF cannot capture all QoI metrics. For example, it
cannot capture the freshness or completeness of information because transmission rate does not

6
impact these metrics. But, it can be used to translate precision (which is related to file size) and
timeliness (which is related to latency).
To evaluate the impact of QoI on applications, we define a variable called the application
score (App-score). The App-score is used to provide a normalized subjective measure of the
quality of information given to an application for a given set of QoI metric values.
IV. MULTI-APPLICATION QRF FUNCTIONS
In this section we define QoI-to-Rate Functions (QRF) for cases in which multiple tasks are
serviced by multiple nodes in a network. This may represent a single user requesting multiple
modes of information, or several users requesting information from the network at the same
time.
First, let’s consider the scenario in which a single wireless node is set to send data of different
tasks to a base station, that is, we have a single device serving different communication tasks.
The goal is to divide the available bandwidth/rate between the various tasks in a way which
maximizes the total QoI. In the rest of this section, each task/application corresponds to a scalar
QoI value, and this value is associated with a corresponding required rate by the QRF function.
Suppose T tasks/applications are assigned to a node, where each task i, 1 ≤ i ≤ T , has a
QRF function Qi(r). The multi-application QRF function, Q(r), is defined as follows:
Q(r) = maxr∑T
i=1Qi(ri)
subject to: ∑Ti=1 ri ≤ r,
(1)
where r = [r1, · · · , rT ] is the vector of rates allocated to different tasks and r is the total
available rate. The function Q(r) finds the maximum QoI that can be achieved subject to the
total available rate r. Note that achieving this rate allocation in an operational system requires
scheduling algorithms that are beyond the scope of this paper.
As an example for the definition above, consider three tasks/applications with the QRF
functions shown in Figure 1. As shown in the plot, the first application is useful as long as
the provided rate is a few Kbps, whereas the other two applications require higher rates to
start being useful and yield positive QoI values. The multi-application QRF function for these

7
three applications is shown in Figure 2. This example highlights a few properties of multi-
application QRF functions: (i) Clearly, the resulting rate allocation depends on the individual
QRFs and the QoI of each application given the rate it gets. For example, in Figure 2, for r
close to 100 (to be exact for r = 102.22 Kbps), the optimal rate assignment turns out to be
[r1, r2, r3] = [36.24, 65.98, 0], since the first application does not yield higher QoI values if the
assigned rate is further increased from 36.24, and the third application does not give any positive
QoI values for rates less than 110, thus the remaining rate (65.98=102.22-36.24) is assigned to
the second application. (ii) The multi-application QRF function is less smooth than the individual
QRF functions because combining discontinuous functions tends to produce even less continuous
functions.
0 10 20 30 40 500
0.5
1
1.5
2
r1 (Kbps)
QoI
(a)
50 60 70 80 90 1000
0.5
1
1.5
2
r2 (Kbps)
QoI
(b)
100 120 140 160 180 2000
0.5
1
1.5
2
r3 (Kbps)
QoI
(c)
Fig. 1: The QoI-Rate Functions (QRF) for three tasks.
0 50 100 150 200 250 300 3500
0.5
1
1.5
2
2.5
3
3.5
4
4.5
Rate (kbps)
QoI
Fig. 2: The multi-application QRF function for the QRF functions shown in Figure 1.
A. Real world applications
Next, we provide some examples utilizing real world applications. We consider five appli-
cations that are of interest: image recognition, face recognition, motion detection, fingerprint
recognition and optical character recognition (OCR).
8
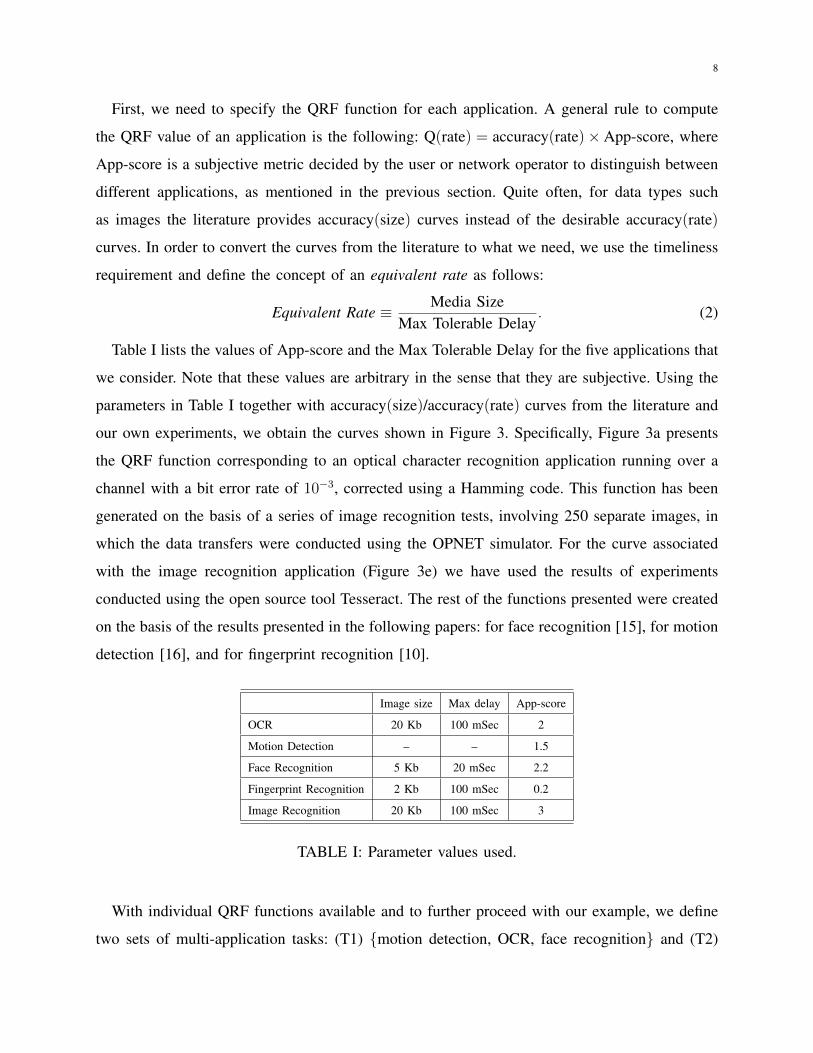
First, we need to specify the QRF function for each application. A general rule to compute
the QRF value of an application is the following: Q(rate) = accuracy(rate)×App-score, where
App-score is a subjective metric decided by the user or network operator to distinguish between
different applications, as mentioned in the previous section. Quite often, for data types such
as images the literature provides accuracy(size) curves instead of the desirable accuracy(rate)
curves. In order to convert the curves from the literature to what we need, we use the timeliness
requirement and define the concept of an equivalent rate as follows:
Equivalent Rate ≡ Media SizeMax Tolerable Delay
. (2)
Table I lists the values of App-score and the Max Tolerable Delay for the five applications that
we consider. Note that these values are arbitrary in the sense that they are subjective. Using the
parameters in Table I together with accuracy(size)/accuracy(rate) curves from the literature and
our own experiments, we obtain the curves shown in Figure 3. Specifically, Figure 3a presents
the QRF function corresponding to an optical character recognition application running over a
channel with a bit error rate of 10−3, corrected using a Hamming code. This function has been
generated on the basis of a series of image recognition tests, involving 250 separate images, in
which the data transfers were conducted using the OPNET simulator. For the curve associated
with the image recognition application (Figure 3e) we have used the results of experiments
conducted using the open source tool Tesseract. The rest of the functions presented were created
on the basis of the results presented in the following papers: for face recognition [15], for motion
detection [16], and for fingerprint recognition [10].
Image size Max delay App-score
OCR 20 Kb 100 mSec 2
Motion Detection – – 1.5
Face Recognition 5 Kb 20 mSec 2.2
Fingerprint Recognition 2 Kb 100 mSec 0.2
Image Recognition 20 Kb 100 mSec 3
TABLE I: Parameter values used.
With individual QRF functions available and to further proceed with our example, we define
two sets of multi-application tasks: (T1) {motion detection, OCR, face recognition} and (T2)

9
0 50 100 150 200 250 3000
0.2
0.4
0.6
0.8
1
Rate (Kbps)
QoI
(a)
170 180 190 200 210 220 230 2401.4
1.5
1.6
1.7
1.8
1.9
2
2.1
2.2
Rate (Kbps)
QoI
(b)
5 10 15 20 25 30 35
0.6
0.7
0.8
0.9
1
Rate (Kbps)
QoI
(c)
12 13 14 15 16 17 18 190.08
0.09
0.1
0.11
0.12
0.13
0.14
0.15
0.16
Rate (Kbps)
QoI
(d)
120 125 130 135 140
2.35
2.4
2.45
2.5
Rate (Kbps)
QoI
(e)
Fig. 3: The QRF function for the individual tasks. (a) OCR, (b) Face Recognition, (c) Motion
Detection, (d) Fingerprint Recognition, (e) Image Recognition.
{fingerprint recognition, image recognition, face recognition}. The idea here is that nodes may
concurrently use a number of applications, and different nodes may be using different applications
as well as different number of applications. The corresponding multi-application QRF functions
associated with the two task sets are shown in Figures 4 and 5, respectively. The arrows in
the figures show approximately when each application begins to receive service. In general,
if the rates at which applications begin to be useful are distant enough from each other in the
corresponding QRF functions, we expect to have in the resulting multi-application QRF function
as many “regions” as the number of applications.
0 50 100 150 200 250 3000
1
2
3
4
5
Rates (Kbps)
QoI
Motion Detection
Face Recognition
OCR
Fig. 4: The multi-application QRF function for the first task set, T1.
V. OICC REGION OF THE NETWORK
In order to demonstrate how one may use the QRF functions to compute the achievable QoI
that a network may yield while taking into account dependencies (such as interference) across

10
0 50 100 150 200 250 3000
0.5
1
1.5
2
2.5
3
3.5
4
4.5
Rates (Kbps)
QoI
Fingerprint Recognition
Face RecognitionImage Recognition
Fig. 5: The multi-application QRF function for the second task set, T2.
nodes, we consider a simple network configuration. Note that we use the term OICC region,
which stands for Operational Information Content Capacity region, for this quantity. This quantity
is reminiscent of the well known concept of capacity region, or achievable rate region, which
is used in traditional network theory to express the vector of rates that can be supported by the
network, see, for example, [4], [6]. The fundamental difference here is that we are not merely
interested in the rates that can be supported. Instead, we care about the information content that
can be supported, or, to put it differently, in the quality of the information that can be transferred
and the resulting quality of experience for the user.
Suppose we have two mobile nodes and a stationary base-station to which the mobile nodes
send the data of their assigned tasks. The task sets (T1) and (T2) defined above are assigned
to the first and second node, respectively. Using a centralized scheduler in the base-station
(e.g. TDMA), this network can achieve the rate region shown in Figure 6. Note that this two-
dimensional plot shows all rate vectors that are achievable in this network. For example, the
first user may be sending at a rate equal to 600 Kbps but then the second user does not have
any rate, or both users may send at 300 Kbps each, but the network cannot support both users
sending say at 400 Kbps.
The OICC region (achievable QoI region) corresponding to the base-station configuration is
shown in Figure 7. This region is computed by considering all possible achievable rate vectors
and computing the QoI obtained from each achievable rate vector. Putting all achievable QoI
vectors together yields the plot shown in Figure 7.
Figure 7 highlights some properties of the OICC region of the network under study which we

11
0 200 400 6000
100
200
300
400
500
600
Rate for user 1 (Kbps)
Rat
e fo
r us
er 2
(K
bps)
Fig. 6: The achievable rate region for the base-station configuration.
0 1 2 3 4 50
1
2
3
4
5
QoI for user 1
QoI
for
use
r 2
2
31
Fig. 7: The OICC region in the base-station configuration.
discuss below. Note that the concept of an OICC region is quite complex and general, and it is
beyond the scope of this paper to provide a full exposition of the concept.
• The region is composed of (n1 + 1) × (n2 + 1) discrete regions, where n1 and n2 are the
number of distinguishable applications available to the first and the second user respectively.
For example, in Figure 7, region 1 corresponds to the image recognition task of the first user
and the face recognition task of the second user. As another example, region 2 corresponds
to the case in which the second user does not achieve any QoI because the user gets no
rate or too small rate, whereas the first user does achieve some QoI.
• Region 3 in the figure clearly shows the effect of the rate region on the shape of the OICC
region. The upper right corner is constrained because the corresponding rate vectors are not
achievable.

12
A. More Complicated Scenarios
0 200 400 6000
100
200
300
400
500
600
Rate for user 1 (Kbps)
Rat
e fo
r us
er 2
(K
bps)
Achievable rate region
0 1 2 3 40
1
2
3
4
5
QoI for user 1
QoI
for
user
2
OICC Region
Fig. 8: The rate region and OICC region for the chain topology.
0 200 400 6000
100
200
300
400
500
600
Rate for short flows (Kbps)
Rat
e fo
r lo
ng fl
ow (
Kbp
s)Achievable rate region
0 1 2 3 4 50
0.5
1
1.5
2
2.5
3
QRF for user 1
QR
F fo
r U
ser
2
Achievable QRF region
Fig. 9: The rate region and OICC region for the chain-cross topology.
0 200 400 6000
100
200
300
400
500
600
Rate for outer flows (Kbps)
Rat
e fo
r in
ner
flow
s (K
bps)
Achievable rate region
0 1 2 3 4 50
1
2
3
4
5
QoI for the outer flows
QoI
for
the
inne
r flo
w
OICC region
Fig. 10: The rate region and OICC region for the asymmetric flow-in-the-middle topology.
It is interesting to study the behavior of the OICC region in more complicated scenarios,
which have been previously used in order to understand the complications posed by wireless

13
0 200 400 6000
100
200
300
400
500
600
Rate for outer flows (Kbps)
Rat
e fo
r in
ner
flow
s (K
bps)
Achievable rate region
0 1 2 3 4 50
1
2
3
4
5
QoI for outer flows
QoI
for
inne
r flo
ws
OICC region
Fig. 11: The rate region and OICC region for the symmetric flow-in-the-middle topology.
multi-hop networks in realizing scheduling and congestion control schemes. We have taken a
number of such canonical scenarios and computed their respective OICC regions.
The first such scenario is a chain topology, for which the graphical representation and the
results are presented in Figure 8. This presents two long flows which share a possibly infinite
chain network. The boundary of the rate region of this scenario is simply a line and the rate
region is symmetric. The data of the upper flow correspond to the first task set, T1, and the data
of the lower flow correspond to the second task set, T2. The asymmetry of the QRF functions
of the two task sets leads to the OICC region illustrated.
The next scenario considered is a chain-cross topology, in Figure 9, presenting a long flow
which competes with a number of short flows. In this case, allotting a certain rate to the long
flow decreases the rate of the short flows significantly. In this scenario, the short flows carry
packets for tasks chosen from the first task set while the long flow carries packets for tasks
chosen from the second task set. The figure shows the rate region as well as the OICC region.
The y-axis shows the rate and QoI for the long flow, and the x-axis shows the rate and QoI for
the short flows. Note that in our rate assignment, all short flows operate at the same rate and,
for the same application, experience the same QoI.
Figures 10 and 11 present a flow-in-the-middle scenario, where the outer and inner flows
use, in the first case, two different QRF functions, corresponding to the first and second task
sets respectively, and, in the second case, the same QRF function, namely the QRF function
corresponding to the second task set. Due to symmetry, the two outer flows have the same
properties, thus the x-axis on both the rate region and OICC region corresponds to both outer
flows. Despite the symmetric shape of the rate region, the OICC region is made asymmetric due

14
to the different QRF functions used by the flows in Figure 10, while the OICC region remains
symmetric in the second case since the same QRF function is used by all three flows.
VI. QOI AND SCALABILITY
As discussed in the previous sections, QoI – and consequently QoE – is typically a highly
non-linear function of the number of packets delivered at the destination. For example, an image
recognition application will perform nearly the same for a range of compression ratios, suddenly
experiencing a spike at some particular ratio. Given this, simply delivering the highest possible
rate is not necessarily the best option from a user QoE viewpoint. More generally, we would like
to know the capacity of a network (and relatedly, the scalability achievable) if we wanted not
the maximum throughput (as traditional asymptotic analyses targets), but the maximum QoI, or
the best QoE. In other words, given a certain QoE that is desired by the user of a network, what
is the the number of nodes that the network can scale to? And how sensitive is the scalability
to the QoI/QoE that is desired?
We investigate this question in the context of multihop wireless networks (such as mesh and
sensor networks). In [13] an approximate upper bound on the scalability of a network was
considered in terms of the “residual capacity”, that is, the difference between the available and
used capacities at a node. Assuming homogeneity, a coarse-grained model was developed based
on the simple observation that the network can support the offered flows if and only if the
residual capacity at every node in the network is positive. A generic expression was derived
there:
R = A −∑j
(1 + γj) · Dj, (3)
where Ris the residual capacity at a given node, indicating the capacity remaining at a node after
taking into account the load from all traffic sources from all nodes. This is the difference between
the available capacity A and the capacity Dj demanded by each source j (control overhead is
regarded as one kind of source), where γj in the equation is the contention factor that is a rough
inverse measure of the spatial reuse, and indicates the number of nodes that have to defer on a
transmission. We refer the reader to [13] for details on the contention factor and derivation of
Equation (3), and focus here on adapting the formulation to accommodate QoI.

15
Suppose that a network has M types of flows. Each flow j has its own QoI-rate function
QRFj(uj) where uj is one of the possible QoI values1 for the application corresponding to
flow j. Let ξ(s) be a function that maps a source rate s to its average contribution to a node’s
demanded capacity per Equation (3). ξ depends upon a number of factors such as the average
length of the flow, whether it is unicast or multicast etc. and is instantiated in the context of the
particular network. With these, the demanded capacity from flow j is
Dj = ξ(QRFj(uj)), (4)
where uj is the desired QoI of the application using flow j.
Combining with Equation (3), we have:
R = A −∑j
(1 + γj)ξ(QRFj(uj)). (5)
We are given application QoI requirements, and QRF can be obtained by empirical studies or
given as part of the application profile. ξ needs to be calculated on a case by case basis given
the topology and the traffic profile.
We illustrate the relationship between QoI and scalability using a specific example. Consider
a regular mesh network (also known as a “Manhattan grid”) of N nodes. A continuous stream
of traffic sent from each node to another node chosen uniformly at random.2 Suppose further
that we use the multi-application scenario given in Figure 4, and that we require a particular
application QoI (score) q. How many nodes can the network support (i.e., what is the upper
bound on N ) as a function of q?
To determine this, we apply Equation (5) to the scenario. QRF (q) = f−1(q) where f is the
function represented by Figure 4 that maps rates to achievable QoI.
Since the source and destination are chosen randomly, the scope of a flow is the average
path length. In [14], the average path length for a regular mesh of N nodes is shown to be23·√N . Thus, the used capacity per node in an N node network each node generating x bps is
ξ(x) = 23·√N · x approximately.
1Per flow QoI allows flexibility to have the range of values appropriate for the application for that flow.2This is not intended to model any particular operational scenario, only an example to illustrate our model in a simple manner.

16
Finally, the contention factor for unicast traffic in a mesh network is γ1 = 7 since the receiver
plus three neighbors of each of sender and receiver have to defer on this transmission. Since
we consider a stationary network, and are only looking for an approximate upper bound on
the scalability, we ignore the routing overhead and assume the overhead due to MAC control
messages is negligible.
Substituting in Equation (5), and noting that maximum scalability is when R = 0, we have
A = (1 + 7) · 23·√N · f−1(q), which simplifies to
N = [3 · A
16 · f−1(q)]2. (6)
We note that given the coarseness of the model and the abstraction of many details, the above
is by no means intended to be an accurate predictor of N in a real network. However, since the
main intent is to study how the scalability changes with respect to QoI (rather than focus on
absolute values), such an approximate upper bound suffices.
Figure 12 shows our numerical results for the scalability achieved by the multi-application
shown in Figure 4. We consider two data rates 5 Mbps and 10 Mbps (the value of A in the above
equation), and plot one curve for each. In particular, on the X-axis we have a desired QoI. The
Y-axis shows, on a logarithmic scale, the scalability (number of nodes) that can be achieved if
we deliver that QoI using the multi-application mapping function. We can discern three regions,
corresponding to each of the individual applications. As can be seen, there is a dramatic drop
in scalability even for moderate QoI. Note that the scalability is plotted on a logarithmic scale,
and therefore the difference is quite significant – more than five orders of magnitude between
the highest and lowest QoI!
Clearly, there is a remarkable difference in the scalability depending upon the QoI, and hence
QoE desired. That QoI makes a difference is not suprising, but the magnitude of difference is
surprising, along with the fact that there are some critical thresholding points. Our preliminary
work shows that scalability analysis with QoI awareness has the potential to open up new tradeoff
points with significant potential benefits in scalability. For instance, it can potentially indicate
when it makes sense to reduce QoI a bit and possibly gain significantly in scalability (e.g. from
QoI=3 to QoI=2 in Figure 12) and when such reductions will only give a marginal increase in
scalability (e.g. from QoI=5 to QoI=4 in Figure 12).

17
!"
!#"
!##"
!###"
!####"
!#####"
!######"
!#######"
#$##"
!$%%"
!$&'"
($#)"
($(*"
($)&"
($+("
($&&"
($*#"
($',"
)$!)"
)$%'"
)$*("
)$'!"
)$,*"
%$!!"
%$!+"
%$(%"
%$(&"
%$(,"
%$)#"
%$)'"
%$%("
%$%)"
%$%*"
%$+!"
%$++"
%$+&"
%$&%"
%$*'"
%$'("
!"#$#%
&$&'()
*+,)
!"#$#%&$&'()-.)*+,)
+"-./0"123450" !#"-./0"123450"
Fig. 12: Approximate upper bound on the number of nodes to which the network scales, as a
function of QoI (logarithmic scale).
VII. CONCLUDING REMARKS
For a broad class of applications, the QoE of a network user is directly related to the
QoI delivered by the network. We have presented the first QoI-aware analysis of wireless
networks. Using the concept of QoI-to-rate (QRF) function, extended to multiple applications, we
have characterized the operational information content capacity (OICC) of multiple QoI flows,
analogous to traditional capacity regions. Additionally, using the framework in [13], we have
analyzed, approximately, the practical scalability of motion detection, OCR, and face recognition
applications in a regular mesh network with 802.11g radios. Our results show that the scalability
of a network is highly sensitive to the QoI that is required by the applications it is supporting.
More specifically we show that there can be an order of magnitude increase in the number of
nodes a network needs to support a slight decrease in delivered QoI.
REFERENCES
[1] C. Bisdikian, D. Verma, L. Kaplan, M. Srivastava, and D. Thornley. Defining quality of information and metadata for
sensor-originating information. In 4th USMA Network Science Workshop, 2009.
[2] M. Burgess, W. Gray, and N.J. Fiddian. Establishing a taxonomy of quality for use in information filtering. In Proceedings
of the 19th British National Conference on Databases: Advances in Databases, 2002.
[3] M. Grossglauser and D. Tse. Mobility increases the capacity of ad-hoc wireless networks. IEEE/ACM Transactions on
Networking, 10:477–486, 2002.
[4] P. Gupta and P. R. Kumar. The capacity of wireless networks. IEEE TRANSACTIONS ON INFORMATION THEORY,
46(2), March 2000.
[5] Department of the Army Headquarters. Field manual 6-0: Mission command: Command and control of army forces, 2003.

18
[6] Apoorva Jindal and Konstantinos Psounis. The achievable rate region of 802.11-scheduled multi-hop networks. IEEE/ACM
Transactions on Networking, 17(4), August 2009.
[7] F. P. Kelly. Charging and rate control for elastic traffic. In European transactions on Telecommunications, volume 8, pages
33 – 38, 1997.
[8] F. P. Kelly, A. K. Mualloo, and D. K. H. Tan. Rate control for communication networks: shadow prices, proportional
fairness and stability. In Journal of the Operational Research Society, pages 237 – 252, 1998.
[9] S. H. Low and D. E. Lapsley. Optimization flow controli: basic algorithm and convergence. In IEEE/ACM Transactions
on Networking, volume 7, pages 861 – 874, 1999.
[10] A. Mascher-kampfer, Herbert Stgner, and Andreas Uhl. Comparison of compression algorithms impact on fingerprint and
face recognition accuracy. In in Visual Computing and Image Processing VCIP 07, Proceedings of SPIE, 2007.
[11] P. Missuer, S. Embury, M. Greenwood, A. Preece, and B. Jin. Quality views: Capturing and exploiting the user perspective
on data quality. In Proc. of ACM VLDB, 2006.
[12] Department of Defense. Joint publication 6-0: Joint communications system, 2006.
[13] R. Ramanathan, R. Allan, P. Basu, J. Feinberg, G. Jakllari, V. Kawadia, S. Loos, J. Redi, C. Santivanez, and J. Freebersyser.
Scalability of mobile ad hoc networks: Theory vs practice. In MILCOM 2010, pages 493 –498, 31 2010-nov. 3 2010.
[14] J. Silvester and L. Kleinrock. On the capacity of multihop slotted aloha networks with regular structure. IEEE Transactions
on Communications, 31:974–982, 1983.
[15] Yanjun Yan, R. Muraleedharan, Xiang Ye, and L.A. Osadciw. Contourlet based image compression for wireless
communication in face recognition system. In Communications, 2008. ICC ’08. IEEE International Conference on, pages
505 –509, May 2008.
[16] Jar-Ferr Yang, Shih-Cheng Chang, and Chin-Yun Chen. Computation reduction for motion search in low rate video coders.
Circuits and Systems for Video Technology, IEEE Transactions on, 12(10):948 – 951, October 2002.