Embed Size (px)
Citation preview

1
Published as: Rodgers, M., Kielty, A., Healy, M.G. 2014. Performance of granitic, shale, and 1
limestone forest road aggregates subjected to repeated loading. ASCE Journal of Transportation 2
Engineering 140(4): 47-54. ISSN: 0733-947X DOI: 10.1061/(ASCE)TE.1943-5436.0000654 3
4
The performance of granitic, shale and limestone forest road aggregates under repeated 5
loading 6
7
M. Rodgers1, A. Kielty2, M.G. Healy3 8
9
ABSTRACT 10
11
This study compared the performance of three aggregate layerings, commonly used in the 12
construction of unbound forest roads in Ireland, when they were subjected to repeated 13
loading in a new large-scale test rig. These layerings comprised (i) a layer of uncrushed, 14
granitic, sandy gravel - a good quality road aggregate (ii) a layer of shale - a poor quality 15
aggregate, and (iii) a layer of crushed limestone – an excellent quality aggregate with a wet 16
mix macadam (WMM) grading – on top of a poor quality shale sub-base layer . The 17
repeated load testing rig was designed and constructed to test different surface or 18
completion layering thicknesses of the aggregates over a common formation or subgrade 19
1 Managing Director, Rodgers Morgan Environmental Ltd., Barna Road, Galway, Republic of Ireland. 2 Graduate student, Civil Engineering, National University of Ireland, Galway, Republic of Ireland. 3 Lecturer, Civil Engineering, National University of Ireland, Galway, Republic of Ireland (corresponding author). Email: [email protected]

material of silty sandy soil. This testing was achieved by surface loading the aggregates 20
through a 200 mm-diameter rubber pad - attached to a hydraulic actuator on the test rig - 21
for up to 150,000 load applications. The subgrade pressures and surface deflections were 22
measured at applied stresses of 500 kPa, 750 kPa and 1000 kPa. The good quality granitic 23
aggregate performed much better than the poor quality shale aggregate under the repeated 24
loading and is suitable as a completion material for use in unbound forest roads. The shale 25
aggregate can be used in unbound forest roads as a sub base material. 26
27
CE Database subject headings: Access roads; aggregates; load bearing capacity; load 28
tests; loads; forests. 29
30
INTRODUCTION 31
32
The Irish forestry company, Coillte Teoranta, is the biggest constructor of unbound roads 33
in Ireland and builds approximately 300 km of new and upgraded roads per year. Forest 34
roads should ideally be constructed using high quality aggregates. These roads should be 35
built as economically as possible, while achieving a standard of road that is structurally 36
capable of doing its job. In many areas in Ireland these quality aggregates are not available 37
locally. In some cases a decision has to be made between importing higher quality material 38
at high prices, or using greater thicknesses of poorer local material in the road construction. 39
40
The pavement layers in unbound forest roads are normally defined as follows: 41
(1) the formation layer is the underlying prepared in-situ soil under the road, more 42
commonly known as the subgrade. 43

3
(2) the completion layer is the top layer of the road. In forest road construction, the 44
completion layer can be constructed from suitable local aggregates. If it’s necessary to 45
place a layer of imported aggregate on top of a layer of local aggregate, then the local 46
aggregate layer is commonly known as the sub base. 47
48
Well graded aggregates of high strength and durability, and compacted at their optimum 49
water content (OWC), can form a strong road pavement completion layer that reduces the 50
transfer of excessive applied stresses from moving vehicular wheels to lower strength sub 51
base and subgrade layers. Also, the sub base and subgrade layers must be of adequate 52
thickness, compaction and strength to accommodate, at acceptable deformations, the 53
stresses transferred through the completion layer. 54
55
Kennedy (1985) and Dawson et al. (1993) stated that suitable materials for granular layers 56
in a road pavement should have a high stiffness to give good load spreading properties, and 57
high shear strength to reduce rutting under construction traffic. They should also have a 58
high permeability to allow surface water to drain freely and quickly, have non-plastic fines 59
to maintain strength under wet conditions and not be susceptible to frost damage (Kennedy 60
1985). Unbound roads with a high proportion of unsuitable fine-grained completion 61
material may be subject to surface disintegration due to its low shear strength (Simonsen 62
and Isacsson 1999; Lekarp et al. 2000). As the contact pressure from a tire is mainly 63
supported by the completion layer, the load from the tire can increase the pore water 64

pressure in the road material when drainage is restricted. This pore water pressure increase 65
can make unsuitable completion material unstable and may result in permanent 66
deformation of the road surface (Simonsen and Isacsson 1999). 67
68
Indentations, called ruts, can develop at the surface of the completion layer over time. The 69
rut depth, s (mm), may be calculated for geosynthetic, reinforced pavements from Giroud 70
and Han (2004a): 71
72
uCE
s
cNh
r
Nh
rJrr
Rhh
fr
P
s
2
2
5.12
2
exp9.011
log006.1661.0868.0
1204.0
[1] 73
74
where J is the aperture stability modulus of the geogrid (m N/o); r, the radius of the 75
equivalent tire contact area (m); h, the depth of the completion layer (m); N, the number of 76
loading cycles; P, the wheel load (kN), Nc, the bearing capacity factor; fs, the maximum 77
allowable rut depth (75mm); and cu, the undrained cohesion of the formation layer (kPa). 78
The limited modulus ratio, RE, can be calculated from Giroud and Han (2004a): 79
80
0.5,
48.3min0.5,min
3.0
fl
cl
fl
clE CBR
CBR
E
ER [2] 81
82
where Ecl and Efl are the completion layer and formation layer resilient moduli, 83
respectively (MPa), and CBRcl and CBRfl are the California Bearing Ratios (%) of the 84

5
completion layer and formation layer aggregates, respectively. The design method of 85
Giroud and Han (2004a) is unique insofar as it is theoretically based and experimentally 86
calibrated, and the inter-relationships between various parameters (stress distribution, 87
traffic volume, rut depth, etc.) are contained within a single equation, whereas more than 88
one equation was needed with earlier methods (Giroud and Noiray, 1981; Giroud et al. 89
1985). 90
91
The study objectives were: 92
1. To design and build a repeated load testing machine that establishes the efficacy of 93
using locally available aggregates in unbound forest road construction. 94
2. To collect, classify and perform repeated load tests on three aggregate materials 95
that are currently used, singly or in combination, by Coillte Teoranta in Ireland for forest 96
road construction. These materials were a good quality granite aggregate, a poor quality 97
shale aggregate and a crushed limestone with a wet mix macadam grading (WMM). 98
3. To model the performance of the unbound aggregates using the finite element 99
program, SIGMA/W, and Equations 1 and 2. 100
101
MATERIALS AND METHODS 102
103
Aggregate testing 104
105

The formation material consisted of a silty, sandy soil with small amounts of clay from 106
Castledaly, County Galway. This soil was cohesive and was representative of subgrade 107
soils found in Ireland. The three completion materials examined were a good quality 108
granite aggregate from the Wicklow/Wexford region, a poor quality shale aggregate from 109
the Leitrim region and a crushed limestone from a Galway quarry. The Wicklow/Wexford 110
aggregate was an uncrushed, granitic, sandy gravel. It was chosen as the main sample for 111
testing because its grading curve was almost entirely within the grading envelope for a wet 112
mix macadam (WWM, Clause 810). The second aggregate was a shale and was extracted 113
from a pit situated in the Arigna mountains near the village of Drumkeeran, Co. Leitrim. 114
This aggregate is a mud shale, is soft and fissile, and disintegrates rapidly under loading 115
and weathering. The crushed limestone, which is often used as completion material on top 116
of poor local aggregates by Coillte Teoranta, was obtained from a quarry outside Galway 117
City and graded to the specification of a WWM. 118
119
Classification tests, including tests for natural water content, Atterberg limits, specific 120
gravity and particle size distribution, were carried out on both the formation and the 121
completion materials in accordance with BS 1377 (1990). 122
123
The completion materials were also tested for durability - a measure of an aggregate’s 124
resistance to environmental influences like wetting, thermal expansion/contraction and 125
freeze/thaw effects. Durability was tested using the magnesium sulphate soundness value 126
(MSSV) test and the water absorption value (WAV) test. In bound roads, an MSSV > 75% 127
is required for all road base and sub base aggregates, and a WAV < 2% is required for 128
most road aggregates (BSI 812, 1990). The strength of the completion layer aggregates 129

7
was also tested using the Aggregate Crushing Value (ACV) (BS 812 1990), the 10% Fines 130
Value (TFV) (BS 812 1990), the Aggregate Impact Value (AIV) (BS 812 1990), the 131
Aggregate Abrasion Value (AAV) (BS 812, 1990), and the California Bearing Ratio 132
(CBR) (BS 1377 1990). In the field, the CBR of the completion material is dependent on 133
the CBR of the formation (Giroud and Han 2004b). The cohesive strength of the formation 134
material, cu, was determined from the direct shear test (BS 1377 1990). 135
136
Placement of materials and instrumentation 137
138
The completion layer aggregates were compacted in a bin, on top of the 1000 mm-thick 139
formation material, and tested at different thicknesses. The edges of the bin were sealed 140
with silicone mastic and the bin was lined with a double layer of polythene. This was to 141
ensure equilibrium of soil-water in the formation layer and to reduce friction along the bin 142
sides. The formation material was compacted in the bin close to its maximum dry density 143
as determined by the Proctor test (BS 1377 1990). Approximately 2,700 kg of soil was 144
dried below the OWC, using an industrial gas heater, and placed in plastic bags, after 145
removing particle sizes greater than 20 mm. The mass and water content of each bag of 146
soil was calculated and recorded. The appropriate mass of water was added and mixed to 147
each sample to increase the water content to its optimum value. The bags were then sealed 148
to allow the soil-water to equilibrate. The soil was compacted in 50 mm layers in the bin to 149
a height of 1000 mm, using a vibrating hammer with a 150 mm x 150 mm plate and an 150

applied force of approximately 400 N. Water contents were taken at each layer and an 151
average water content was calculated. The dry density and water content of the soil was 152
also monitored using a nuclear density probe, at different heights, as the soil was placed. 153
The preparation of the formation layer took approximately 4 - 5 weeks. 154
155
The completion materials were compacted, in 50 mm layers, close to their maximum dry 156
density as determined by the vibrating hammer test. All particles significantly greater than 157
50 mm were removed from the completion materials to aid compaction. This removal had 158
no significant change on the particle size distribution of the granite, but made the particle 159
size distribution of the shale finer. The dry density and water content of the compacted 160
materials were monitored using a nuclear density probe. 161
162
The resilient and permanent deflections, and resilient pressures in the soil, which occurred 163
on load application, were measured using displacement linear strain conversion transducers 164
(lscts) (MPE Transducers Ltd., UK), and hydraulic pressure cells, all with excitation 165
voltages of 10 volts d.c. and an output range of 0-200 millivolts d.c. (resilient behaviour is 166
also referred to as recoverable or elastic behaviour). The lscts were calibrated using a 167
micrometer block and a computer program (LabVIEWTM, National Instruments Ltd., 168
Austin, USA) before use. The spindle axis of each soil surface lsct, as well as of each of 169
two standard dial gauges, were positioned along a vertical plane that coincided with the 170
central vertical axis of the loading pad, as shown in Figure 1. The maximum spindle travel 171
distances of the lscts used in this study varied between 15 mm and 25 mm, the larger being 172
positioned nearer the central vertical axis of the pad. 173
174

9
As the formation soil was being placed and compacted in the soil bin of the test rig, four 175
100 mm diameter x 6.5 mm deep pressure cells were positioned horizontally in the 176
formation material (Figure 1) at heights of 300 mm (D), 500 mm (C), 700 mm (B) and 900 177
mm (A) above the soil base, with their centers coincident with the central vertical axis of 178
the loading pad. Two 0-10 bar cells were placed towards the top of the bin at positions C 179
and D, one 0-5 bar cell at position B and one 0-2 bar cell at position A.. The pressure cells 180
were calibrated in a water-filled triaxial cell at a range of appropriate cell pressures. When 181
placing the pressure cells, the soil was compacted to a height of 25 mm above the desired 182
height of the cell. A 50 mm-deep recess for the cell and cables was then dug out of the 183
compacted soil. Layers of coarse-to-fine soil were placed under and over the cells, with the 184
fines closest to the face of the cells. The next 50 mm layer of soil was added and 185
compacted. This method of placement protected the pressure cells from possible damage 186
due to compaction, as there was at least 75 mm of soil between the pressure cell and the 187
vibrating hammer. Rubber tubing was placed along the pressure cell cables for extra 188
protection. 189
190
Loading rig construction 191
192
A repeated-load testing machine was designed and constructed to apply pressures, similar 193
to that of a truck tire, to the aggregate materials (Figure 1). The load frame was designed to 194
withstand several hundred thousand cycles of loading up to 40 kN with minimal 195

deflections. It comprised two simply supported steel frames of universal beams (Steel 196
Grade 43) constructed in parallel on common steel base-plates. 305 x 165 UB 40 sections 197
were used for both the beams and columns. Two No. 700 x 700 mm holes were broken out 198
of the existing concrete floor and eight No. M20 Gr. 8.8 x 180 bolts were sunk to a depth 199
of 140 mm in a 200 mm depth of C40 concrete (28 day strength = 40 N mm-2) to provide a 200
suitable reaction for the base-plates of the frame. Flat strips of metal were welded to the 201
ends of the bolts to ensure complete grip in the concrete. 202
203
The design of the loading pad was similar to that used by Davitt (1982). The pad 204
comprised a 200 mm diameter x 45 mm thick rubber disc (Dunlop, England) and was 205
identical to that used in truck tires. The rubber was bonded to a robust steel frame, which 206
was bolted to a universal joint which, in turn, was screwed onto the end of the actuator 207
piston. The purpose of the universal joint was to ensure that the surface of the pad 208
remained parallel to the surface of the soil should any differential deformation occur 209
during testing. In this study, vertical pressures were applied to the unbound surface layer, 210
and resulted in a combination of vertical, horizontal and shear stresses in the completion 211
and formation layer materials. Similar loading techniques have been used in other studies 212
(Moghaddas Tafreshi and Khalaj, 2007). 213
214
The whole system was controlled and monitored by a programmable servo-amplifier that 215
was mounted within an electrical enclosure. The programmable servo-controller (PSC) was 216
programmed to drive the actuator to the desired loading cycle. The loading cycle had a 3-217
second duration (frequency = 0.33 Hz.), and comprised 1 second of loading and 2 seconds 218
of recovery. Different levels of loading were applied in a cyclic manner to the aggregate 219

11
material. Each level of loading was applied for a maximum of 50,000 cycles. The average 220
contact area of a truck tire on a road is 175 mm x 225 mm (0.0394 m2). A load of 29.43 kN 221
over this area yields an applied pressure of 746 kPa. 222
223
The loading procedure adopted was as follows: 224
50 x 103 cycles at an applied pressure of 500 kPa (lightly-loaded axle) 225
50 x 103 cycles at an applied pressure of 750 kPa (normally-loaded axle) 226
50 x 103 cycles at an applied pressure of 1000 kPa (heavily-loaded axle). 227
The two lower loadings provided a level of conditioning in the completion material, which 228
can occur on a forest access road during drainage and tree planting activities in peatland, 229
and during about 20 years of limited site service traffic prior to harvesting and extraction 230
of the tree trunks, which would subject the road to the heaviest loading. Unpaved roads are 231
typically designed for 100,000 axle passes (Giroud and Han 2004a), so this test examined 232
the performance of the aggregates in an extreme loading scenario. 233
234
The physical responses measured during the repeated load testing on the completion 235
materials were: 236
(1) permanent surface deformation versus number of loading cycles using the lscts and 237
dial gauges 238
(2) resilient surface deflections versus number of loading cycles 239

(3) resilient pressures in the pressure cells, located in the formation soil directly under 240
the loading pad . 241
242
The completion material and the top 50 mm layer of the formation material were removed 243
after each test. The top 50 mm layer was replaced with soil compacted at its OWC. A 244
previous study on a similar completion material, 150 mm deep, which was subjected to 50 245
x103 cycles at 500 kPa, followed by 50 x103 cycles at 750 kPa and 50 x103cycles at 1000 246
kPa, resulted in little deformation in the formation material (about 2 mm) at the higher 247
maximum resilient pressures (Rodgers et al., 2009). As the formation material was 248
compacted in 50 mm layers, it was considered adequate to remove only the top 50 mm 249
layer. 250
251
Six full-scale tests were performed on the different materials and are listed in Table 1. 252
Surface deformations of the completion layer and resilient pressures in the formation layer 253
were measured during cyclic loading for the following road structure arrangements and 254
conditions: (i) 250 mm-deep (Test 1) and 150 mm-deep (Test 2) layers of granite, and 250 255
mm-deep (Test 3) layer of shale completion materials; (ii) capping of a 250 mm-deep shale 256
layer with 200 mm-deep (Test 4) layer of crushed limestone graded to the specification of 257
a WMM (a well-graded crushed rock); (iii) the effect of water addition to the surface of the 258
limestone (Test 5), and (iv) the 1000 mm-deep formation soil on its own (Test 6). In Tests 259
1-5 the completion materials were tested on top of the 1000 mm deep formation soil. For 260
Test 4, 200 mm of a crushed limestone was compacted at a water content of 3.3% onto a 261
250 mm layer of the shale to determine if the shale would perform satisfactorily as a sub 262
base material. After completion of this 150 x 103 cycle test, 10 mm of water was sprayed 263

13
onto the surface of the limestone and allowed to soak for one hour. This test (Test 5) was 264
then started at an applied pressure of 500 kPa for a duration of 4 x 10³ loading cycles and a 265
comparison was made between the physical responses of this unbound layering in the dry 266
state and in the wet state. In Test 6, the formation soil was tested under a repeated loading 267
of 150 kPa without a completion material to determine its performance, and to provide 268
resilient data for finite element program calibration to estimate E values for the formation 269
soil. Approximately 3 - 4 weeks were required for the preparation, loading and analysis of 270
Tests 1-4, 6. 271
272
Identification of model parameters 273
274
The validity of Eqn. 1 for the prediction of the rut depth, s, was investigated by comparing 275
the measured versus the predicted values of s. As the aggregates were un-reinforced and 276
unpaved, J = 0 and Nc=3.14. The radius of the tire contact area, r, was 0.1 m. As Eqn. 1 is 277
only valid for CBRfl ratios less than or equal to 5 (Giroud and Han 2004a), the E-values of 278
the formation and completion layers were used to calculate RE. In order to estimate the E 279
values of the formation and completion materials for Eqn. 1, a series of elastic-plastic 280
simulations with estimated E values were conducted using SIGMA/W (SIGMA/W, GEO-281
SLOPE International Ltd., Alberta, Canada), until the resilient pressures and deflections 282
from these simulations were close to those recorded in the repeated loading experiments 283
carried out in the test rig. The formation and completion material cohesion, c, and soil 284

friction angle, Ф, - some of the parameters required for SIGMA/W to model residual 285
responses - were determined from shear box tests. The Poisson’s ratio, υ, for the formation 286
and completion material was after Evdorides and Snaith (1996). 287
288
SIGMA/W contains three separate programs, Define, Solve and Contour. The Define 289
program involves the plotting of the system geometry. Numeric parameters are defined by 290
manually inputting the values. The Solve program is used to compute the deformations and 291
stress changes. The Contour program graphs the computed parameters. SIGMA/W 292
comprises eight elastic and plastic constitutive soil models, all of which may be applied to 293
two-dimensional plane strain and axisymmetric problems. From the graphs of permanent 294
deformation versus number of cycles, all the materials tested showed signs of plastic 295
behavior due to their continual increase in permanent deformation with increasing number 296
of loading cycles. The elastic-plastic model was therefore used to model the experimental 297
results. 298
299
RESULTS AND DISCUSSION 300
301
Placement of materials 302
303
The granite aggregate was compacted at an average water content of 6.6 % (OWC, 8.3%) 304
with an average dry density of 2.1 Mg m-3; the shale was compacted at an average water 305
content of 9.1% (OWC, 10.3%) with an average dry density of 1.5 Mg m-3 (Table 1). 306
307
Soil classification tests 308

15
309
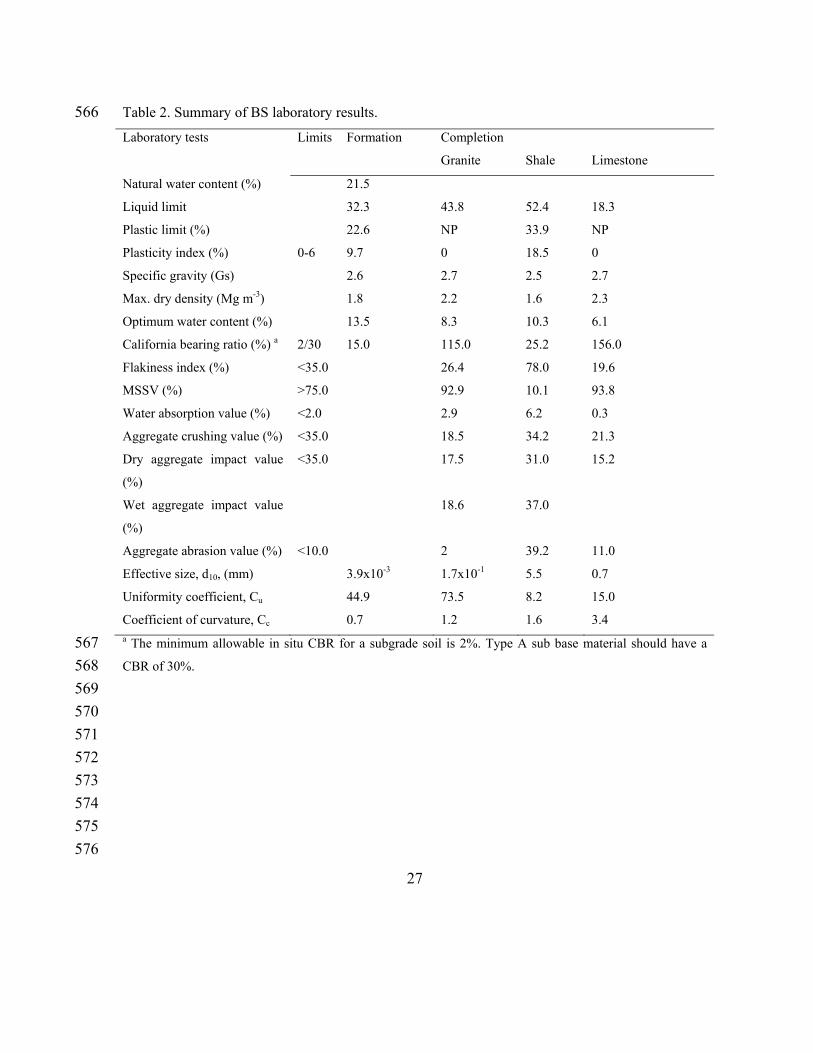
The results from the soil classification tests are shown in Table 2 and the particle size 310
distributions are in Figure 2. The formation was a well-graded formation soil, achieving 311
high levels of strength, with a CBR of 15%, when compacted at its OWC. This soil was 312
sensitive to water - an increase of 3% in water content resulted in a reduction in CBR to 313
2%. 314
315
The shale aggregate was a mud shale; poorly graded, flaky and lacking in fines, making it 316
difficult to compact. The aggregate was low in strength and durability. The results of the 317
ACV and the AIV tests for the shale, tested in its dry state, indicated that it could just meet 318
most specifications for these tests. However, the CBR of the proposed shale completion 319
aggregate was only 25.2% at its OWC and the ratio of its CBR ratio to that of the 320
formation material (15% at OWC) was less than 2, indicating that a completion shale layer 321
might not provide adequate strength in unbound road construction (Hammitt, 1970). The 322
granite was a well-graded, sandy gravel, achieving high degrees of compaction. The 323
aggregate was high in strength and durability and the CBR ratio of the granite to the 324
formation material was approximately 7. The limestone aggregate had good strength and 325
durability, was relatively well-graded and the CBR ratio of the limestone aggregate to the 326
formation material was approximately 10. 327
328
Resilient pressures 329

330
In Test 1 (250 mm of granite), the pressure in Cell D (100 mm from the surface of the 331
formation material), for an applied pressure of 1000 kPa, was approximately 98 kPa 332
(Figure 3). In Test 2 (150 mm of granite), a reduction in the completion layer thickness 333
from 250 mm to 150 mm resulted in an increase in the Cell D pressures. Test 3 (250 mm of 334
shale) was stopped after 10x103 cycles, at an applied pressure of 500 kPa, due to excessive 335
deformations of the material. The pressures in Cell D in Test 3 increased from an initial 336
value of 64 kPa to 104 kPa, suggesting a consistent weakening of the shale under loading. 337
It can be concluded that the shale is a poor road making material; it failed dramatically 338
under the low pressure of 500 kPa. This poor performance may be due, in part, to the low 339
CBR ratio between the completion and formation materials (Giroud and Han 2004b). In 340
Test 4 (200 mm of limestone aggregate on 250 mm of shale), the pressures in Cell D, at an 341
applied pressure of 500 kPa, increased only from 31 kPa to 38 kPa in approximately 30 x 342
103 cycles of loading in comparison with the increase from 64 kPa to 104 kPa for the shale 343
completion material at the same applied pressure in Test 3. After the 150x103 cycle test on 344
the limestone over shale sub base was completed, the material was wetted, and the test was 345
restarted at the applied pressure of 500 kPa for a duration of 4x10³ cycles (Test 5), during 346
which the pressures in Cell D increased from 50 kPa to 57 kPa (Figure 3) - an increase of 347
about 55% due to the addition of the water. 348
349
Resilient deflections 350
351
The maximum resilient deflection at the centre of the loading pad in Test 1 (250 mm of 352
granite) was approximately 1.2 mm for an applied pressure of 1000 kPa (Figure 4). In Test 353

17
2, a reduction from 250 mm to 150 mm in the granite thickness resulted in a maximum 354
resilient deflection of 1.6 mm for an applied pressure of 1000 kPa, a 33% increase on the 355
maximum deflection measured at the same pressure in Test 1. In Test 5 the addition of 356
water to the limestone aggregate layer had a significant negative effect on its performance 357
under loading. The maximum resilient deflection measured, at an applied pressure of 500 358
kPa, ranged from 0.72 mm - 0.8 mm in the dry state to 1.15 mm - 1.2 mm in the wet state - 359
an average increase of 55%. Zakaria and Lees (1996) also found that the deflections of 360
densely graded brick and quartz aggregates, when wetted, increased considerably under 361
pressures of 210 kPa at less than 2000 cycles of loading. 362
363
Permanent deformations 364
365
In Test 1, the overall permanent deformation in the 250 mm-thick granite completion layer, 366
directly under the loading pad, was 4.5 mm (Figure 5) after 150 x 103 cycles. This was not 367
very much different from the surface deformation for the 150 mm granite completion layer 368
in Test 2. The addition of the limestone layer on top of the shale in Test 4 improved on the 369
performance of the shale alone in Test 3 but the limestone/shale performance was still 370
poorer than the performances of the two granitic completion layers. The combined 371
limestone/shale layering in Test 4 produced significantly lower resilient stresses than in 372
Test 3 and prevented any deformation occurring in the formation material. However, the 373

permanent deformations were much greater for the combined material test (Test 4) than for 374
the granite completion layers in Tests 1 and 2. 375
376
Prediction of rut depths under repeated loadings 377
378
As all the materials tested showed a continual increase in permanent deformation with 379
increasing number of loading cycles (Figure 5), the elastic-plastic SIGMA/W model was 380
used in modelling the experimental results. The effectiveness of Eqn. 1 in predicting rut 381
depths is dependent on: (i) the measured undrained cohesion of the formation soil and (ii) 382
the E values of the formation and completion materials, estimated from SIGMA/W. 383
Estimates of the E-values were made through calibrating resilient pressure and deflection 384
values from the finite element model, SIGMA/W, with results measured in the rig 385
experiments, and these E estimates are given in Table 3. The E values for the formation 386
soil were estimated firstly from the resilient pressures and deflections measured in Test 6. 387
These formation E estimates were then used to estimate the granite aggregate E values 388
from the resilient results in Tests 1 and 2; Table 4 shows the excellent calibration achieved 389
for the 250 mm thick granite aggregate layer - also excellent for the 150 mm thick granitic 390
layer. The shale aggregate E value was obtained similarly from the resilient results in Test 391
3, but the calibration was only moderate for the shale aggregate. The limestone aggregate E 392
value was then estimated from calibrating the Test 4 resilient results using the previously 393
calibrated formation and shale E estimates; this Test 4 calibration was good for the 394
limestone/shale aggregates. 395
396

19
The estimated E values of the granite - for similar stresses and densities used in the present 397
study - were close to those given by (i) Hopkins et al. (2007) in their Figure 40, and (ii) 398
Boudali and Robert (1997) from the equation for resilient modulus, MR = k1. k , where, 399
for a granite aggregate, k1 has a value of 8139 kPa, k2 a value of 0.6, and is the sum of 400
the principal stresses. The estimated E values of the limestone aggregate appear low in 401
comparison with the granite values, particularly at the higher applied pressures of 750 and 402
1000 kPa; this could have resulted from the availability of only an estimated E shale 403
aggregate value at the low pressure of 500 kPa in Test 3. 404
405
The estimated E values from SIGMA/W were used to predict the rut depths (permanent 406
deformations) in the granite aggregates at three cycles – 50,000, 100,000 and 150,000 - for 407
Tests 1 and 2 using Eqn. 1 (Table 5). When the E values of 29 MPa for the top 50 mm of 408
the formation layer and 37 MPa for the formation soil below the top 50 mm layer were 409
used in SIGMA/W, the simulated results of the permanent deformations in the two granite 410
aggregate completion layers were within 2 mm of those measured in the loading rig. 411
412
The calculated and modeled rutting depths were of the same order as other studies. Zakaria 413
and Lees (1996) measured rut depths of between 4 and 9 mm in brick and quartz 414
aggregates, which were subjected to a tire contact pressure of up to 210 kPa in laboratory 415
experiments. In the same study, the rut depth increased by between 30 and 80% when the 416
material was saturated (the water content was not specified in the study). Other factors 417

such as tire inflation and wheel load may also impact on rut depth, as Douglas (1997) 418
found that significantly shallower ruts formed in a Gault clay aggregate, subjected to 419
tracking wheel loads at up to 10,000 passes, when the tire inflation pressure was reduced 420
from 690 kPa to 345 kPa. 421
422
CONCLUSIONS 423
424
The main observations from the testing were: 425
426
1. The formation material was a well graded soil capable of high strength when 427
compacted at the OWC; however, its strength reduced significantly when the water content 428
increased by 2 – 3 % above the optimum. 429
2. Granite aggregate, with a thickness of just 150 mm, is a good completion material 430
capable of supporting applied pressures of 1000 kPa for 50,000 cycles with resulting 431
permanent deformations of less than 5 mm. 432
3. Shale at a depth of 250 mm is a poor quality completion aggregate, but can be 433
made serviceable with a 200 mm top layer of high quality limestone aggregate. 434
4. The use of Eqn. 1 to estimate the rut depth for un-reinforced, unpaved granite 435
aggregate gave permanent deformations within 2 mm of the experimental measurements. 436
5. The resilient performance of granitic aggregate on top of a silty sandy formation 437
soil can be modeled using the finite element program SIGMA/W. 438
439
ACKNOWLEDGEMENTS 440
441

21
This project was part funded by the Council for Forest Research and Development 442
(COFORD) under the operational Programme for Agriculture, Road Development and 443
Forestry, supported by EU structural funds. Financial support was also obtained from 444
Coillte Teoranta. The authors would like to express their appreciation to the late Dr. John 445
Mulqueen, NUI, Galway. 446
447
REFERENCES 448
Boudali, M., and Robert, C. (1997). “Détermination en laboratoire du module réversible 449
des matériaux de fondations. Transport Québec. In: Receuil des communications 32 450
Congrès de l’AQTR, Tome 2, pp. 107-128. 451
452
BS 1377 (1990). Method of test for soils for civil engineering purposes. London: British 453
Standard Institution, London. 454
455
BS 812 (1975, 1989, 1990). Methods for sampling and testing mineral aggregates, sands 456
and fillers. London: British Standard Institution, London. 457
458
Davitt, J. (1982). Repeated load tests on simulated gravel pavements from three sources in 459
Ireland. Dissertation, University of Dublin. 460
461

Dawson, A.R., Paute, J.L., and Thom, N.H. (1993). “Mechanical characteristics of 462
unbound materials as a function of condition”. In: Proceedings of the European 463
Symposium on Flexible Pavements, Euroflex. 199, Rotterdam, pp 35-44. 464
465
Douglas, R.A. (1997). “Heavy load, low tire pressure rutting of unbound granular 466
pavements”. J. Trans. Eng., 123, 357 – 363. 467
468
Evdorides, H.T., and Snaith, M.S. (1996). “A knowledge-based analysis process for road 469
pavement condition assessment”. Proceed. ICE – Transport, 117, 202 – 210. 470
471
Giroud, J.P., and Noiray, L. (1981). “Geotextile-reinforced unpaved road design.” J. 472
Geotech. Eng., 107, 787 – 797. 473
474
Giroud, J.P., Ah-Line, C., and Bonaparte, R. (1985). “Design of unpaved roads and 475
trafficked areas with geogrids.” Polymer grid reinforcement, Thomas Telford Limited, 476
London, 116 – 127. 477
478
Giroud, J.P., and Han, J. (2004a). “Design method for geogrid-reinforced unpaved roads. 479
II. Calibration and applications”. J. Geotech. and Geoenv. Eng., 130, 787 – 97. 480
481
Giroud, J.P., and Han, J. (2004b). “Design method for geogrid-reinforced unpaved roads. I. 482
Development of design method”. J. Geotech. and Geoenv. Eng., 130, 775-85. 483
484

23
Hopkins, T.C., Beckham, T.L., Sun, C. (2007). “Resilient modulus of compacted crushed 485
stone aggregate bases.” Research Report KTC-05-27/SPR-229-01-1F. 486
http://uknowledge.uky.edu/cgi/viewcontent.cgi?article=1179&context=ktc_researchreports 487
(accessed 20 November 2013) 488
489
Hammitt, G.M. (1970). Thickness requirement for unsurfaced roads and airfields, bare 490
base support, project 3782-65. Technical report S-70-5, Vicksburg, Miss., U.S. Army 491
Engineer Waterways Experiment Station. 492
493
Kennedy, C.K. (1985). “In-situ testing of unbound aggregates”. In: Proceedings of the 494
Symposium on unbound aggregates in Roads, Nottingham, University of Nottingham, pp 495
63-68. 496
497
Lekarp, F., Isacsson, U., and Dawson, A. (2000). “State of the art: I: Resilient response of 498
unbound aggregates”. J. Trans. Eng., 126, 66 – 75. 499
500
Moghaddas Tafreshi, S.N., and Khalaj, O. (2007). “Laboratory tests of small-scale HDPE 501
pipes buried in reinforced sand under repeated load”. Geotext. and Geomem., 26, 145 – 502
163. 503
504

Rodgers, M., Hayes, G., and Healy, M.G. (2009). “Cyclic loading tests on sandstone and 505
limestone shale aggregates used in unbound forest roads”. Const. Build. Mat., 23, 2421-506
2427. 507
508
Simonsen E., and Isacsson, U. (1999). “Thaw weakening of pavement structures in cold 509
regions”. Cold Reg. Sci. Tech., 29, 135 – 151. 510
511
512
513
514
515
516
517
518
519
520
521
522
523
524
525
526
527
528
529

25
CAPTIONS FOR FIGURES 530
531
Figure 1 The laboratory loading apparatus. 532
Figure 2 Particle size distributions for the materials. 533
Figure 3 Resilient pressures in Cell D, measured 900 mm above the base of the formation 534
layer, versus number of cycles. 535
Figure 4 Maximum resilient deflections measured at the surface of the completion layer 536
versus number of cycles. 537
Figure 5 Maximum permanent deformations measured at the surface of the completion 538
layer versus number of cycles. 539
540
541
542
543
544
545
546
547
548
549
550

Table 1. List of full-scale tests. 551
Test
number
Material Thickness a Optimum water
content
Initial water content Final dry
density
m % % Mg m-3
1 Granite 0.25 8.3 6.6 2.1
2 Granite 0.15 8.3 6.3 2.0
3 Shale 0.25 10.3 9.1 1.5
4 Limestone on top of
shale b
0.20+0.25 3.3
5 Limestone on top of
shale with water
addition
0.20+0.25 3.3
6 Formation layer 1.00 13.5 13.6 1.5
a Thickness refers to the completion layer. The formation material had a thickness of 1000 mm for all tests. 552
b 200 mm of a crushed limestone, graded to the specification of a wet mix macadam, was compacted, at a 553
water content of 3.3%, onto a 250 mm layer of the shale at a water content of 9.1%. 554
555
556
557
558
559
560
561
562
563
564
565
27
Table 2. Summary of BS laboratory results. 566
Laboratory tests Limits Formation Completion
Granite Shale Limestone
Natural water content (%) 21.5
Liquid limit 32.3 43.8 52.4 18.3
Plastic limit (%) 22.6 NP 33.9 NP
Plasticity index (%) 0-6 9.7 0 18.5 0
Specific gravity (Gs) 2.6 2.7 2.5 2.7
Max. dry density (Mg m-3) 1.8 2.2 1.6 2.3
Optimum water content (%) 13.5 8.3 10.3 6.1
California bearing ratio (%) a 2/30 15.0 115.0 25.2 156.0
Flakiness index (%) <35.0 26.4 78.0 19.6
MSSV (%) >75.0 92.9 10.1 93.8
Water absorption value (%) <2.0 2.9 6.2 0.3
Aggregate crushing value (%) <35.0 18.5 34.2 21.3
Dry aggregate impact value
(%)
<35.0
17.5 31.0 15.2
Wet aggregate impact value
(%)
18.6 37.0
Aggregate abrasion value (%) <10.0 2 39.2 11.0
Effective size, d10, (mm) 3.9x10⁻³ 1.7x10⁻¹ 5.5 0.7
Uniformity coefficient, Cu 44.9 73.5 8.2 15.0
Coefficient of curvature, Cc 0.7 1.2 1.6 3.4 a The minimum allowable in situ CBR for a subgrade soil is 2%. Type A sub base material should have a 567
CBR of 30%. 568
569
570
571
572
573
574
575
576

Table 3. Estimation of resilient moduli a 577
Material Thickness Applied pressure (kPa)
500 750 1000
m Calculated resilient moduli, E (MPa)
Formation 0 – 0.05 29 29 29
0.05 – 1 37 37 37
Granite 0.25 295 450 550
Granite 0.15 320 460 750
Shale 0.25 60
Limestone on top
of shale b
0.20+0.25 225
225 225
a The resilient moduli for the soils were estimated by calibrating the SIGMA/W finite 578
element model of the soils and loadings to provide resilient deflections under the centre of 579
the loading pad that were equal to the experimental results. 580
b 0.2 m of a crushed limestone, graded to the specification of a wet mix macadam, was 581
compacted, at a water content of 3.3%, onto a 0.25 m layer of the shale with an assumed 582
constant resilient modulus of 60 MPa for the three applied pressures 583
584
585
586
587
588
589
590
591
592

29
Table 4. Experimental and modelled values for resilient deflection at the surface layer of 593
the completion material and pressure at depths of 0.1, 0.3, 0.5 and 0.7 m from the surface 594
of the formation layer. 595
Soil physical responses Test no.a
Applied pressure (kPa)
500 750 1000
Measured Modelled Measured Modelled Measured Modelled
Resilient deflection (mm) 1 0.70 0.70 0.92 0.92 1.16 1.16
Pressure at 0.7m (kPa) (250 mm 10.5 9.0 15.8 14.0 21.6 19.0
Pressure at 0.5m (kPa) granite) 12.0 13.0 18.6 21.5 25.0 27.0
Pressure at 0.3m (kPa) 26.0 24.0 40.0 36.0 54.6 47.5
Pressure at 0.1m (kPa) 51.0 51.0 73.5 71.0 97.7 92.0
Modulus of elasticity (MPa) 295 450 550
Resilient deflection (mm) 2 0.96 0.97 1.33 1.34 1.59 1.60
Pressure at 0.7m (kPa) (150 mm 13.3 11.0 21.5 17.0 28.3 22.0
Pressure at 0.5m (kPa) granite) 17.4 16.3 26.0 25.5 33.8 33.0
Pressure at 0.3m (kPa) 39.1 33.0 58.8 50.0 74.4 64.0
Pressure at 0.1m (kPa) 95.9 84.0 124.7 120.0 148.2 146.0
Modulus of elasticity (MPa) 320 460 750
Resilient deflection (mm) 3 1.73 1.76
Pressure at 0.7m (kPa) (250 mm 15.1 10.0
Pressure at 0.5m (kPa) shale) 17.2 15.0
Pressure at 0.3m (kPa) 44.6 30.0
Pressure at 0.1m (kPa) 104.0 72.0
Modulus of elasticity (MPa) 60
Resilient deflection (mm) 4 0.76 0.76 1.2 1.18 1.6 1.6
Pressure at 0.7m (kPa) (200 mm 9.07 5.7 11.9 9.8 15.5 13.8
Pressure at 0.5m (kPa) limestone
/
9.32 8.0 13.0 13.5 17.2 19.0
Pressure at 0.3m (kPa) 250 mm 17.3 13.5 26.4 22.0 32.5 31.0
Pressure at 0.1m (kPa) shale) 38.0 24.0 50.3 39.0 57.3 54.0
Modulus of elasticity (MPa) 225 225 225 a 1 - 0.25 m of granite; 2 – 0.15 m of granite; 3 – 0.25 m of shale; 4 – 0.2 m of limestone on 0.25 m shale 596

Table 5. Comparison of modelled (Eqn. 1) versus measured rut depths.
Material Depth (m) No of cycles
0 – 50,000 at 500 kPa 0 – 50,000 at 500 kPa 0 – 50,000 at 500 kPa
50,000 – 100,000 at 750 kPa 50,000 – 100,000 at 750 kPa
100,000 – 150,000 at 1000 kPa
Calculated (mm) Measured (mm) Calculated (mm) Measured (mm) Calculated (mm) Measured (mm)
Formation 1
Granite 0.25 1.1 2.6 2.6 3.6 4.4 4.5
Granite 0.15 2.1 4.1 4.6 5.0 7.4 6.0

31
Figure 1.

Figure 2

33
Figure 3

Figure 4

35
Figure 5