Embed Size (px)
DESCRIPTION
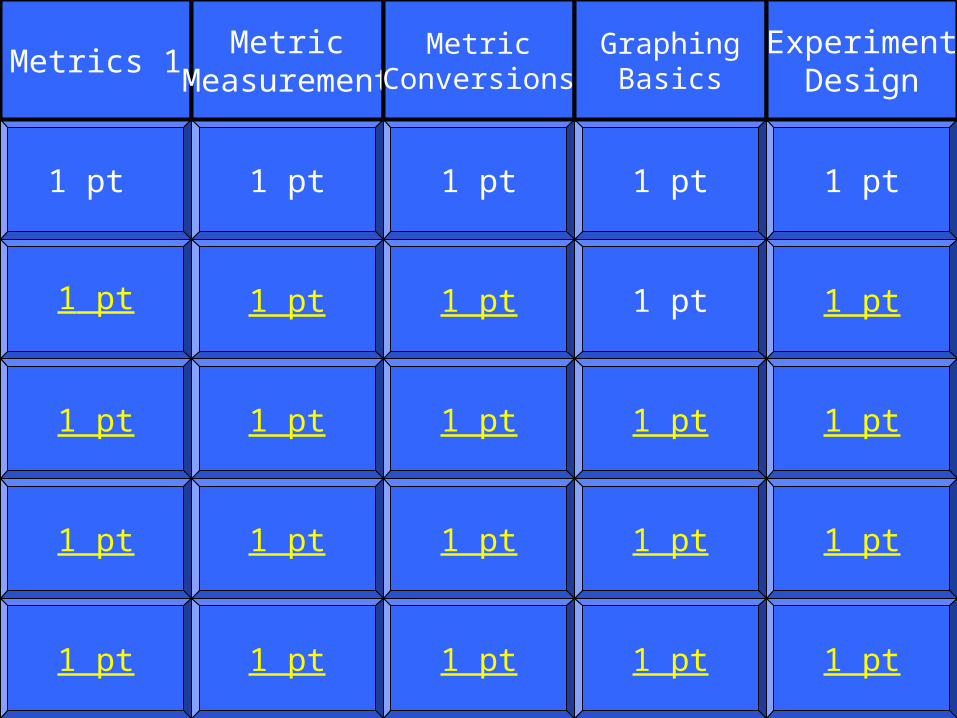
Metrics 1. Metric Measurement. Metric Conversions. Graphing Basics. Experiment Design. 1 pt. 1 pt. 1 pt. 1 pt. 1 pt. 1 pt. 1 pt. 1 pt. 1 pt. 1 pt. 1 pt. 1 pt. 1 pt. 1 pt. 1 pt. 1 pt. 1 pt. 1 pt. 1 pt. 1 pt. 1 pt. 1 pt. 1 pt. 1 pt. 1 pt. - PowerPoint PPT Presentation
Citation preview
1
1 pt
1 pt
1 pt
1 pt
1 pt
1 pt
1 pt
1 pt
1 pt
1 pt
1 pt
1 pt
1 pt
1 pt
1 pt
1 pt
1 pt
1 pt
1 pt
1 pt
1 pt
1 pt
1 pt
1 pt
1 pt
Metrics 1Metric
MeasurementMetric
ConversionsGraphing
BasicsExperiment
Design

2
Which country is credited for developing the metric
system.

3
France
4
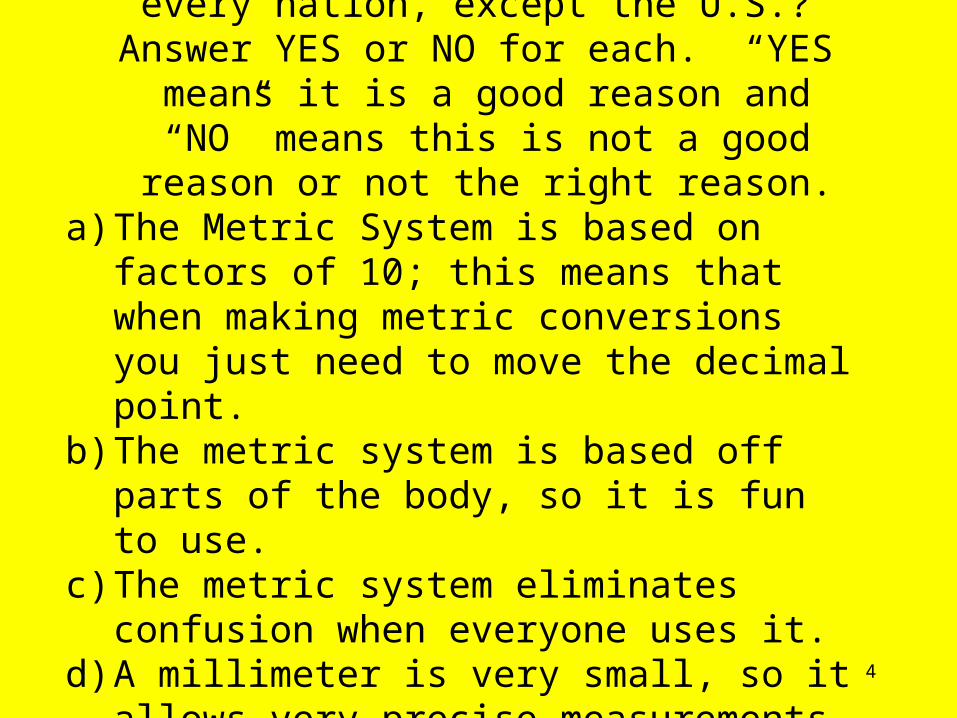
Which of the following are reasons why the metric system is used by every
nation, except the U.S.? Answer YES or NO for each. “YES” means it is a good reason and “NO” means this is not a good reason or not the right reason.
a) The Metric System is based on factors of 10; this means that when making metric conversions you just need to move the decimal point.
b) The metric system is based off parts of the body, so it is fun to use.
c) The metric system eliminates confusion when everyone uses it.
d) A millimeter is very small, so it allows very precise measurements to be taken.

5
A, C, and D are all reasons why the metric system is used, rather
than the former English system, by other
countries.
6
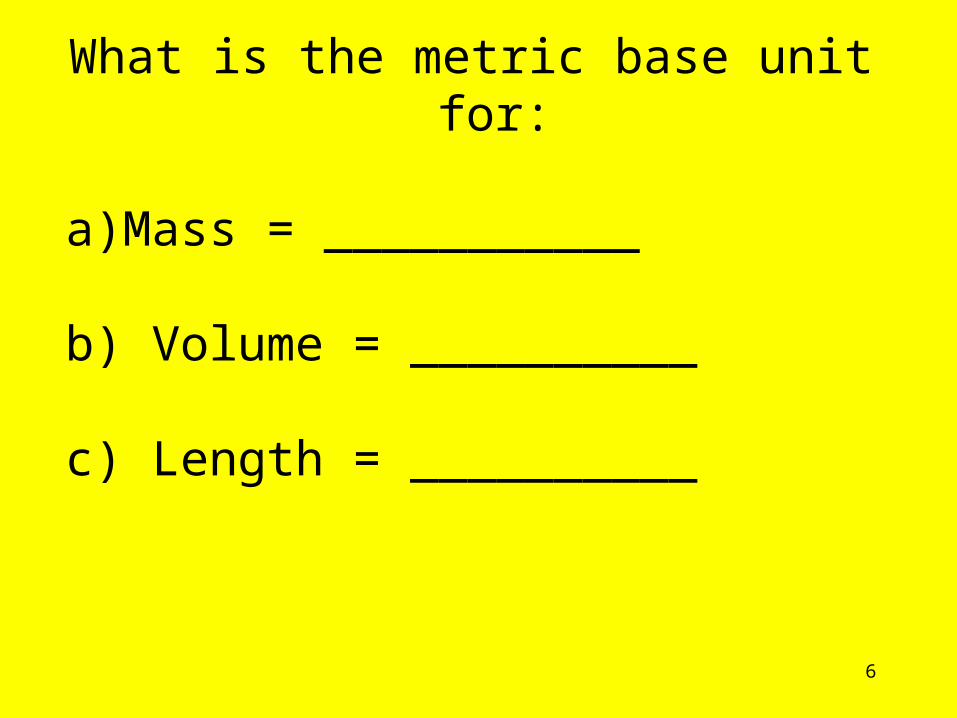
What is the metric base unit for:
a)Mass = ___________
b) Volume = __________
c) Length = __________
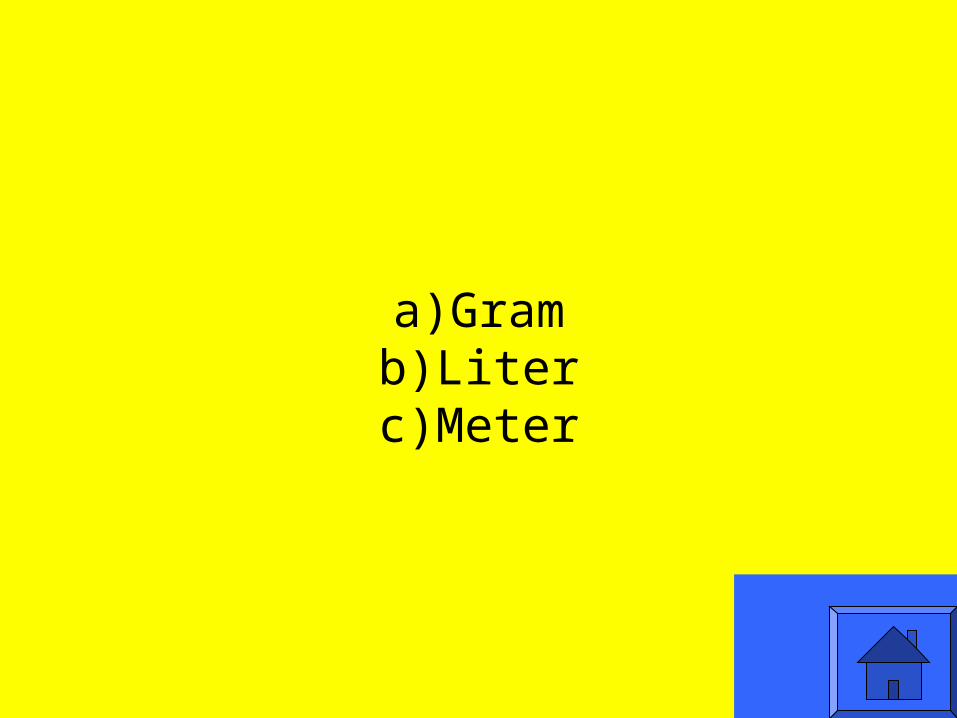
7
a)Gramb)Literc)Meter

8
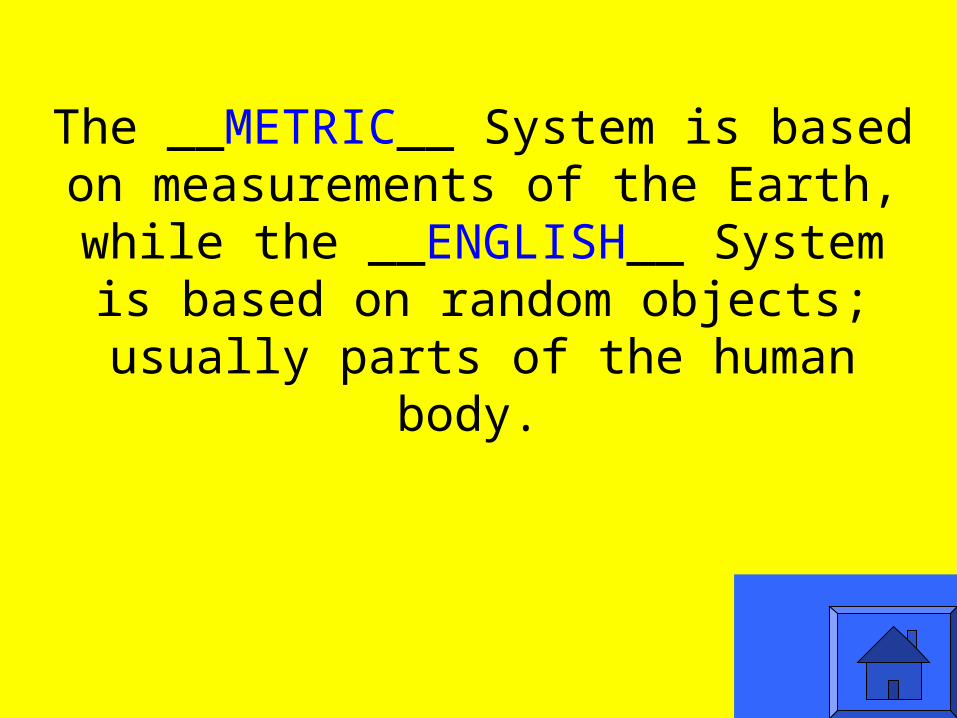
The __________ System is based on measurements of the Earth, while the ___________ System is based on
random objects; usually parts of the human body.
9
The __METRIC__ System is based on measurements of the Earth, while the __ENGLISH__ System is based
on random objects; usually parts of the human body.
10
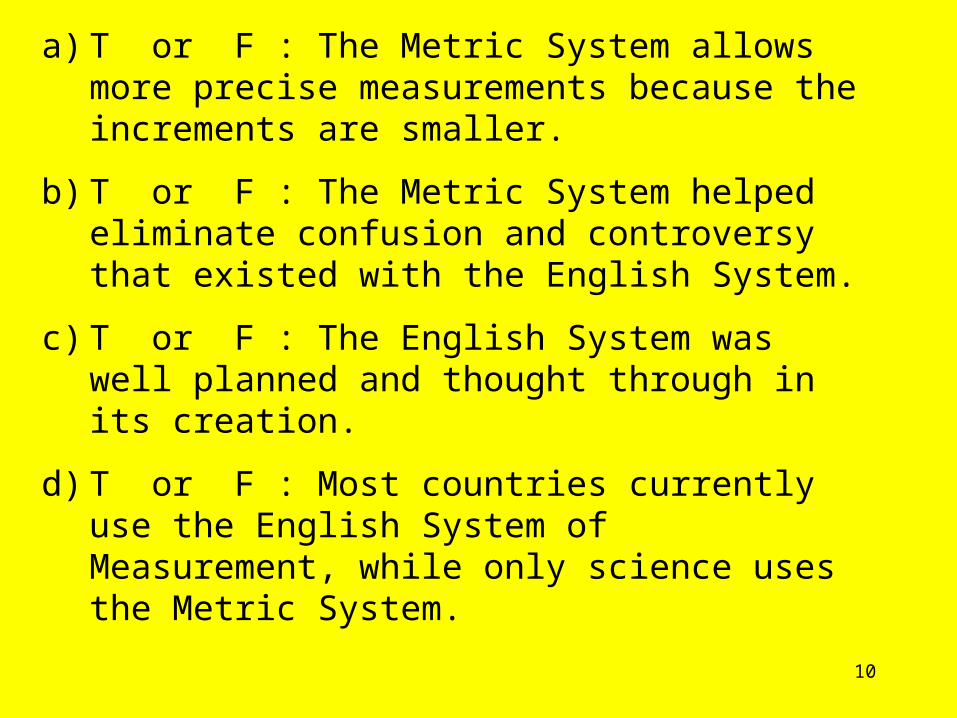
a) T or F : The Metric System allows more precise measurements because the increments are smaller.
b) T or F : The Metric System helped eliminate confusion and controversy that existed with the English System.
c) T or F : The English System was well planned and thought through in its creation.
d) T or F : Most countries currently use the English System of Measurement, while only science uses the Metric System.
11
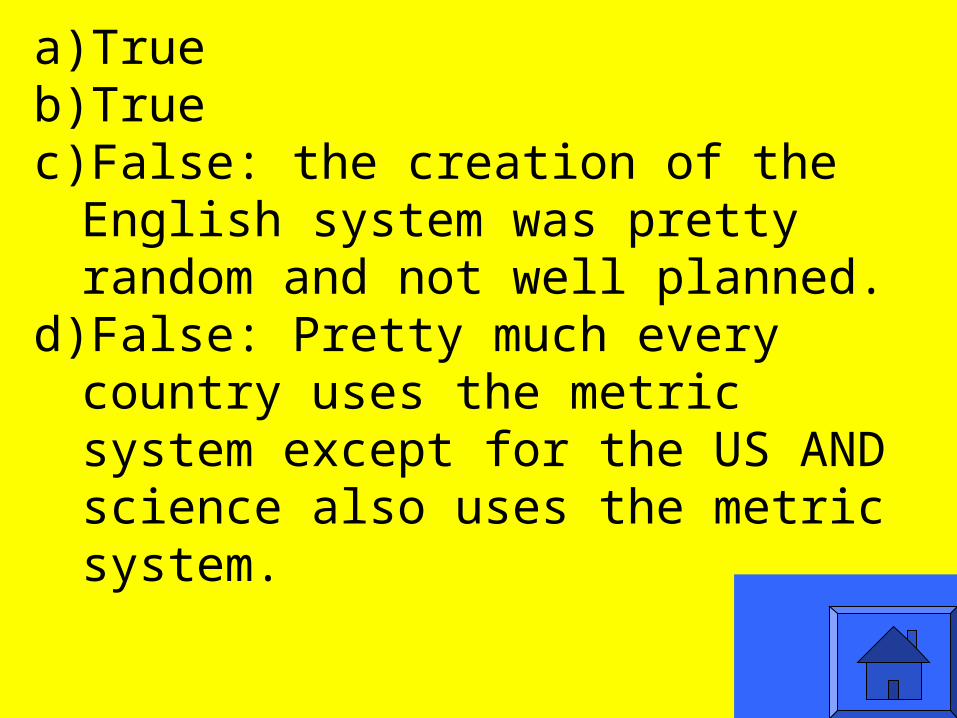
a)Trueb)Truec)False: the creation of the English
system was pretty random and not well planned.
d)False: Pretty much every country uses the metric system except for the US AND science also uses the metric system.
12
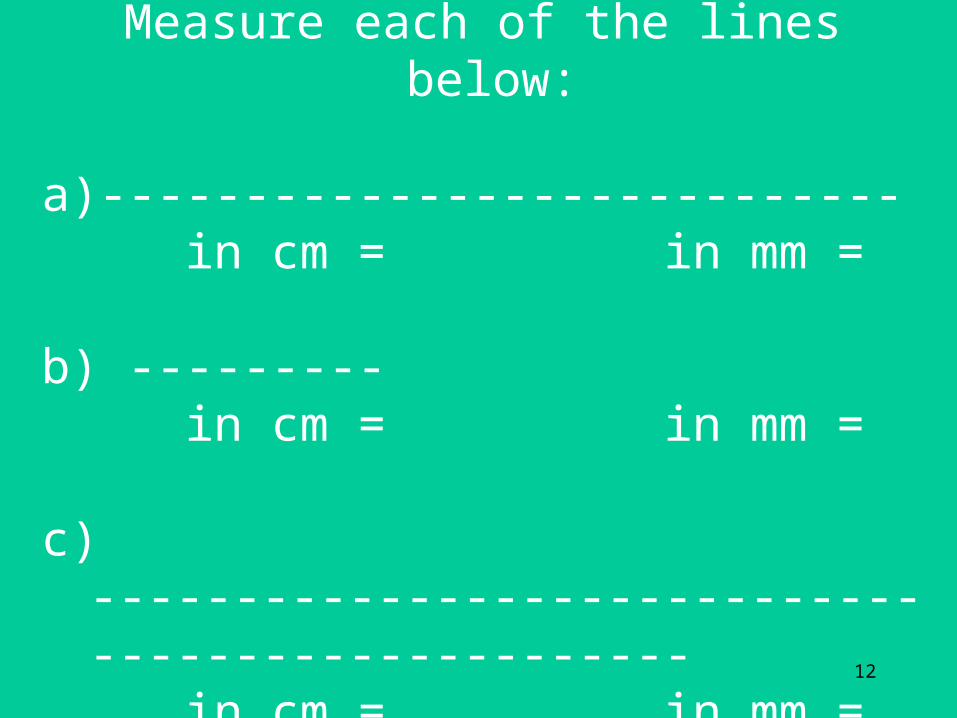
Measure each of the lines below:
a)----------------------------in cm = in mm =
b) ---------in cm = in mm =
c) --------------------------------------------------
in cm = in mm =
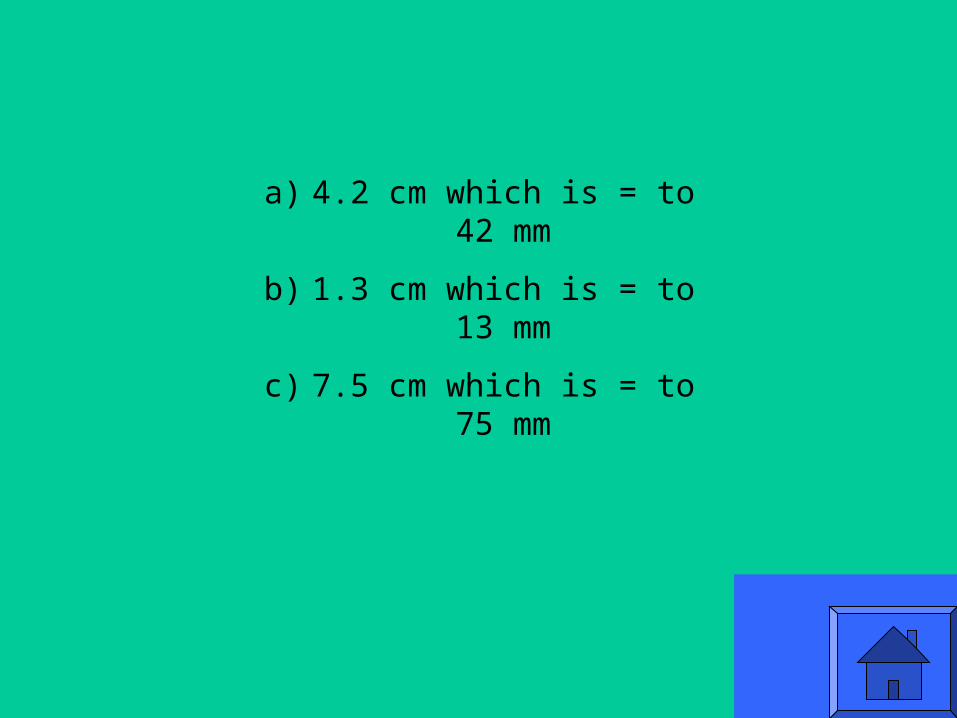
13
a) 4.2 cm which is = to 42 mm
b) 1.3 cm which is = to 13 mm
c) 7.5 cm which is = to 75 mm
14
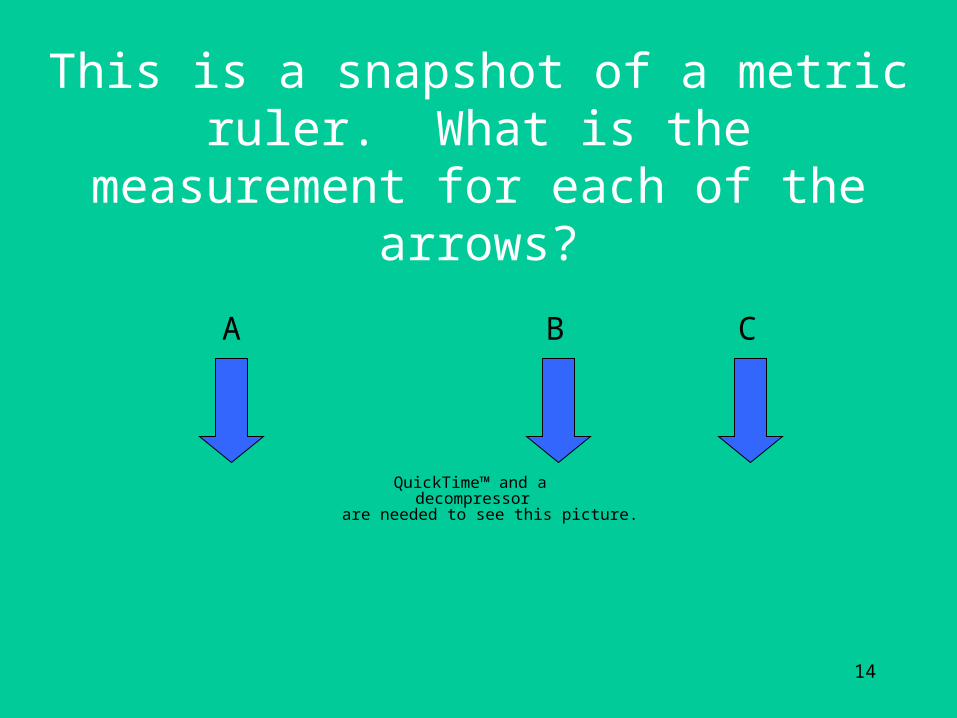
This is a snapshot of a metric ruler. What is the measurement for each
of thearrows?
QuickTime™ and a
decompressorare needed to see this picture.
A B C
15
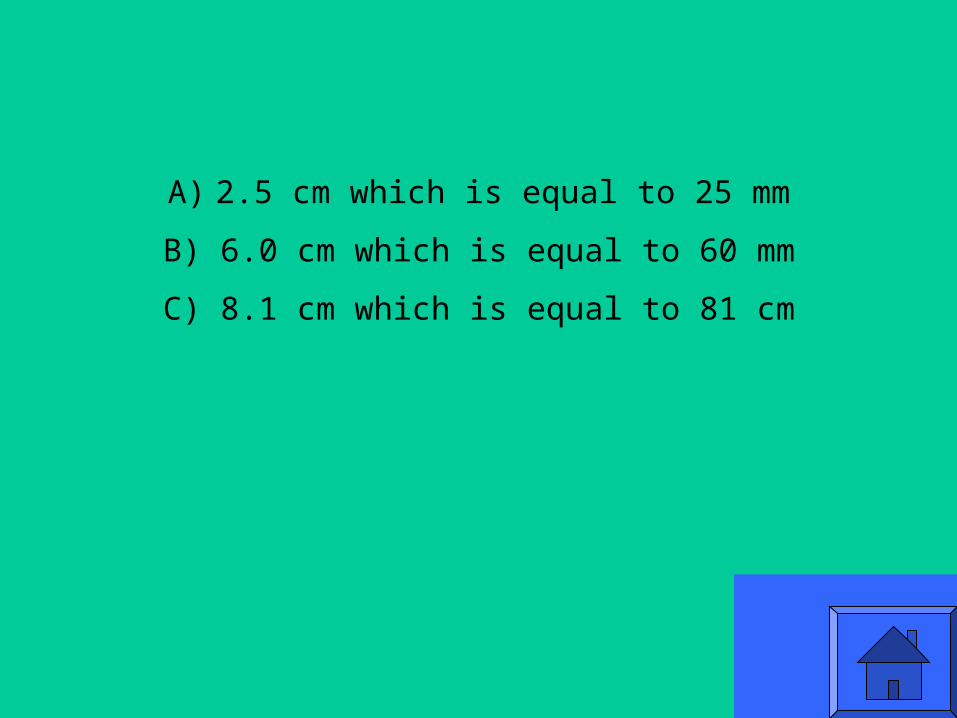
A) 2.5 cm which is equal to 25 mm
B) 6.0 cm which is equal to 60 mm
C) 8.1 cm which is equal to 81 cm

16
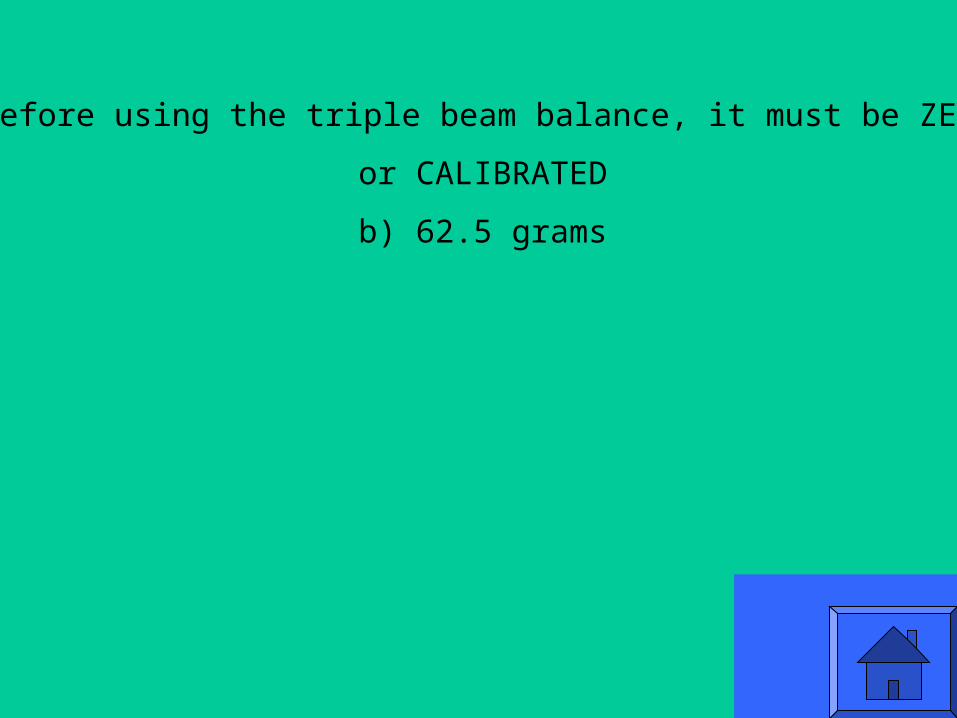
a)Before you weigh anything on a triple beam balance, you must _____________ the scale.
b) What is the mass of this object?
QuickTime™ and a decompressor
are needed to see this picture.
17
a) Before using the triple beam balance, it must be ZEROED
or CALIBRATED
b) 62.5 grams

18
What is the volume of the dinosaur?
QuickTime™ and a decompressor
are needed to see this picture.
19
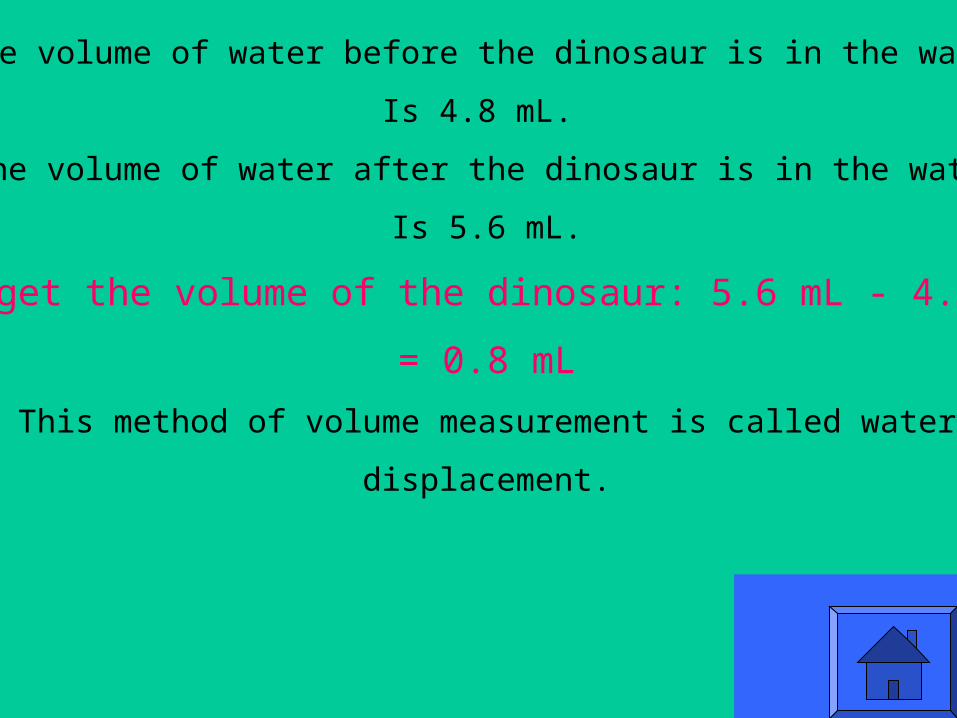
The volume of water before the dinosaur is in the water
Is 4.8 mL.
The volume of water after the dinosaur is in the water
Is 5.6 mL.
To get the volume of the dinosaur: 5.6 mL - 4.8 mL
= 0.8 mL
This method of volume measurement is called water
displacement.
20
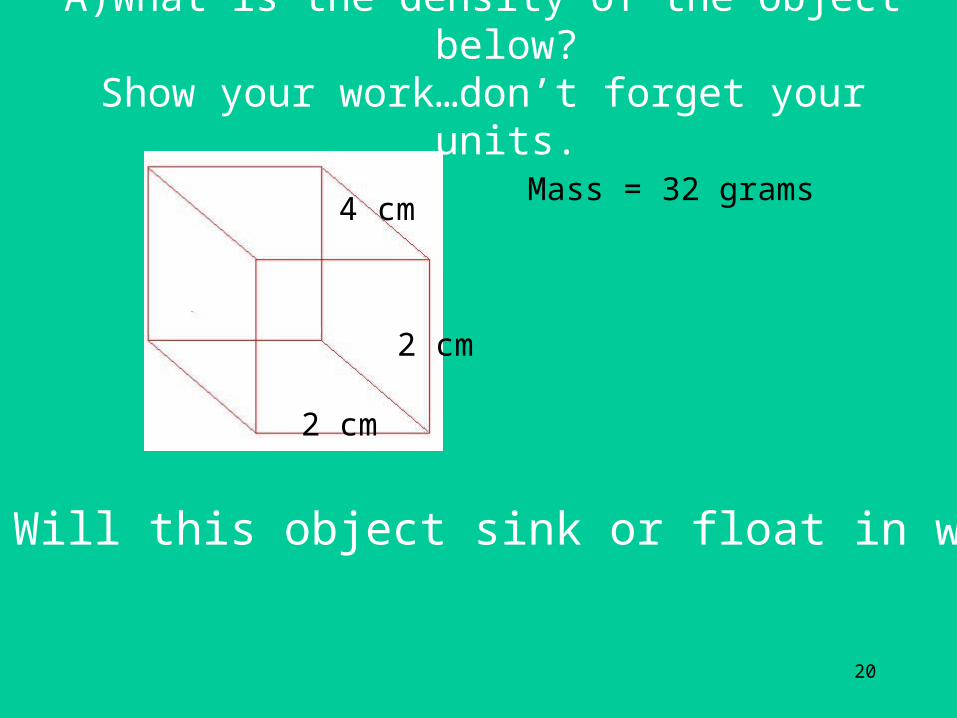
A) What is the density of the object below?Show your work…don’t forget your units.
4 cm
2 cm
2 cm
Mass = 32 grams
B) Will this object sink or float in water?
21
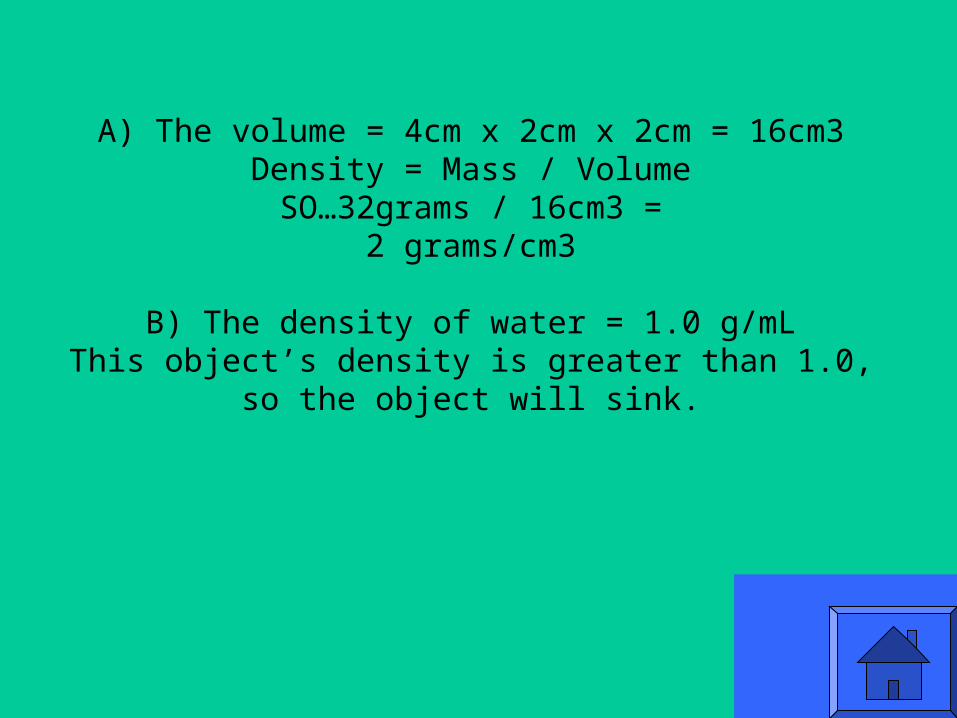
A) The volume = 4cm x 2cm x 2cm = 16cm3Density = Mass / VolumeSO…32grams / 16cm3 =
2 grams/cm3
B) The density of water = 1.0 g/mLThis object’s density is greater than 1.0, so the
object will sink.
22
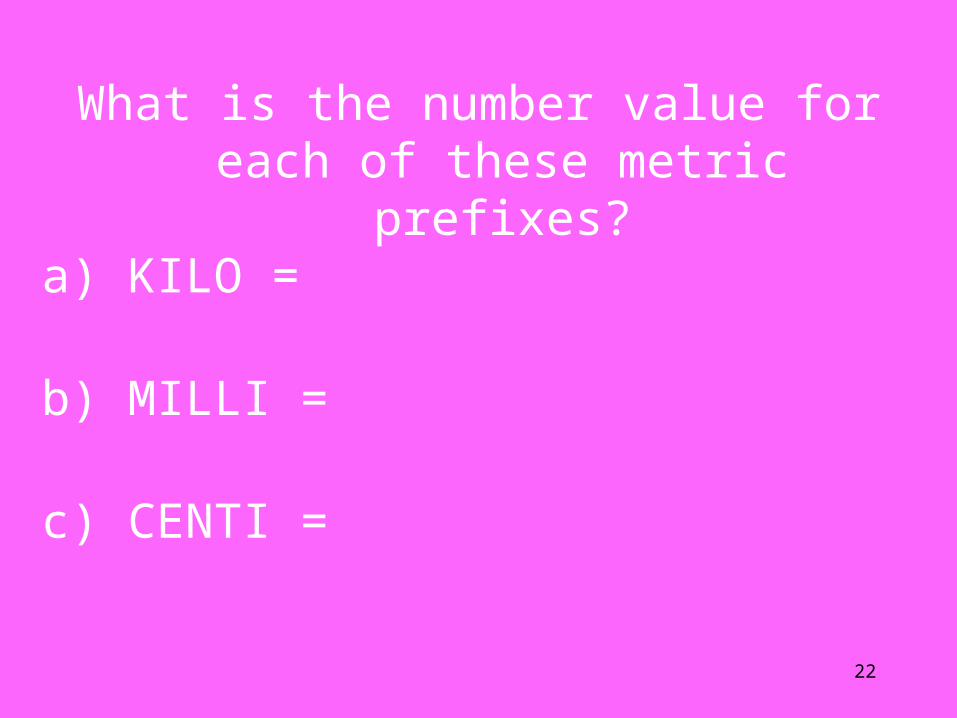
What is the number value for each of these metric prefixes?
a) KILO =
b) MILLI =
c) CENTI =

23
a)KILO = 1000Xb)MILLI = 1/1000 or .001c)CENTI = 1/100 or .01

24
Fill in the following:a)1 meter = _________ cmb)1 kilogram = ________ gramsc)1 liter = _________ milliliters

25
a)100b)1000c)1000

26
Fill in the stair stepper below:
Hecto-
Deka-
deci-

27
KILO-
hecto-
deka-
BASE UNIT
Deci-
CENTI-
MILLI-

28
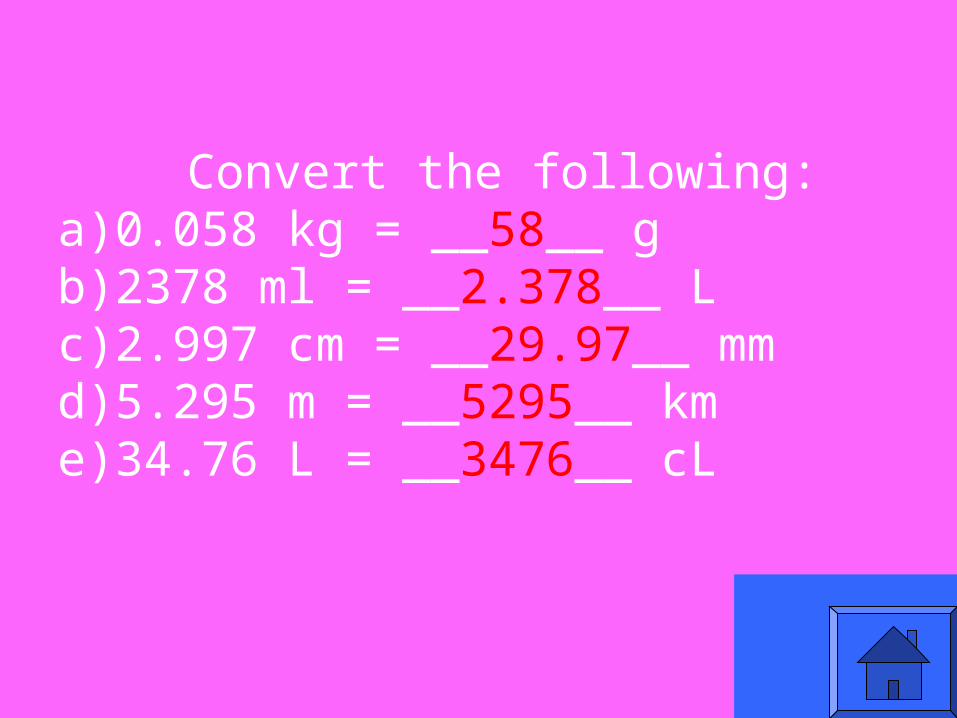
Convert the following:a)0.058 kg = _________ gb)2378 ml = _________ Lc)2.997 cm = _________ mmd)5.295 km = _________ me)34.76 L = _________ cL
29
Convert the following:a)0.058 kg = __58__ gb)2378 ml = __2.378__ Lc)2.997 cm = __29.97__ mmd)5.295 m = __5295__ kme)34.76 L = __3476__ cL
30
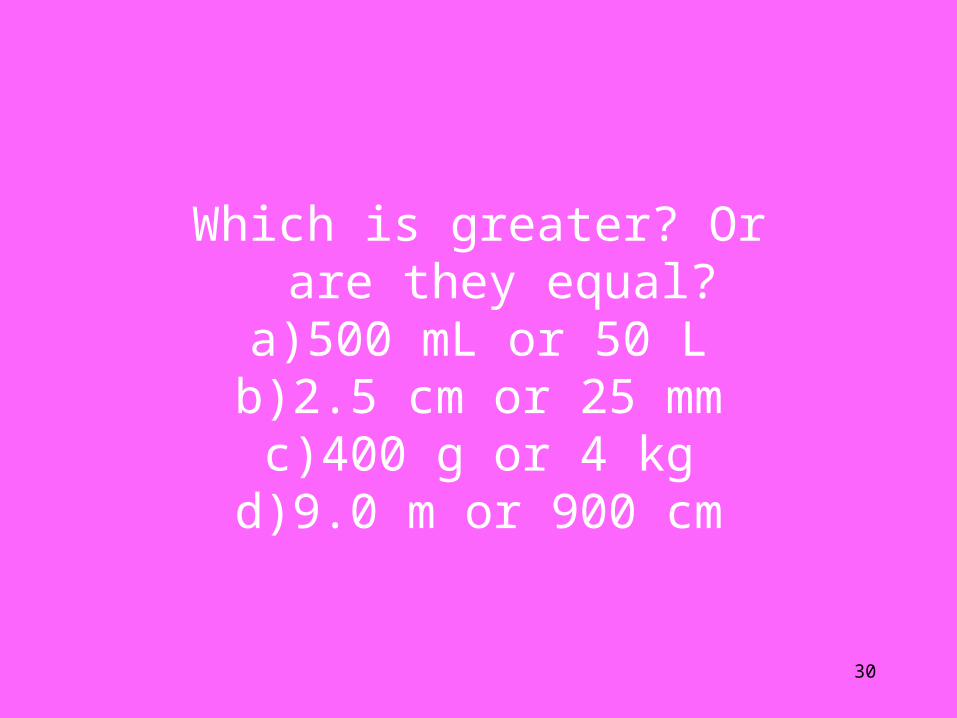
Which is greater? Or are they equal?
a)500 mL or 50 Lb)2.5 cm or 25 mm
c)400 g or 4 kgd)9.0 m or 900 cm
31
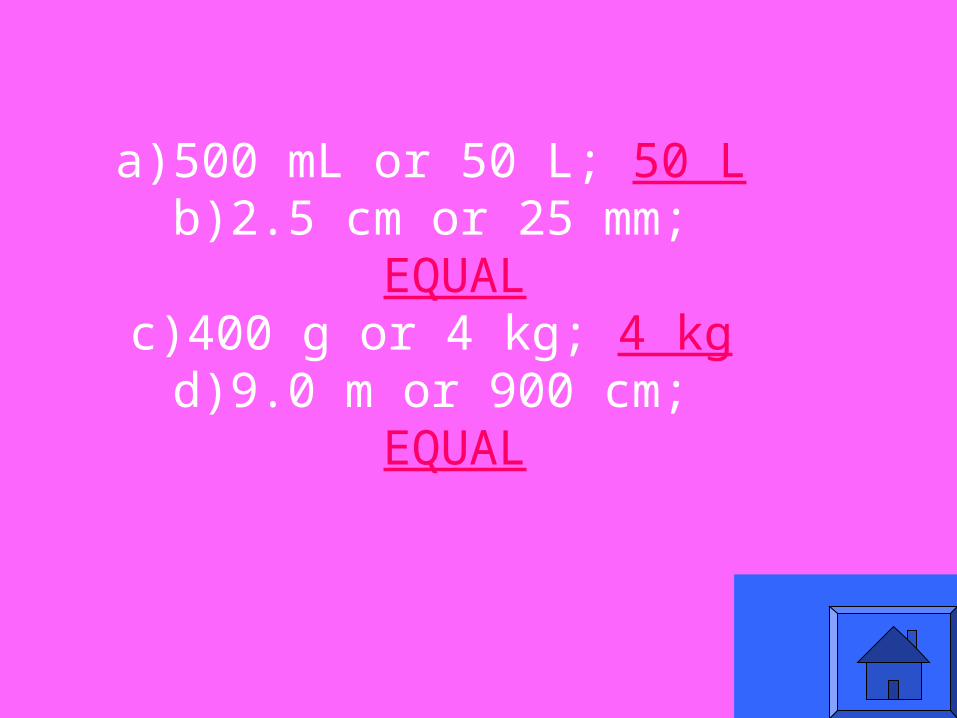
a)500 mL or 50 L; 50 Lb)2.5 cm or 25 mm;
EQUALc)400 g or 4 kg; 4 kgd)9.0 m or 900 cm;
EQUAL
32
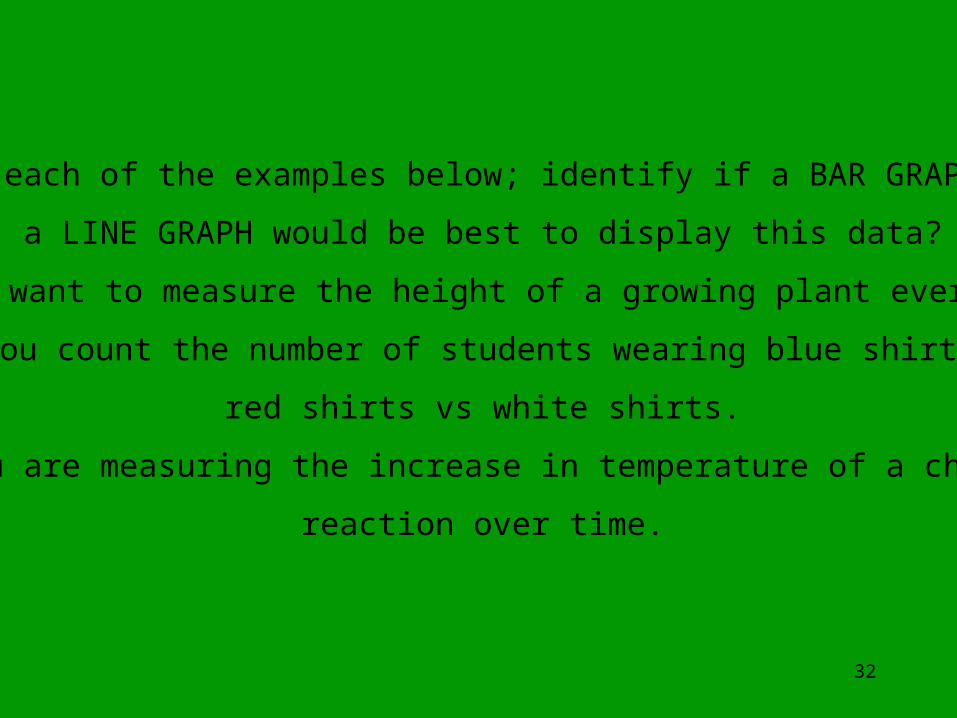
For each of the examples below; identify if a BAR GRAPH or
a LINE GRAPH would be best to display this data?
a) You want to measure the height of a growing plant every day.
b) You count the number of students wearing blue shirts vs
red shirts vs white shirts.
c) You are measuring the increase in temperature of a chemical
reaction over time.

33
a)Lineb)Barc)Line

34
The independent variable is the change that is controlled by the experimenter and goes on the
____-axis. The dependent variable is the data being
collected and it goes on the ____-axis

35
Independent Variable = X-axisDependent Variable = Y-axis
36
For each of the following, identify the INDEPENDENT
and DEPENDENT variables.
a) You want to measure the height of a growing plant every day.
b) You count the number of students wearing blue shirts vs red shirts vs white shirts.
c) You drop boxes of different mass and time how long it takes them to fall.
37
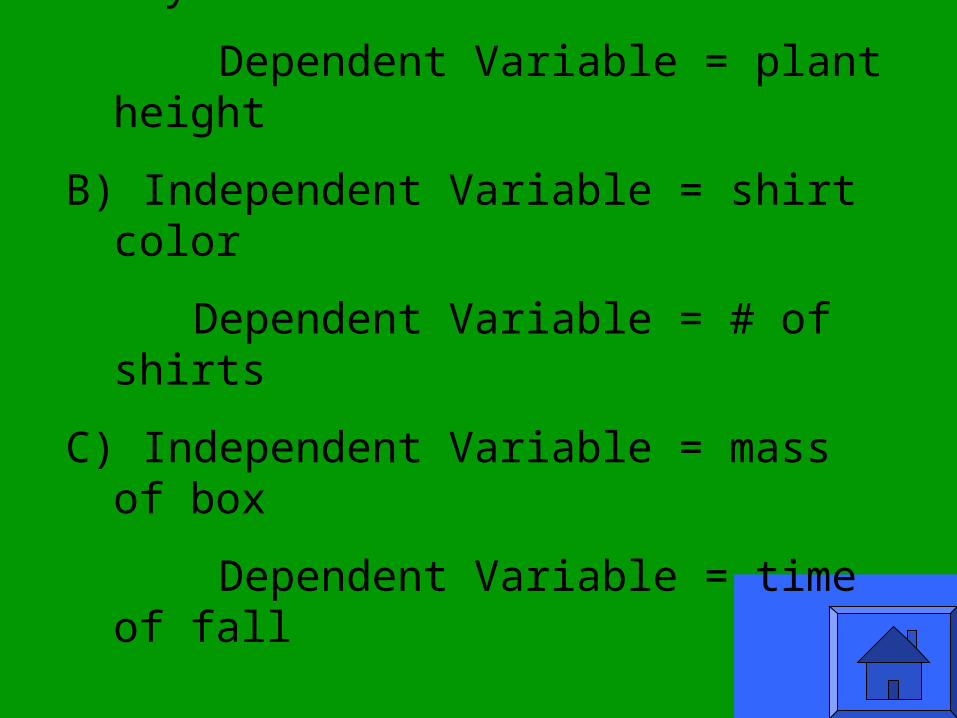
A) Independent Variable = every day
Dependent Variable = plant height
B) Independent Variable = shirt color
Dependent Variable = # of shirts
C) Independent Variable = mass of box
Dependent Variable = time of fall
38
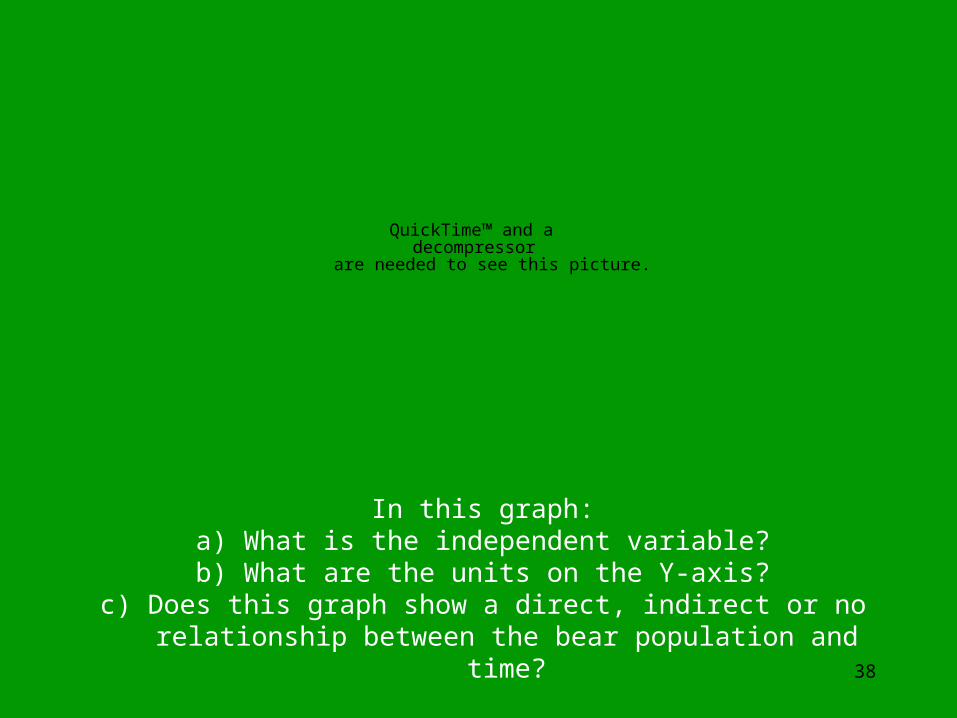
In this graph:a) What is the independent variable?b) What are the units on the Y-axis?
c) Does this graph show a direct, indirect or no relationship between the bear population and time?
QuickTime™ and a decompressor
are needed to see this picture.
39
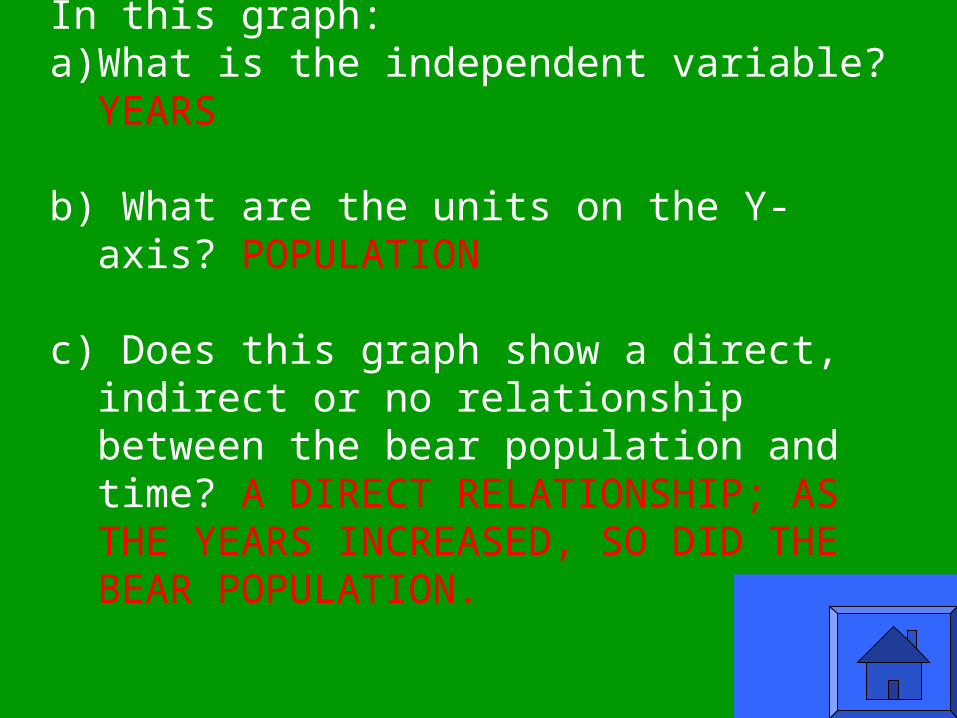
In this graph:a) What is the independent variable? YEARS
b) What are the units on the Y-axis? POPULATION
c) Does this graph show a direct, indirect or no relationship between the bear population and time? A DIRECT RELATIONSHIP; AS THE YEARS INCREASED, SO DID THE BEAR POPULATION.
40
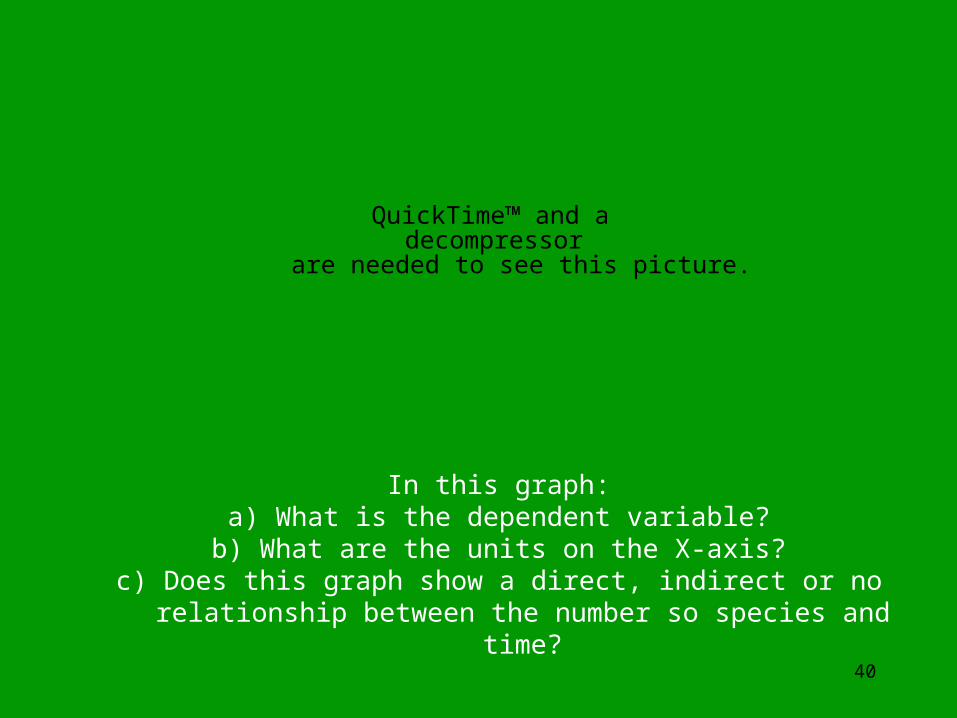
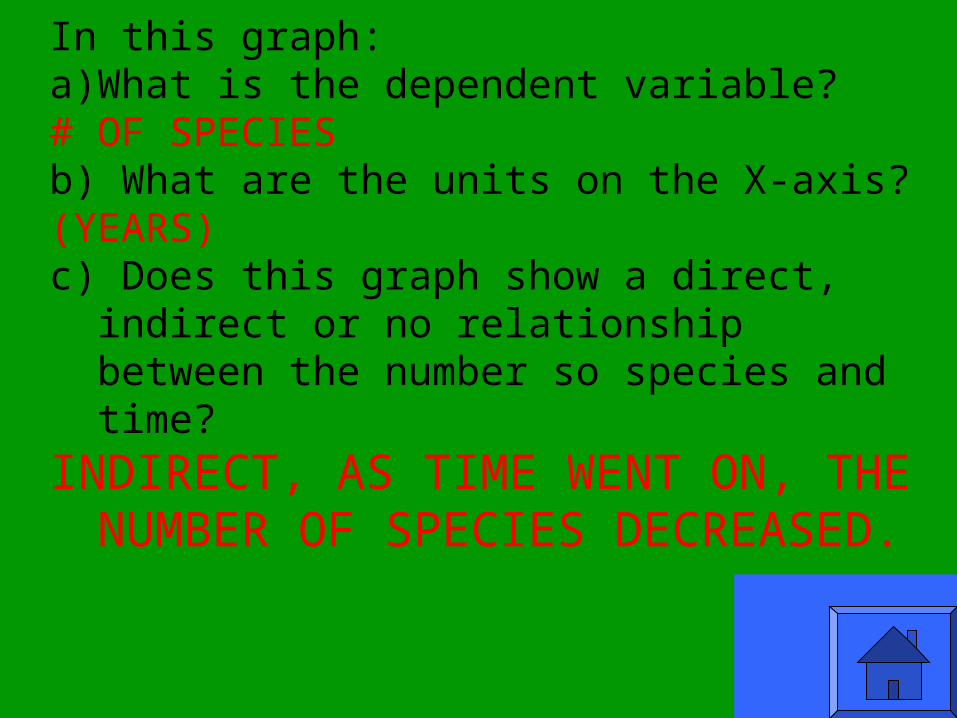
In this graph:a) What is the dependent variable?b) What are the units on the X-axis?
c) Does this graph show a direct, indirect or no relationship between the number so species and time?
QuickTime™ and a decompressor
are needed to see this picture.
41
In this graph:a) What is the dependent variable?# OF SPECIESb) What are the units on the X-axis?(YEARS)c) Does this graph show a direct, indirect or no
relationship between the number so species and time?
INDIRECT, AS TIME WENT ON, THE NUMBER OF SPECIES DECREASED.

42
Before you begin a lab, you should gather ____________, which
means you need to have knowledge about what your experiment
is about.

43
Background Information

44
a)Before you start your lab you need to identify the __________ to your lab, which is in the form of a question AND
b)you need to form a ___________, which is in the form of an if, then statement and is often called an
“educated guess”.

45
Before you start your lab you need to identify the _PROBLEM_ to your
lab, which is in the form of a question AND you need to form a
_HYPOTHESIS_, which is in the form of an if, then statement.
46
In class, you are measuring the temperature of a chemical reaction over time.
a)What is the independent variable and needs to be placed on the X-axis when graphed?
b)What is the dependent variable and needs to be placed on the Y-axis when graphed?

47
a)Independent Variable = Time
b)Dependent Variable = Temperature
48
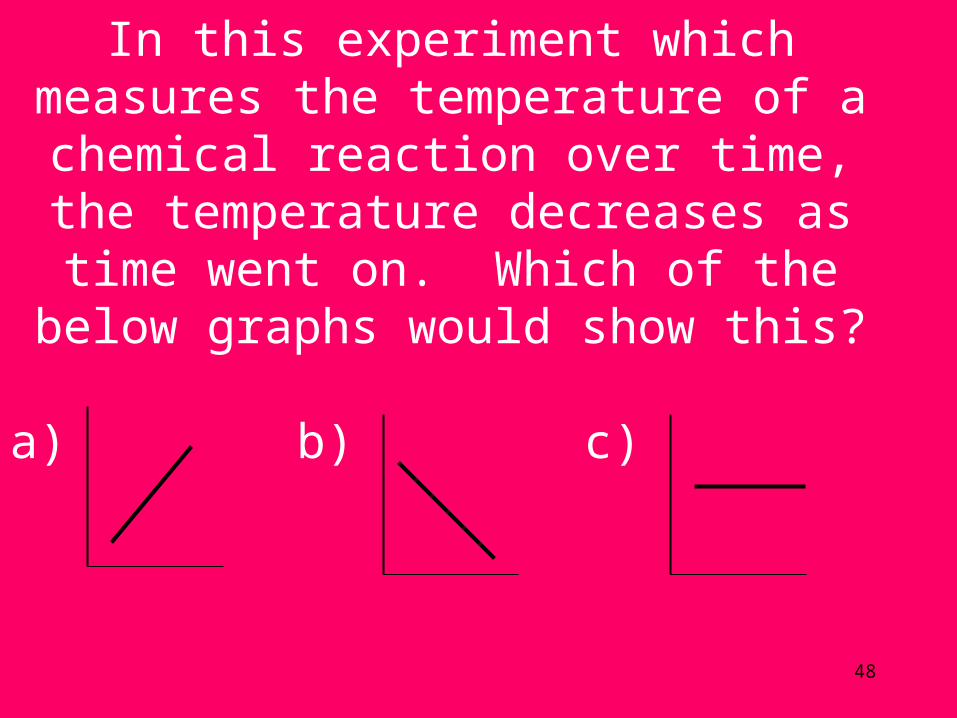
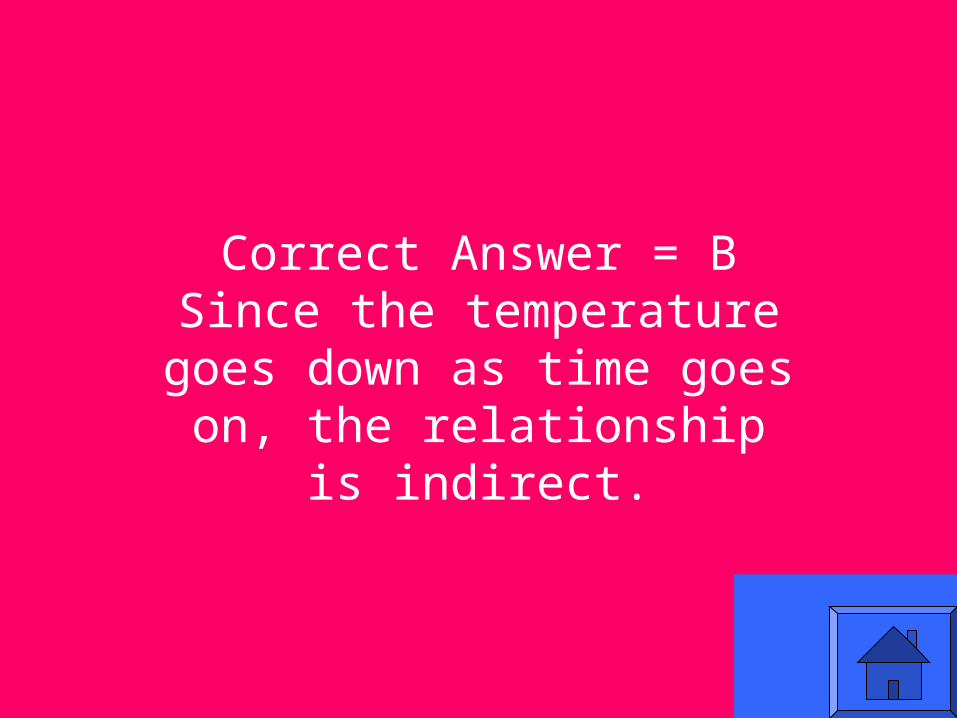
In this experiment which measures the temperature of a chemical
reaction over time, the temperature decreases as time went on. Which
of the below graphs would show this?
a) b) c)
49
Correct Answer = BSince the temperature
goes down as time goes on, the relationship is
indirect.
50
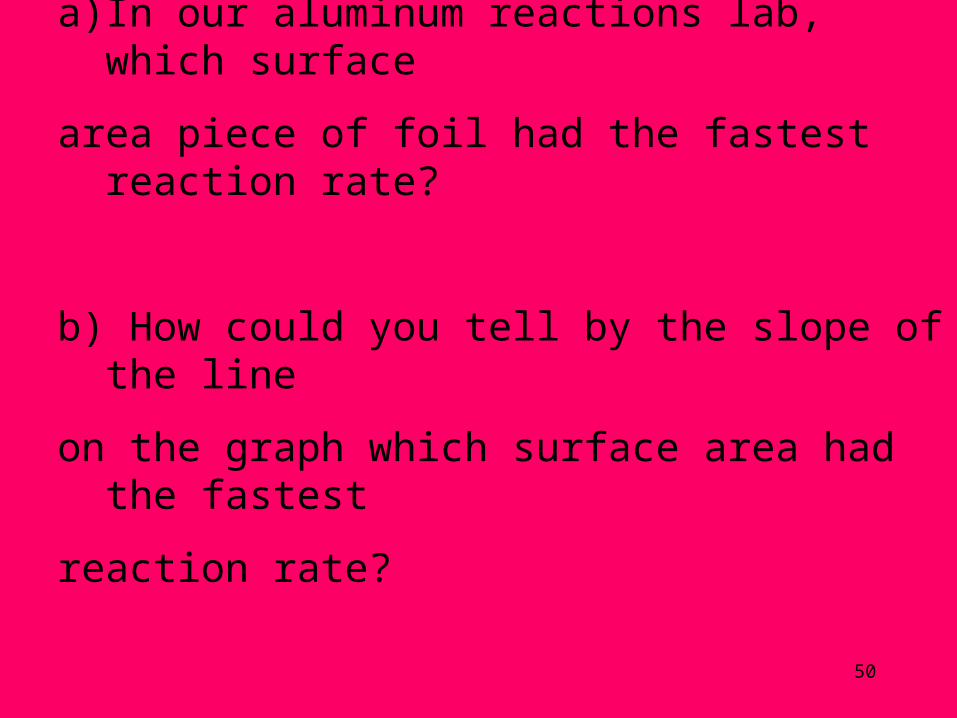
a) In our aluminum reactions lab, which surface
area piece of foil had the fastest reaction rate?
b) How could you tell by the slope of the line
on the graph which surface area had the fastest
reaction rate?
51
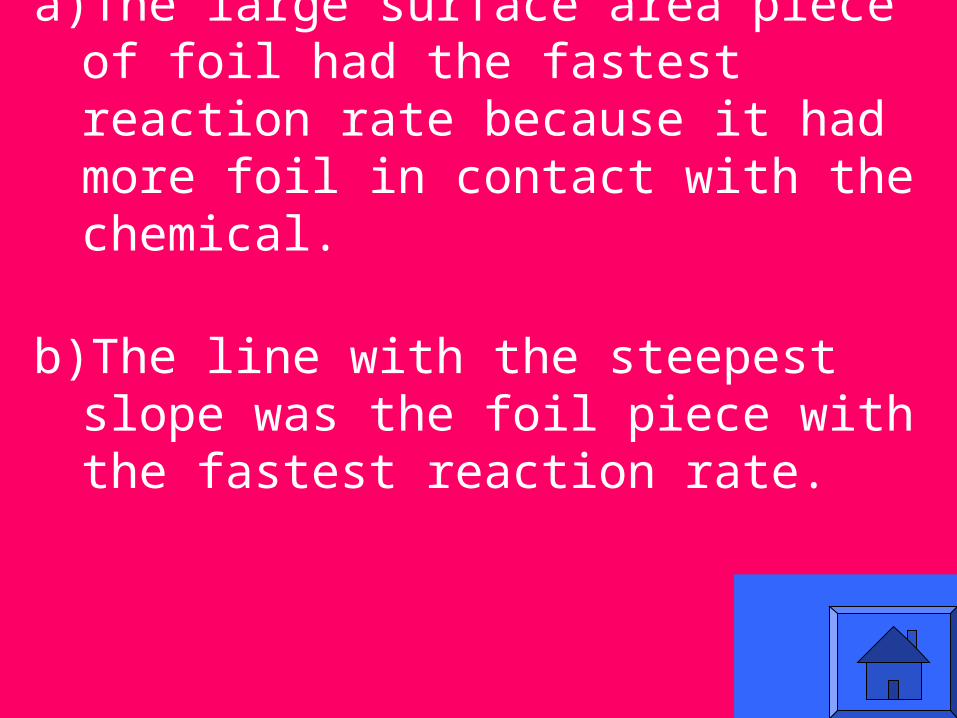
a)The large surface area piece of foil had the fastest reaction rate because it had more foil in contact with the chemical.
b)The line with the steepest slope was the foil piece with the fastest reaction rate.