Embed Size (px)
Citation preview
Productivity, Economics, and Fruit and Soil Quality of Weed Management Systems in 1
Commercial Organic Orchards in Washington State, USA 2
3
David Granatstein1, Preston Andrews2, Alan Groff3 4 1Washington State University Center for Sustaining Agriculture and Natural Resources, 5
Wenatchee, WA USA; 2Washington State University Dept. of Horticulture, Pullman, WA USA; 6 3Foreman Land and Fruit Company, Wenatchee, WA USA 7
8
Research published in Organic Agriculture, 2014, Vol 4(3), pp. 197-207. 9 10
Abstract 11
Organic tree fruit producers often rely on tillage in the tree row to control weeds and disrupt 12
rodent pest habitat. This inexpensive practice can potentially damage the trees’ trunk and roots, 13
thereby reducing yield and fruit quality. In contrast, mulching under the trees to suppress weeds 14
often improves tree performance but at a high initial installation cost, whereas flame weeding 15
and organic-compliant herbicides can control weeds without disturbing the soil. These three 16
systems of weed management in the tree row were compared in commercial, certified organic 17
apple and pear orchards in Washington State, USA, to determine the effectiveness for weed 18
control, and the impacts on tree performance, soil organic matter, and economic return of each 19
system when taking into account both the cost of the weed control itself and its impact on fruit 20
yield and quality. Mulching produced a large net economic benefit relative to tillage, more so in 21
the apple orchard that had sandier soil than in the pear orchard on a loam soil. Flame weeding 22
was similar to tillage in cost, whereas organic herbicides proved extremely expensive and 23
relatively ineffective. Tillage did not lead to a decline in soil organic matter over three seasons, 24
nor did mulching increase it. Overall, mulching led to better tree performance and economic 25
returns but was not a successful stand-alone weed control practice over three years. A 26
combination of flaming and tillage and/or mulch may offer the best overall results. 27
28
Keywords apple, pear, tillage, mulch, flame weeding, soil organic matter, economics 29
30
Introduction 31
Organic tree fruit production continues to expand in a number of regions in response to steady 32
increases in consumer demand for organic fruit (Granatstein et al. 2013). Given the limited 33
number of fertilizers and herbicides available for organic production, orchard floor management 34
takes on a more critical role for organic growers. The orchard floor affects nutrients, water, and 35
pests, all of which influence tree performance and orchard economics. Weed control interacts 36
with all of these aspects. Typical organic orchard weed control approaches include tillage in the 37
tree row, which disturbs the root zone soil, and approaches that do not disturb the soil, such as 38
flame weeding, mowing, weed fabric, and mulches (Granatstein et al. 2010), along with periodic 39
mowing of the grass drive alley. Organically-compliant herbicides have been tried with limited 40
success. Tillage for weed control, the most common practice in the Pacific Northwest (D. 41
Granatstein, unpublished data), has been linked to decreased tree growth, lower fruit yield, 42
smaller fruit size, and loss of soil organic matter (Woolridge and Harris 1989; Merwin and Stiles 43
1994; Neilsen et al. 2003; Granatstein and Sánchez 2009; Granatstein et al. 2010). These first 44
three issues are directly related to orchard profitability, while loss of soil organic matter can 45
affect the requirement for growers to “maintain or improve soil quality” under the National 46
Organic Program (USDA 2001). Monitoring trends in soil organic matter is the most common 47
way of demonstrating compliance with this requirement. In contrast, previous studies on 48
mulching within the tree row have generally led to positive tree responses for growth, yield, 49
and/or fruit size (Zhao et al. 2002; Neilsen et al. 2003; Granatstein and Mullinix 2008; 50
Granatstein et al. 2010), as well as improved soil quality (Forge et al. 2003; Yao et al. 2005). 51
While organic apples and pears in Washington State have consistently garnered a price premium 52
over conventional fruit for over 15 years (Kirby and Granatstein 2012), in some years the 53
premium has been quite small and may not have covered the increased costs of organic 54
production, which are often dominated by weed control in the tree row, the most challenging, 55
important and costly location. 56
This study was conceived to help determine whether alternative approaches to weed control 57
that do not cause soil disturbance would perform better than a tillage-based system in terms of 58
crop productivity, tree growth, economic return, and fruit and soil quality. The experiment was 59
conducted in two mature, commercial organic orchards (apple and pear) using large-scale 60
replicated plots in order to overcome some of the variability that often occurs with small-plot 61
orchard trials. 62
63
Materials and methods 64
Description of orchards and management practices 65
The study was conducted in two commercial organic orchards in Washington State, USA. A 66
mature apple (Malus x domestica Borkh. cv. Gala/M.26) orchard, located near Royal City, WA 67
(latitude 46.92N, longitude 119.84W), was planted in 2004 on a Kennewick fine sandy loam soil 68
(Xeric Torriorthent) and was certified organic starting in 2006. The orchard was on a west-facing 69
slope (10-15%), with trees planted across the slope at 1.22 m between trees x 4.27 m between 70
rows, and trained to a vertical trellis. A mature pear (Pyrus communis cv. d’Anjou/OHxF97) 71
orchard, located near Tonasket, WA, (latitude 48.67N, longitude 119.52W), was planted in 1992 72
on a Nighthawk loam soil (Calcidic Haploxeroll) and was certified organic since 2008. The 73
orchard was generally flat, with trees spaced 5.49 m x 5.49 m apart. Common management 74
practices across plots in both orchards included insect pest management based on codling moth 75
pheromone mating disruption and organic-compliant insecticides, organic compliant-disease 76
control materials, annual fall additions of 6.7 MT ha-1 of chicken manure compost (4% total N; 77
C:N ~10:1) to the tree row, mowing drive alleys 3-4 times per year and undertree irrigation 78
(microsprinklers in apple, impact sprinklers in pear) according to tree need. Blossom thinning 79
with lime sulfur was done on apples only. Fruit at both orchards were harvested by hand and 80
placed in bins that were trucked to the fruit storage and packing facility. 81
The same three treatments were used in the tree rows at both orchards (Table 1): 1) tillage 82
(Wonder Weeder, Harris Mfg., Burbank, WA), five passes per year, as the standard control. 2) 83
organic herbicide [per application mix of WeedPharm™ (Pharm Solutions, Inc., Port Townsend, 84
WA) 20% acetic acid at 112 L/applied ha; citric acid at 17.9 kg/applied ha; horticultural oil at 85
18.7 L/applied ha, and 60.57 L water] applied four times per year in 2009, and flame weeding 86
(Red Dragon GP-750, Flame Engineering Inc., LaCrosse, KS) used five times per year 87
(herbicide/flaming). The herbicide/flaming plots were treated only with herbicides in 2009, 88
herbicides early in 2010, then flaming for the balance of the 2010 season, and flaming only in 89
2011 due to no better weed control and much higher cost of the herbicides. 3) wood chip mulch 90
(bark and wood debris from a lumber mill, 10 cm thick, 0.9 m wide) over a weed barrier fabric 91
(non-woven landscape fabric, Geotech South, Macon, GA) plus flaming (mulch/flaming). The 92
mulch/flaming plots were flame-weeded in 2010 and 2011 to attempt to control the weeds that 93
were emerging on top of or through the wood chips. All treatments were first applied during 94
July-August 2009. Each treatment was replicated four times in a randomized complete block 95
design at each site, with each plot consisting of three rows. Plot size was approximately 0.28 ha 96
in apple and 0.36 ha in pear. 97
In both orchards, hand sampling was done on 10 trees of relatively uniform size in the center 98
row of each plot for tree growth, fruit yield, average fruit size, fruit quality, and tree leaf N. In 99
addition, a commercial harvest from each plot was done yearly (2009, 2010 and 2011), where all 100
fruit from the center row of each plot were hand harvested into bins by a commercial picking 101
crew. Each plot had a unique bin tag number for those bins harvested from the plot to enable 102
tracking through the fruit packing process. Bins were taken to the fruit warehouse for cold 103
storage. When the fruit were designated for sale, bins from each plot were run as a group on a 104
commercial packing line, with all plots from an orchard run on the same day. Data were 105
recorded by plot for fruit size distribution, grade, and sales price to allow for statistical analysis. 106
Actual pear yields per hectare for 2009 could not be calculated as the number of trees included in 107
the harvest differed among plots due to selective harvest based on maturity, and this number was 108
not recorded. The irrigation system in the apple orchard was upgraded after the 2009 harvest in 109
order to provide water more frequently during the hottest part of the growing season, and this 110
raised fruit yields throughout the entire orchard, based on historical records. 111
112
Field sampling and measurements 113
Tree growth was measured as cross-sectional area of the trunk at 20 cm above the graft union 114
(TCSA) on apple, and at the base of large limbs on pear trees, calculated as limb cross-sectional 115
area (LCSA). Results are reported as percent increase over two years to normalize for 116
differences in tree size at the start of the trial. Measurements were taken in July and October 117
2009, October 2010, and October 2011. Fully expanded tree leaves on new terminal shoots, 30 118
leaves per plot, were sampled in late July 2010 and 2011. Leaves were washed in distilled water, 119
dried, ground, and analyzed for total N by combustion (SoilTest Farm Consultants Inc., Moses 120
Lake, WA). Apple fruit were harvested, counted, and weighed per sample tree, while pear fruit 121
were collected and measured per sample limb. A sample of 30 undamaged fruit of similar size 122
(~215 g for apple, ~260 g pear) were randomly collected from the harvested fruit for each plot, 123
packed in boxes, and stored at 2.2oC until they were analyzed for fruit quality. Weed biomass 124
was collected in mid-summer prior to a weed control event from three random locations per plot 125
in the tree row with a 0.25 m2 hoop, clipping the weeds at ground level, drying them, and 126
determining dry matter. Weed cover was measured in the tree row with a point-intersect method 127
on four or five dates from early May to early September. Three subsamples per plot were taken, 128
noting points either as broadleaf weeds, grass weeds, or bare ground. Soil samples (five 129
composite cores per plot from the tree row) were taken in July 2009 prior to treatment 130
application for baseline total C, Particulate Organic Matter (POM), and mineral nutrients; in 131
October 2010 for POM; and in October 2011 for POM, total C, and nutrients. POM samples 132
were collected separately from 0-5 cm and 5-10 cm depths to monitor potential short-term 133
changes in soil carbon relative to the longer-term change anticipated for total C. The total C and 134
nutrient samples (0-30 cm depth) were analyzed with standard methods (combustion for total C 135
and N; SoilTest Farm Consultants, Moses Lake, WA). POM C and N were determined with the 136
method of Cambardella and Elliott (1992). Vole damage was assessed in March of 2010 and 137
2011, visually rating trunks of 20 trees per plot on a scale of 0 (no damage) to 3 (total girdling). 138
139
Fruit quality analysis 140
Apple fruit quality was measured just after harvest, while pear fruit quality was measured after 141
eight weeks in refrigerated storage to approximate physiological maturity. No pear fruit quality 142
measurements were taken in 2010 because of fruit deterioration during storage. Twenty similar 143
sized fruit per plot were measured for weight, firmness, soluble solids concentration, and starch 144
index (apple only). A pooled sample of fruit skin (peel) and flesh (cortex) from each plot was 145
measured for total phenolics concentration. Fruit firmness after skin removal was measured on 146
an automated Güss Fruit Texture Analyzer (Model GS-20, software version 5.0, Güss 147
Manufacturing Ltd., Strand, South Africa). Soluble solids concentration was measured with a 148
digital refractometer (Atago Model PR-101 Palette Refractometer, Atago Co., Ltd., Tokyo, 149
Japan) for juice expressed from fruit cortical tissue taken just under the skin. Two measurements 150
each of firmness and soluble solids were made at the equator on opposite sides of each fruit. The 151
starch-iodine index for individual apple fruit was evaluated using the method of Blanpied and 152
Silsby (1992). Each fruit was cut in half across the equator, sprayed with a potassium iodide 153
solution, incubated for 5 min, and then its pattern of staining was compared to the Cornell starch-154
iodine index chart (8-point scale) for apples. 155
As certain consumers are interested in foods with elevated levels of anti-oxidants, the effect 156
of the treatments on total phenolics (an indicator of anti-oxidant content) was evaluated. Total 157
phenolic (TP) compounds were measured with the Folin-Ciocalteu phenol (F-C) reagent with 158
modifications (Singleton et al. 1999). An extract from powdered, frozen fruit tissue (200 mg 159
peel or 500 mg flesh) was combined with either saturated Na2CO3 or water and the absorbance of 160
each was measured at 760 nm in a UV-visible spectrophotometer (Model HP8453, Hewlett-161
Packard Co., Palo Alto, CA). The concentration of phenolic compounds was determined by 162
subtracting the absorbance of samples containing Na2CO3 from those containing water, and 163
quantified as gallic acid (3,4,5-trihydroxybenzoic acid) equivalents based on standard curves. 164
165
Financial analysis 166
All costs of each weed control treatment were recorded by the grower and were the same at both 167
orchards. Costs for the other operations common to all treatments (e.g. pruning, thinning, 168
fertilization, pest management, irrigation) were the same across treatments within an orchard. A 169
partial budget was developed for each weed control system to determine cost/ha/yr (Online 170
Resource 1). Revenue per plot was determined from the commercial pack-out, using actual sales 171
prices. Harvest cost was calculated for each plot by multiplying the per bin picking payment for 172
that year by the number of bins picked. Finally, grower return after harvest and weed control 173
cost was calculated for each year, then summed for the three-year period. Tillage was then set to 174
zero, being the control treatment for comparison, and the relative return compared to tillage was 175
calculated for the other treatments. 176
177
Statistical analysis 178
Data were analyzed using Statistix 9 (Analytical Software Inc., Tallahassee, FL). All data were 179
tested for normality prior to analysis. Only tree growth data were not normally distributed and 180
were ln transformed. Data were analyzed using ANOVA for single year data and repeated 181
measures ANOVA for multi-year data, and FLSD for mean separation with significance at 182
p=0.05 unless otherwise noted. 183
184
Results and discussion 185
Weed control 186
Quackgrass (Elymus repens (L.) Gould) was the dominant weed each year in the apple orchard 187
and widely infested the tree rows. It was also present in the pear orchard, but the site was more 188
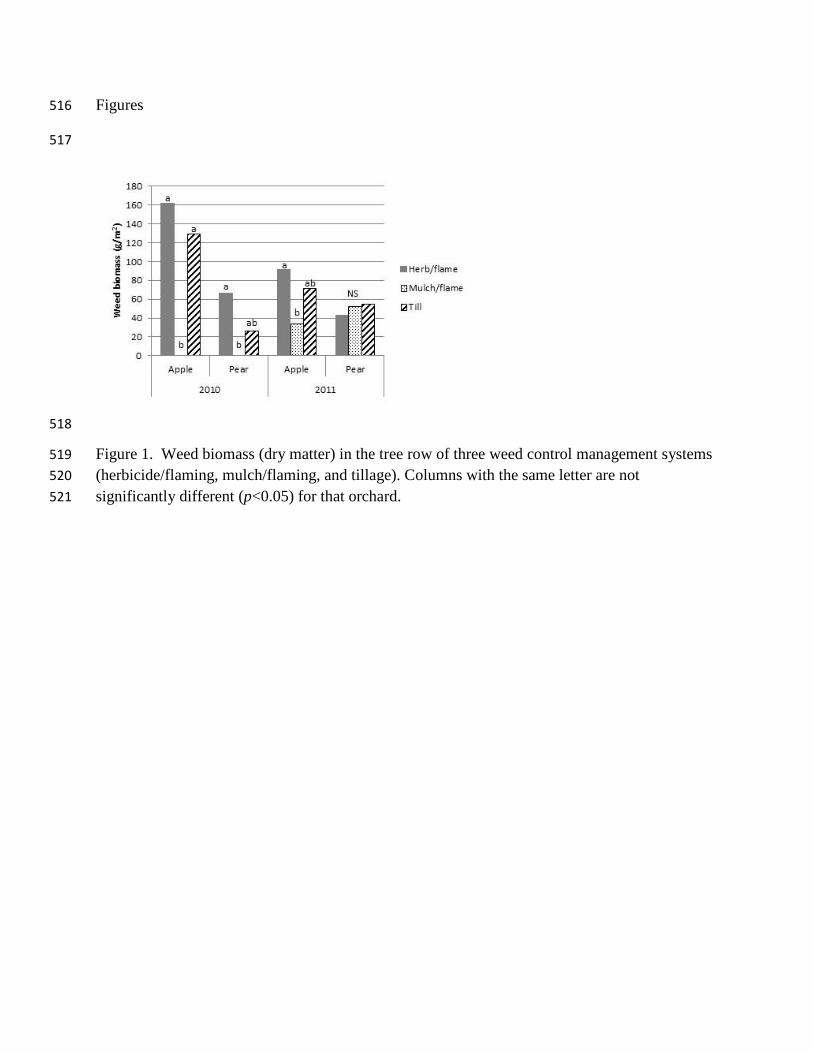
dominated by broadleaf weeds (data not shown). In 2010, the first full season with treatments 189
in place, mulch/flaming reduced weed biomass to near zero in apples, while weed biomass 190
between tillage or herbicide/flaming was not significantly different (Fig. 1). The weed fabric 191
under the mulch in apples did minimize the infestation of the mulch layer by quackgrass 192
rhizomes in 2010, but this effect was greatly diminished in 2011 (data not shown). In 2011, weed 193
biomass with mulch/flaming did rise, while weed biomass for the other two treatments showed a 194
significant decrease. Approximate changes in weed percent cover from 2010 to 2011 were as 195
follows: tillage, 72% to 47% *; herbicide/flaming, 84% to 67% ns; mulch/flaming, 20% to 45% 196
* (* p=0.003, SEM= 5.57%). Weed biomass in pears was also near zero for mulch/flaming plots 197
in 2010, with a significant difference from herbicide/flaming plots only (Figure 1). By 2011, 198
weed biomass was similar in all pear treatments, with overall levels similar to the 199
herbicide/flaming plots in the previous year. Weed biomass increased significantly in the 200
mulch/flaming plots. Weed percent cover in pears did not change significantly between years 201
(50% in 2010, 41% in 2011; p=0.27, SEM=5.81) or among treatments (Tillage 44%, 202
herbicide/flaming 48%, mulch/flaming 45%; p=0.80, SEM= 4.66). 203
One unanticipated effect of the wood chip mulch with fabric underneath was attraction of 204
meadow voles (Microtus pennsylvanicus) to these plots in the apple orchard where they entered 205
under the fabric and moved to the tree trunks, to which they caused extensive partial girdling. 206
Trees in mulch/flaming plots had significantly more damage (1.45 on 0-3 scale; p=0.04; 207
SEM=0.48) than either tillage (0.15) or herbicide/flaming (0.05). Previous studies of wood chip 208
mulch without fabric found vole presence no different than bare ground or tillage (Wiman et al. 209
2009). In another orchard with the same management comparisons as this study, heavy 210
quackgrass infestation, extensive vole damage to trunks of young trees, and the same pattern of 211
weed suppression were seen (data not shown). 212
Clearly, mulching along with supplemental flaming did not provide superior weed control for 213
more than a year when perennial weeds like quackgrass were present. In a previous study at a 214
site where quackgrass was not present, a wood chip mulch without fabric provided acceptable 215
weed control for three years (Granatstein and Mullinix 2008). Organic herbicide, used in 2009, 216
did not provide any better weed control than flaming, used in 2010 and 2011, with the latter 217
having a much lower cost (see below). Currently available organic compliant herbicides appear 218
insufficient to control invasive perennial weeds, such as quackgrass. 219
220
Tree growth 221
Mulch/flaming in apple increased tree growth over the other treatments, as measured by percent 222
increase in trunk cross-sectional area (Table 2). This level of growth is typical of apple orchards 223
of this age (i.e. 5-10 years). There were no treatment effects on tree growth for the older pear 224
trees. In an Australian study of mature pears with either cultivation, white clover, bare ground, 225
or straw mulch in the tree rows, the straw mulched trees had a 40% increase in root length 226
compared to the bare ground treatment, while cultivation led to a 42% decline in root growth; 227
however, above-ground, tree growth was not measured (Cockroft and Wallbrink 1966). Impacts 228
on roots were not measured in the current study but were hypothesized to express themselves 229
through differences in tree growth, especially from the root pruning effects of tillage. However, 230
this was not observed at either site. 231
Tree leaf N (%) showed a significant decline (p<0.002) at both sites from 2010 to 2011 232
(Table 2), with no differences among treatments and no treatment by year interaction. Variability 233
was low, with a Coefficient of Variability of 4% for apple and 3% for pear. All treatments were 234
at levels not associated with N deficiency (Stiles and Reid 1991). The weed control management 235
systems employed had no consistent impact on either tree growth or leaf N over the duration of 236
this study. 237
238
Fruit yield, size and quality 239
Commercial harvests by plot were done for three years in apples. There were no treatment by 240
year interactions. Yields in 2009 were significantly less (p=0.0001) than in 2010 and 2011. 241
When analyzed with repeated measures, there were no significant treatment effects on yield. 242
When each year was analyzed separately, mulch/flaming yields were higher than in the other 243
treatments at p=0.06, 0.08, and 0.01, for 2009, 2010 and 2011, respectively (Table 3), and 3-year 244
cumulative yields for mulch/flaming were significantly greater than the other treatments. For 245
pears, there were no significant treatment, year, or interaction effects using repeated measures 246
analysis. When analyzed by year, fruit yield for mulch/flaming was significantly higher (p=0.04) 247
in 2011 than the other treatments. There were no treatment differences for cumulative yield 248
(Table 3). A regression of weed biomass versus fruit yield showed no relationship for pears, and 249
a weak inverse relationship for apples (p=0.009; r2=0.51). Results support the hypothesis that 250
mulch/flaming can increase fruit yield over an undisturbed weed-suppressed tree row 251
(herbicide/flaming in this study), especially on a more coarse-textured soil. They do not show 252
that tillage lowered yields (presumably from root pruning or other tree damage) compared to the 253
undisturbed herbicide/flaming plots in this study. 254
No clear trend emerged for treatment effects on fruit size (data not shown). In apples, there 255
was no treatment effect in 2009 or 2011, but mulch/flaming led to significantly greater (p=0.04) 256
percentage of fruit in the economically optimal sizes of 202-227 g and 228-249 g, increasing the 257
number of these sized fruit by 40% over the other treatments. There were no significant 258
treatment effects on fruit size in pears. There were no significant treatment effects on fruit 259
quality parameters for firmness, soluble solids, starch index, or flesh phenolics in any year (data 260
not shown). The only statistically significant treatment effect for fruit quality was on skin 261
phenolics for pears in 2011, where tillage resulted in more phenolics than herbicide/flaming. 262
While previous studies have shown effects of both tillage and mulch on tree growth, yields, 263
and fruit size, none have looked comprehensively at fruit quality. An improvement in fruit 264
quality, including the antioxidant phenolics content, would provide another potential economic 265
benefit from a given management system. Since no differences were found other than the pear 266
skin phenolics in one year, the results suggest that none of these weed control management 267
systems negatively impacted fruit quality. 268
269
Soil quality 270
In this study, soil organic matter (SOM) was considered the key parameter to monitor for 271
changes in soil quality. Organic compliance requires “maintaining or improving soil quality” 272
(USDA 2001) and this can be met by maintaining or improving soil organic matter. Mulching 273
adds large quantities of carbon to the soil, but it remains primarily on the surface. Tillage is 274
known to lead to decreases in SOM due to enhanced oxidation (Merwin 2003), but can also aid 275
decomposition of green plant material, such as weeds, and incorporate organic amendments like 276
compost. Thus, while tillage is commonly used for weed control and is generally less expensive 277
than other management options, if it jeopardizes organic certification and access to price 278
premiums, it may not be economically desirable for an orchard enterprise. Typical compost 279
application rates, as used in these orchards, do not always maintain SOM in sandier soils in this 280
semi-arid environment. 281
Overall, there were no significant treatment effects or changes over time for soil C, both total 282
C and Particulate Organic Matter C (POM-C) using repeated measures analysis (data not shown). 283
Despite the large addition of organic C with the wood chip mulch, no change in soil C was 284
detected, likely due to inhibited mixing of the mulch into the soil by organisms because of the 285
underlain weed fabric. In addition, the sampling protocol excluded organic residues on the soil 286
surface from the sample, used a 30-cm depth, which would have diluted any changes that 287
occurred near the surface, and did not adjust for any differences in soil bulk density. The POM-C 288
tests were intended to look more closely at the surface layers and at a carbon fraction that often 289
responds more quickly than total C (Cambardella and Elliott 1992; Marriott and Wander 2006). 290
In a long-term study in New York State, a 15-cm thick bark mulch application raised the soil 291
organic matter by 18% one year after application, and by 72% after fourteen years with a total of 292
six applications (Atucha et al. 2011). None of the weed management systems in this study 293
altered soil organic matter in the tree row, and thus the concern that using tillage for weed 294
control might jeopardize soil quality was unsubstantiated. 295
296
Financial performance 297
Fruit from each plot were picked, graded, packed and priced separately so that actual revenues 298
for each treatment could be analyzed. The annual costs for each weed management system 299
(Table 4) were also recorded each year by the grower and are explained below. Because the plots 300
were otherwise treated identically within an orchard, the costs differed only in weed management 301
and harvest costs. 302
303
Tillage Costs 304
Tillage was used as the baseline weed management system as it is currently most commonly 305
used by Washington state organic growers (Pitts et al., 2010). The cost of tillage was modest, 306
about $US262 per hectare ($US106 per acre) per year for five passes through the orchard with 307
the tractor-mounted WonderWeeder (Online Resource 1a). One third of this cost is associated 308
with the required incremental equipment costs, specifically the WonderWeeder and front three-309
point lift required on the tractor. The other two thirds of the costs are from the direct operating 310
costs, including fuel, labor, and the cost of the tractor. 311
312
Mulch Costs 313
Mulch was a one-time expense that cost $US2,969 per hectare ($US1,202 per acre), nearly ten 314
times the annual cost of tillage (Online resource 1b). In previous trials, mulch has provided 315
satisfactory weed control for 2-4 years, and likely provides growth benefits beyond that for the 316
trees. Mulch application was 10 cm (4 inches) thick and 0.9 m (3 feet) wide along the tree row. 317
The mulch material itself represented three quarters of the cost. In this study, the material was 318
obtained from a source at no charge but had to be transported 97 km (60 miles) by truck. If 319
material had been in closer proximity to the orchards, this cost would have been less. One 320
quarter of the cost was incurred from the application of such a large amount of bulk material 321
using a rented mulch spreader (Whatcom Mfg., Lynden, WA, USA). 322
323
Organic Herbicide Costs 324
The costs for applying organic compliant herbicides were $US1,256 per hectare ($US509 per 325
acre) when the rate and concentration were raised to levels that provided some degree of weed 326
control (Online resource 1c). Initially, lower rates of WeedPharm (20% acetic acid), citric acid, 327
and oil were used, but they were not effective and the treatment was changed to the maximum 328
allowable rate. A low-volume Enviromist weed sprayer (Enviromist Industries Pty. Ltd., Berri, 329
South Australia) was purchased to see if that could reduce costs by applying lower volumes of 330
material. High concentrations at low volumes were more effective than low concentrations at 331
high volumes, however results were still insufficient to provide any meaningful control. 332
Additionally, the acidic solution quickly destroyed the Enviromist sprayer. Consequently, the 333
only way to achieve any visually obvious control was through the use of large quantities of spray 334
material. Other organic compliant herbicide materials were tested in adjacent blocks as well, 335
including GreenMatch (Marrone Bio Innovations, Davis, CA, USA) and Burnout Organic 336
Herbicide (St. Gabriel Organics, Orange, VA, USA). GreenMatch at higher rates was more 337
effective (data not shown) but it was more costly than the WeedPharm/citric/oil solution. 338
Regardless of herbicide product, weed control with these organic compliant herbicides was 339
expensive and marginally effective. 340
341
Flame Weeding Costs 342
Weed control expense with flaming, using five passes per year, was $276 per hectare ($112 per 343
acre), similar in cost to tillage (Online resource 1d). Results were generally better than what was 344
achieved with the organic herbicides, and therefore, for most of the second year (2010) and all of 345
the third year (2011) flaming was solely used for the herbicide/flaming treatment. However, for 346
the economic comparisons below, organic herbicides were included as an expense only for 2009, 347
with flaming as an expense for 2010 and 2011. Flaming was also employed on the mulch 348
treatment in 2010 and 2011 because weeds began to grow through the mulch in 2010, and that is 349
reflected in the weed control costs below (Tables 5 and 6). The propane fuel used in the flamer 350
accounted for 45% of the cost of this weed control system. Flame weeding allows for travel 351
through the orchard at higher speeds than when tilling or spraying herbicides. 352
353
Apple Orchard Economics 354
For the apple orchard, fruit production rose substantially from 2009 to 2010 due to overall 355
improved water management in the orchard, and then declined some in 2011 (Table 3). The fruit 356
price per metric ton was not statistically different among treatments in any year. Gross revenue 357
per hectare was statistically higher (p<0.05) for the mulch-treated plots in 2011 but not in other 358
years (Table 5). When weed control and picking costs were subtracted from gross revenue, and 359
that value summed over the three years, the mulch/flaming treatment returned $11,798 more than 360
the tillage treatment, while the herbicide/flaming treatment returned $2,338 less. Thus, despite 361
the high initial cost for mulch ($2,969/ha), that treatment returned nearly three times the 362
investment for the mulch. 363
Few actions in the orchard result in an economic benefit of this magnitude. The economic 364
benefit of the mulch may be underestimated because its tree performance benefits are likely to 365
last beyond the third year (the grower has observed better growth in the mulch/flaming trees for 366
an additional two years already). Additional weed control would be necessary, for example, with 367
a continuation of flaming. 368
369
Pear Orchard Economics 370
For the pear orchard, fruit were harvested separately by plot and graded and packed separately in 371
all three years. However, in 2009, plots were not uniformly picked due to uneven fruit maturity 372
and the number of trees from which the segregated harvest came were not recorded; therefore, 373
yields per hectare could not be calculated and were estimated at 40 MT/ha, based on actual 374
yields from another part of the same orchard block. The chances of a treatment effect in 2009 375
were deemed unlikely since treatments were applied in late summer of that year, and since there 376
were no yield differences in 2010 A uniform fruit price of $US700 per metric ton was used in 377
the revenue calculations for 2009 (Table 6), based on the actual values from the pack-out reports. 378
There was not a significant difference among treatments in fruit price per metric ton or in gross 379
revenue per hectare for 2010 or 2011. Fruit prices declined for the 2011 crop due to overall 380
smaller fruit size. Revenue differences among pear treatments (Table 6) were smaller than for 381
the apples, likely due to the better quality soil at the site and the older, more uniform stand of 382
pear trees. When weed control and picking costs were subtracted from gross revenue, and that 383
value summed over the three years, the mulch/flaming treatment returned $3,536 more than the 384
tillage treatment, while the herbicide/flaming treatment returned $2,778 less. Again, despite the 385
high initial cost for mulch, that treatment returned 120% of the mulch investment (after paying 386
for the mulch). 387
The cost of the flaming system alone was similar to tillage, showing it to be a viable weed 388
management strategy that avoids the downsides of potential soil degradation and root disruption 389
from tillage, although these problems were not seen in this study of mature orchards. A hybrid 390
of the two could be used, where tillage is employed at the end of the season to disrupt rodent 391
habitat, while flaming is used during the growing season through harvest. Organic herbicides 392
were much more expensive than flaming and would not be economical. 393
394
Conclusions 395
The basis for this study was the concern that tillage damages the trees’ feeder roots that are 396
responsible for water and nutrient uptake, and depletes organic matter, which reduces the water- 397
and nutrient-holding capacity of the soil. The alternative systems used in this study were chosen 398
to eliminate soil disturbance. Research conducted in past decades demonstrated that the 399
herbicide strip-grass alley system plus conventional herbicides and fertilizers was the lowest cost 400
and highest profit approach, despite the fact that in numerous published studies (Zhao et al. 401
2002; Neilsen et al. 2003; Granatstein and Mullinix 2008; Granatstein et al. 2010) mulching the 402
tree row led to superior tree performance. However, other studies did not examine the 403
economics of the systems and thus could not confirm that the improved performance of using 404
mulch in the tree row led to an economic benefit. The constraints of organic farming systems, 405
with more expensive fertilizers and less effective herbicides, may change the profit equation and 406
challenge conventional wisdom, and this question informed the study design. 407
Based on the results from this orchard-scale study, mulching along with supplemental 408
flaming did lead to improved tree performance and financial returns on a site with sandy loam 409
soil (apples) more so than on the loamy soil site (pears). Tillage did not lead to an obvious 410
deterioration in tree performance or soil quality, and was similar to the undisturbed system using 411
organic herbicides and flaming. Tillage and flaming offer different advantages for weed control 412
and orchard performance. Tillage provides the benefit of disrupting rodent habitat. Flaming 413
provides the benefit of not disturbing soil and tree roots. A combination of techniques should be 414
considered to maximize benefits, as was attempted with mulching plus flaming. The limited 415
years of weed control that mulches provide may not justify their expense alone, but the tree 416
performance benefits in this study showed mulch/flaming to be an economically beneficial 417
investment. Examining ways to lower the cost of mulch, perhaps by using a thinner layer and/or 418
generating the material within the orchard, would make it even more economically attractive. 419
420
Acknowledgements. Funding for the study came from a USDA Specialty Crop Block Grant 421
through the Washington State Department of Agriculture. We gratefully acknowledge the 422
generous support of the Foreman Fruit and Land Co., Wenatchee, WA for the use of their 423
orchards to conduct these trials. We also acknowledge the valuable assistance of Cindy Kahn, 424
Rachel Miller, Jackie Pitts, Awais Sial, and Luke Gustafson for their contributions to this study. 425
426
Literature Cited 427
Atucha A, Merwin IA, Brown MG (2011) Long-term effects of four groundcover management 428
systems in an apple orchard. HortSci 46:1176-1183 429
Blanpied GD, Silsby KJ (1992) Predicting the harvest date window for apples. Information 430
Bulletin 221, Cornell University Cooperative Extension, Ithaca, New York 431
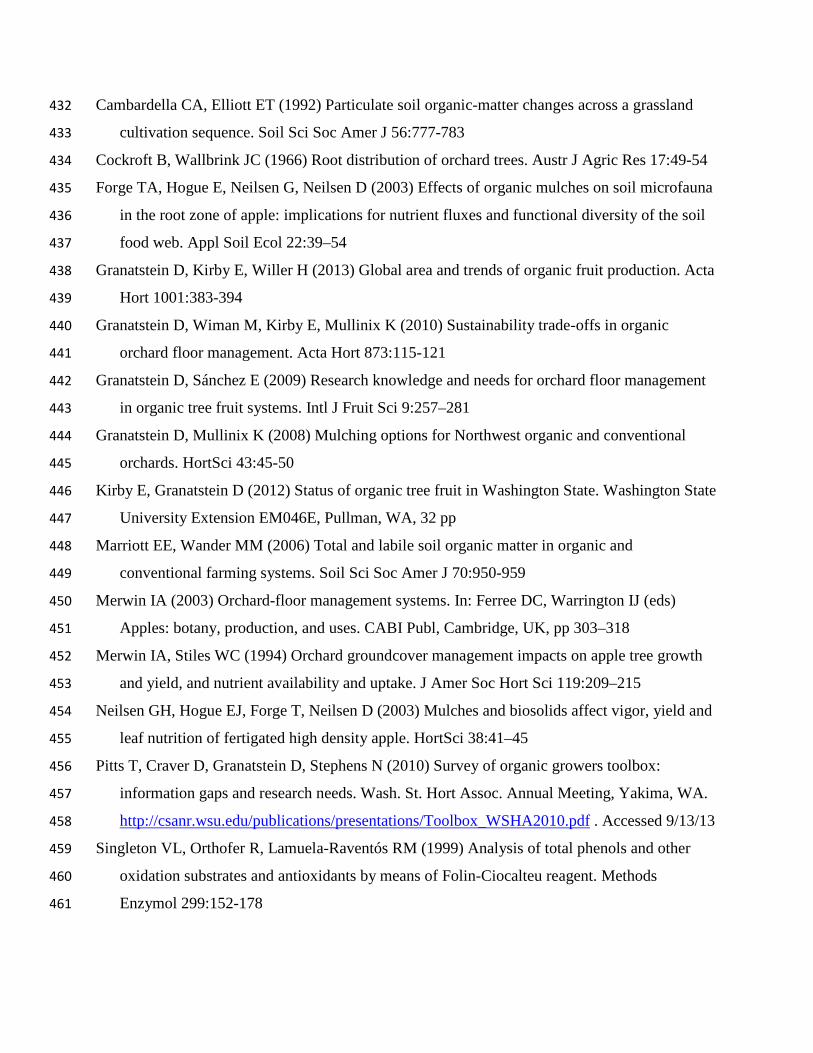
Cambardella CA, Elliott ET (1992) Particulate soil organic-matter changes across a grassland 432
cultivation sequence. Soil Sci Soc Amer J 56:777-783 433
Cockroft B, Wallbrink JC (1966) Root distribution of orchard trees. Austr J Agric Res 17:49-54 434
Forge TA, Hogue E, Neilsen G, Neilsen D (2003) Effects of organic mulches on soil microfauna 435
in the root zone of apple: implications for nutrient fluxes and functional diversity of the soil 436
food web. Appl Soil Ecol 22:39–54 437
Granatstein D, Kirby E, Willer H (2013) Global area and trends of organic fruit production. Acta 438
Hort 1001:383-394 439
Granatstein D, Wiman M, Kirby E, Mullinix K (2010) Sustainability trade-offs in organic 440
orchard floor management. Acta Hort 873:115-121 441
Granatstein D, Sánchez E (2009) Research knowledge and needs for orchard floor management 442
in organic tree fruit systems. Intl J Fruit Sci 9:257–281 443
Granatstein D, Mullinix K (2008) Mulching options for Northwest organic and conventional 444
orchards. HortSci 43:45-50 445
Kirby E, Granatstein D (2012) Status of organic tree fruit in Washington State. Washington State 446
University Extension EM046E, Pullman, WA, 32 pp 447
Marriott EE, Wander MM (2006) Total and labile soil organic matter in organic and 448
conventional farming systems. Soil Sci Soc Amer J 70:950-959 449
Merwin IA (2003) Orchard-floor management systems. In: Ferree DC, Warrington IJ (eds) 450
Apples: botany, production, and uses. CABI Publ, Cambridge, UK, pp 303–318 451
Merwin IA, Stiles WC (1994) Orchard groundcover management impacts on apple tree growth 452
and yield, and nutrient availability and uptake. J Amer Soc Hort Sci 119:209–215 453
Neilsen GH, Hogue EJ, Forge T, Neilsen D (2003) Mulches and biosolids affect vigor, yield and 454
leaf nutrition of fertigated high density apple. HortSci 38:41–45 455
Pitts T, Craver D, Granatstein D, Stephens N (2010) Survey of organic growers toolbox: 456
information gaps and research needs. Wash. St. Hort Assoc. Annual Meeting, Yakima, WA. 457
http://csanr.wsu.edu/publications/presentations/Toolbox_WSHA2010.pdf . Accessed 9/13/13 458
Singleton VL, Orthofer R, Lamuela-Raventós RM (1999) Analysis of total phenols and other 459
oxidation substrates and antioxidants by means of Folin-Ciocalteu reagent. Methods 460
Enzymol 299:152-178 461
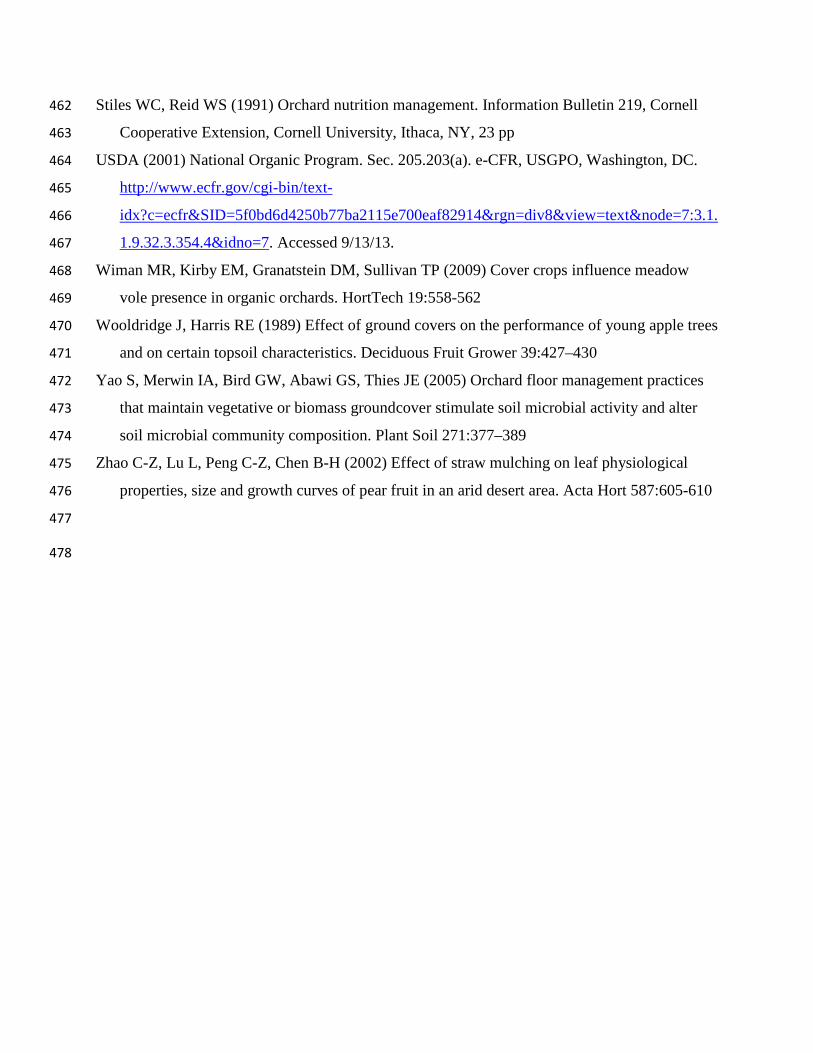
Stiles WC, Reid WS (1991) Orchard nutrition management. Information Bulletin 219, Cornell 462
Cooperative Extension, Cornell University, Ithaca, NY, 23 pp 463
USDA (2001) National Organic Program. Sec. 205.203(a). e-CFR, USGPO, Washington, DC. 464
http://www.ecfr.gov/cgi-bin/text-465
idx?c=ecfr&SID=5f0bd6d4250b77ba2115e700eaf82914&rgn=div8&view=text&node=7:3.1.466
1.9.32.3.354.4&idno=7. Accessed 9/13/13. 467
Wiman MR, Kirby EM, Granatstein DM, Sullivan TP (2009) Cover crops influence meadow 468
vole presence in organic orchards. HortTech 19:558-562 469
Wooldridge J, Harris RE (1989) Effect of ground covers on the performance of young apple trees 470
and on certain topsoil characteristics. Deciduous Fruit Grower 39:427–430 471
Yao S, Merwin IA, Bird GW, Abawi GS, Thies JE (2005) Orchard floor management practices 472
that maintain vegetative or biomass groundcover stimulate soil microbial activity and alter 473
soil microbial community composition. Plant Soil 271:377–389 474
Zhao C-Z, Lu L, Peng C-Z, Chen B-H (2002) Effect of straw mulching on leaf physiological 475
properties, size and growth curves of pear fruit in an arid desert area. Acta Hort 587:605-610 476
477
478
Tables 479
480
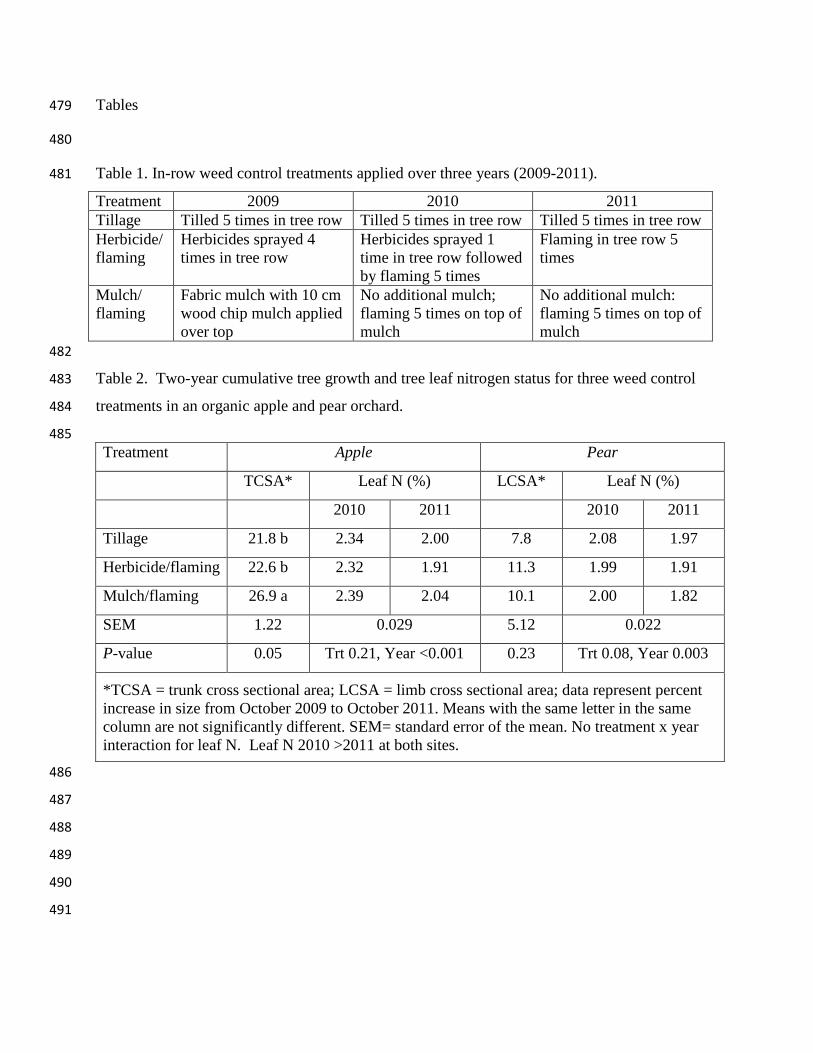
Table 1. In-row weed control treatments applied over three years (2009-2011). 481
Treatment 2009 2010 2011 Tillage Tilled 5 times in tree row Tilled 5 times in tree row Tilled 5 times in tree row Herbicide/ flaming
Herbicides sprayed 4 times in tree row
Herbicides sprayed 1 time in tree row followed by flaming 5 times
Flaming in tree row 5 times
Mulch/ flaming
Fabric mulch with 10 cm wood chip mulch applied over top
No additional mulch; flaming 5 times on top of mulch
No additional mulch: flaming 5 times on top of mulch
482
Table 2. Two-year cumulative tree growth and tree leaf nitrogen status for three weed control 483
treatments in an organic apple and pear orchard. 484
485 Treatment Apple Pear
TCSA* Leaf N (%) LCSA* Leaf N (%)
2010 2011 2010 2011
Tillage 21.8 b 2.34 2.00 7.8 2.08 1.97
Herbicide/flaming 22.6 b 2.32 1.91 11.3 1.99 1.91
Mulch/flaming 26.9 a 2.39 2.04 10.1 2.00 1.82
SEM 1.22 0.029 5.12 0.022
P-value 0.05 Trt 0.21, Year <0.001 0.23 Trt 0.08, Year 0.003
*TCSA = trunk cross sectional area; LCSA = limb cross sectional area; data represent percent increase in size from October 2009 to October 2011. Means with the same letter in the same column are not significantly different. SEM= standard error of the mean. No treatment x year interaction for leaf N. Leaf N 2010 >2011 at both sites.
486
487
488
489
490
491
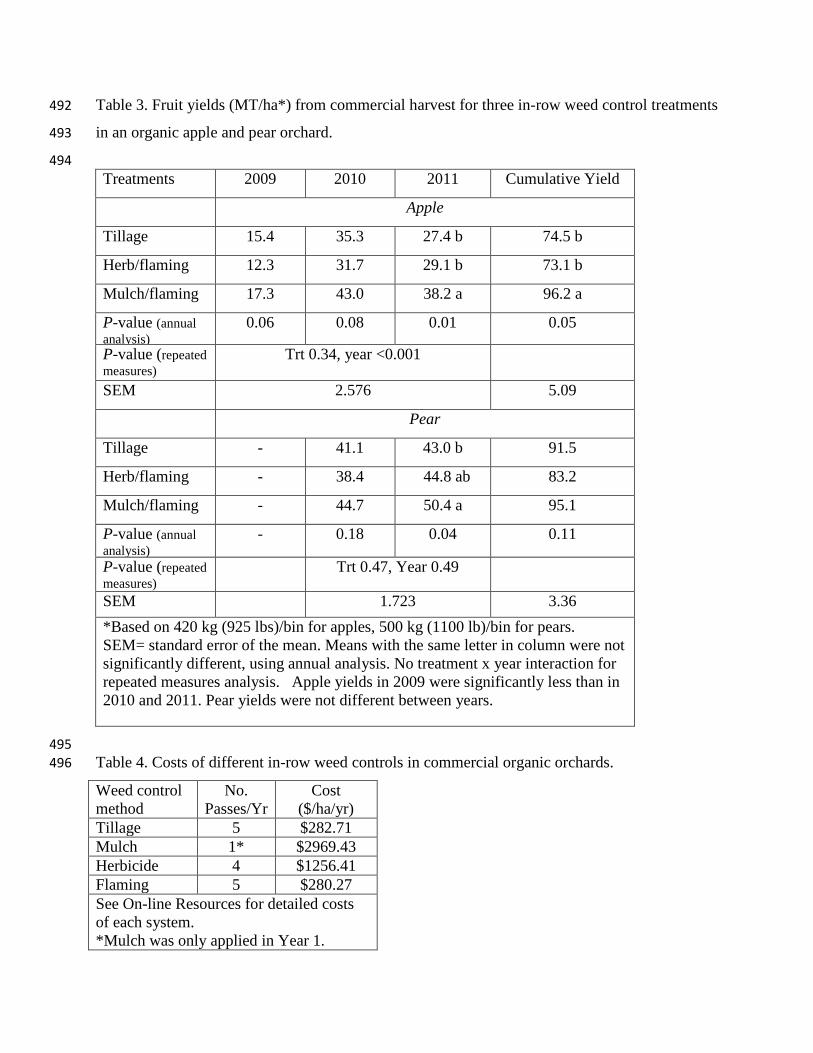
Table 3. Fruit yields (MT/ha*) from commercial harvest for three in-row weed control treatments 492
in an organic apple and pear orchard. 493
494 Treatments 2009 2010 2011 Cumulative Yield
Apple
Tillage 15.4 35.3 27.4 b 74.5 b
Herb/flaming 12.3 31.7 29.1 b 73.1 b
Mulch/flaming 17.3 43.0 38.2 a 96.2 a
P-value (annual analysis)
0.06 0.08 0.01 0.05
P-value (repeated measures)
Trt 0.34, year <0.001
SEM 2.576
5.09
Pear
Tillage - 41.1 43.0 b 91.5
Herb/flaming - 38.4 44.8 ab 83.2
Mulch/flaming - 44.7 50.4 a 95.1
P-value (annual analysis)
- 0.18 0.04 0.11
P-value (repeated measures)
Trt 0.47, Year 0.49
SEM 1.723 3.36 *Based on 420 kg (925 lbs)/bin for apples, 500 kg (1100 lb)/bin for pears. SEM= standard error of the mean. Means with the same letter in column were not significantly different, using annual analysis. No treatment x year interaction for repeated measures analysis. Apple yields in 2009 were significantly less than in 2010 and 2011. Pear yields were not different between years.
495 Table 4. Costs of different in-row weed controls in commercial organic orchards. 496
Weed control method
No. Passes/Yr
Cost ($/ha/yr)
Tillage 5 $282.71 Mulch 1* $2969.43 Herbicide 4 $1256.41 Flaming 5 $280.27 See On-line Resources for detailed costs of each system. *Mulch was only applied in Year 1.
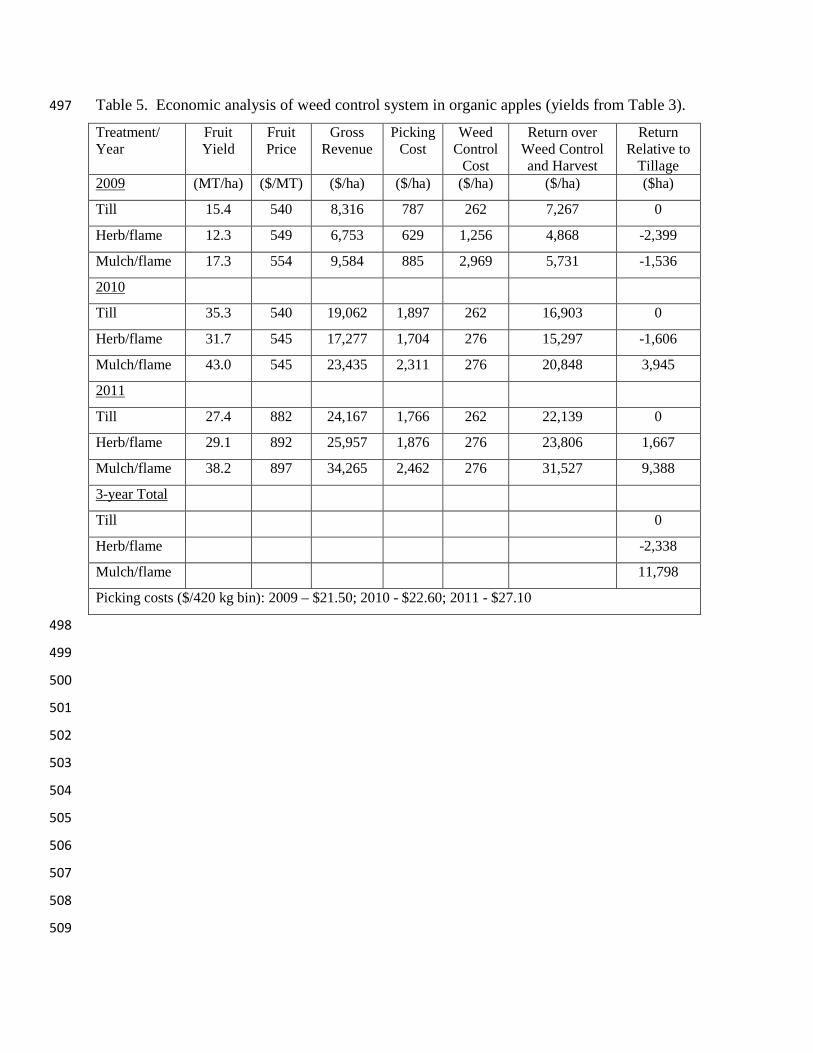
Table 5. Economic analysis of weed control system in organic apples (yields from Table 3). 497
Treatment/ Year
Fruit Yield
Fruit Price
Gross Revenue
Picking Cost
Weed Control
Cost
Return over Weed Control and Harvest
Return Relative to
Tillage 2009 (MT/ha) ($/MT) ($/ha) ($/ha) ($/ha) ($/ha) ($ha)
Till 15.4 540 8,316 787 262 7,267 0
Herb/flame 12.3 549 6,753 629 1,256 4,868 -2,399
Mulch/flame 17.3 554 9,584 885 2,969 5,731 -1,536
2010
Till 35.3 540 19,062 1,897 262 16,903 0
Herb/flame 31.7 545 17,277 1,704 276 15,297 -1,606
Mulch/flame 43.0 545 23,435 2,311 276 20,848 3,945
2011
Till 27.4 882 24,167 1,766 262 22,139 0
Herb/flame 29.1 892 25,957 1,876 276 23,806 1,667
Mulch/flame 38.2 897 34,265 2,462 276 31,527 9,388
3-year Total
Till 0
Herb/flame -2,338
Mulch/flame 11,798
Picking costs ($/420 kg bin): 2009 – $21.50; 2010 - $22.60; 2011 - $27.10
498
499
500
501
502
503
504
505
506
507
508
509
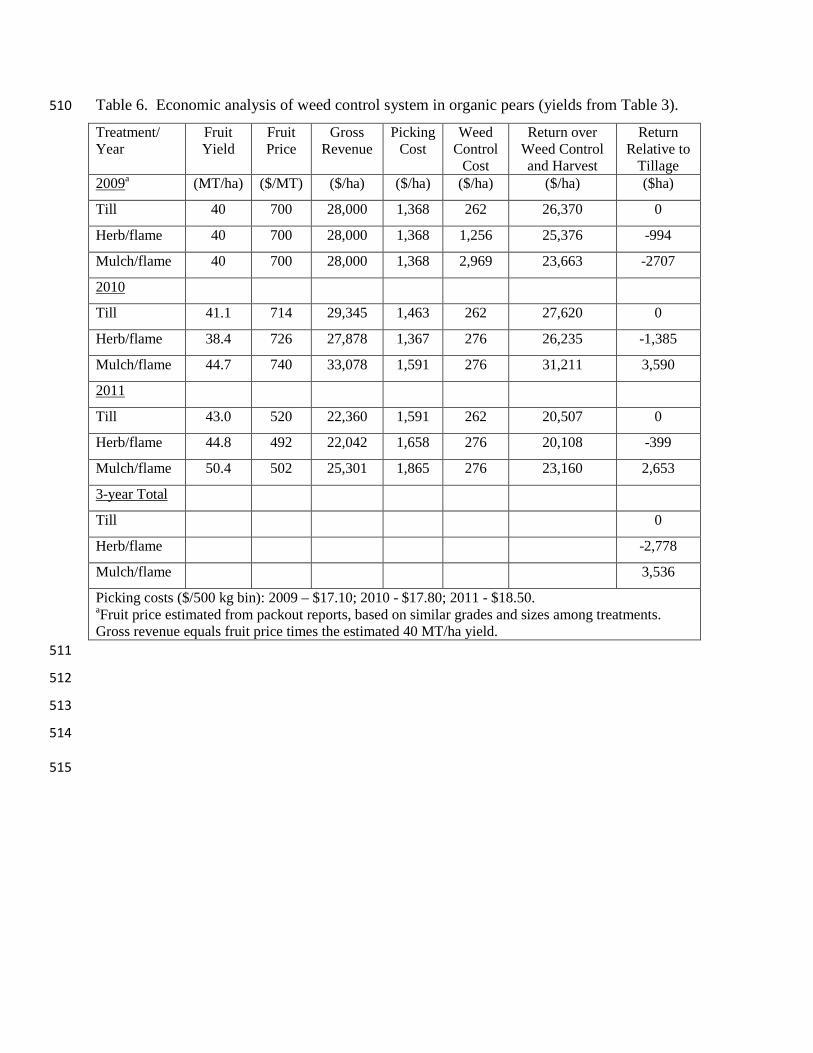
Table 6. Economic analysis of weed control system in organic pears (yields from Table 3). 510
Treatment/ Year
Fruit Yield
Fruit Price
Gross Revenue
Picking Cost
Weed Control
Cost
Return over Weed Control and Harvest
Return Relative to
Tillage 2009a (MT/ha) ($/MT) ($/ha) ($/ha) ($/ha) ($/ha) ($ha)
Till 40 700 28,000 1,368 262 26,370 0
Herb/flame 40 700 28,000 1,368 1,256 25,376 -994
Mulch/flame 40 700 28,000 1,368 2,969 23,663 -2707
2010
Till 41.1 714 29,345 1,463 262 27,620 0
Herb/flame 38.4 726 27,878 1,367 276 26,235 -1,385
Mulch/flame 44.7 740 33,078 1,591 276 31,211 3,590
2011
Till 43.0 520 22,360 1,591 262 20,507 0
Herb/flame 44.8 492 22,042 1,658 276 20,108 -399
Mulch/flame 50.4 502 25,301 1,865 276 23,160 2,653
3-year Total
Till 0
Herb/flame -2,778
Mulch/flame 3,536
Picking costs ($/500 kg bin): 2009 – $17.10; 2010 - $17.80; 2011 - $18.50. aFruit price estimated from packout reports, based on similar grades and sizes among treatments. Gross revenue equals fruit price times the estimated 40 MT/ha yield. 511
512
513
514
515
Figures 516
517
518
Figure 1. Weed biomass (dry matter) in the tree row of three weed control management systems 519 (herbicide/flaming, mulch/flaming, and tillage). Columns with the same letter are not 520 significantly different (p<0.05) for that orchard. 521


![Effect of Climate Change on Soil Productivity in ......how climate change has affected soil productivity because soil productivity plays a key role in agricultural development [20].There](https://img.pdfslide.us/doc/110x75/5f1b1e8069fa761e3c401861/effect-of-climate-change-on-soil-productivity-in-how-climate-change-has.jpg)