Embed Size (px)
Citation preview
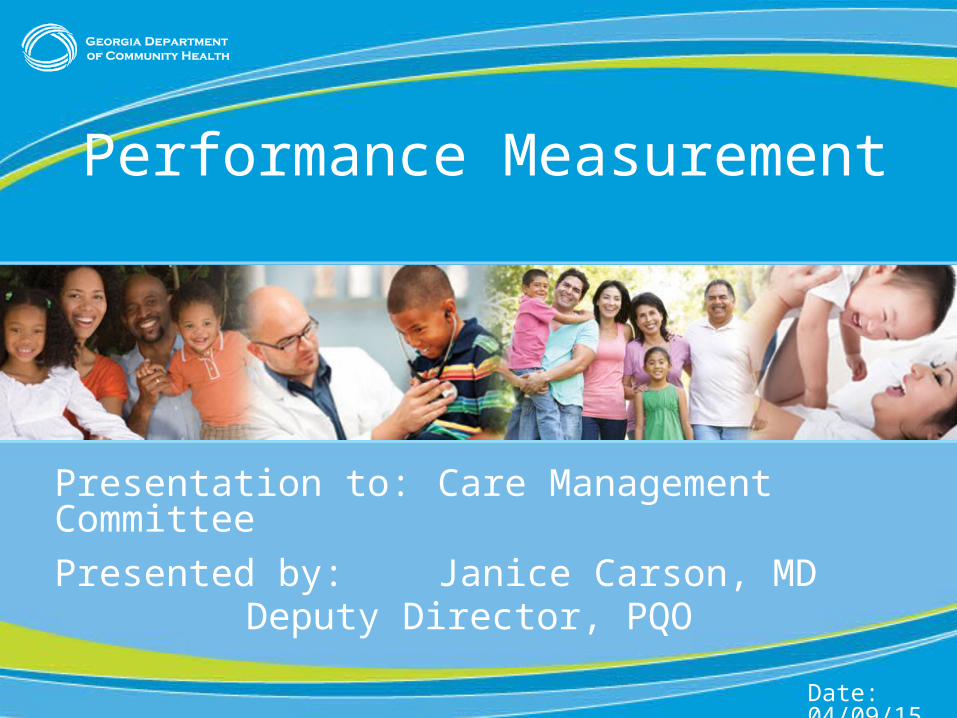
1
Presentation to: Care Management Committee
Presented by: Janice Carson, MDDeputy Director, PQO
Date: 04/09/15
Performance Measurement
2
Mission The mission of the Department of Community Health is to
provide access to affordable, quality health care to Georgians through effective planning, purchasing,
and oversight.
We are dedicated to A Healthy Georgia.
3
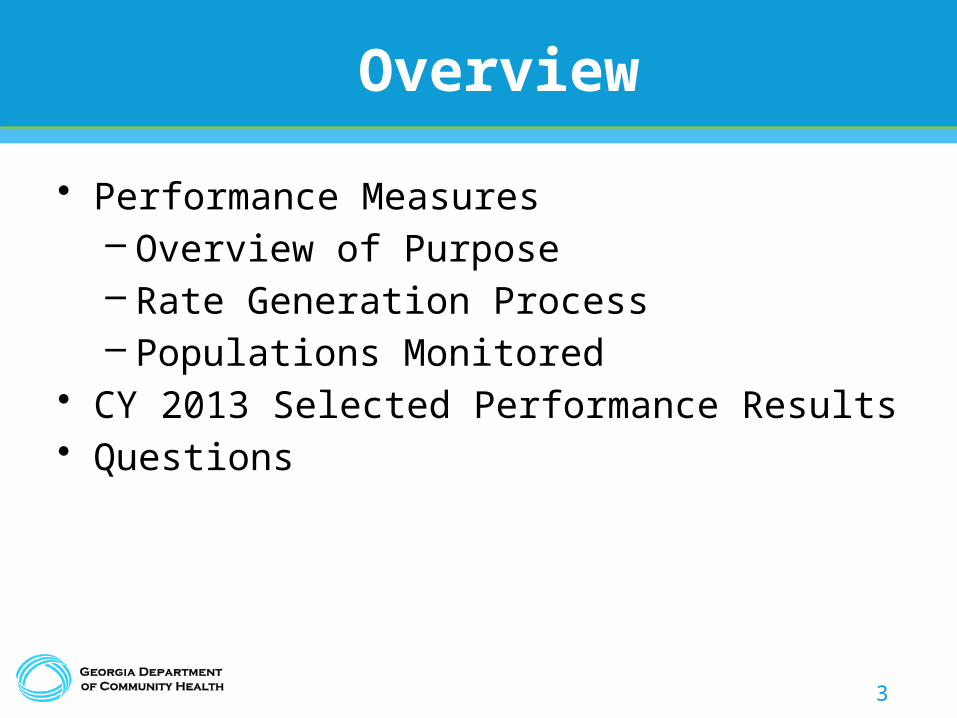
Overview
• Performance Measures– Overview of Purpose– Rate Generation Process– Populations Monitored
• CY 2013 Selected Performance Results • Questions
4
Performance Measures
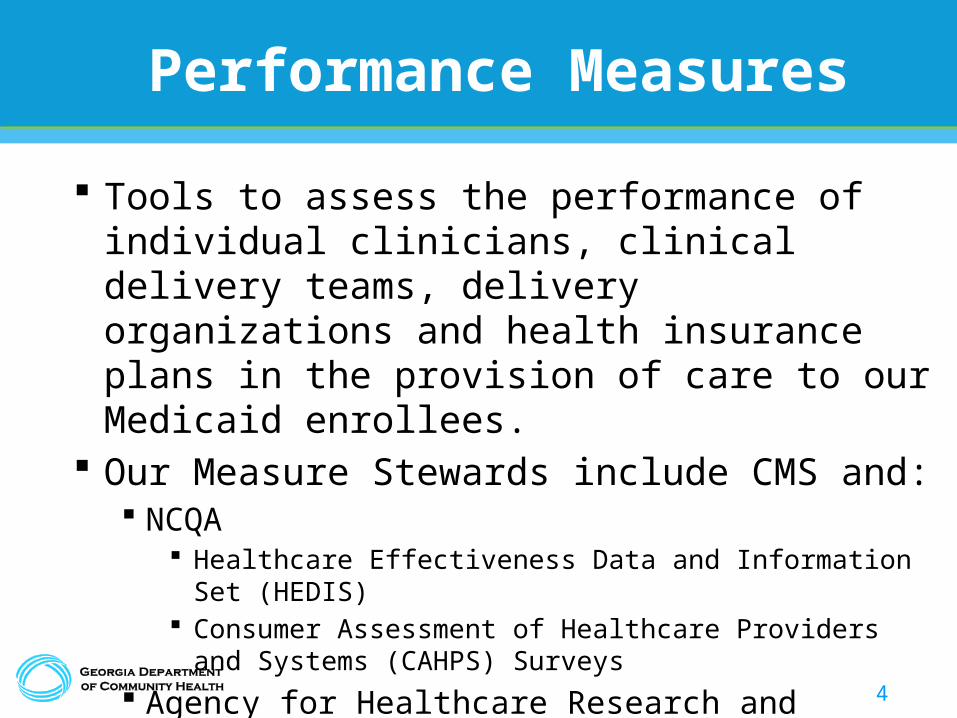
Tools to assess the performance of individual clinicians, clinical delivery teams, delivery organizations and health insurance plans in the provision of care to our Medicaid enrollees.
Our Measure Stewards include CMS and: NCQA
Healthcare Effectiveness Data and Information Set (HEDIS) Consumer Assessment of Healthcare Providers and Systems
(CAHPS) Surveys
Agency for Healthcare Research and Quality (AHRQ) The Joint Commission
5
Performance Measurement
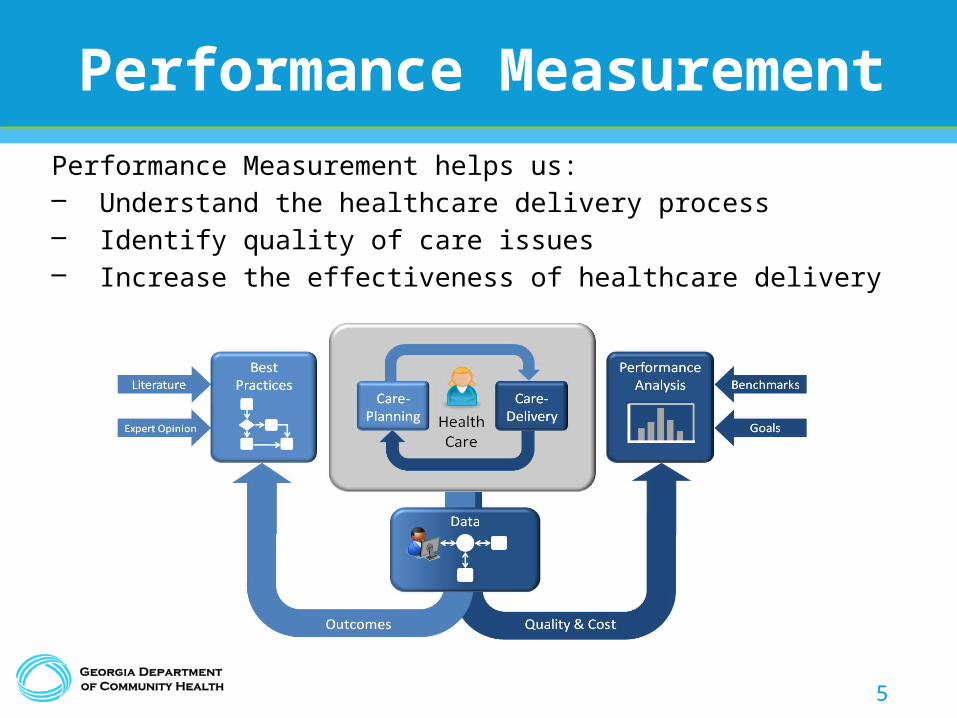
Performance Measurement helps us:– Understand the healthcare delivery process– Identify quality of care issues– Increase the effectiveness of healthcare delivery
6
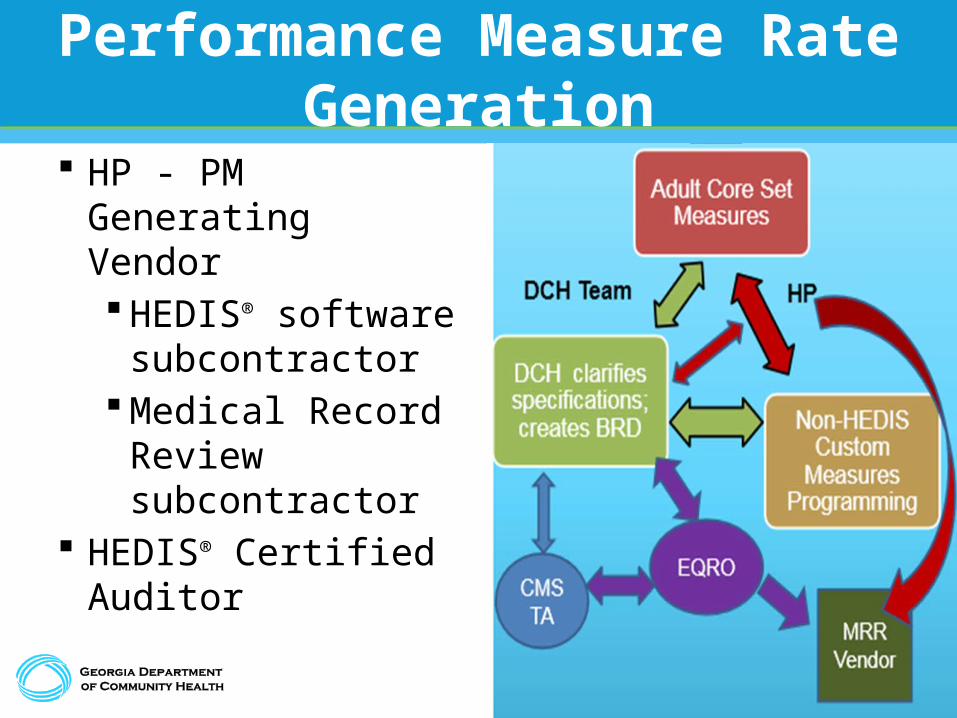
Performance Measure Rate Generation
HP - PM Generating Vendor HEDIS® software
subcontractor Medical Record
Review subcontractor
HEDIS® Certified Auditor
7
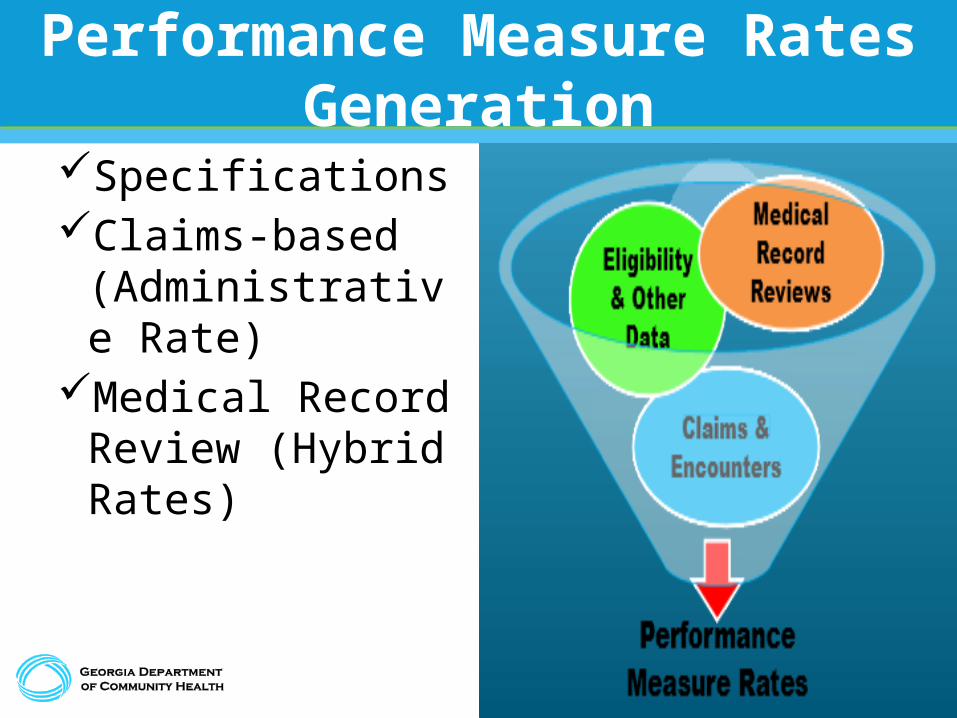
Performance Measure Rates Generation
SpecificationsClaims-based
(Administrative Rate)
Medical Record Review (Hybrid Rates)
8
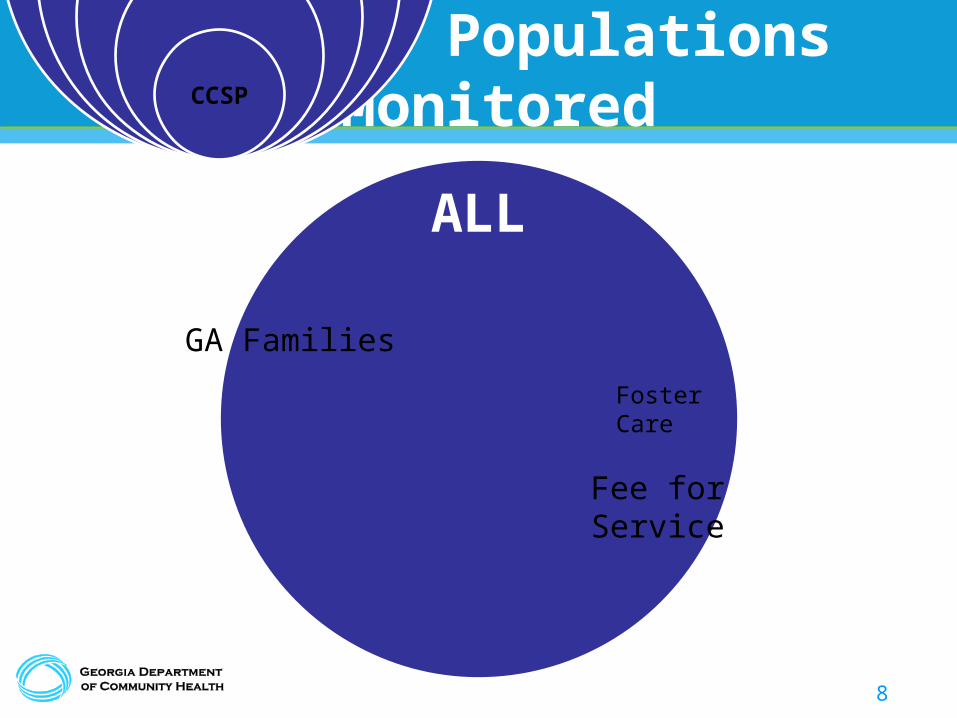
CY 2013 Populations Monitored
ALL
CCSP
Fee for Service
GA Families
FosterCare
9
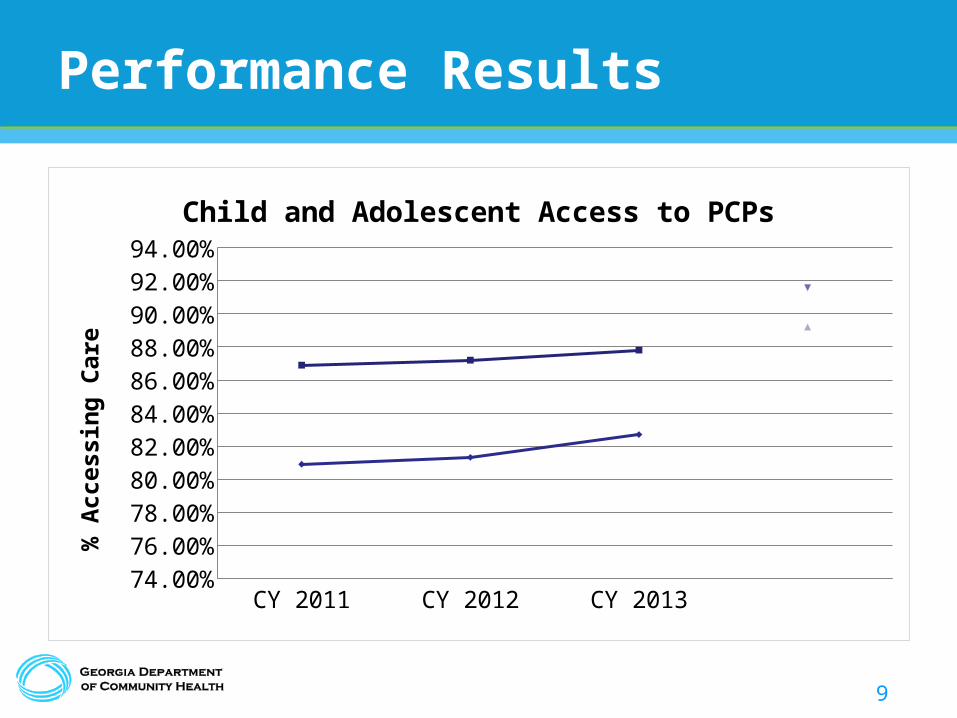
Performance Results
CY 2011
CY 2012
CY 2013
Georgia Families
0.869
0.872
0.8781
FFSState Target
HEDIS 50th %tile 75.00%
77.00%79.00%
Child and Adolescent Access to PCPs
% A
cces
sing
Car
e
10
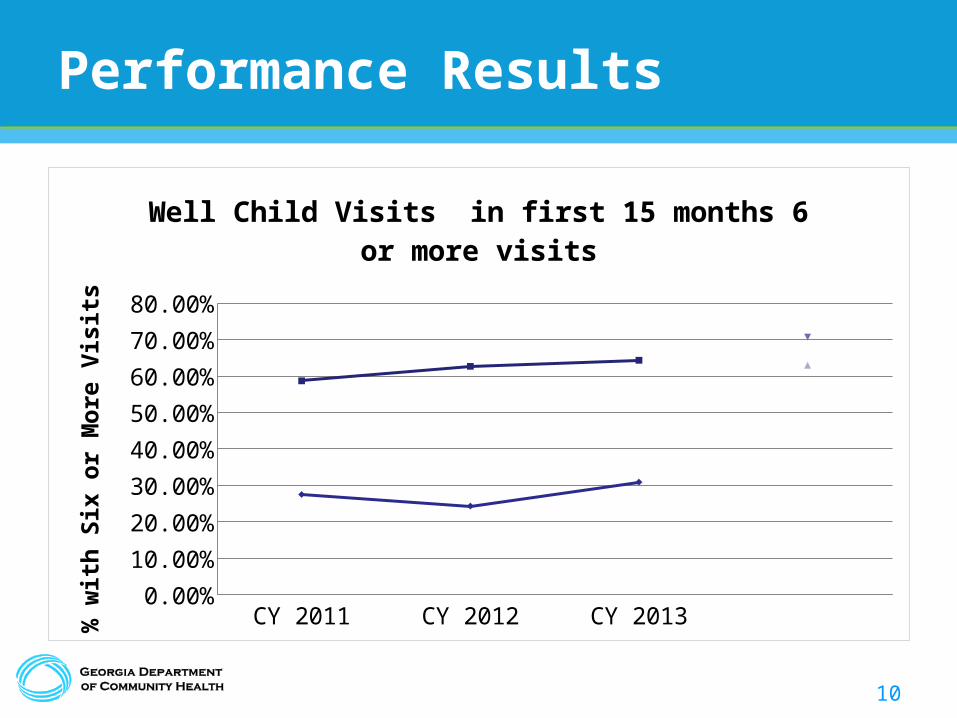
Performance Results
CY 2011
CY 2012
CY 2013
Georgia Families
0.587
0.6266
0.6432
FFSState Target
HEDIS 50th Percentile
5.00%15.00%25.00%
Well Child Visits in first 15 months 6 or more visits
% w
ith S
ix o
r M
ore
Vis
its
11
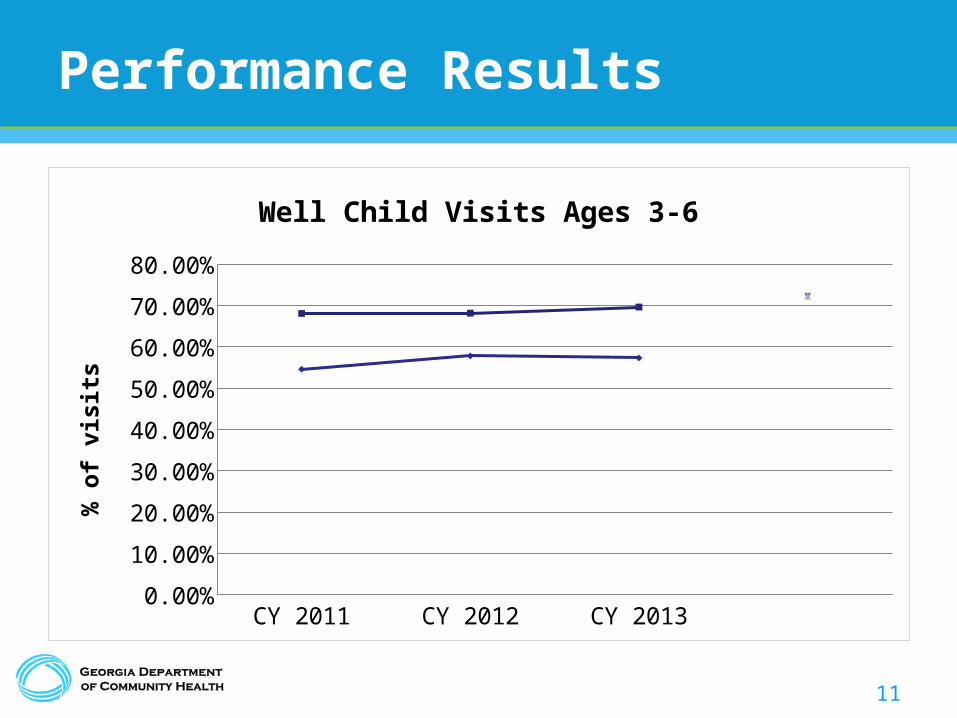
Performance Results
CY 2011
CY 2012
CY 2013
Georgia Families
0.681
0.6817
0.6964
FFSState Target
HEDIS 50th Percentile
5.00%15.00%25.00%
Well Child Visits Ages 3-6
% o
f vis
its
12
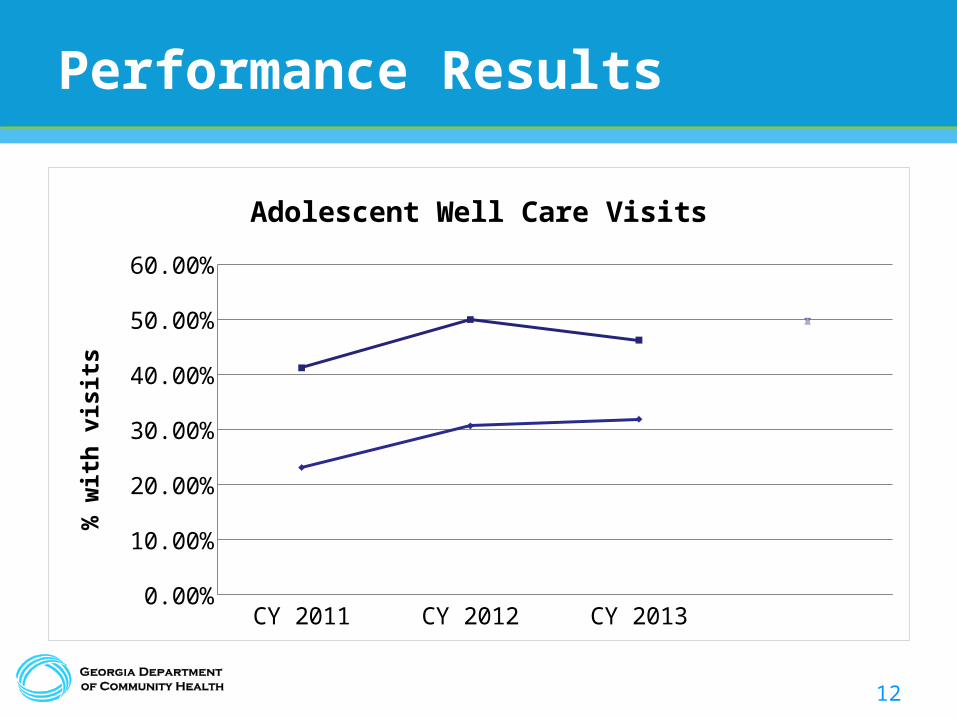
Performance Results
CY 2011
CY 2012
CY 2013
Georgia Families
0.412
0.4997
0.4624
FFSState Target
HEDIS 50th %tile 5.00%
15.00%25.00%
Adolescent Well Care Visits
% w
ith v
isits
13
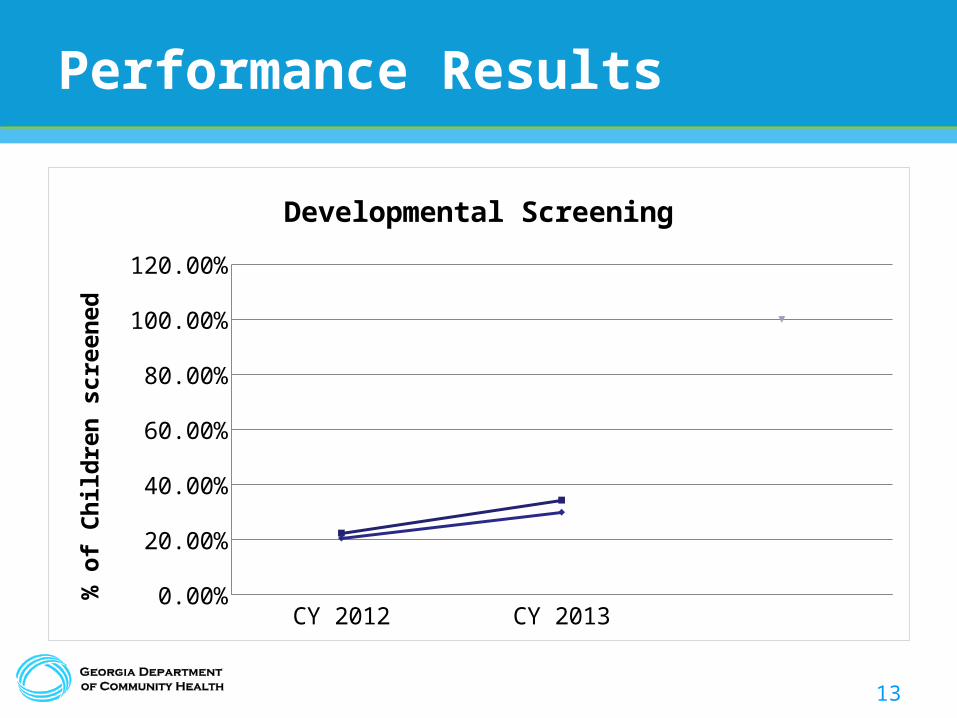
Performance Results
CY 2012
CY 2013
Georgia Families
0.224
0.3436
FFSState Target
10.00%30.00%50.00%
Developmental Screening
% o
f Chi
ldre
n sc
reen
ed
14
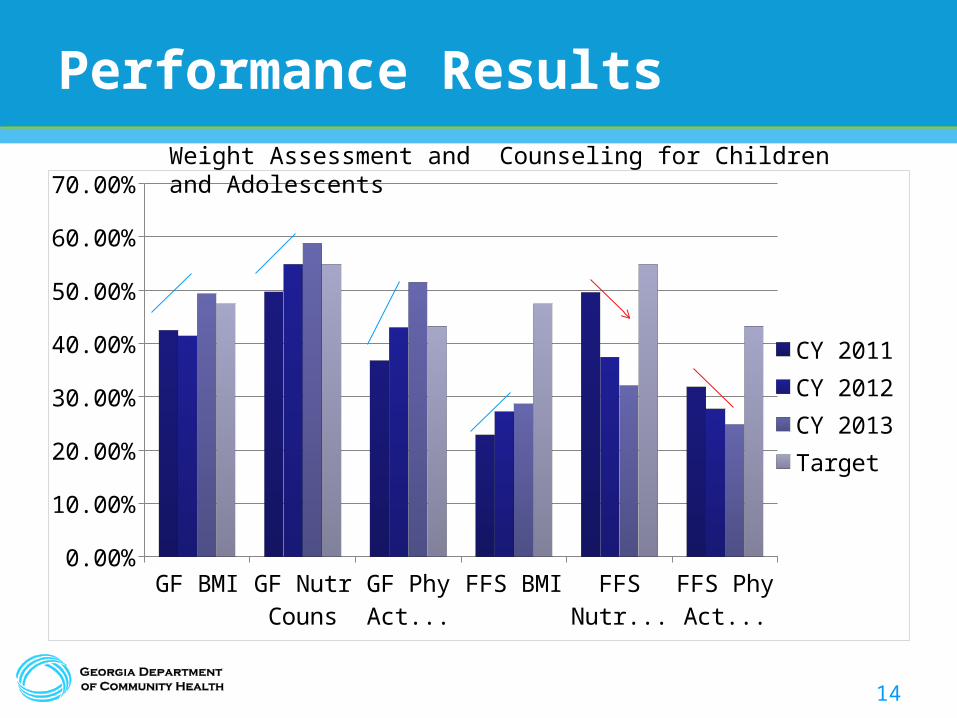
Performance Results
GF BMI GF Nutr Couns
GF Phy Act Couns
FFS BMI FFS Nutr Couns
FFS Phy Act Couns
0.00%
10.00%
20.00%
30.00%
40.00%
50.00%
60.00%
70.00%
CY 2011CY 2012CY 2013Target
Weight Assessment and Counseling for Children and Adolescents
15
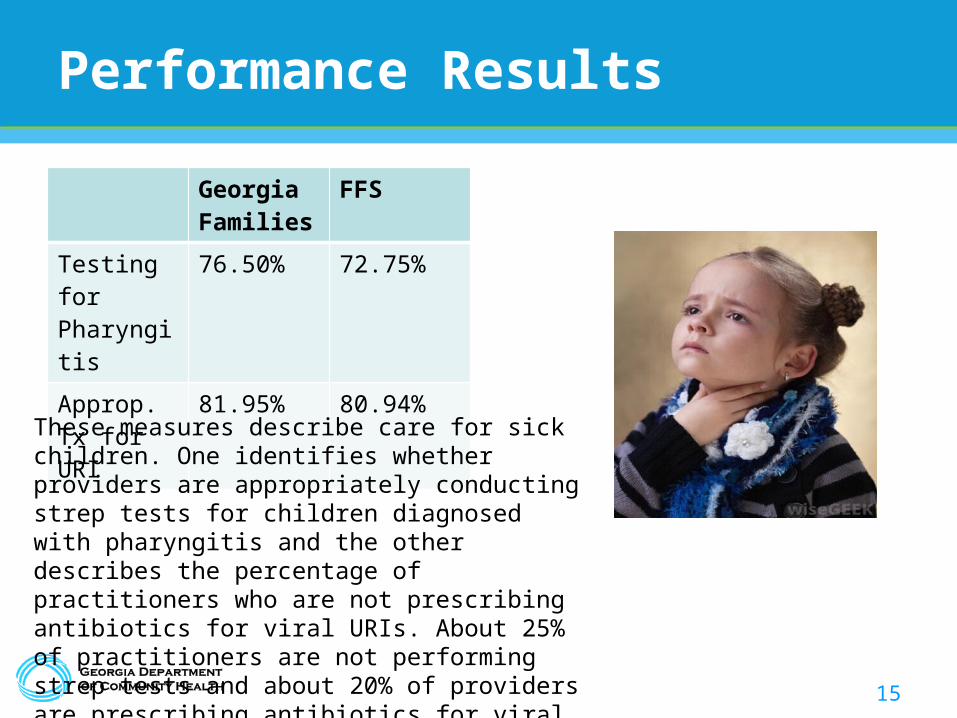
Performance Results
Georgia Families
FFS
Testing for Pharyngitis
76.50% 72.75%
Approp. Tx for URI
81.95% 80.94%
These measures describe care for sick children. One identifies whether providers are appropriately conducting strep tests for children diagnosed with pharyngitis and the other describes the percentage of practitioners who are not prescribing antibiotics for viral URIs. About 25% of practitioners are not performing strep tests and about 20% of providers are prescribing antibiotics for viral URIs.
16
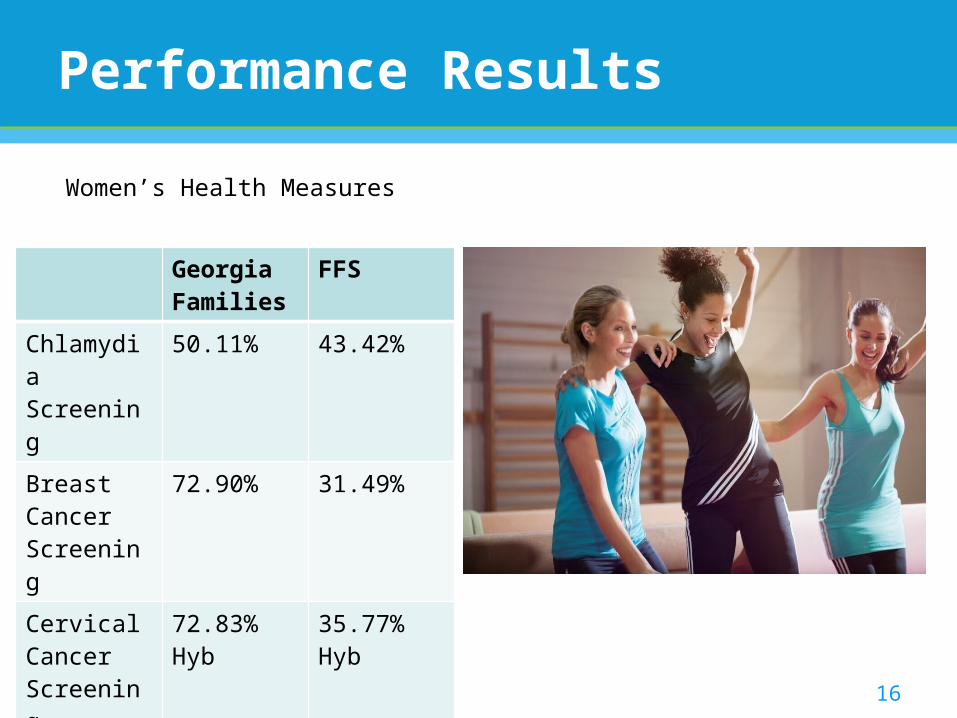
Performance Results
Georgia Families
FFS
Chlamydia Screening
50.11% 43.42%
Breast Cancer Screening
72.90% 31.49%
Cervical Cancer Screening
72.83% Hyb 35.77% Hyb
Women’s Health Measures
17
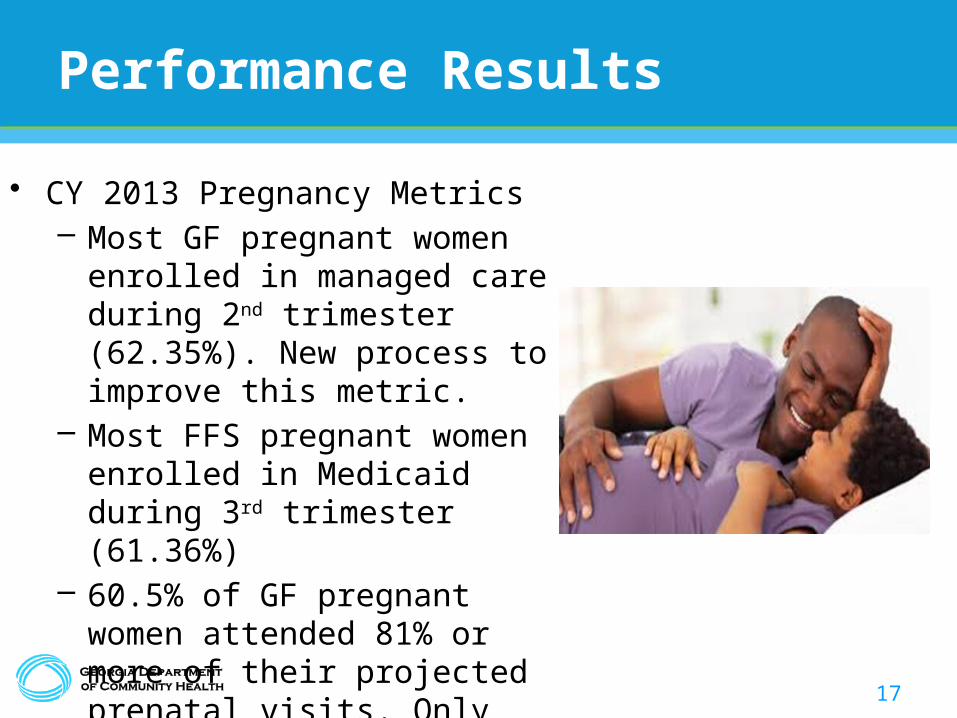
Performance Results
• CY 2013 Pregnancy Metrics– Most GF pregnant women enrolled in
managed care during 2nd trimester (62.35%). New process to improve this metric.
– Most FFS pregnant women enrolled in Medicaid during 3rd trimester (61.36%)
– 60.5% of GF pregnant women attended 81% or more of their projected prenatal visits. Only 28.71% of FFS pregnant women attended 81% or more of their projected prenatal visits.
18
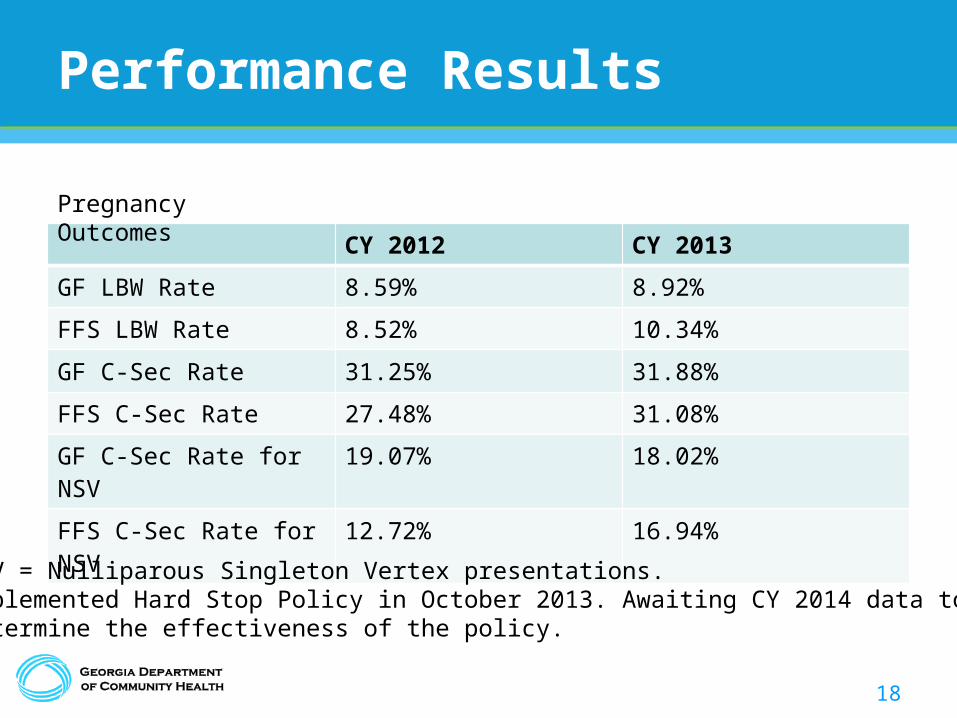
Performance Results
CY 2012 CY 2013
GF LBW Rate 8.59% 8.92%
FFS LBW Rate 8.52% 10.34%
GF C-Sec Rate 31.25% 31.88%
FFS C-Sec Rate 27.48% 31.08%
GF C-Sec Rate for NSV 19.07% 18.02%
FFS C-Sec Rate for NSV 12.72% 16.94%
Pregnancy Outcomes
NSV = Nulliparous Singleton Vertex presentations.Implemented Hard Stop Policy in October 2013. Awaiting CY 2014 data to determine the effectiveness of the policy.
19
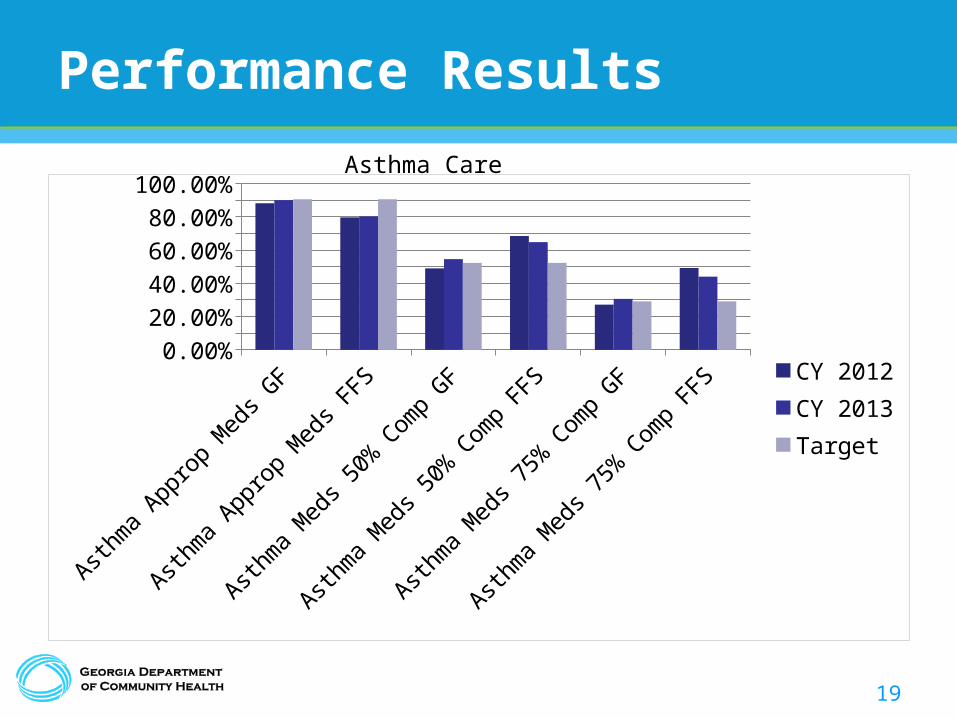
Performance Results
Asthma Approp
Meds GF
Asthma Approp
Meds FFS
Asthma Meds 50% Comp GF
Asthma Meds 50% Comp FFS
Asthma Meds 75% Comp GF
Asthma Meds 75% Comp FFS
0.00%
10.00%
20.00%
30.00%
40.00%
50.00%
60.00%
70.00%
80.00%
90.00%
100.00%
CY 2012CY 2013Target
Asthma Care
20
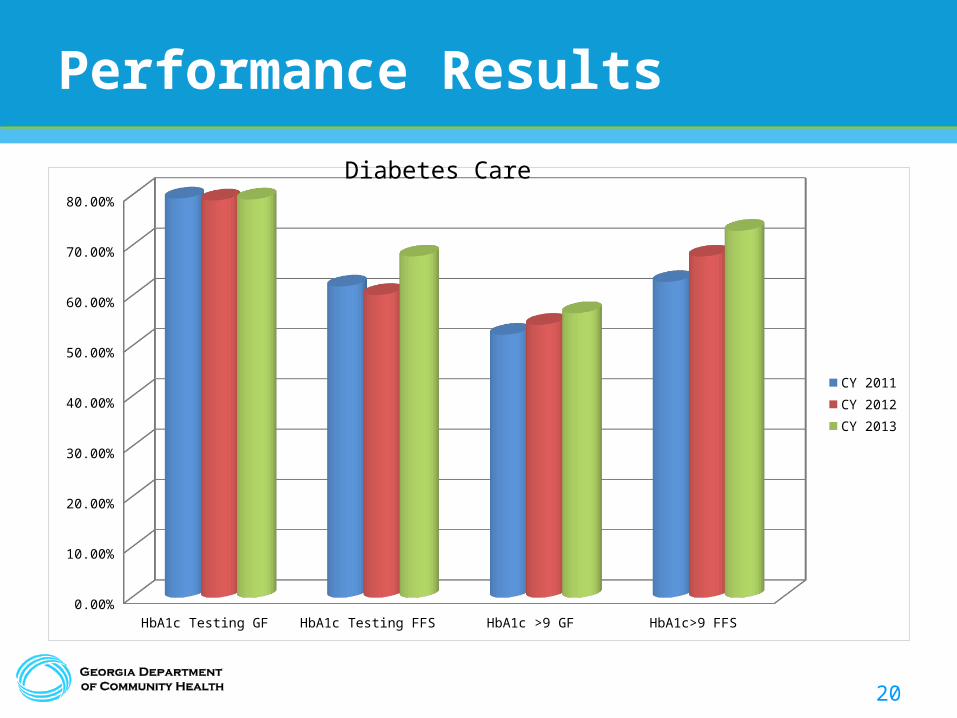
Performance Results
HbA1c Testing GF HbA1c Testing FFS HbA1c >9 GF HbA1c>9 FFS0.00%
10.00%
20.00%
30.00%
40.00%
50.00%
60.00%
70.00%
80.00%
CY 2011CY 2012CY 2013
Diabetes Care
21
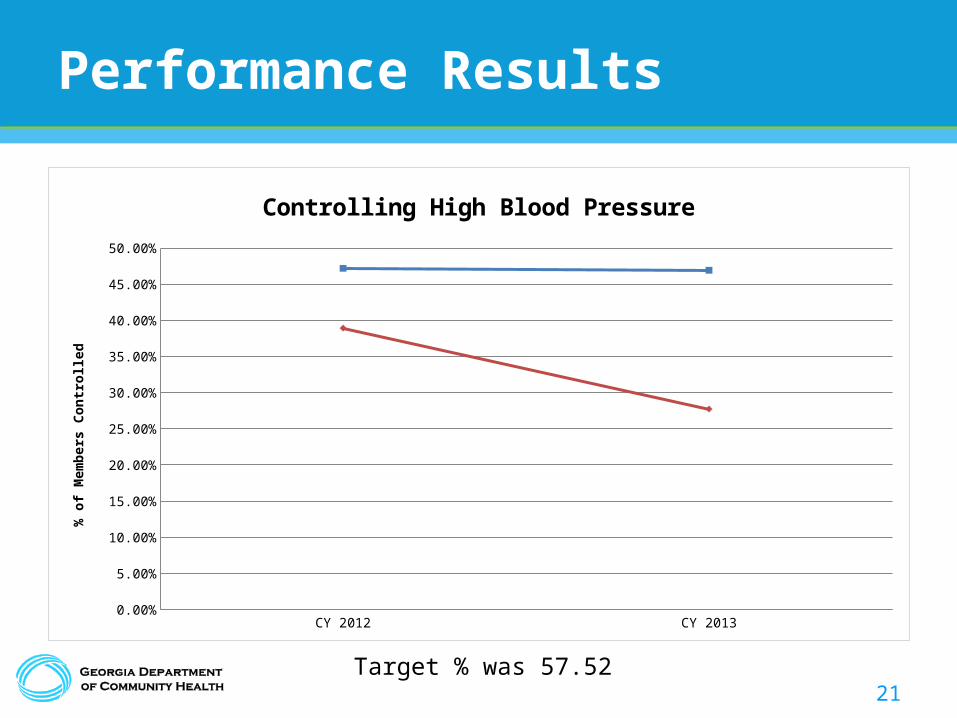
Performance Results
CY 2012 CY 2013
Georgia Families 0.4719 0.4692
FFS 0.3893 0.2774
2.50%
7.50%
12.50%
17.50%
22.50%
27.50%
32.50%
37.50%
42.50%
47.50%
Controlling High Blood Pressure
% o
f Mem
bers
Con
trol
led
Target % was 57.52
22
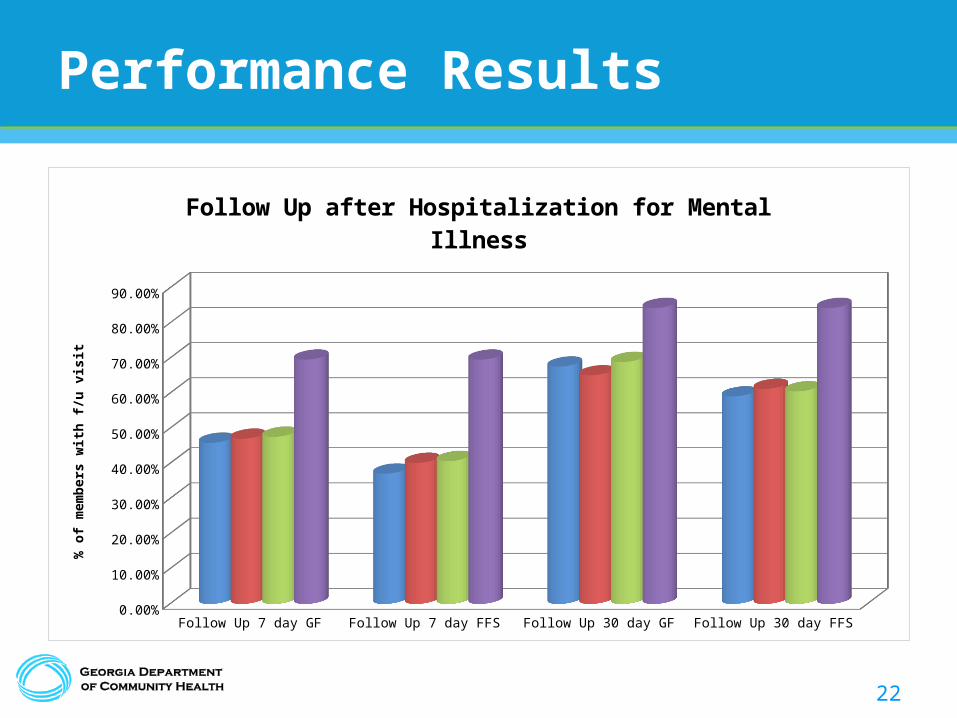
Performance Results
Follow Up 7 day GF Follow Up 7 day FFS Follow Up 30 day GF Follow Up 30 day FFS
CY 2011 0.459 0.371 0.676 0.591
CY 2012 0.4704 0.4017 0.6511 0.6126
CY 2013 0.4759 0.4069 0.6889 0.6054
Target 0.6957 0.6957 0.8428 0.8428
5.00%
15.00%
25.00%
35.00%
45.00%
55.00%
65.00%
75.00%
85.00%
Follow Up after Hospitalization for Mental Illness
% o
f mem
bers
with
f/u
visit
23
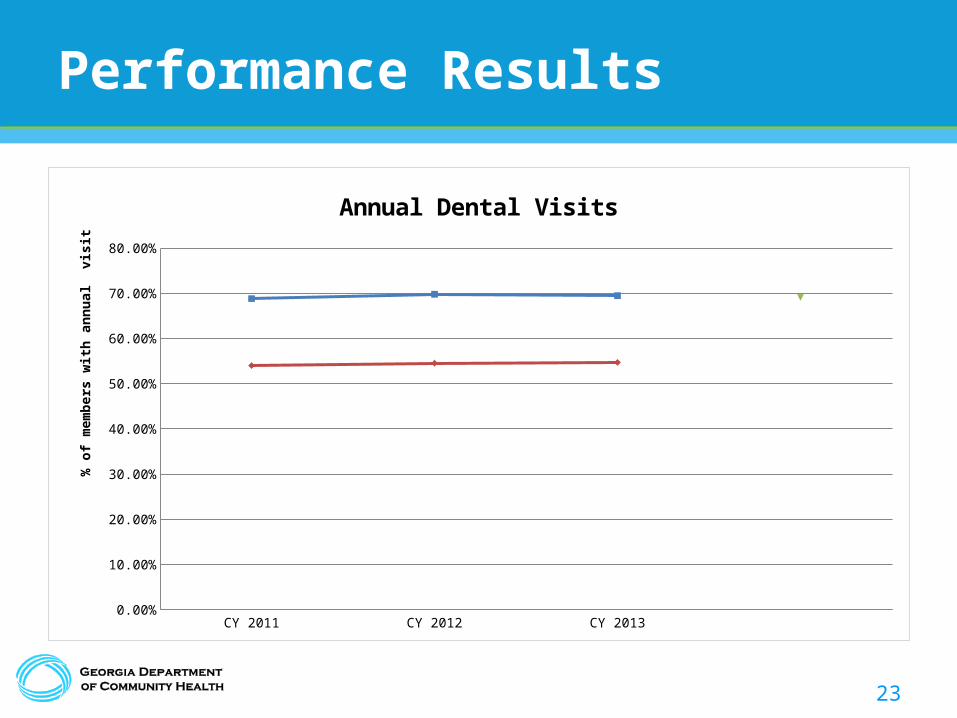
Performance Results
CY 2011
CY 2012
CY 2013
Georgia Families
0.688
0.6977
0.6947
FFSTarget 90th %tile
5.00%
15.00%
25.00%
Annual Dental Visits
% o
f mem
bers
with
ann
ual
visit
24
Performance Results
• In CY 2013: – Alcohol and other drug dependence - 35.62% of GF members with a new
episode of alcohol and other drug dependence initiated treatment within 14 days of diagnosis through an inpatient admission, outpatient visit, intensive outpatient encounter or partial hospitalization. Only 7.65% who initiated treatment had two or more additional services within 30 days of the initiation visit. FFS members, 40.15% initiated treatment but only 4.72% had two or more additional services within 30 days of initiation.
– ADHD - 35.74% of GF 6 – 12 year olds newly prescribed treatment for ADHD came back for an appt within 30 days of their new prescription and 48.76% of those who remained on treatment for at least 7 months had at least two follow up visits within 9 months after the initiation phase ended. FFS - 33.58% came back in 30 days and 45.32% who remained on treatment at least 7 months had two follow up visits within 9 months after the initiation phase.
25
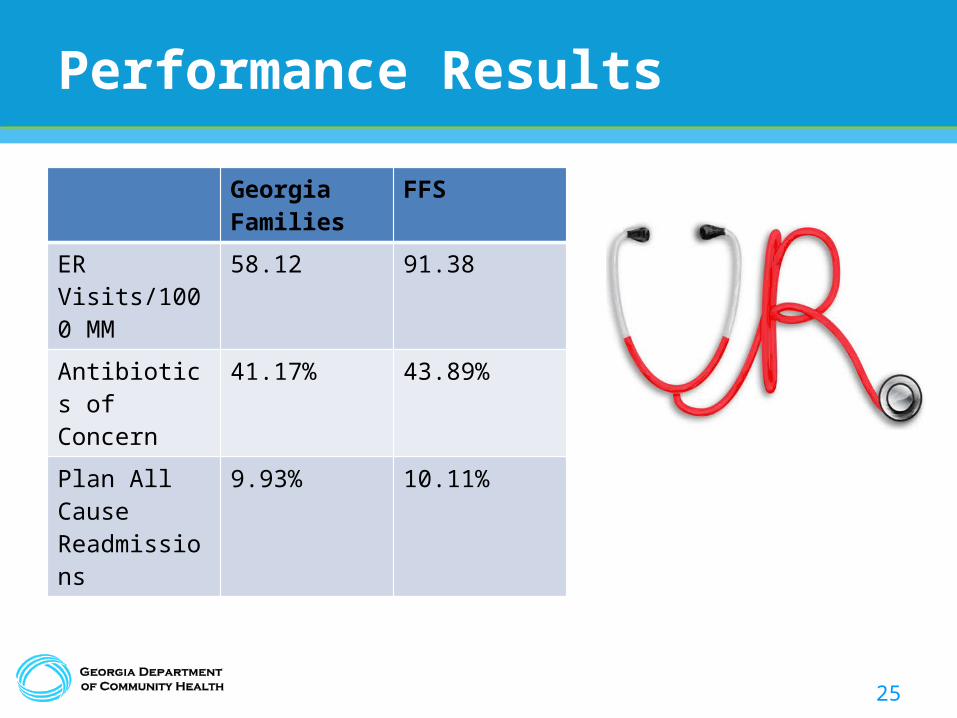
Performance Results
Georgia Families
FFS
ER Visits/1000 MM
58.12 91.38
Antibiotics of Concern
41.17% 43.89%
Plan All Cause Readmissions
9.93% 10.11%
26
Questions