Embed Size (px)
Citation preview
Presentation overview
Introduction and Key Objectives – Brian Ray
Historical Overview of Highway Geometric Design – Brian Ray
AASHTO and TRB Strategic Research Objectives – Hermanus Steyn
NCHRP Report 785 Overview and Application – Julia Knudsen and Hermanus Steyn
NCHRP Report 839 Overview – Rich Coakley
Questions and Discussion – Dr. John Mason
1
Introduction and Key Objectives Two significant steps in advancing the profession’s
approach to multimodal geometric design – NCHRP Report 785, Performance-Based Analysis of Geometric
Design of Highways and Streets
• Provides an approach to incorporate performance-based analysis into the project development process.
– NCHRP Report 839, Developing an Improved Highway Geometric Design Process
• Developed a comprehensive, flexible design process.
• Update to AASHTO's Guidelines for Geometric Design of Very Low-Volume Roads.
…Allowing professionals to adapt to any project context
2
Historical Overview of Highway Geometric Design What are the origins of “standards”?
What are “standards”?
Recent National Funding Acts
3
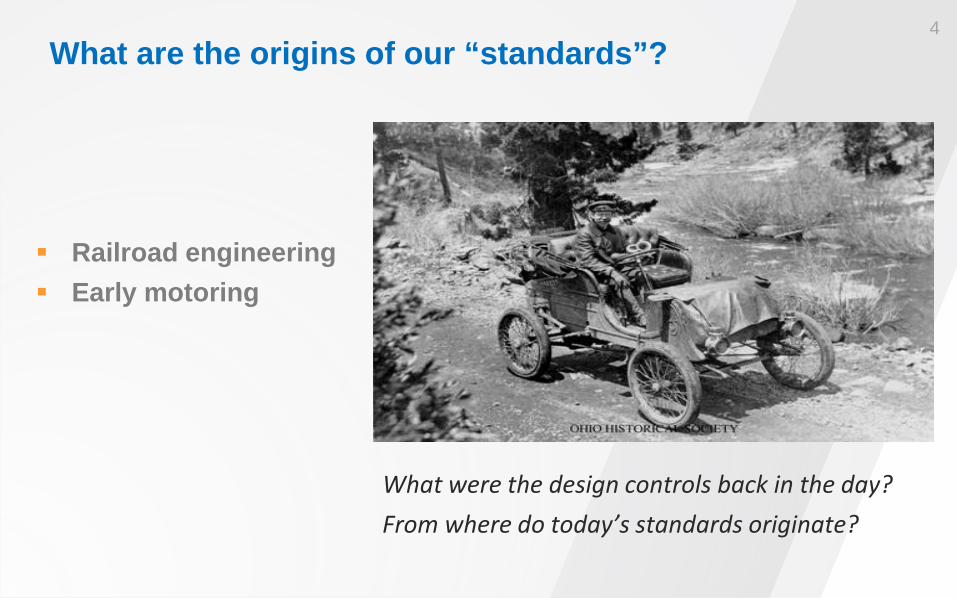
What are the origins of our “standards”?
Railroad engineering Early motoring
What were the design controls back in the day? From where do today’s standards originate?
4

What are “standards”?
Uniform approaches to provide consistency in design
Methods to match criteria to similar design environments
Representative approaches that represent the standards of care of our profession
Anything else?
5

What are “standards”?
“Standards” have become safety surrogates Are the following true? If it meets standards it must be safe If it doesn’t meet standards it is not safe If there is no standard for it, it must not be allowable If a design exception is needed it must be “bad” If we meet standards, we won’t be sued
…but what is the research behind our standards?
6
What are the origins of our “standards”? Late 1930s and 1940 -- Bureau of Public Roads and AASHO
Looking for uniformity on roadway designs
No research done to establish “standards of care”
A synthesis of practical knowledge to address issues – i.e., Physics to cover vehicles in motion on a curve
“Pamphlets” based on consensus of the practice
Compiled in a 3 ring notebooks
…These were combined to form “policies” based on committee’s, agency leader’s, and professional’s consensus of the practice
7
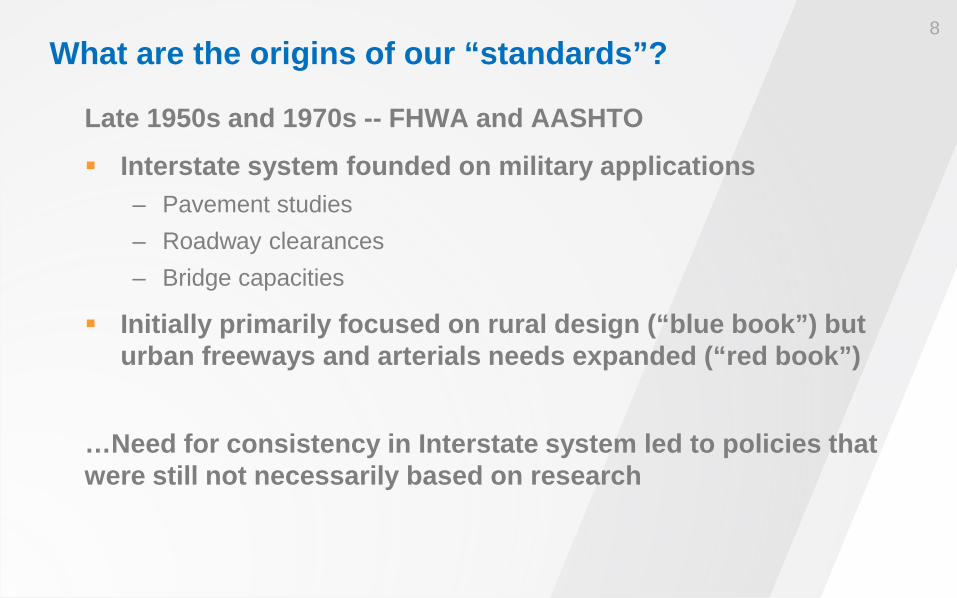
What are the origins of our “standards”?
Late 1950s and 1970s -- FHWA and AASHTO
Interstate system founded on military applications – Pavement studies – Roadway clearances – Bridge capacities
Initially primarily focused on rural design (“blue book”) but urban freeways and arterials needs expanded (“red book”)
…Need for consistency in Interstate system led to policies that were still not necessarily based on research
8
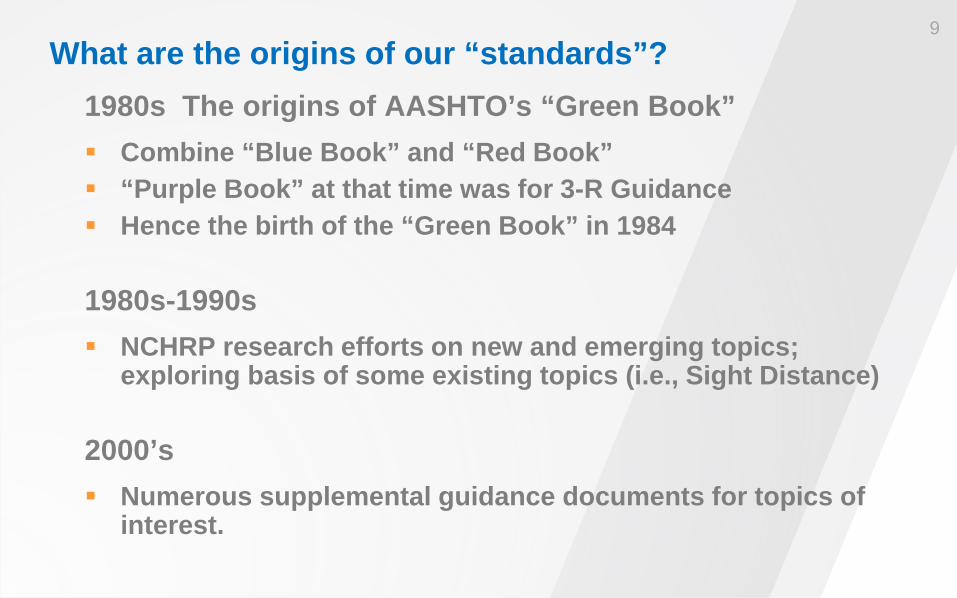
What are the origins of our “standards”? 1980s The origins of AASHTO’s “Green Book” Combine “Blue Book” and “Red Book” “Purple Book” at that time was for 3-R Guidance Hence the birth of the “Green Book” in 1984
1980s-1990s NCHRP research efforts on new and emerging topics;
exploring basis of some existing topics (i.e., Sight Distance)
2000’s Numerous supplemental guidance documents for topics of
interest.
9
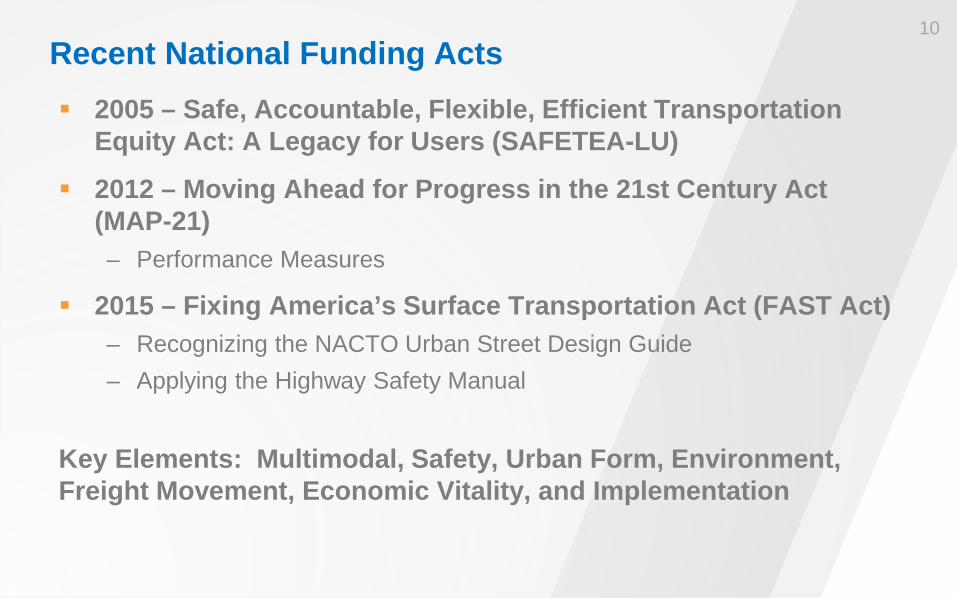
Recent National Funding Acts 2005 – Safe, Accountable, Flexible, Efficient Transportation
Equity Act: A Legacy for Users (SAFETEA-LU)
2012 – Moving Ahead for Progress in the 21st Century Act (MAP-21) – Performance Measures
2015 – Fixing America’s Surface Transportation Act (FAST Act) – Recognizing the NACTO Urban Street Design Guide – Applying the Highway Safety Manual
Key Elements: Multimodal, Safety, Urban Form, Environment, Freight Movement, Economic Vitality, and Implementation
10
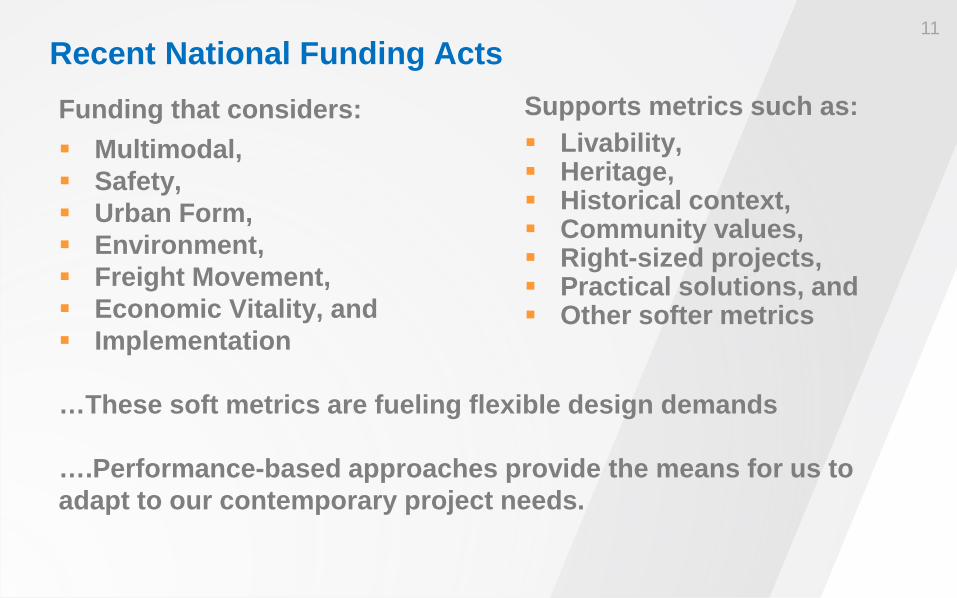
Recent National Funding Acts Funding that considers: Multimodal, Safety, Urban Form, Environment, Freight Movement, Economic Vitality, and Implementation …These soft metrics are fueling flexible design demands ….Performance-based approaches provide the means for us to adapt to our contemporary project needs.
11
Supports metrics such as: Livability, Heritage, Historical context, Community values, Right-sized projects, Practical solutions, and Other softer metrics
Presentation overview
Introduction and Key Objectives
Historical Overview of Highway Geometric Design
AASHTO and TRB Strategic Research Objectives – Hermanus Steyn
NCHRP Report 785 Overview and Application
NCHRP Report 839 Overview
Questions and Discussion
12
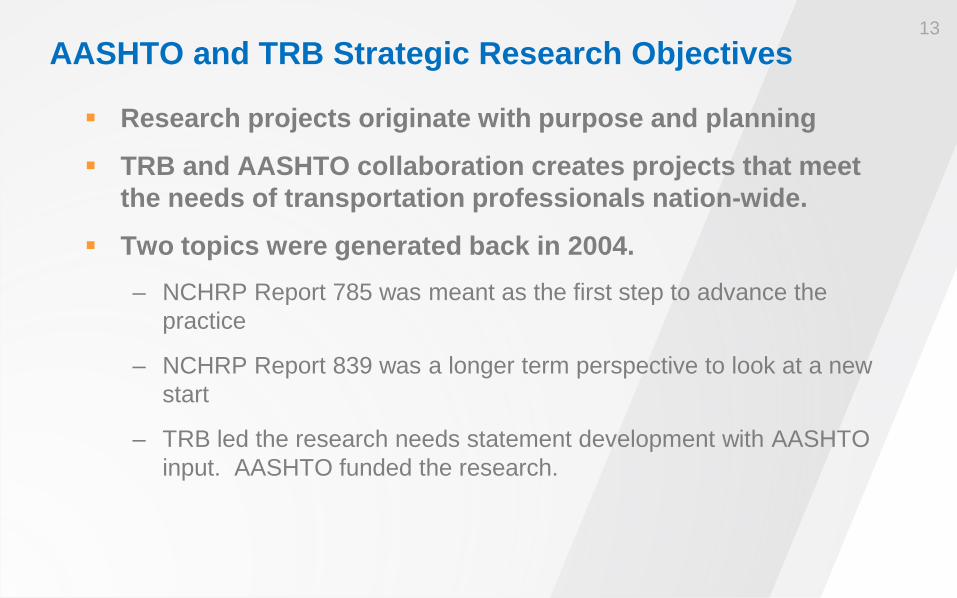
AASHTO and TRB Strategic Research Objectives Research projects originate with purpose and planning
TRB and AASHTO collaboration creates projects that meet the needs of transportation professionals nation-wide.
Two topics were generated back in 2004. – NCHRP Report 785 was meant as the first step to advance the
practice
– NCHRP Report 839 was a longer term perspective to look at a new start
– TRB led the research needs statement development with AASHTO input. AASHTO funded the research.
13
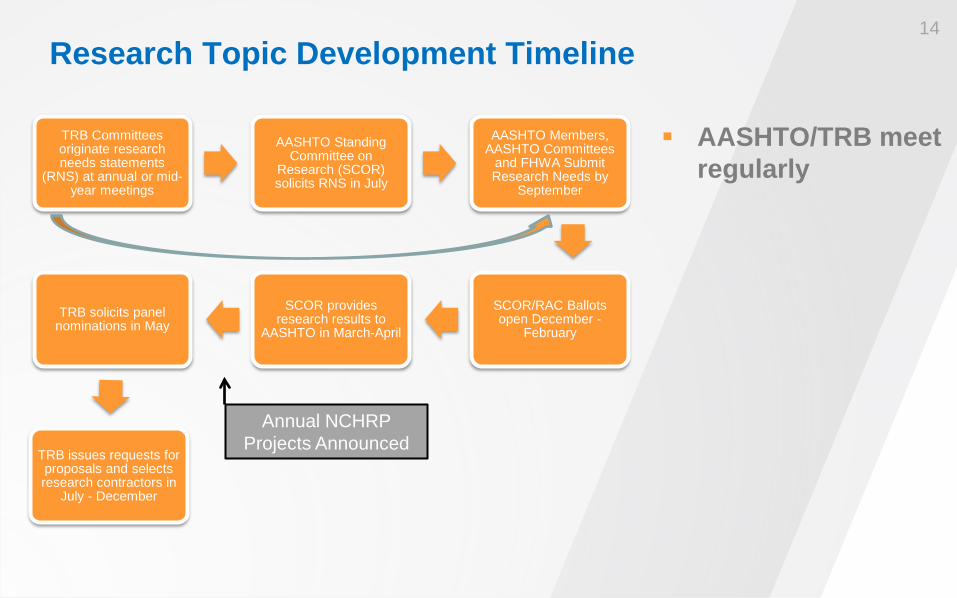
Research Topic Development Timeline
TRB Committees originate research needs statements
(RNS) at annual or mid-year meetings
AASHTO Standing Committee on
Research (SCOR) solicits RNS in July
AASHTO Members, AASHTO Committees
and FHWA Submit Research Needs by
September
SCOR/RAC Ballots open December -
February
SCOR provides research results to
AASHTO in March-April TRB solicits panel
nominations in May
TRB issues requests for proposals and selects research contractors in
July - December
Annual NCHRP Projects Announced
AASHTO/TRB meet regularly
14
Presentation overview
Introduction and Key Objectives
Historical Overview of Highway Geometric Design
AASHTO and TRB Strategic Research Objectives
NCHRP Report 785 Overview and Application – Julia Knudsen
NCHRP Report 839 Overview
Questions and Discussion
15
NCHRP Report 785
Chapter 1 – Introduction
Chapter 2 – Overview
Chapter 3 – Identify Project Outcomes
Chapter 4 – Geometric Design Elements
Chapter 5 – Process Framework
Chapter 6 – Project Examples
16
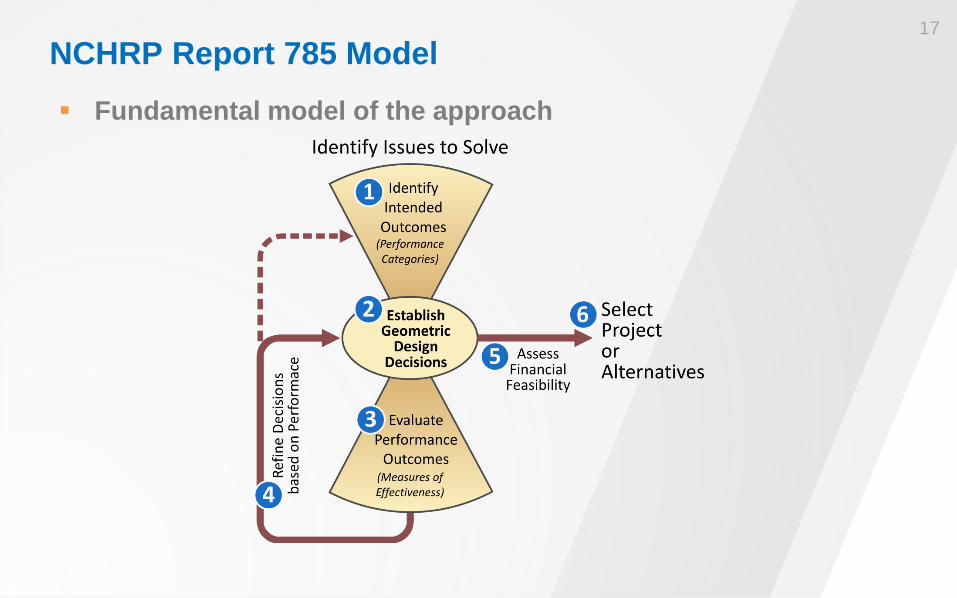
NCHRP Report 785 Model Fundamental model of the approach
17
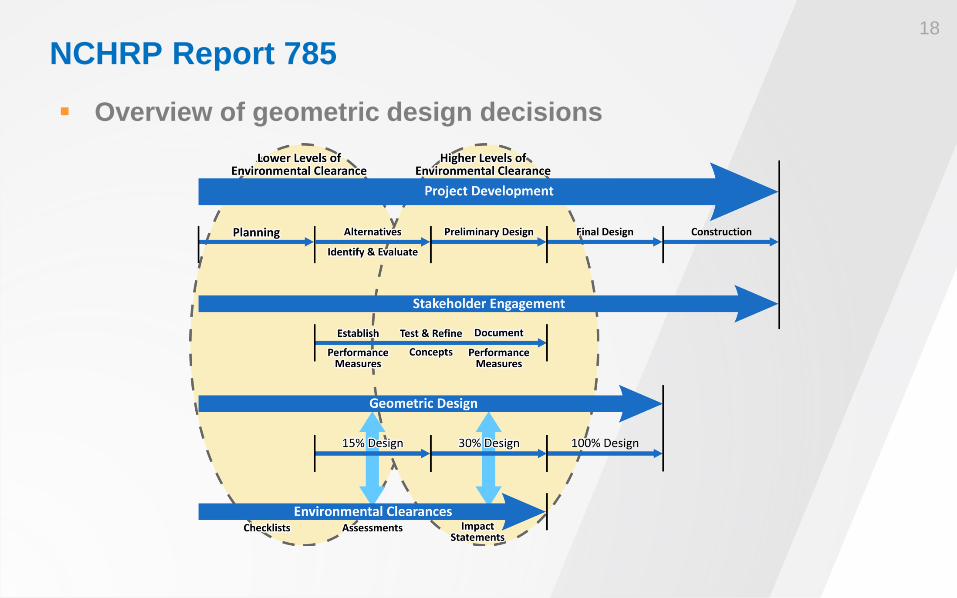
NCHRP Report 785
Overview of geometric design decisions
18
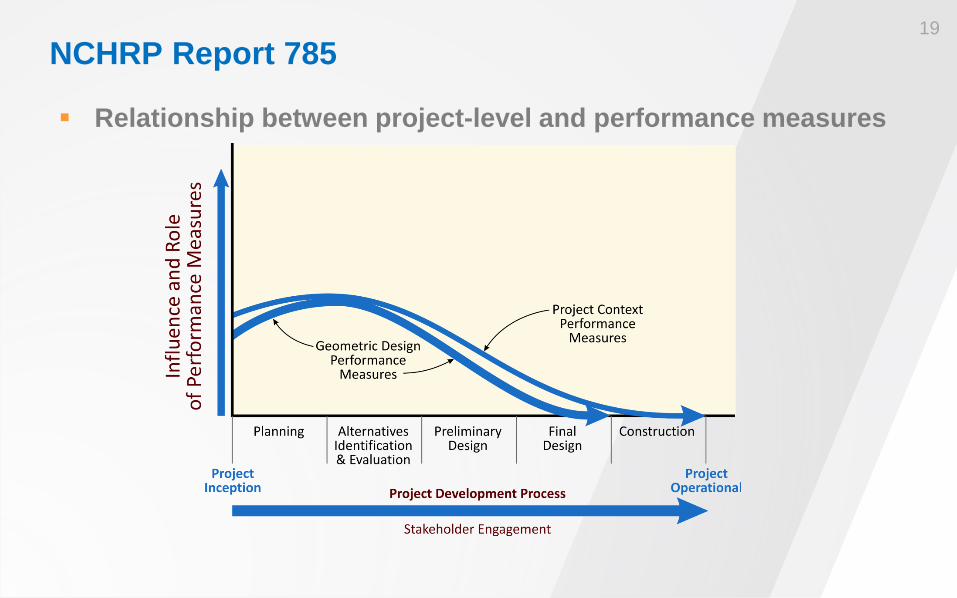
NCHRP Report 785
Relationship between project-level and performance measures
19
Chapter 3 – Identify Project Outcomes
Fundamentally: Whom are we serving? – Whom are we serving?
• Identifying the key road users and stakeholders for a given project and project context
– What are we trying to achieve? • Identifying and articulating the core desired outcomes from the
project
Establishing project context—Users and Performance
20
Chapter 3 – Identify Project Outcomes
Geometric Design Performance Categories – Accessibility
• Ability to approach a desired destination or potential opportunity for activity using highways and streets (including the sidewalks and/or bicycle lanes).
– Mobility • Ability to move various users efficiently from one place to another using
highways and streets. – Quality of Service
• Perceived quality of travel by a road user. – Reliability
• Consistency of performance over a series of time periods. – Safety
• Expected frequency and severity of crashes occurring on highways and streets.
21
Chapter 3 – Identify Project Outcomes
Geometric Design Decisions – Consider overall intended project outcomes, project performance,
and transportation performance. • How do the features influence performance measures related to
accessibility, mobility, quality of service, reliability, and safety?
– May have incremental and cumulative effects
– Discrete choices may impact broader concepts • Sustainability, economic competitiveness, or livability
– Identifying project design controls • Leads to appropriate design criteria to meet those design control
needs
22
Chapter 4 – Geometric Design Elements
Introduction – Summarize critical or high priority known relationships between
design elements and performance
– Document the general relationship
– Identify possibly performance trade-offs
– Present resources and tools that can be used
This information can be expanded with future research
23
Chapter 4 – Geometric Design Elements
Expected relationships between geometric design elements and performance categories – Segments – Nodes – Intersections and Interchanges
● = expected direct effect
□ = expected indirect effect
-- = expected not to have an effect
* = relationship can be directly estimated by existing performance prediction tools
◊ = relationship can be indirectly estimated using more than one existing tool
x = relationship cannot be estimated by existing tools
24
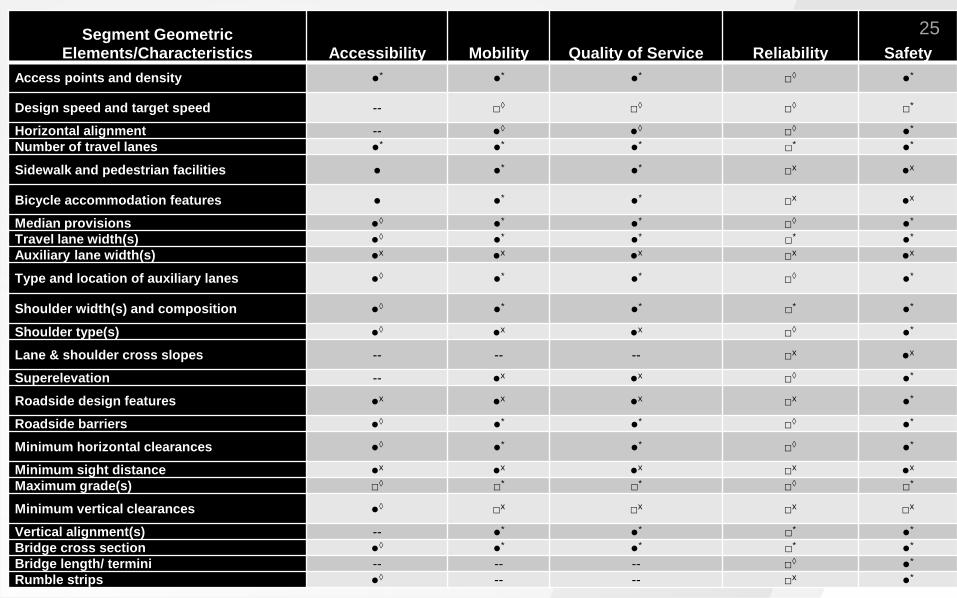
Chapter 4 – Geometric Design Elements Segments
Segment Geometric Elements/Characteristics Accessibility Mobility Quality of Service Reliability Safety
Access points and density ●* ●* ●* □◊ ●*
Design speed and target speed -- □◊ □◊ □◊ □*
Horizontal alignment -- ●◊ ●◊ □◊ ●* Number of travel lanes ●* ●* ●* □* ●*
Sidewalk and pedestrian facilities ● ●* ●* □x ●x
Bicycle accommodation features ● ●* ●* □x ●x
Median provisions ●◊ ●* ●* □◊ ●* Travel lane width(s) ●◊ ●* ●* □* ●* Auxiliary lane width(s) ●x ●x ●x □x ●x
Type and location of auxiliary lanes ●◊ ●* ●* □◊ ●*
Shoulder width(s) and composition ●◊ ●* ●* □* ●*
Shoulder type(s) ●◊ ●x ●x □◊ ●*
Lane & shoulder cross slopes -- -- -- □x ●x
Superelevation -- ●x ●x □◊ ●*
Roadside design features ●x ●x ●x □x ●*
Roadside barriers ●◊ ●* ●* □◊ ●*
Minimum horizontal clearances ●◊ ●* ●* □◊ ●*
Minimum sight distance ●x ●x ●x □x ●x Maximum grade(s) □◊ □* □* □◊ □*
Minimum vertical clearances ●◊ □x □x □x □x
Vertical alignment(s) -- ●* ●* □* ●* Bridge cross section ●◊ ●* ●* □* ●* Bridge length/ termini -- -- -- □◊ ●* Rumble strips ●◊ -- -- □x ●*
25
Chapter 4 – Geometric Design Elements
Tables summarize the design elements/decisions and their relationship to performance measures from each of the transportation performance categories:
– Accessibility
– Mobility
– Quality of Service
– Reliability
– Safety
For example: Accessibility
26
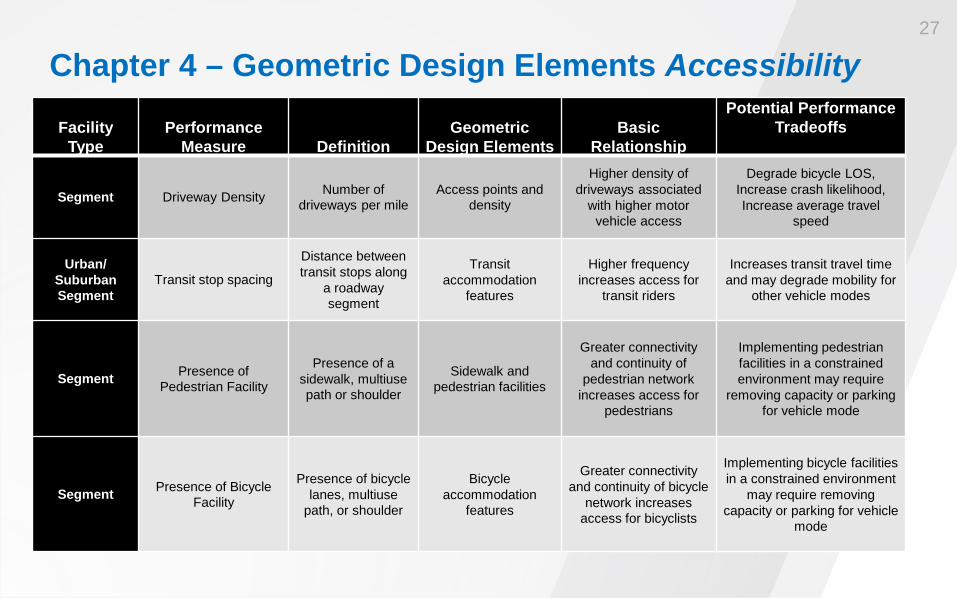
Chapter 4 – Geometric Design Elements Accessibility
Facility Type
Performance Measure Definition
Geometric Design Elements
Basic Relationship
Potential Performance Tradeoffs
Segment Driveway Density Number of driveways per mile
Access points and density
Higher density of driveways associated
with higher motor vehicle access
Degrade bicycle LOS, Increase crash likelihood, Increase average travel
speed
Urban/ Suburban Segment
Transit stop spacing
Distance between transit stops along
a roadway segment
Transit accommodation
features
Higher frequency increases access for
transit riders
Increases transit travel time and may degrade mobility for
other vehicle modes
Segment Presence of Pedestrian Facility
Presence of a sidewalk, multiuse path or shoulder
Sidewalk and pedestrian facilities
Greater connectivity and continuity of
pedestrian network increases access for
pedestrians
Implementing pedestrian facilities in a constrained environment may require
removing capacity or parking for vehicle mode
Segment Presence of Bicycle Facility
Presence of bicycle lanes, multiuse
path, or shoulder
Bicycle accommodation
features
Greater connectivity and continuity of bicycle
network increases access for bicyclists
Implementing bicycle facilities in a constrained environment
may require removing capacity or parking for vehicle
mode
27
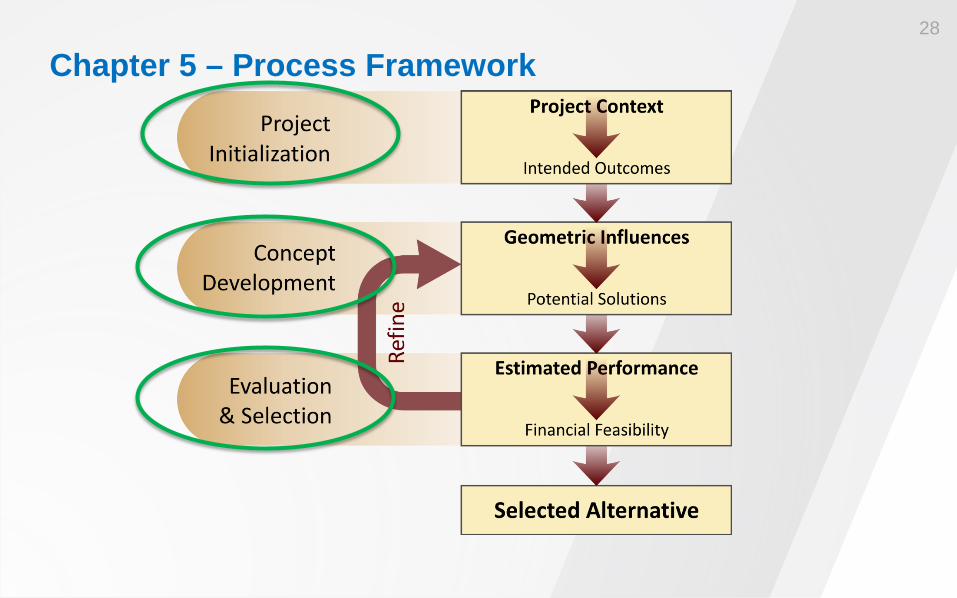
Chapter 5 – Process Framework 28
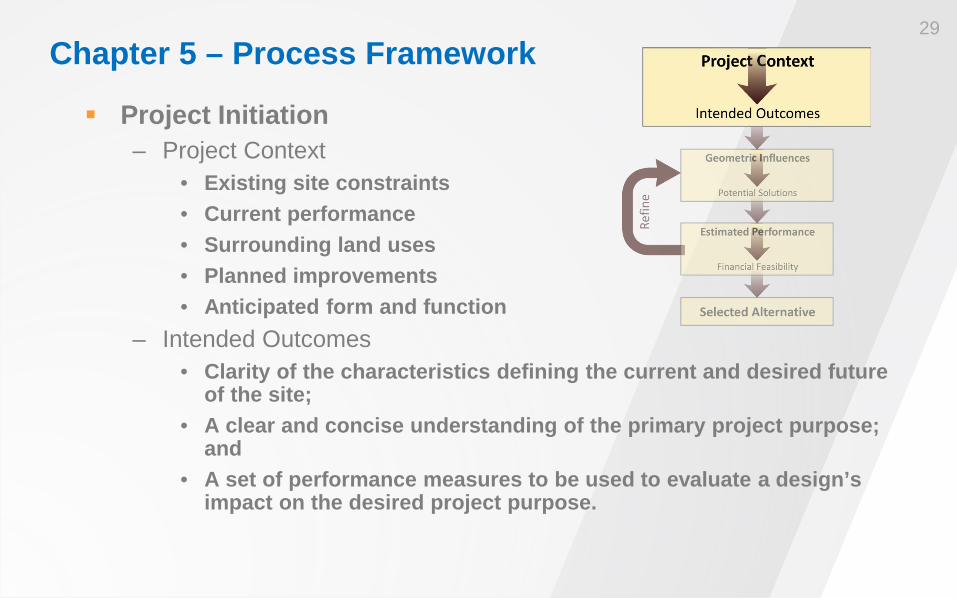
Chapter 5 – Process Framework
Project Initiation – Project Context
• Existing site constraints • Current performance • Surrounding land uses • Planned improvements • Anticipated form and function
– Intended Outcomes • Clarity of the characteristics defining the current and desired future
of the site; • A clear and concise understanding of the primary project purpose;
and • A set of performance measures to be used to evaluate a design’s
impact on the desired project purpose.
29
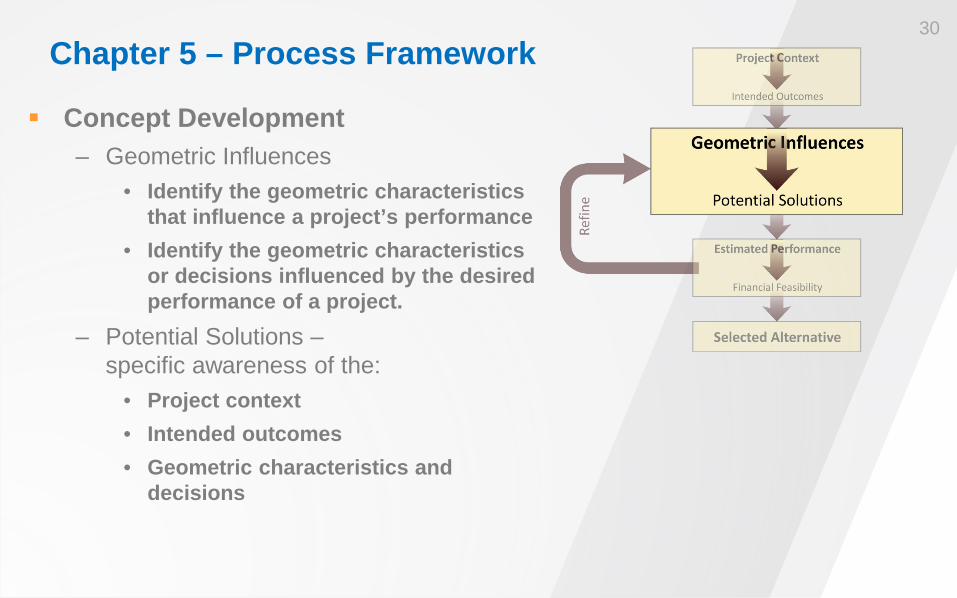
Chapter 5 – Process Framework
Concept Development – Geometric Influences
• Identify the geometric characteristics that influence a project’s performance
• Identify the geometric characteristics or decisions influenced by the desired performance of a project.
– Potential Solutions – specific awareness of the:
• Project context • Intended outcomes • Geometric characteristics and
decisions
30
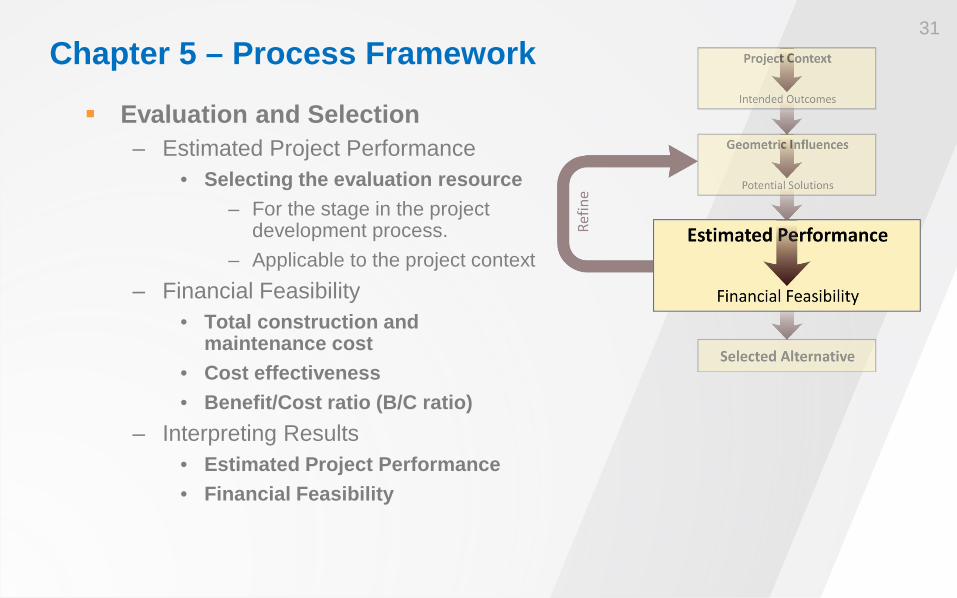
Chapter 5 – Process Framework
Evaluation and Selection – Estimated Project Performance
• Selecting the evaluation resource – For the stage in the project
development process. – Applicable to the project context
– Financial Feasibility • Total construction and
maintenance cost • Cost effectiveness • Benefit/Cost ratio (B/C ratio)
– Interpreting Results • Estimated Project Performance • Financial Feasibility
31
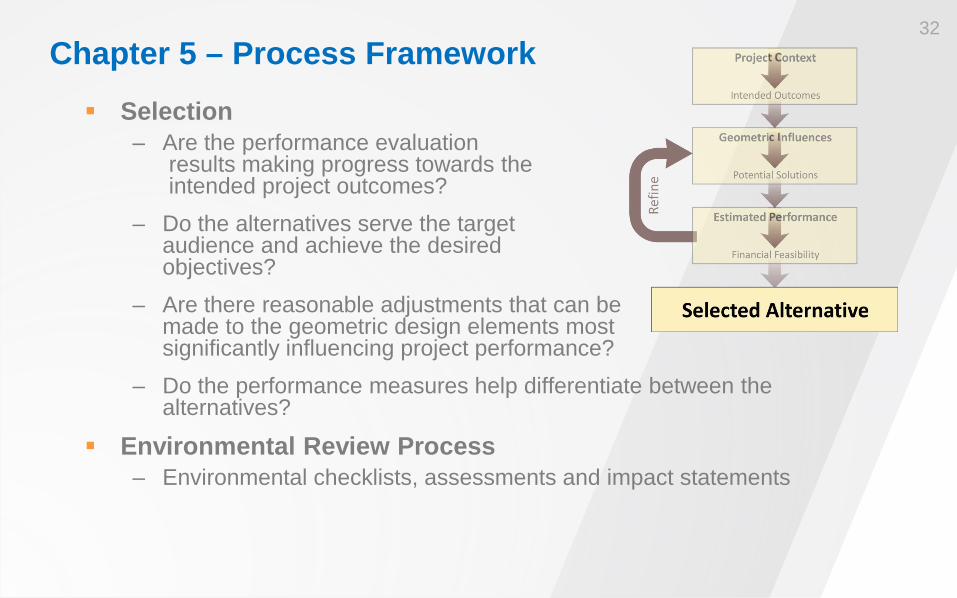
Chapter 5 – Process Framework Selection
– Are the performance evaluation results making progress towards the intended project outcomes?
– Do the alternatives serve the target audience and achieve the desired objectives?
– Are there reasonable adjustments that can be made to the geometric design elements most significantly influencing project performance?
– Do the performance measures help differentiate between the alternatives?
Environmental Review Process – Environmental checklists, assessments and impact statements
32
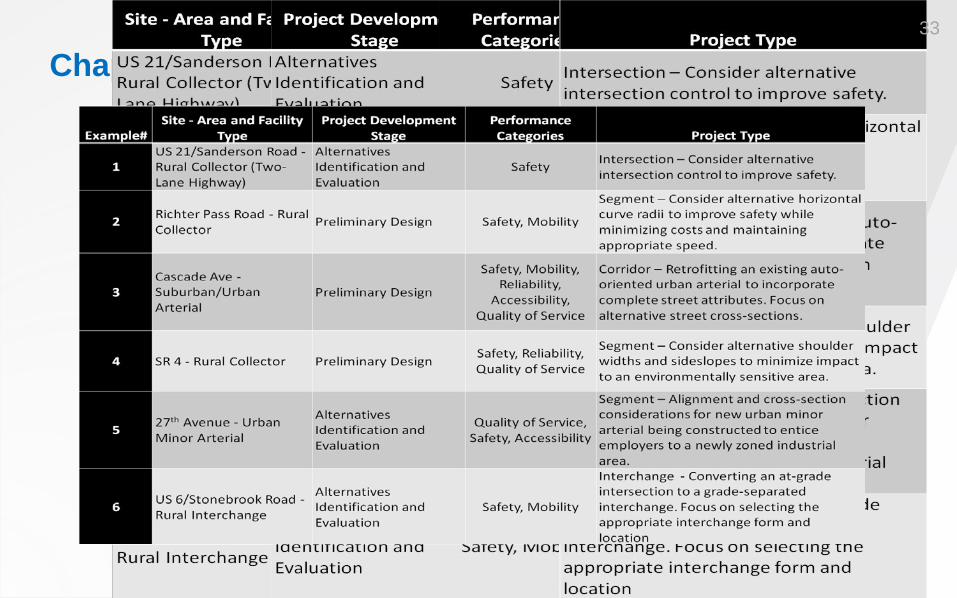
Chapter 6 – Project Examples 33
Presentation overview
Introduction and Key Objectives
Historical Overview of Highway Geometric Design
AASHTO and TRB Strategic Research Objectives
NCHRP Report 785 Overview and Application
– Hermanus Steyn
NCHRP Report 839 Overview
Questions and Discussion
34
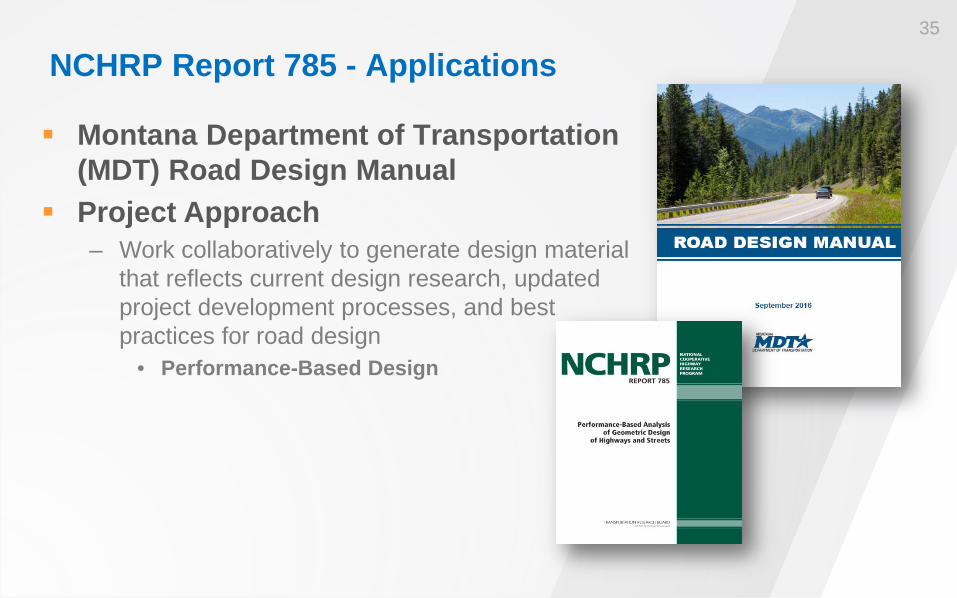
NCHRP Report 785 - Applications
Montana Department of Transportation (MDT) Road Design Manual
Project Approach – Work collaboratively to generate design material
that reflects current design research, updated project development processes, and best practices for road design
• Performance-Based Design
35
MDT Road Design Manual Chapter 1 – Road Design Guidelines and Procedures
Integrating performance-based design throughout manual – Coordination with State DOTs, local agencies, and stakeholders – Road design principles
• Focus on performance vs. dimensions
– Using performance based-design approach to make informed decisions and understand tradeoffs
• Balance safety, design, and operations
– Working collaboratively to generate ideas and solutions • Apply principles to accomplish the goal
36
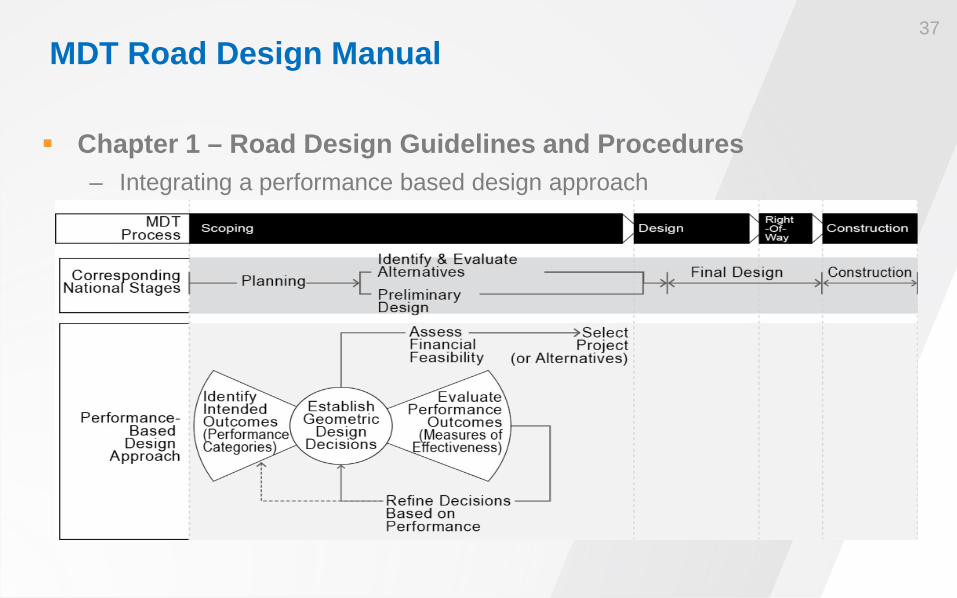
MDT Road Design Manual
Chapter 1 – Road Design Guidelines and Procedures – Integrating a performance based design approach
37
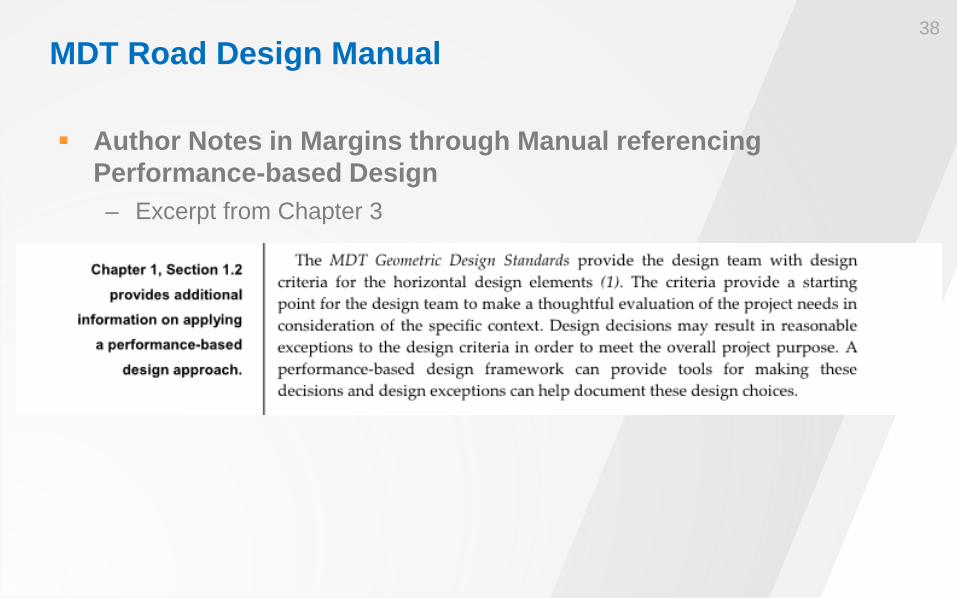
MDT Road Design Manual
Author Notes in Margins through Manual referencing Performance-based Design – Excerpt from Chapter 3
38
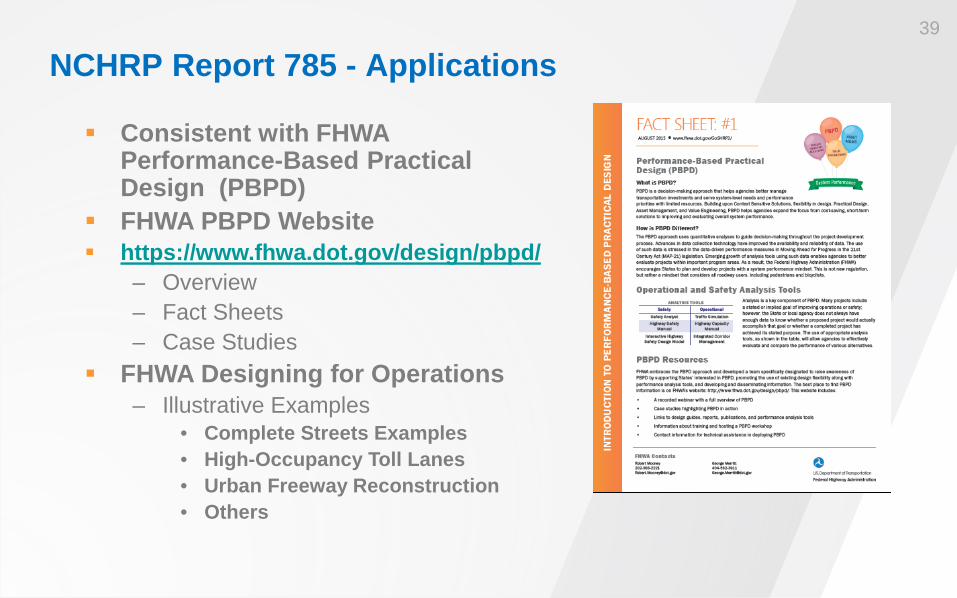
NCHRP Report 785 - Applications
Consistent with FHWA Performance-Based Practical Design (PBPD)
FHWA PBPD Website https://www.fhwa.dot.gov/design/pbpd/
– Overview – Fact Sheets – Case Studies
FHWA Designing for Operations – Illustrative Examples
• Complete Streets Examples • High-Occupancy Toll Lanes • Urban Freeway Reconstruction • Others
39
Presentation overview
Introduction and Key Objectives
Historical Overview of Highway Geometric Design
AASHTO and TRB Strategic Research Objectives
NCHRP Report 785 Overview
NCHRP Report 839 Overview
– Rich Coakley
Questions and Discussion
40
Introduction to NCHRP 15-47 – NCHRP Report 839 A Performance Based Highway Geometric Design Process The recommended geometric design process reflects an
understanding of: – History of highway design – Growth in knowledge of design effects on roadway performance, – Changes in emphasis and importance of road design and all road users – Legal framework that shapes implementation of public infrastructure, – Advances in technology that facilitate roadway design – Growing and seemingly permanent condition of limited resources for
• Construction • Operation • Maintenance of roads
41
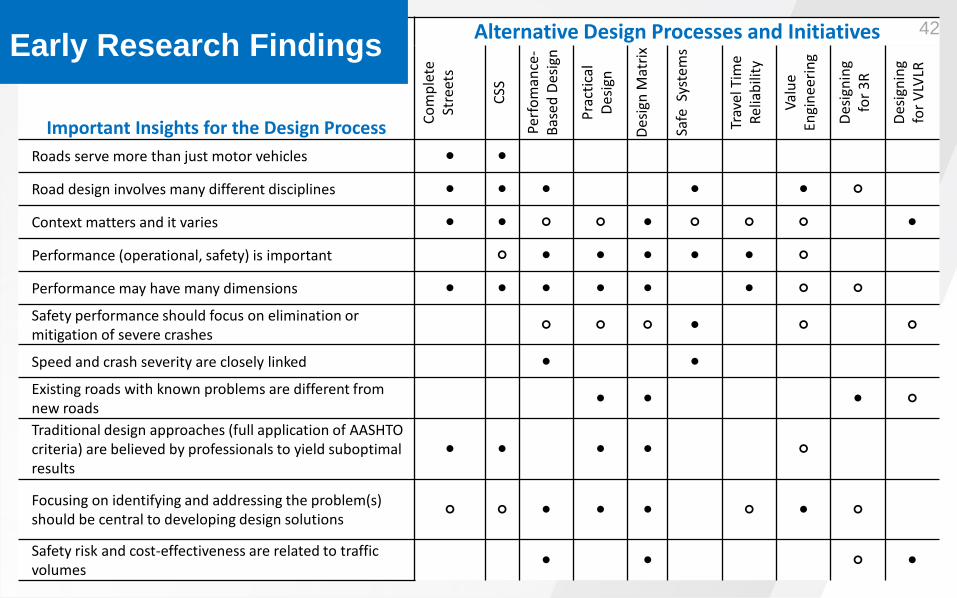
Important Insights for the Design Process
Alternative Design Processes and Initiatives
Com
plet
e St
reet
s
CSS
Perf
oman
ce-
Base
d De
sign
Prac
tical
De
sign
Desig
n M
atrix
Safe
Sys
tem
s
Trav
el T
ime
Relia
bilit
y
Valu
e En
gine
erin
g
Desig
ning
for 3
R
Desig
ning
for V
LVLR
Roads serve more than just motor vehicles
Road design involves many different disciplines
Context matters and it varies
Performance (operational, safety) is important
Performance may have many dimensions
Safety performance should focus on elimination or mitigation of severe crashes
Speed and crash severity are closely linked
Existing roads with known problems are different from new roads
Traditional design approaches (full application of AASHTO criteria) are believed by professionals to yield suboptimal results
Focusing on identifying and addressing the problem(s) should be central to developing design solutions
Safety risk and cost-effectiveness are related to traffic volumes
Early Research Findings 42
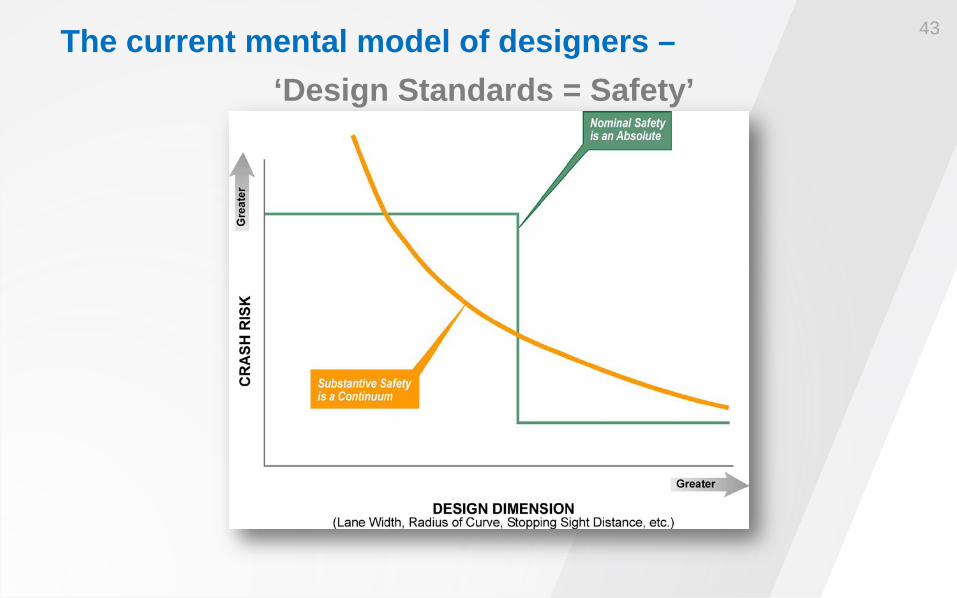
The current mental model of designers – ‘Design Standards = Safety’
43
Fundamental Bases for Roadway Design
Roadway design projects begin with a stated transportation problem. The purpose of geometric design is to provide the necessary three-dimensional framework for a facility to address the problem by providing the appropriate service to the users.
Dimensional and other design standards and criteria are a means to an end. The end is transportation performance, such performance to include mobility, accessibility, safety, and state-of-good repair.
Highway design criteria should be objectively related to one or more measures of transportation performance.
44
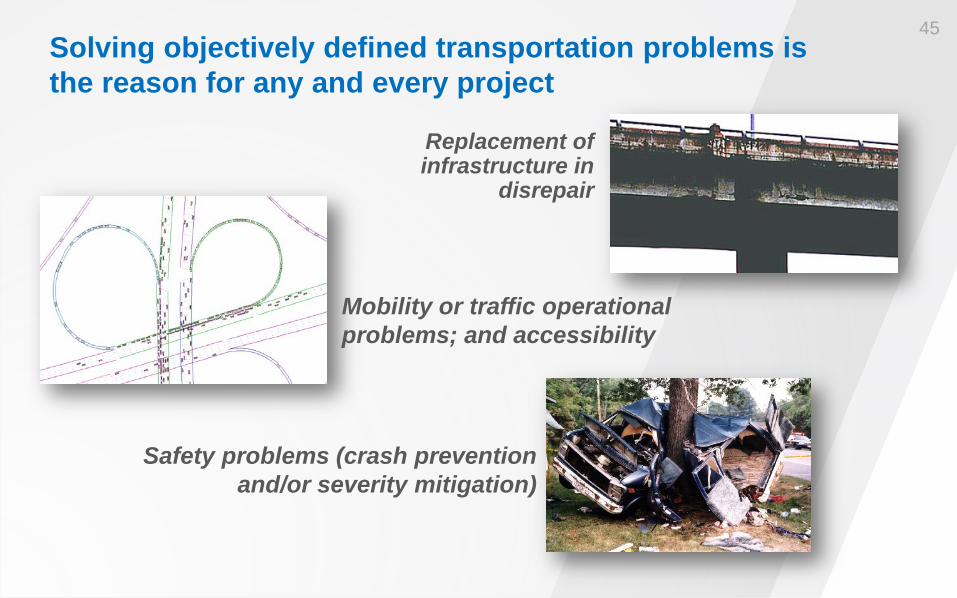
Solving objectively defined transportation problems is the reason for any and every project
Replacement of infrastructure in
disrepair
Mobility or traffic operational problems; and accessibility
Safety problems (crash prevention and/or severity mitigation)
45
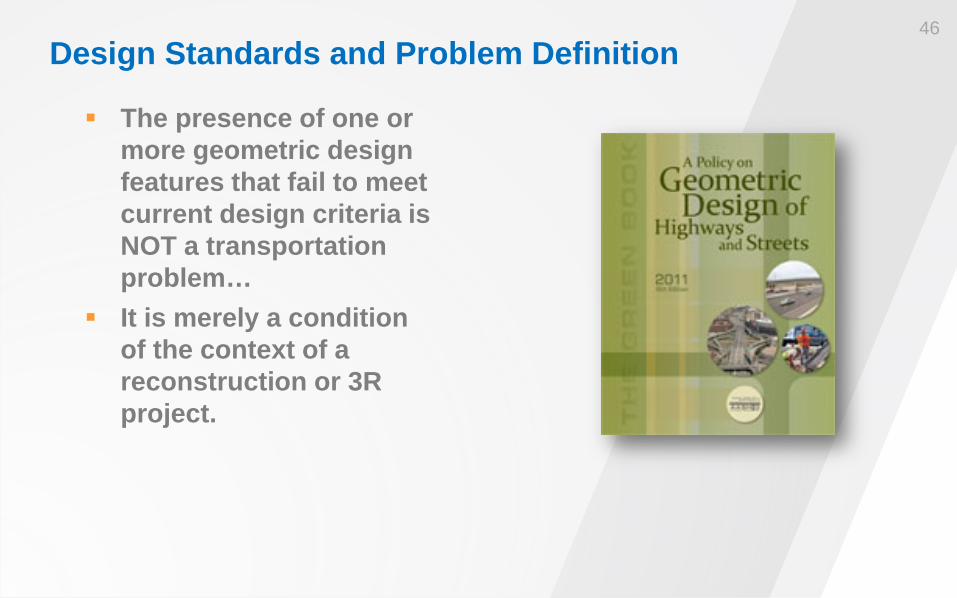
Design Standards and Problem Definition
The presence of one or more geometric design features that fail to meet current design criteria is NOT a transportation problem…
It is merely a condition of the context of a reconstruction or 3R project.
46
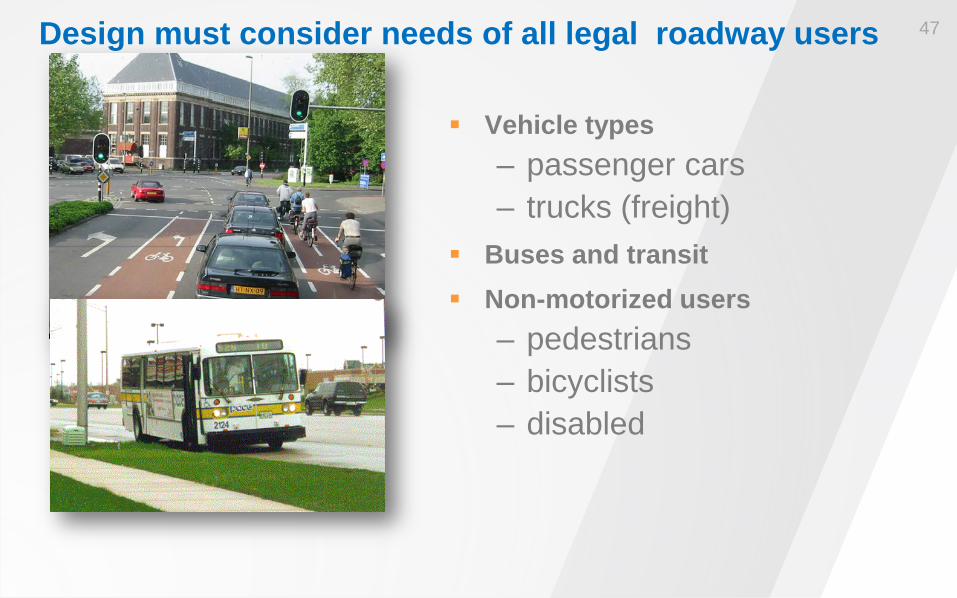
Design must consider needs of all legal roadway users
Vehicle types – passenger cars – trucks (freight)
Buses and transit Non-motorized users
– pedestrians – bicyclists – disabled
47
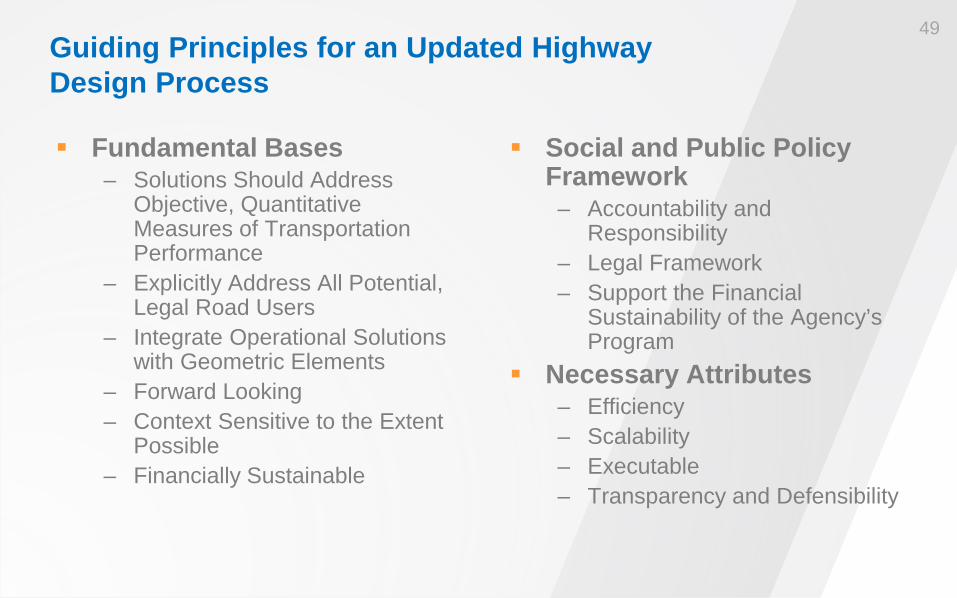
Guiding Principles for an Updated Highway Design Process
Fundamental Bases – Solutions Should Address
Objective, Quantitative Measures of Transportation Performance
– Explicitly Address All Potential, Legal Road Users
– Integrate Operational Solutions with Geometric Elements
– Forward Looking – Context Sensitive to the Extent
Possible – Financially Sustainable
Social and Public Policy Framework – Accountability and
Responsibility – Legal Framework – Support the Financial
Sustainability of the Agency’s Program
Necessary Attributes – Efficiency – Scalability – Executable – Transparency and Defensibility
49
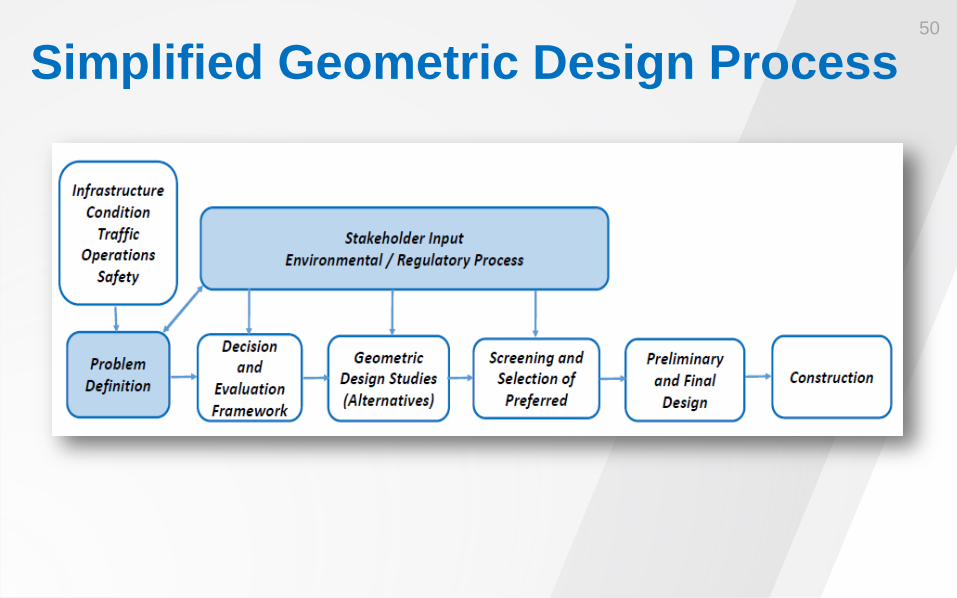
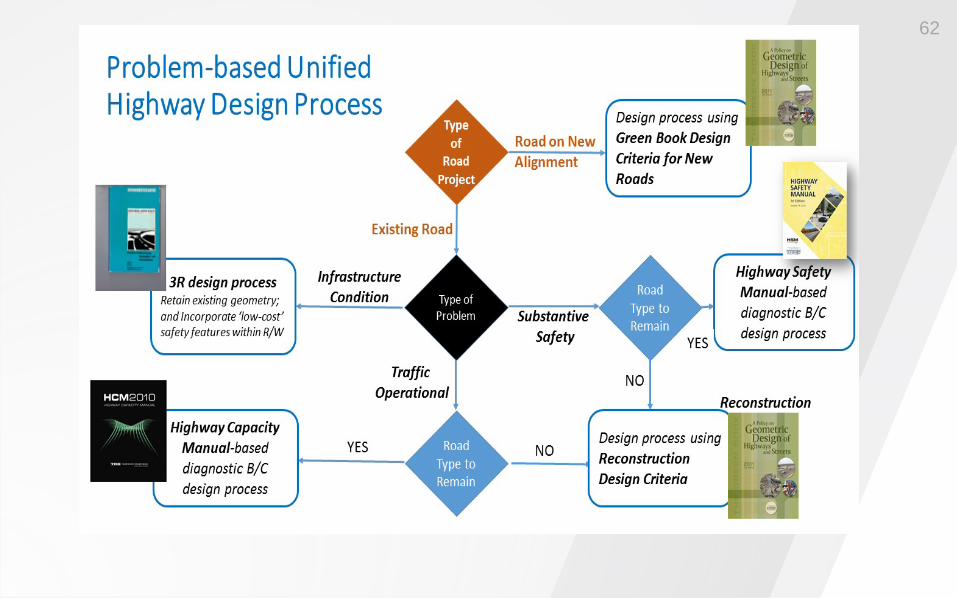
Simplified Geometric Design Process 50
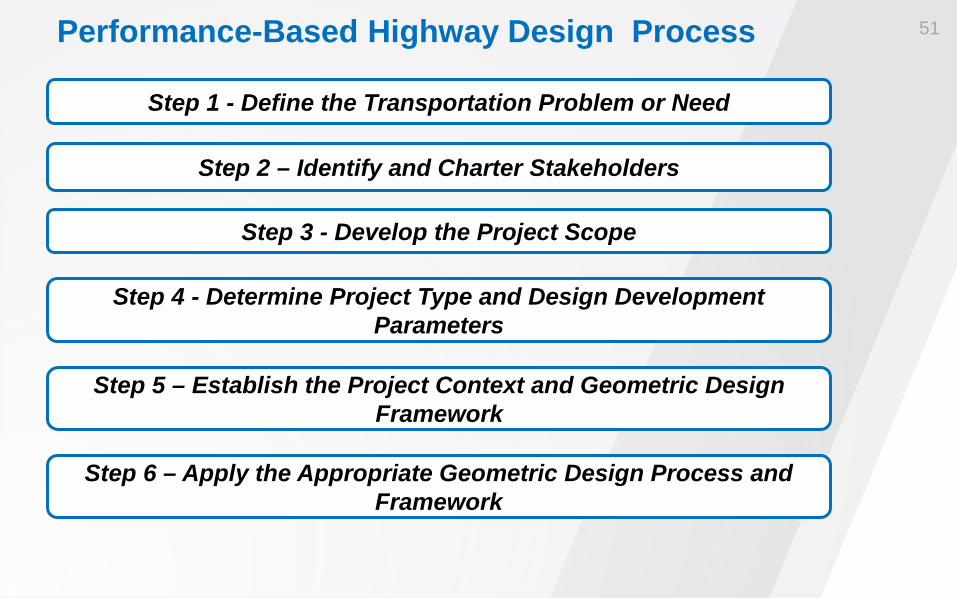
Performance-Based Highway Design Process 51
Step 1 - Define the Transportation Problem or Need
Step 2 – Identify and Charter Stakeholders
Step 3 - Develop the Project Scope
Step 4 - Determine Project Type and Design Development Parameters
Step 5 – Establish the Project Context and Geometric Design Framework
Step 6 – Apply the Appropriate Geometric Design Process and Framework
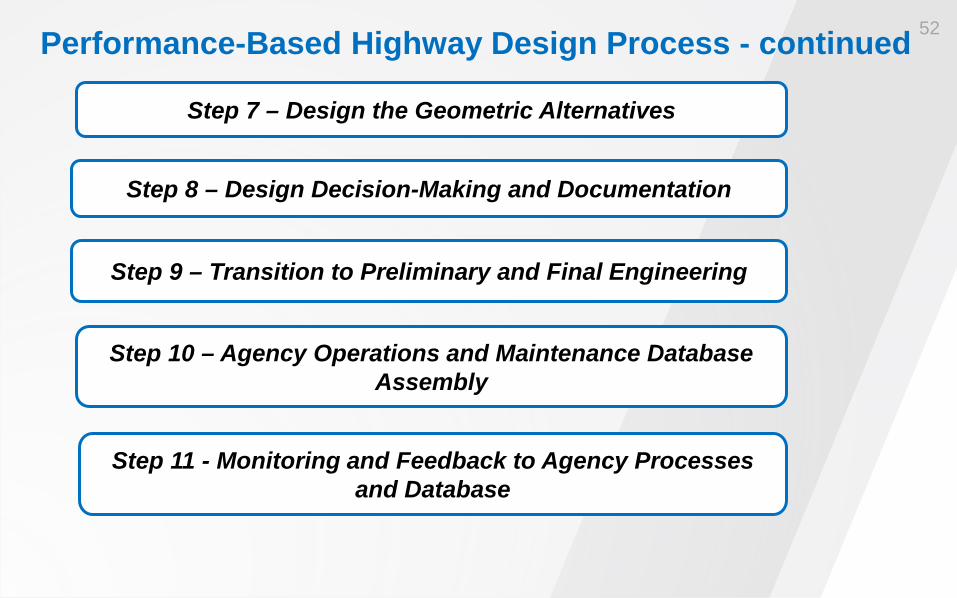
Performance-Based Highway Design Process - continued 52
Step 7 – Design the Geometric Alternatives
Step 8 – Design Decision-Making and Documentation
Step 9 – Transition to Preliminary and Final Engineering
Step 10 – Agency Operations and Maintenance Database Assembly
Step 11 - Monitoring and Feedback to Agency Processes and Database
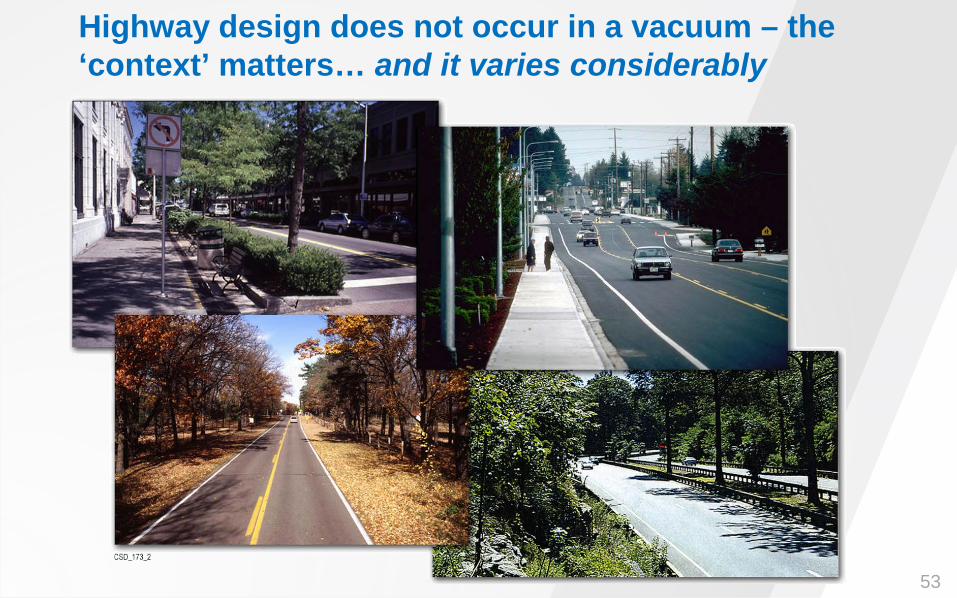
Highway design does not occur in a vacuum – the ‘context’ matters… and it varies considerably
53
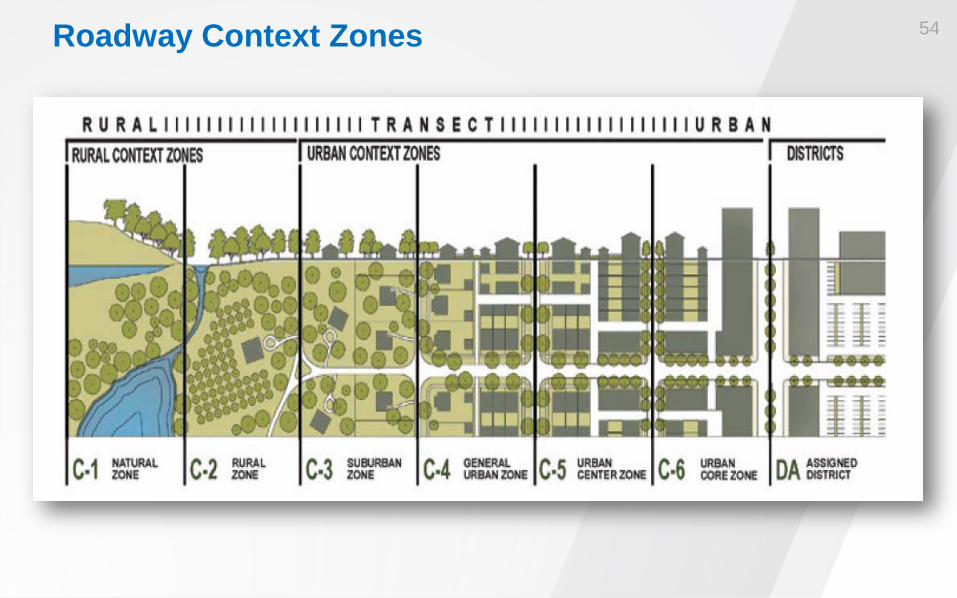
Roadway Context Zones 54
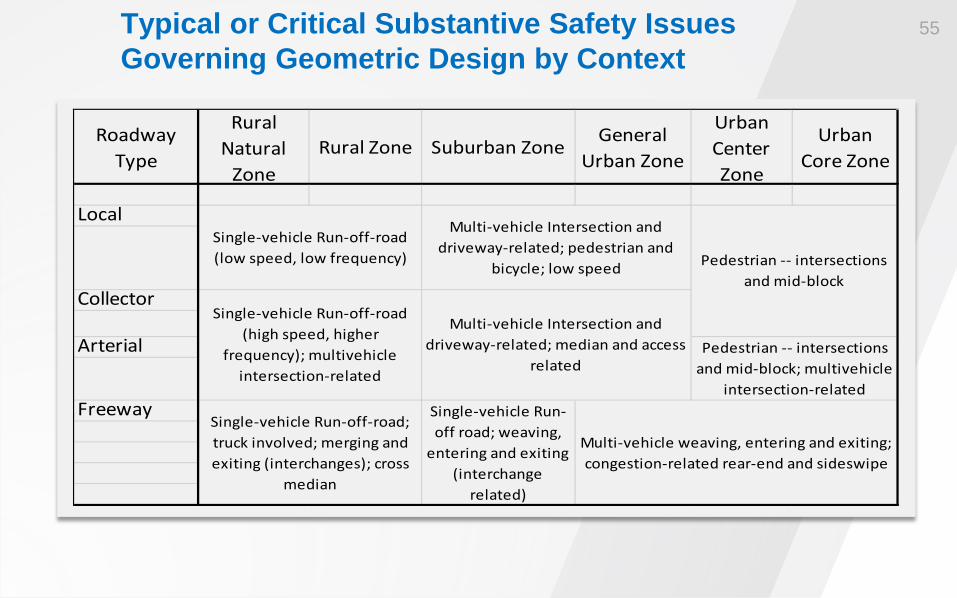
Typical or Critical Substantive Safety Issues Governing Geometric Design by Context
Roadway Type
Rural Natural
ZoneRural Zone Suburban Zone General
Urban Zone
Urban Center Zone
Urban Core Zone
Local
Collector
Arterial
Freeway
Multi-vehicle Intersection and driveway-related; pedestrian and
bicycle; low speed
Multi-vehicle Intersection and driveway-related; median and access
related
Single-vehicle Run-off road; weaving,
entering and exiting (interchange
related)
Multi-vehicle weaving, entering and exiting; congestion-related rear-end and sideswipe
Single-vehicle Run-off-road (low speed, low frequency)
Single-vehicle Run-off-road (high speed, higher
frequency); multivehicle intersection-related
Single-vehicle Run-off-road; truck involved; merging and exiting (interchanges); cross
median
Pedestrian -- intersections and mid-block
Pedestrian -- intersections and mid-block; multivehicle
intersection-related
55

Characteristics of Fatal and Injury Crashes by Context Zone
j y
Ped/Bike17%
SV34%
MV49%
K and A-Injury Crashes for Road Segments (2007-2009)2,659 Severe Crashes on 17,563.5 Lane-Miles
Ped/Bike1.1%
SV62.7%
MV36.2%
Roadway Segments, Context Zones 1 & 2,
Highway Safety Manual*
*Table 10-4. Default Distribution by Coll ision Type for Specific Crash Levels on Rural Two-Lane, Two-Way Roadway Segments (Total Fatal and Injury)
Roadway Segments in Cook County (Chicago excluded), Context Zones 3 & 4
56
Ped/Bike28%
SV33%
MV39%
Roadway Segments in Chicago, Context Zones 4, 5 & 6
3,293 Severe Crashes on 8,666.5 Lane-Miles
K and A-Injury Crashes for Segments (2007-2009)
Ped/Bike37%
SV22%
MV41%
Roadway Segments in Downtown Chicago,Context Zone 6
K and A-Injury Crashes for Segments in Chicago, Urban Core (2007-2009)51 Severe Crashes on ~61.75 Lane-Miles
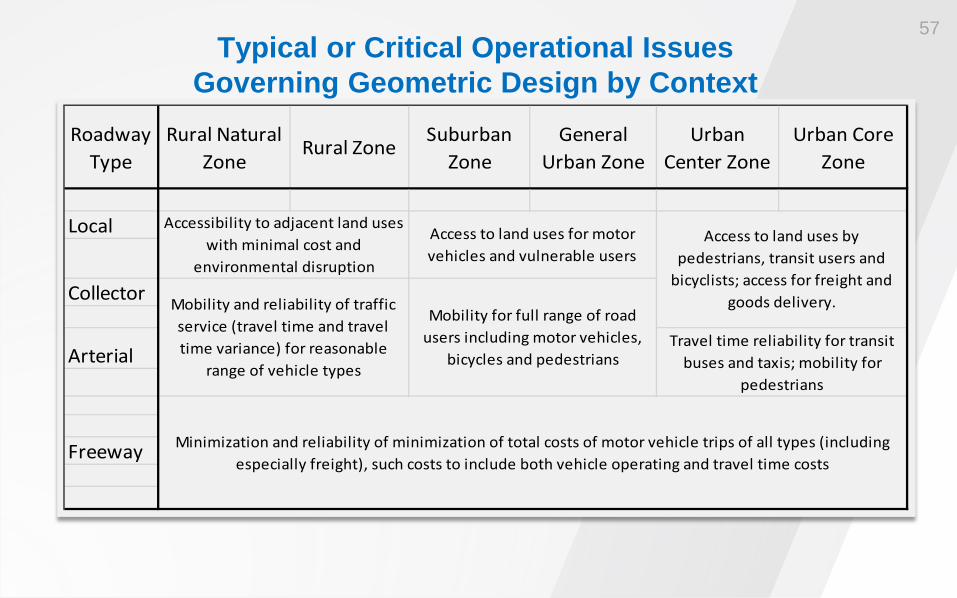
Typical or Critical Operational Issues Governing Geometric Design by Context
Roadway Type
Rural Natural Zone
Rural Zone Suburban Zone
General Urban Zone
Urban Center Zone
Urban Core Zone
Local
Collector
Arterial
Freeway
Accessibility to adjacent land uses with minimal cost and
environmental disruption
Access to land uses for motor vehicles and vulnerable users
Access to land uses by pedestrians, transit users and
bicyclists; access for freight and goods delivery.Mobility and reliability of traffic
service (travel time and travel time variance) for reasonable
range of vehicle types
Mobility for full range of road users including motor vehicles,
bicycles and pedestriansTravel time reliability for transit
buses and taxis; mobility for pedestrians
Minimization and reliability of minimization of total costs of motor vehicle trips of all types (including especially freight), such costs to include both vehicle operating and travel time costs
57
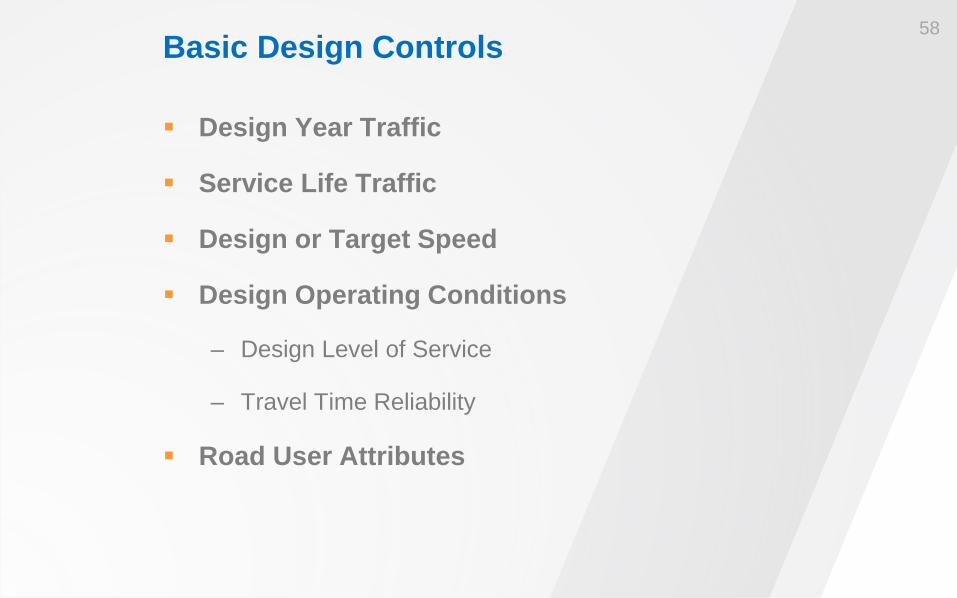
Basic Design Controls Design Year Traffic
Service Life Traffic
Design or Target Speed
Design Operating Conditions
– Design Level of Service
– Travel Time Reliability
Road User Attributes
58
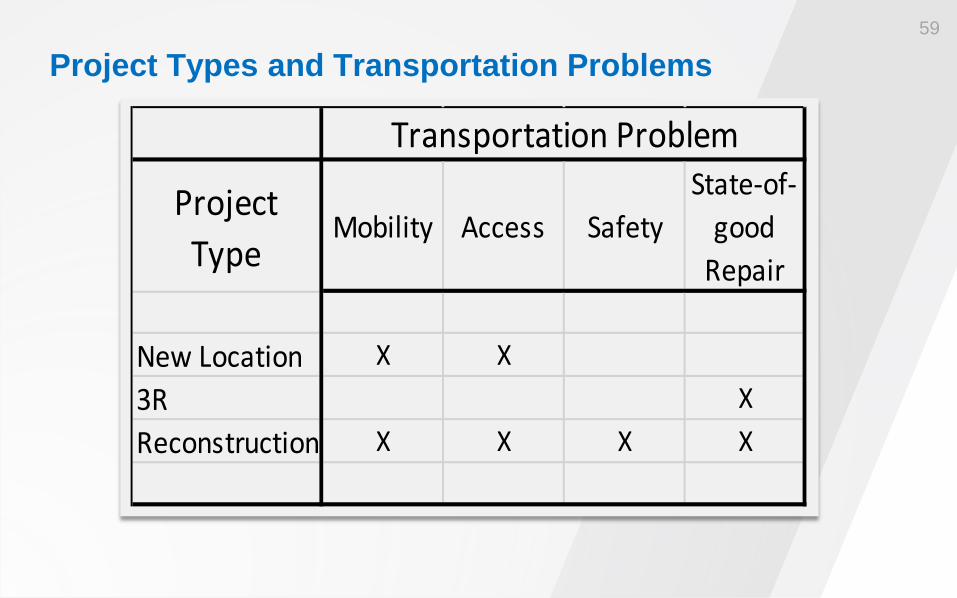
Project Type
Mobility Access SafetyState-of-
good Repair
New Location X X3R XReconstruction X X X X
Transportation Problem
Project Types and Transportation Problems 59
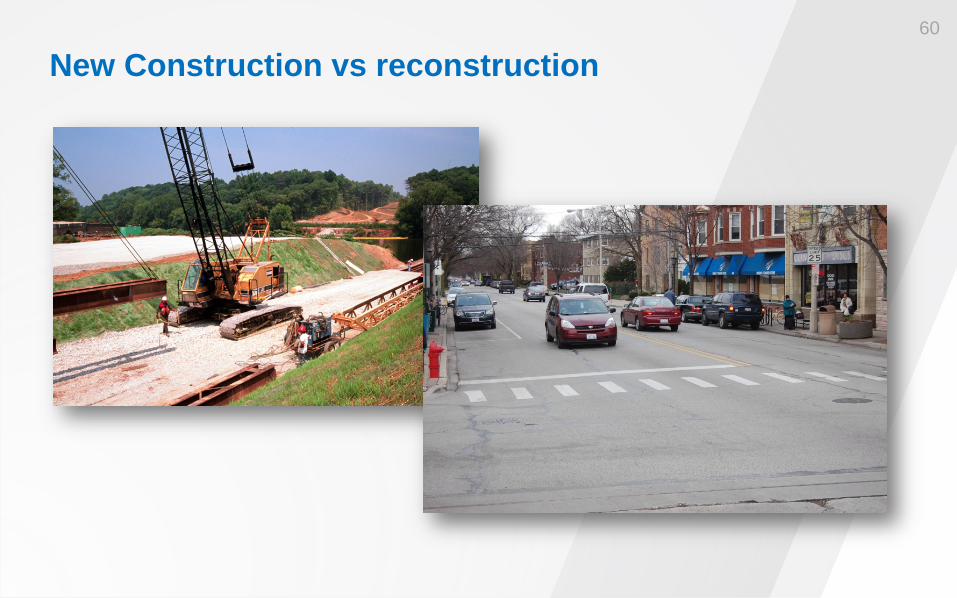
New Construction vs reconstruction 60
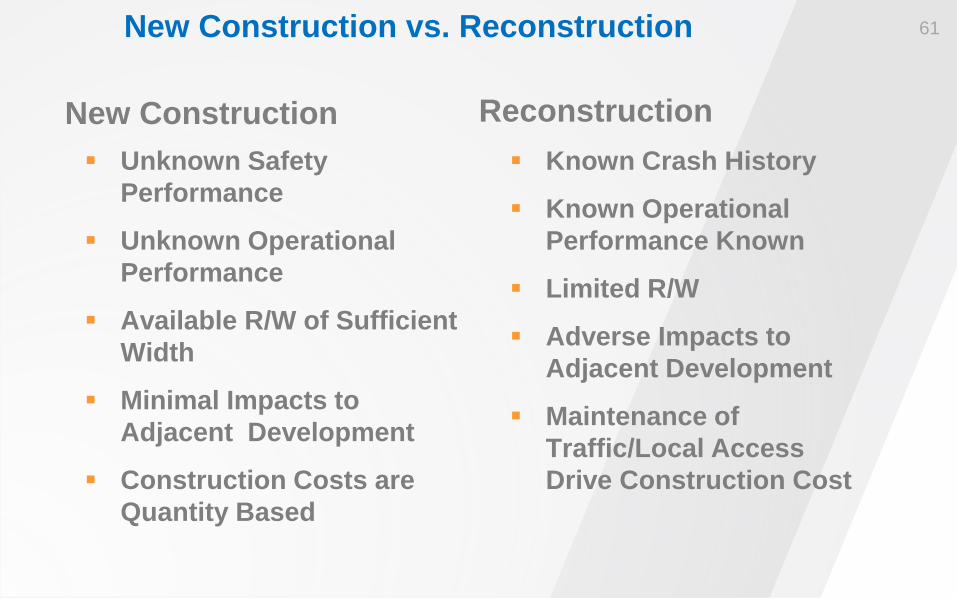
New Construction vs. Reconstruction
Unknown Safety Performance
Unknown Operational Performance
Available R/W of Sufficient Width
Minimal Impacts to Adjacent Development
Construction Costs are Quantity Based
Known Crash History
Known Operational Performance Known
Limited R/W
Adverse Impacts to Adjacent Development
Maintenance of Traffic/Local Access Drive Construction Cost
Reconstruction New Construction
61
62
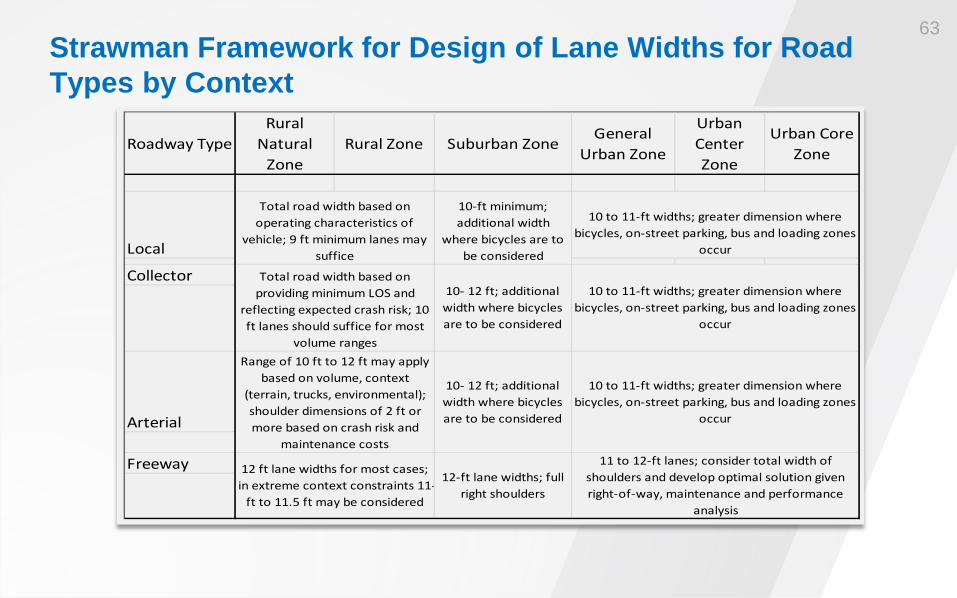
Strawman Framework for Design of Lane Widths for Road Types by Context
Roadway TypeRural
Natural Zone
Rural Zone Suburban ZoneGeneral
Urban Zone
Urban Center Zone
Urban Core Zone
Local
Collector
Arterial
Freeway
10 to 11-ft widths; greater dimension where bicycles, on-street parking, bus and loading zones
occur
10- 12 ft; additional width where bicycles are to be considered
12-ft lane widths; full right shoulders
11 to 12-ft lanes; consider total width of shoulders and develop optimal solution given right-of-way, maintenance and performance
analysis
10 to 11-ft widths; greater dimension where bicycles, on-street parking, bus and loading zones
occur
10- 12 ft; additional width where bicycles are to be considered
10 to 11-ft widths; greater dimension where bicycles, on-street parking, bus and loading zones
occur
Total road width based on operating characteristics of
vehicle; 9 ft minimum lanes may suffice
Total road width based on providing minimum LOS and
reflecting expected crash risk; 10 ft lanes should suffice for most
volume rangesRange of 10 ft to 12 ft may apply
based on volume, context (terrain, trucks, environmental); shoulder dimensions of 2 ft or more based on crash risk and
maintenance costs
12 ft lane widths for most cases; in extreme context constraints 11-
ft to 11.5 ft may be considered
10-ft minimum; additional width
where bicycles are to be considered
63
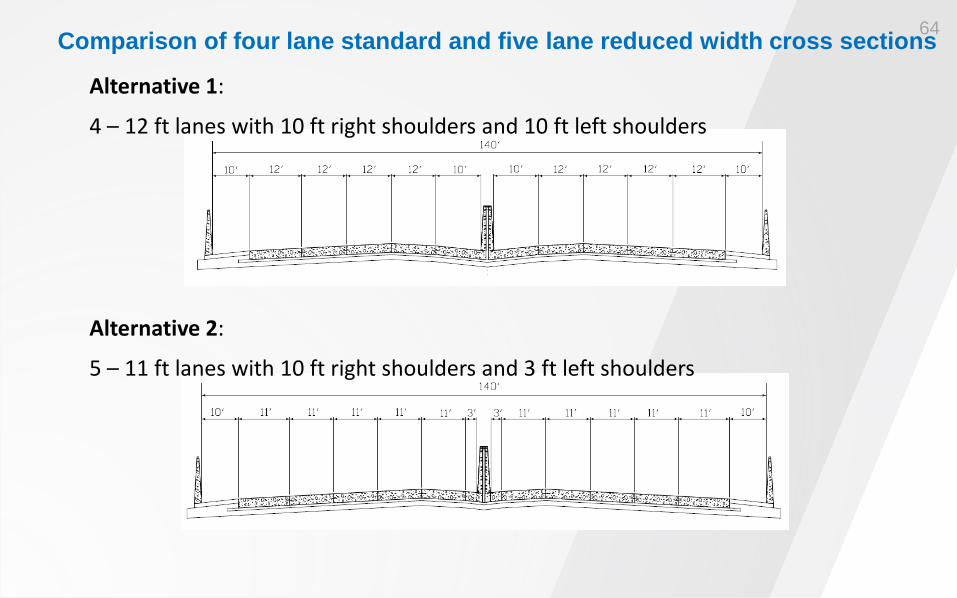
Comparison of four lane standard and five lane reduced width cross sections
Alternative 2:
5 – 11 ft lanes with 10 ft right shoulders and 3 ft left shoulders
Alternative 1:
4 – 12 ft lanes with 10 ft right shoulders and 10 ft left shoulders
64
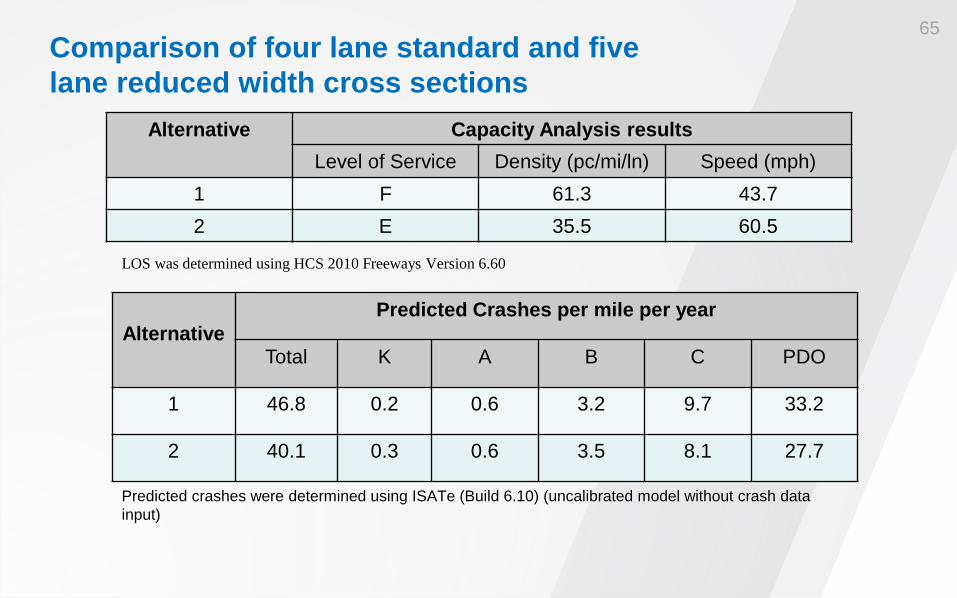
Comparison of four lane standard and five lane reduced width cross sections
Alternative Capacity Analysis results Level of Service Density (pc/mi/ln) Speed (mph)
1 F 61.3 43.7 2 E 35.5 60.5
Alternative
Predicted Crashes per mile per year
Total K A B C PDO
1 46.8 0.2 0.6 3.2 9.7 33.2
2 40.1 0.3 0.6 3.5 8.1 27.7
LOS was determined using HCS 2010 Freeways Version 6.60
Predicted crashes were determined using ISATe (Build 6.10) (uncalibrated model without crash data input)
65
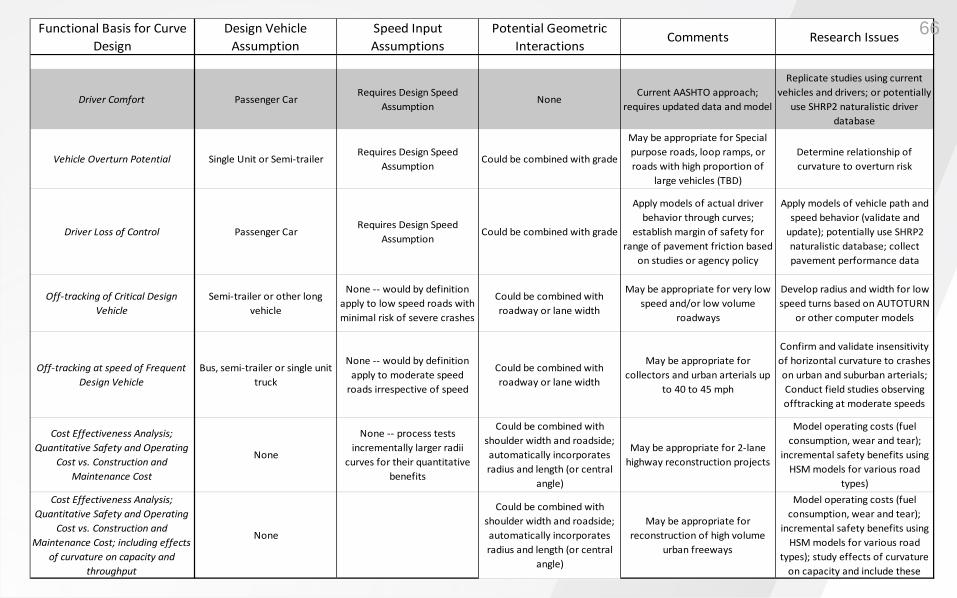
Functional Basis for Curve Design
Design Vehicle Assumption
Speed Input Assumptions
Potential Geometric Interactions
Comments Research Issues
Driver Comfort Passenger CarRequires Design Speed
AssumptionNone
Current AASHTO approach; requires updated data and model
Replicate studies using current vehicles and drivers; or potentially
use SHRP2 naturalistic driver database
Vehicle Overturn Potential Single Unit or Semi-trailerRequires Design Speed
AssumptionCould be combined with grade
May be appropriate for Special purpose roads, loop ramps, or roads with high proportion of
large vehicles (TBD)
Determine relationship of curvature to overturn risk
Driver Loss of Control Passenger CarRequires Design Speed
AssumptionCould be combined with grade
Apply models of actual driver behavior through curves;
establish margin of safety for range of pavement friction based
on studies or agency policy
Apply models of vehicle path and speed behavior (validate and
update); potentially use SHRP2 naturalistic database; collect pavement performance data
Off-tracking of Critical Design Vehicle
Semi-trailer or other long vehicle
None -- would by definition apply to low speed roads with minimal risk of severe crashes
Could be combined with roadway or lane width
May be appropriate for very low speed and/or low volume
roadways
Develop radius and width for low speed turns based on AUTOTURN
or other computer models
Off-tracking at speed of Frequent Design Vehicle
Bus, semi-trailer or single unit truck
None -- would by definition apply to moderate speed
roads irrespective of speed
Could be combined with roadway or lane width
May be appropriate for collectors and urban arterials up
to 40 to 45 mph
Confirm and validate insensitivity of horizontal curvature to crashes on urban and suburban arterials; Conduct field studies observing offtracking at moderate speeds
Cost Effectiveness Analysis; Quantitative Safety and Operating
Cost vs. Construction and Maintenance Cost
None
None -- process tests incrementally larger radii
curves for their quantitative benefits
Could be combined with shoulder width and roadside; automatically incorporates radius and length (or central
angle)
May be appropriate for 2-lane highway reconstruction projects
Model operating costs (fuel consumption, wear and tear);
incremental safety benefits using HSM models for various road
types)Cost Effectiveness Analysis;
Quantitative Safety and Operating Cost vs. Construction and
Maintenance Cost; including effects of curvature on capacity and
throughput
None
Could be combined with shoulder width and roadside; automatically incorporates radius and length (or central
angle)
May be appropriate for reconstruction of high volume
urban freeways
Model operating costs (fuel consumption, wear and tear);
incremental safety benefits using HSM models for various road
types); study effects of curvature on capacity and include these
66
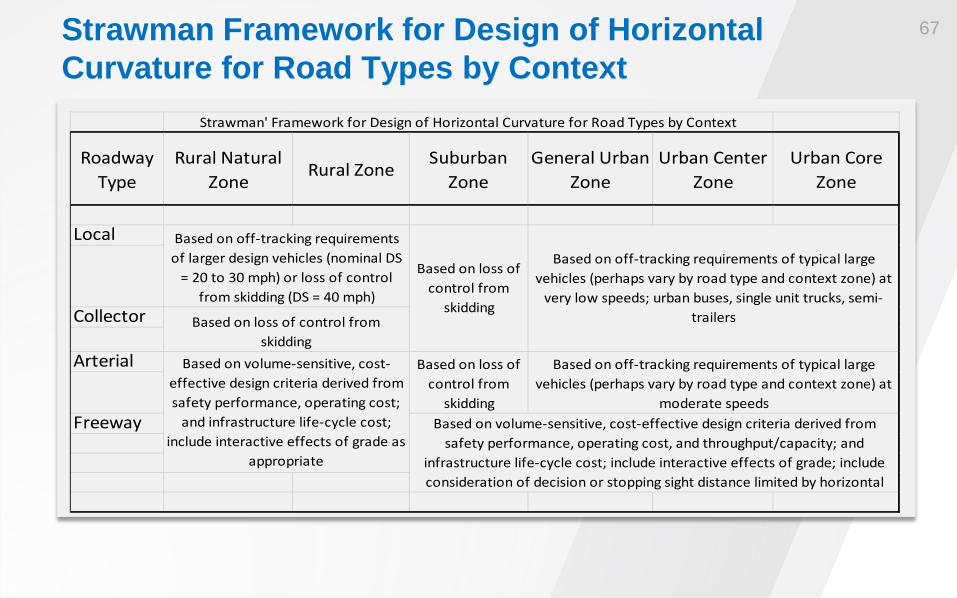
Strawman Framework for Design of Horizontal Curvature for Road Types by Context
Roadway Type
Rural Natural Zone
Rural ZoneSuburban
ZoneGeneral Urban
ZoneUrban Center
ZoneUrban Core
Zone
Local
Collector
Arterial
Freeway
Based on off-tracking requirements of typical large vehicles (perhaps vary by road type and context zone) at
very low speeds; urban buses, single unit trucks, semi-trailers
Based on loss of control from
skidding
Based on loss of control from
skidding
Based on off-tracking requirements of typical large vehicles (perhaps vary by road type and context zone) at
moderate speedsBased on volume-sensitive, cost-effective design criteria derived from
safety performance, operating cost, and throughput/capacity; and infrastructure life-cycle cost; include interactive effects of grade; include consideration of decision or stopping sight distance limited by horizontal
Based on off-tracking requirements of larger design vehicles (nominal DS
= 20 to 30 mph) or loss of control from skidding (DS = 40 mph)
Based on loss of control from skidding
Based on volume-sensitive, cost-effective design criteria derived from safety performance, operating cost;
and infrastructure life-cycle cost; include interactive effects of grade as
appropriate
Strawman' Framework for Design of Horizontal Curvature for Road Types by Context
67
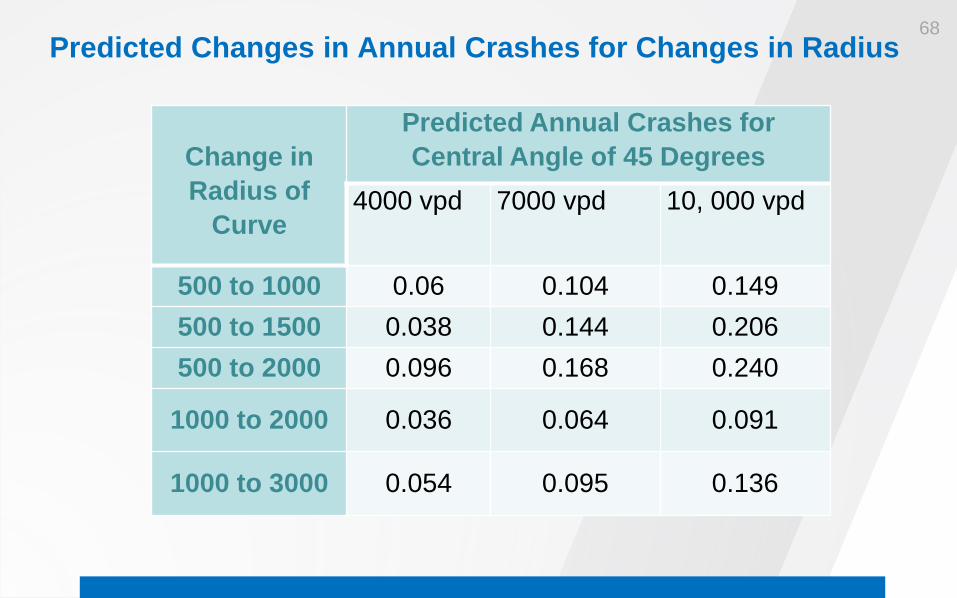
Predicted Changes in Annual Crashes for Changes in Radius
Change in Radius of
Curve
Predicted Annual Crashes for Central Angle of 45 Degrees
4000 vpd 7000 vpd 10, 000 vpd
500 to 1000 0.06 0.104 0.149 500 to 1500 0.038 0.144 0.206 500 to 2000 0.096 0.168 0.240
1000 to 2000 0.036 0.064 0.091
1000 to 3000 0.054 0.095 0.136
68
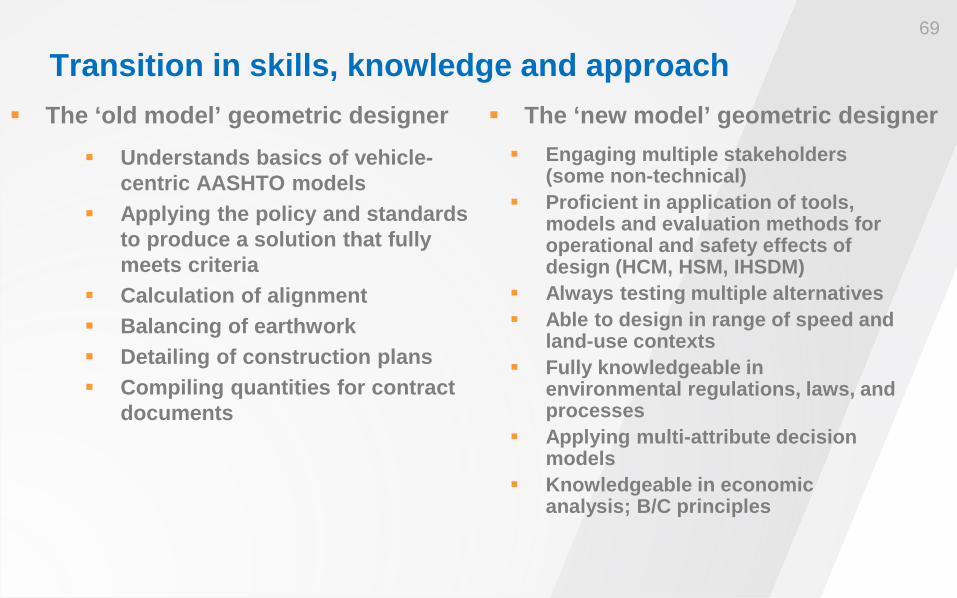
Transition in skills, knowledge and approach
Understands basics of vehicle-centric AASHTO models
Applying the policy and standards to produce a solution that fully meets criteria
Calculation of alignment Balancing of earthwork Detailing of construction plans Compiling quantities for contract
documents
Engaging multiple stakeholders (some non-technical)
Proficient in application of tools, models and evaluation methods for operational and safety effects of design (HCM, HSM, IHSDM)
Always testing multiple alternatives Able to design in range of speed and
land-use contexts Fully knowledgeable in
environmental regulations, laws, and processes
Applying multi-attribute decision models
Knowledgeable in economic analysis; B/C principles
The ‘old model’ geometric designer The ‘new model’ geometric designer
69
GUIDELINES for
GEOMETRIC DESIGN of
LOW-VOLUME ROADS
More than 80% of the roads in the United States have traffic volumes of 2000 vehicles per day or less
70
Update of the AASHTO Guidelines for Geometric Design of Very Low-Volume Local Roads The first edition published in 2001 addressed roads with traffic volumes of 400 vehicles per day or less
The second Edition is the AASHTO Guidelines for Geometric Design of Low-Volume Roads
71
For projects on existing roads, the second edition increases the traffic volume threshold to which the guidelines are applicable from 400 to 2,000 vehicles/day
Results of the survey: Approximately 40 percent of respondents supported
expanding the guidelines to an AADT higher than 400 vehicles/day
This support was generally from states that have substantial lower volume road networks
Agencies that supported an increase in the AADT threshold were asked what that revised threshold should be: – responses ranged from 500 to 2,500 vehicles/day
– the most common response was 1,000 vehicles/day
Definition of Terms
The current guide defines a “very low-volume road” as having an AADT of 400 vehicles/day or less
In the past, research has defined a “low-volume road” as having an AADT of 2,000 vehicles/day or less
If we were to adopt a threshold between 400 and 2,000 vehicles/day, what term would be use for roads below that threshold that would not be confusing?
73
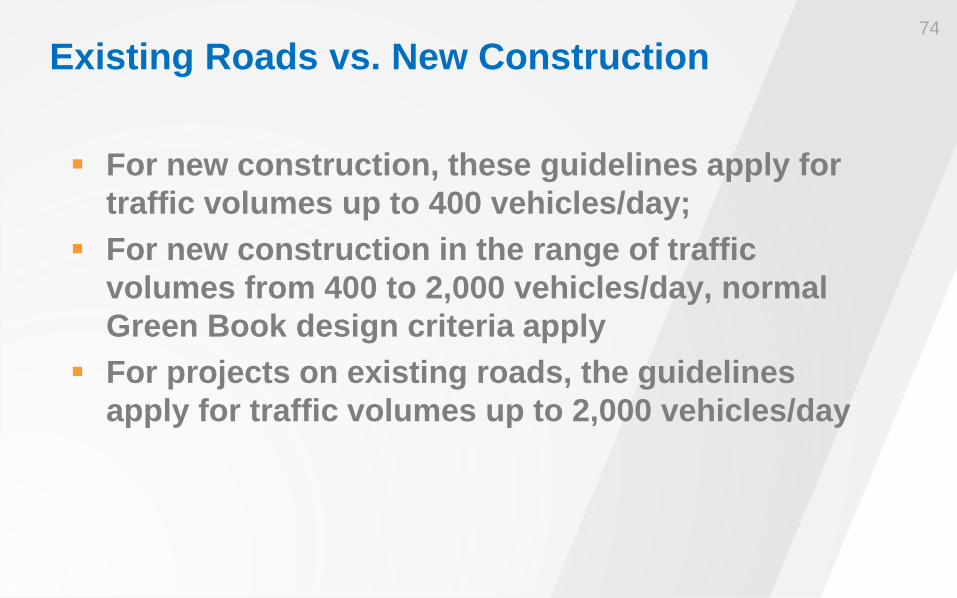
Existing Roads vs. New Construction
For new construction, these guidelines apply for traffic volumes up to 400 vehicles/day;
For new construction in the range of traffic volumes from 400 to 2,000 vehicles/day, normal Green Book design criteria apply
For projects on existing roads, the guidelines apply for traffic volumes up to 2,000 vehicles/day
74
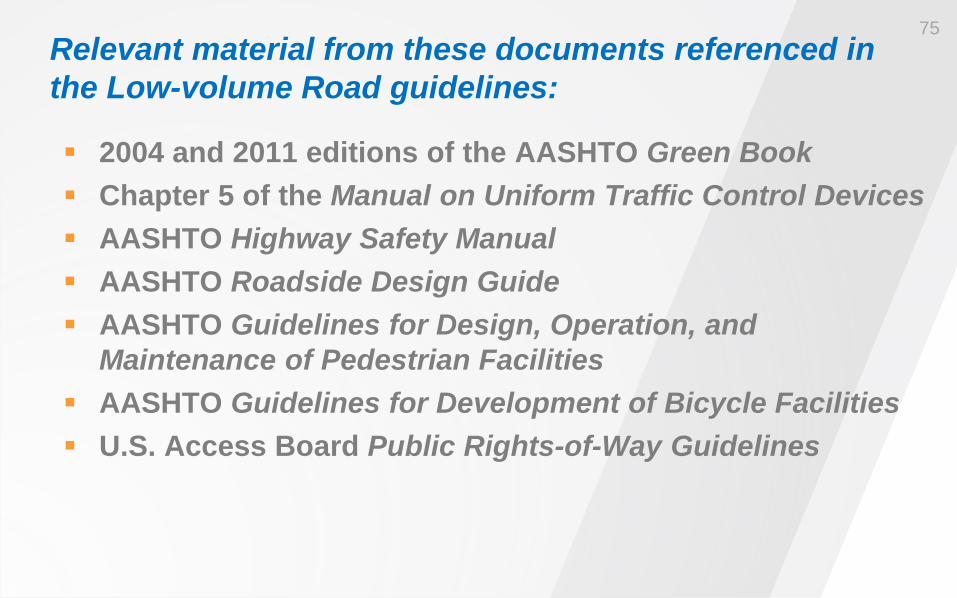
Relevant material from these documents referenced in the Low-volume Road guidelines:
2004 and 2011 editions of the AASHTO Green Book Chapter 5 of the Manual on Uniform Traffic Control Devices AASHTO Highway Safety Manual AASHTO Roadside Design Guide AASHTO Guidelines for Design, Operation, and
Maintenance of Pedestrian Facilities AASHTO Guidelines for Development of Bicycle Facilities U.S. Access Board Public Rights-of-Way Guidelines
75

Questions
Brian Ray, PE [email protected] Julia Knudsen, PE [email protected] Hermanus Steyn, Pr.Eng., PE [email protected] Richard Coakley, PE, PTOE [email protected]
76