Embed Size (px)
Citation preview

1
Population Genetics
Dr Pupak Derakhshandeh-Peykar, PhD
Ass Prof of Medical Science of Tehran University
Ref.: Population and Evolutionary Ref.: Population and Evolutionary Genetics: A primerGenetics: A primer

2
What is Population Genetics?
The genetical study of the process of evolution
(The study of the change of allele frequencies, genotype frequencies, and phenotype frequencies)

3
Population genetics:
One of the oldest and richest examples of success of mathematical theory in biology
Mendelian genetics and Darwinian natural selection in the first part of the 20th century
“modern synthesis”

4
Population Genetics is…
About microevolution (evolution within species)
Strongly dependent on mathematical models
A relatively young science (most important discoveries are from after 1930)

5
Factors causing genotype frequency changes
Selection Mutation Random Drift Migration Recombination Non-random Mating
6
What forces are responsible for divergence among populations?
Mutation genetic diversity
Selection genetic diversityGenetic drift genetic diversity
Migration genetic diversity
Non-random genetic diversity
mating

7
What's the most important factor in evolution?
SELECTIONSELECTION Natural selection causes evolution:
There is variation in fitness (selection(
That variation can be passed from one generation to the next (inheritance(
This is the central insight of Darwin

8
THEORIES of EVOLUTION
and the
DARWINIAN REVOLUTION

9
Darwin's Theory of Evolution
Four Basic Themes:
1. Descent with Modification from Common Ancestor
2. Diversity is result of Differential Survival 3. and/or Differential Reproduction among
individuals4. with different Heritable characteristics
= Process of Natural Selection
Law of Evolution by Natural Selection

10
Charles Darwin (1809-1882)

11
Theory of Evolution by Natural Selection (1859)
Charles Darwin (1809-1882)
Inherited Variation among individuals
↓
Differential survival and/or reproduction
(“hard” inheritance)
↓
Change in genetic composition of population
↓↓↓↓
Evolution
12
Jean Baptiste Lamarck (1744-1829)

13
Theory of Evolutionby Inheritance of Acquired Characteristics
(1809)Jean Baptiste Lamarck (1744-1829)
Environmental change↓
Change in organismal form↓
Inheritance of acquired characteristics(“soft inheritance”)
↓Change in composition of population
↓↓↓Evolution

14
Lamarck’s vs. Darwin’s Theories
انقراض=
= هدفدار ن�ژاد اصالح

15
Dates, Contributors to Evolutionary Thinking - 1
16
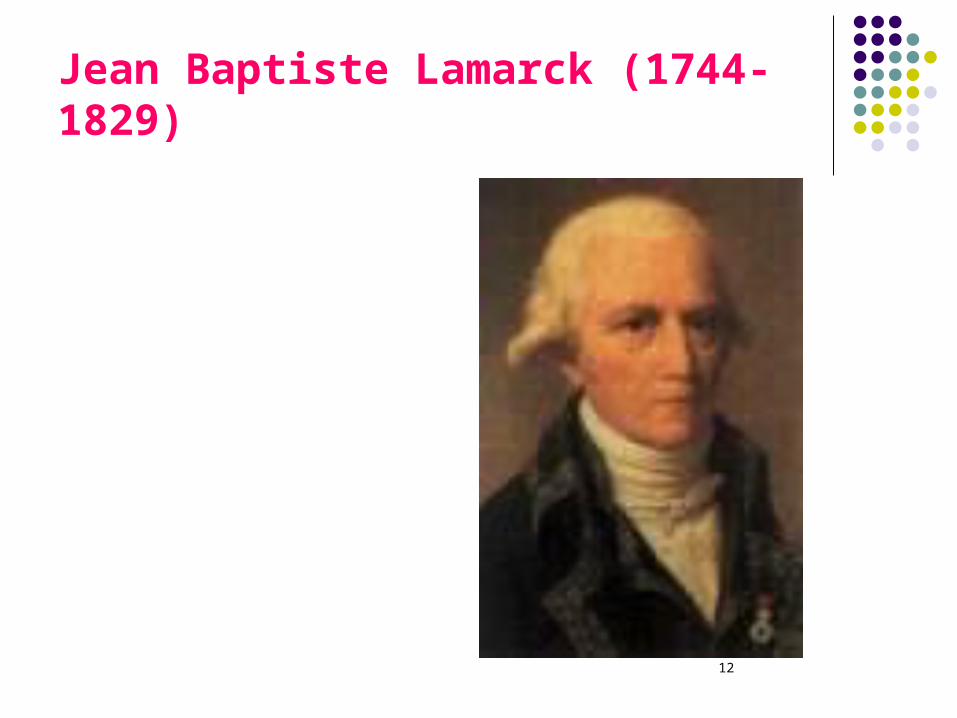
Dates, Contributors to Evolutionary Thinking - 2

17
Genes in Populations:Genes in Populations:
Hardy Weinberg Hardy Weinberg EquilibriumEquilibrium

18
Alleles
Alternative forms of a particular sequence
Each allele has a frequency

19
Alleles
Yeast: 12 Mb ; 6,340 genes
Nematode elegance: 97 Mb; 19,100 genes
Human: 3,700 Mb; 75,000 genes !

20
Methods used to measure genetic variation:
Genetic variation contains information about an organism’s ancestry
determines an organism’s potential for evolutionary change, adaptation, and survival
1960s-1970s: genetic variation was first measured by protein electrophoresis (e.g., allozymes)

21
1980s-2008s: genetic variation measured directly at the DNA level (1):
Restriction Fragement Length Polymorphisms (RFLPs)
Minisatellites (VNTRs) DNA sequence DNA length polymorphisms Single-stranded Conformation
Polymorphism (SSCP)

22
1980s-2008s: genetic variation measured directly at the DNA level (2):
Microsatellites (STRs)Random Amplified Polymorphic
DNAs (RAPDs)Amplified Fragment Length
Polymorphisms (AFLPs)Single Nucleotide Polymorphisms
(SNPs)

23
Types of measures of genetic Types of measures of genetic variation (1)variation (1):
Polymorphism = % of loci or nucleotide positions showing more than one allele or base pair.
Heterozygosity (H) = % of individuals that are heterozygotes
Allele/haplotype diversity = measure of diversity and different alleles/haplotypes within a population.

24
Types of measures of genetic Types of measures of genetic variation (2)variation (2):
Nucleotide diversity = measure of number and diversity of variable nucleotide positions within sequences of a population.
Genetic distance = measure of number of base pair differences between two homologous sequences.
Synonomous/nonsynonomous substitutions = % of nucleotide substitutions that do not/do result in amino acid replacement.

25
Properties of alleles in a population Allele frequencies Genotypes frequencies
Hardy-Weinberg equilibrium

26
Allele Frequency
For two alleles Usually labeled p and q = 1 – p
For more than 2 alleles Usually labeled pA, pB, pC ...
… subscripts A, B and C indicate allele name

27
Genotype
The pair of alleles carried by an individual If there are n alternative alleles … … there will be n(n+1)/2 possible genotypes
Homozygotes The two alleles are in the same state
Heterozygotes The two alleles are different

28
The simple part…
Genotype frequencies lead to allele frequencies…
For example, for two alleles: pA = pAA + ½ pAB (> p=P+1/2 H*) pB = pBB + ½ pAB (> q=Q+1/2 H)
However, the reverse is also possible!
*H=2pq

29
Hardy-Weinberg Equilibrium
Relationship described in 1908Hardy, British mathematician Weinberg, German physician
Random union of games Shows n allele frequencies determine n(n+1)/2 genotype frequencies
Large populations

30
Hardy-Weinberg Equilibrium
Explains how Mendelian segregation influences allelic and genotypic frequencies in a population

31
Required Assumptions in Hardy-Weinberg law (1):
Diploid, sexual organism (Parthenogenetic)
Non-overlapping generationsAutosomal locusLarge populationRandom matingEqual genotype frequencies among
sexes

32
Required Assumptions in Hardy-Weinberg law (2):
Absence of natural selection Population is infinitely large, to avoid
effects of genetic drift No mutation No migration
< If assumptions are met, population will be in genetic equilibrium

33
Two expected predictions: Allele frequencies do not change over generations
After one generation of random mating, genotypic frequencies will remain in the following proportions:
p2(frequency of AA)
2pq(frequency of Aa)
q2(frequency of aa)
*p = allelic frequency of A*q = allelic frequency of a
*p2 + 2pq + q2 = 1

34
population is at equilibrium
A(p)=0.5a(q)=0.5
A(p)=0.5AA(p2)0.5�x�0.5�=�0.25
Aa(pq)0.5�x�0.5�=�0.25
a(q)=0.5Aa(pq)0.5�x�0.5�=�0.25
aa(q2)0.5�x�0.5�=�0.25

35
Random Mating:Mating Type Frequencies
P2
2PH
2PQ
H2
2QH
Q2

36
Mendelian Segregation:Offspring Genotype Frequencies
P2
2PH2PQ
H2
2QHQ2
P2
PHPH _
2PQ__
¼H2 ½H2 ¼H2
QH QH_
Q2_ _
_ _
Total 1 p2 2pq q2

37
Conclusion
Genotype frequencies are function of allele frequencies
Equilibrium reached in one generationIndependent of initial genotype
frequenciesRandom mating, etc. required
Conform to binomial expansion

38
Simple HWE Exercise
If the defective alleles of the cystic fibrosis (CFTR) gene have cumulative frequency of 1/50 what is:
The proportion of carriers in the population? p=P+1/2H H=2pq=2(p-P)=0.04
p=0.98 P=0.96 q=0.02Q=0.0004
The proportion of affected children at birth?

39
Frequencies of genotypes AA, Aa, and aa relative to the frequencies of alleles A and a in populations at Hardy-
Weinberg equilibrium
Max. heterozygosityp = q = 0.5

40
Hardy-Weinberg for loci with more than two alleles:
For three alleles (A, B, and C) with frequencies p, q, and r:
Binomial expansion
(p + q + r)2 = p2(AA) + 2pq(AB) + q2(BB) + 2pr(AC) + 2qr(BC) + r2(CC)
For four alleles (A, B, C, and D) with frequencies p, q, r, and s:
(p + q + r + s) 2 = p2(AA) + 2pq(AB) + q2(BB) + 2pr(AC) + 2qr(BC) + r2(CC) + 2ps(AD) + 2qs(BD) + 2rs(CD) + s2(DD)

41
Hardy-Weinberg for X-linked alleles (1):
e.g., Humans and Drosophila (XX = female, XY = male)
XA(p)Xa(q)Y
XA(p)XAXA�
p2
XAXa�
pqXAY�
p
Xa(q)XAXa�
qpXaXa�
q2
XaY�
q

42
Hardy-Weinberg for X-linked alleles (2):
Females Hardy-Weinberg frequencies are the same for any other
locus: p2 + 2pq + q2 = 1
Males Genotype frequencies are the same as allele frequencies: p + q = 1 Recessive X-linked traits are more common among
males.

43
Checking Hardy-Weinberg Equilibrium
A common first step in any genetic study is to verify that the data conforms to Hardy-Weinberg equilibrium
Deviations can occur due to:Systematic errors in genotypingUnexpected population structurePresence of homologous regions in the
genome

44
TestingHardy Weinberg Equilibrium
Consider a sample of 2N alleles
nA alleles of type A nB alleles of type B
nAA genotypes of type AA nAB genotypes of type AB nBB genotypes of type BB

45
nA= nAA + ½ nAB / N
nB= nBB + ½ nAB / N

46
Simple Approach
Calculate allele frequencies (o) and expected counts (e)
Construct chi-squared test statistic
Convenient, but can be inaccurate:especially when one allele is rare