Embed Size (px)
Citation preview
1
Population Distribution and Abundance
Chapter 9
Copyright © The McGraw-Hill Companies, Inc. Permission required for reproduction or display.
2
Outline
• Distribution Limits• Distribution Patterns• Organism Size and Population Density• Commonness and Rarity
3
Introduction
• Ecologists usually define a population as a group of individuals of a single species inhabiting a specific area. Characterized by the number of
individuals and their density. Additional characteristics of a population
include age distributions, growth rates, distribution, and abundance.
4
Distribution Limits
• Physical environment limits geographic distribution of a species. Organisms can only compensate so much
for environmental variation.
5
Niches
• Niche: Summarizes environmental factors that influence growth, survival, and reproduction of a species. Grinnell’s definition focused on the effects
of the physical environment Elton’s definition included biotic and
abiotic factors
6
Niches
• Hutchinson defined niche as: n-dimensional hyper-volume
n equates the number of environmental factors important to survival and reproduction of a species.
Fundamental niche - hypervolume Realized niche includes interactions such
as competition that may restrict environments where a species may live.
7
Kangaroo Distributions and Climate
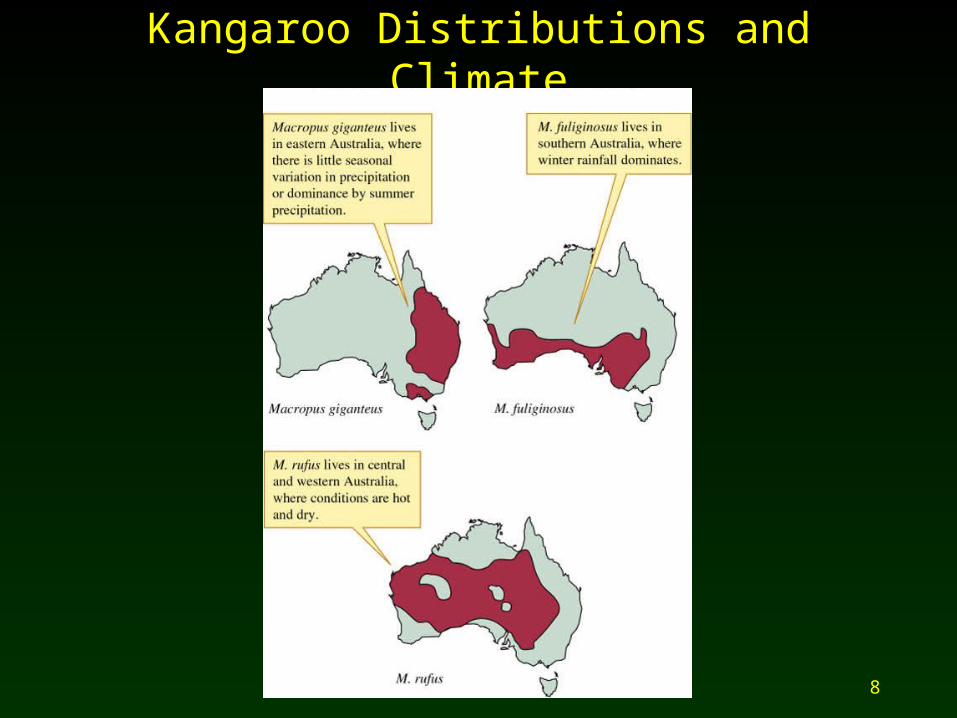
• Caughley found a close relationship between climate and distribution of the three largest kangaroos in Australia. Macropus giganteus - Eastern Grey
Eastern 1/3 of continent. Macropus fuliginosus - Western Grey
Southern and western regions. Macropus rufus - Red
Arid / semiarid interior.
8
Kangaroo Distributions and Climate
9
Kangaroo Distributions and Climate
• Limited distributions may not be directly determined by climate. Climate often influences species
distributions via: Food production Water supply Habitat Incidence of parasites, pathogens and
competitors.
10
Tiger Beetle of Cold Climates
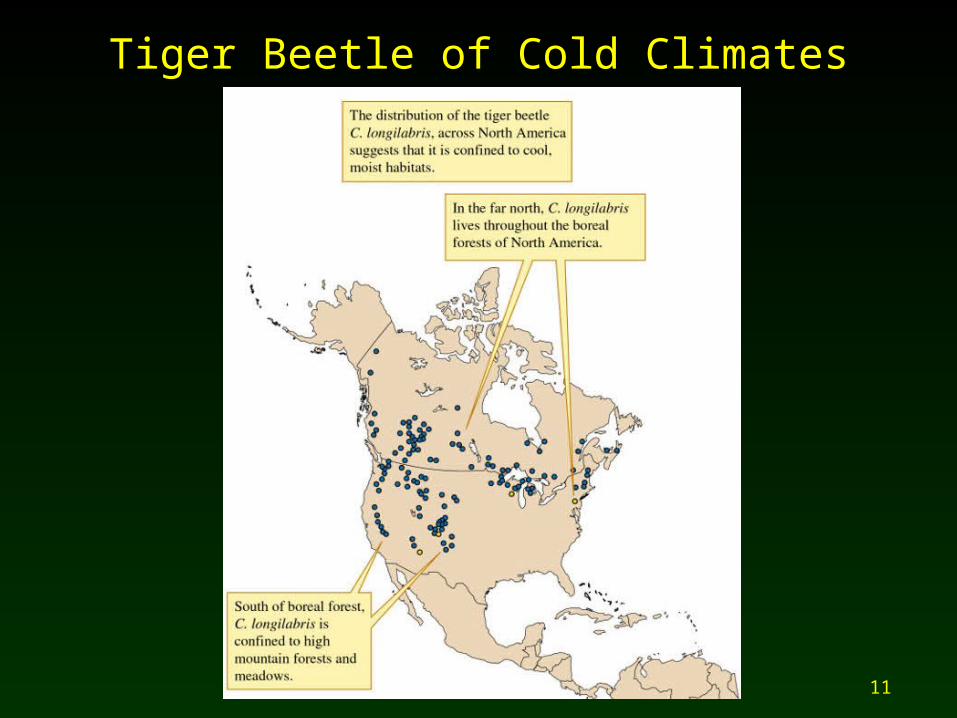
• Tiger Beetle (Cicindela longilabris) lives at higher latitudes and elevations than most other species in NA. Schultz et. al. found metabolic rates of C.
longilabris are higher and preferred temperatures lower than most other species.
Supports generalization that the physical environment limits species distributions.
11
Tiger Beetle of Cold Climates
12
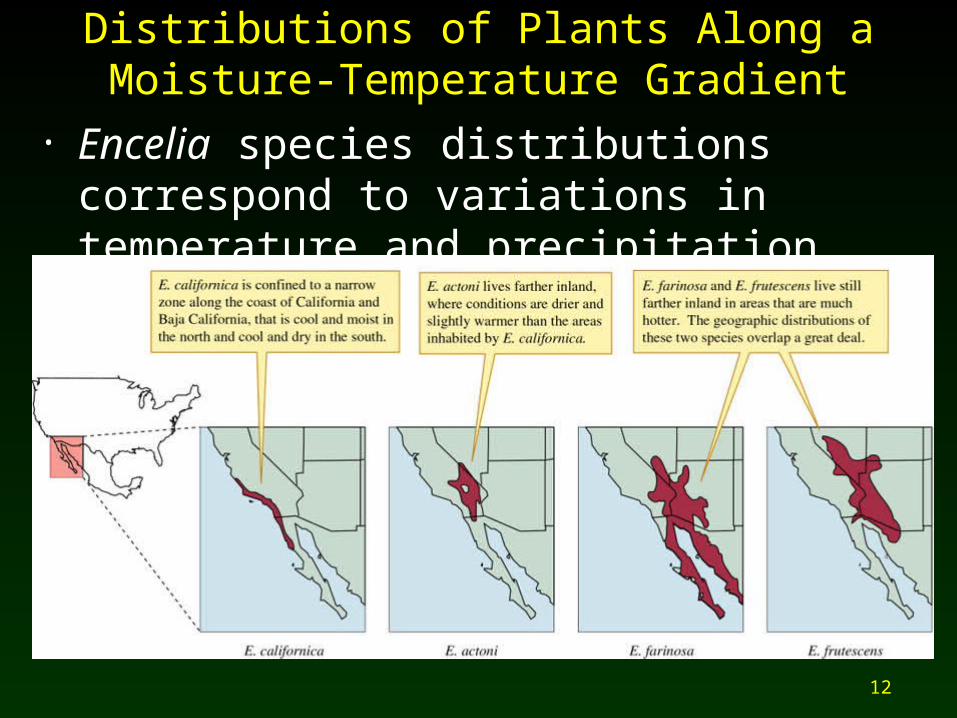
Distributions of Plants Along a Moisture-Temperature Gradient
• Encelia species distributions correspond to variations in temperature and precipitation.
13
Distributions of Barnacles Along an Intertidal Exposure Gradient
• Organisms living in an intertidal zone have evolved to different degrees of resistance to drying. Barnacles show distinctive patterns of
zonation within intertidal zone. Connell found Chthamalus stellatus
restricted to upper levels while Balanus balanoides is limited to middle and lower levels.
14
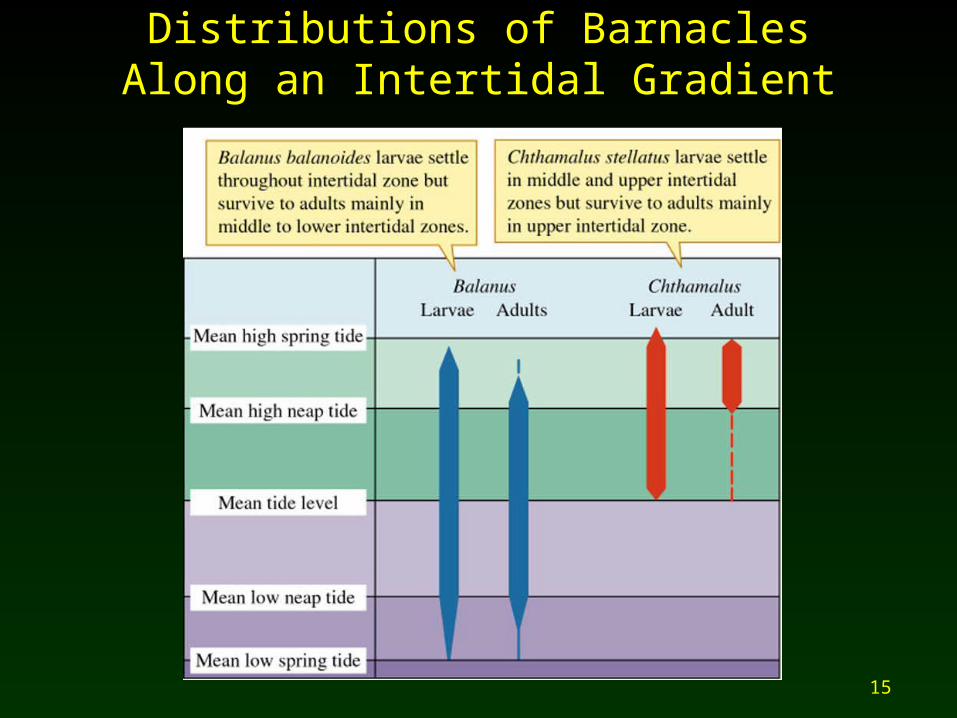
Distributions of Barnacles Along an Intertidal Gradient
• Balanus appears to be more vulnerable to desiccation, excluding it from the upper intertidal zone. Chthamalus adults appear to be excluded
from lower areas by competition with Balanus.
15
Distributions of Barnacles Along an Intertidal Gradient
16
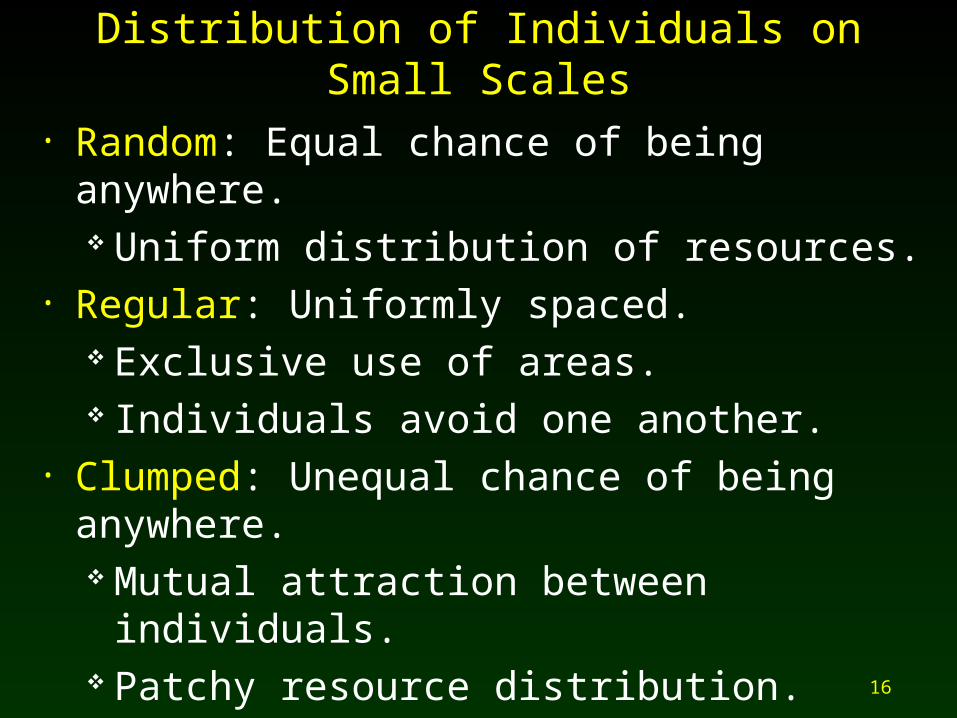
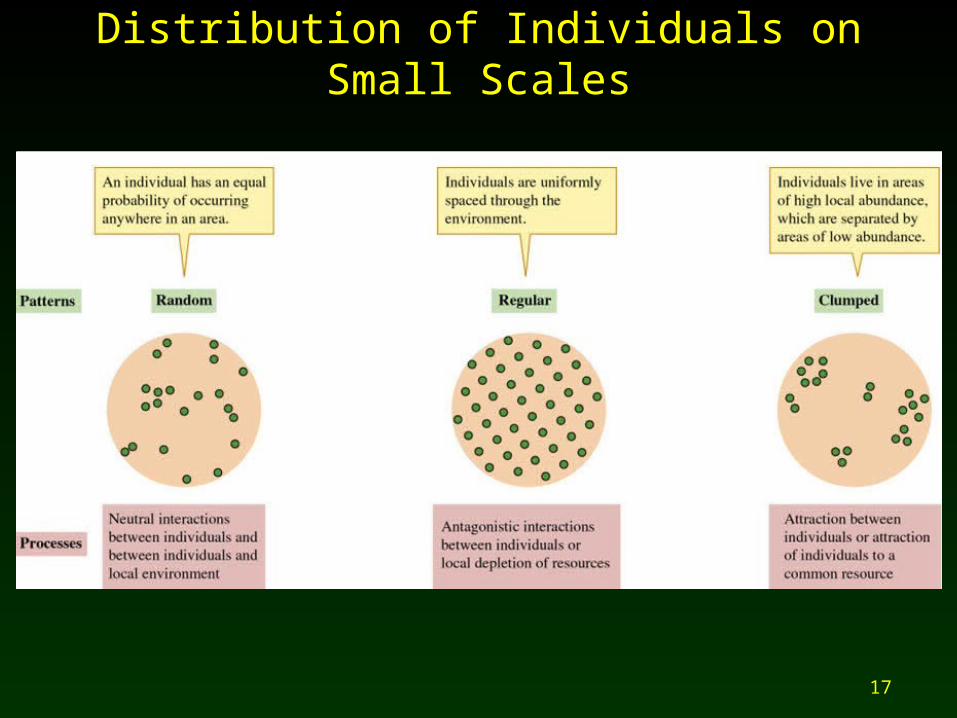
Distribution of Individuals on Small Scales
• Random: Equal chance of being anywhere. Uniform distribution of resources.
• Regular: Uniformly spaced. Exclusive use of areas. Individuals avoid one another.
• Clumped: Unequal chance of being anywhere. Mutual attraction between individuals. Patchy resource distribution.
17
Distribution of Individuals on Small Scales
18
Distribution of Tropical Bee Colonies
• Hubbell and Johnson predicted aggressive bee colonies would show regular distributions while non-aggressive species would show random or clumped distributions. As predicted, four species with regular
distributions were highly aggressive. Fifth was non-aggressive and randomly
distributed. Prospective nest sites marked with
pheromones.
19
Distributions of Desert Shrubs
• Traditional theory suggests desert shrubs are regularly spaced due to competition. Phillips and MacMahon found distribution
of desert shrubs changes from clumped to regular patterns as they grow.
Young shrubs clumped for (3) reasons: Seeds germinate at safe sites Seeds not dispersed from parent areas Asexual reproduction
20
Distributions of Desert Shrubs
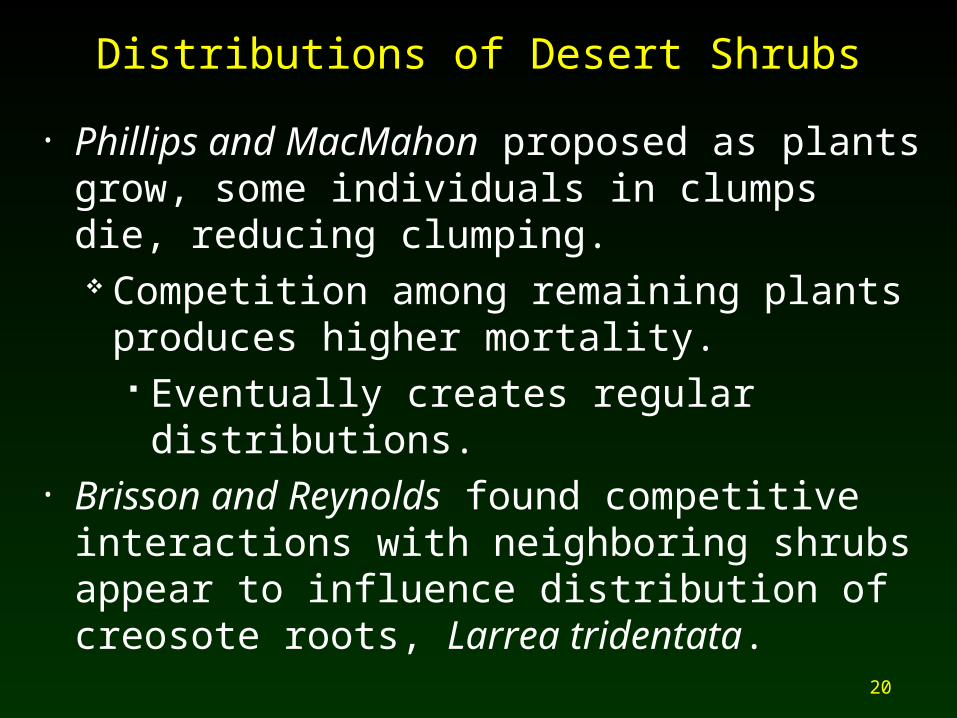
• Phillips and MacMahon proposed as plants grow, some individuals in clumps die, reducing clumping. Competition among remaining plants
produces higher mortality. Eventually creates regular distributions.
• Brisson and Reynolds found competitive interactions with neighboring shrubs appear to influence distribution of creosote roots, Larrea tridentata.
21
Distributions of Individuals on Large Scales
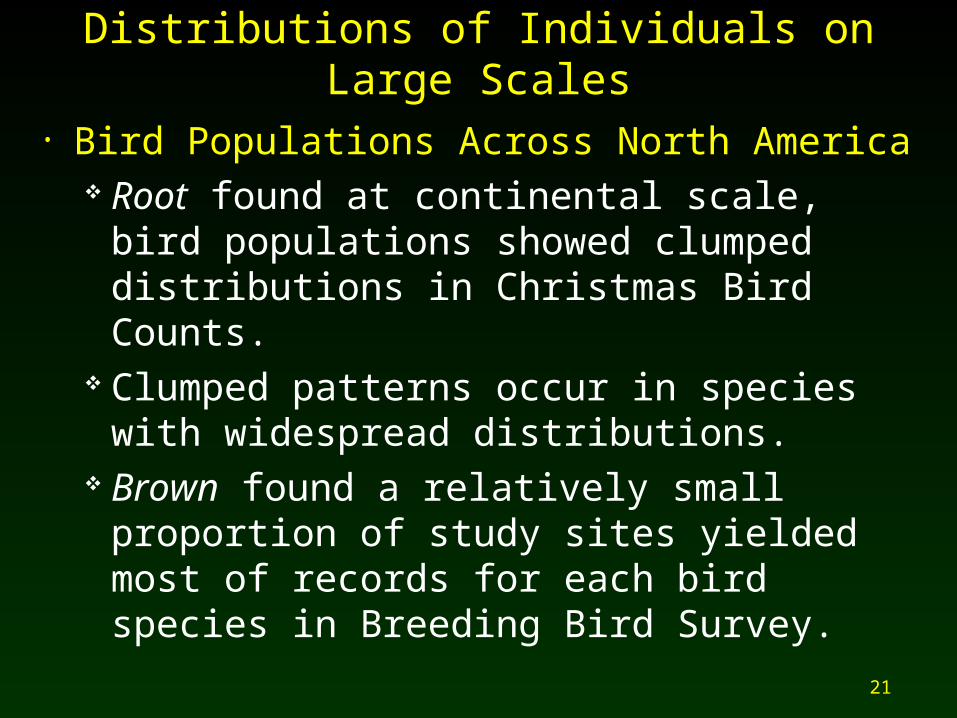
• Bird Populations Across North America Root found at continental scale, bird
populations showed clumped distributions in Christmas Bird Counts.
Clumped patterns occur in species with widespread distributions.
Brown found a relatively small proportion of study sites yielded most of records for each bird species in Breeding Bird Survey.
22
Plant Distributions Along Moisture Gradients
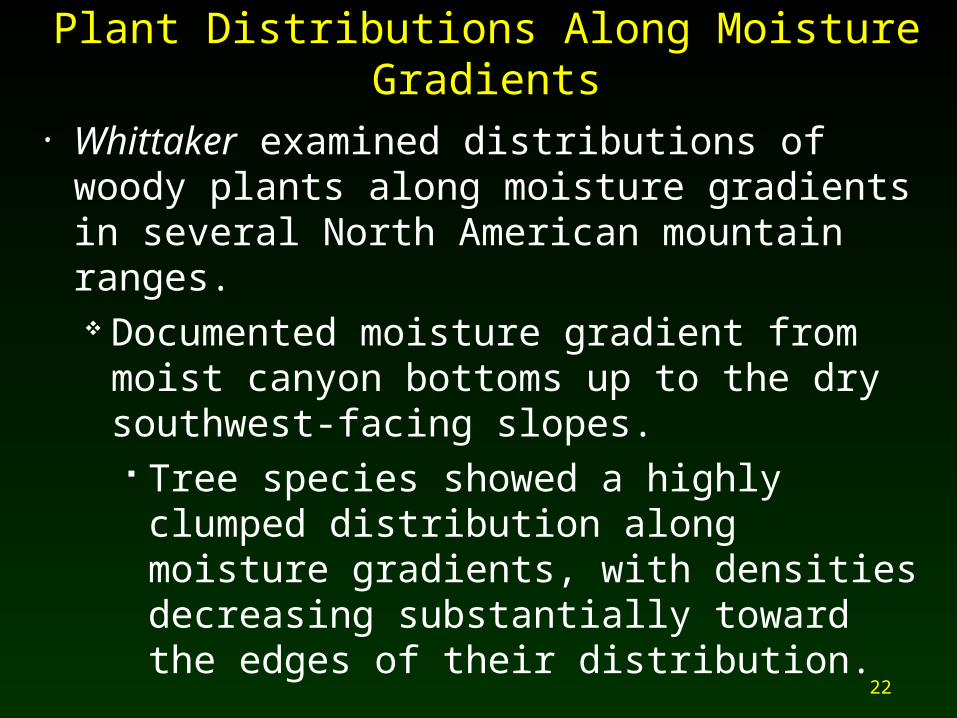
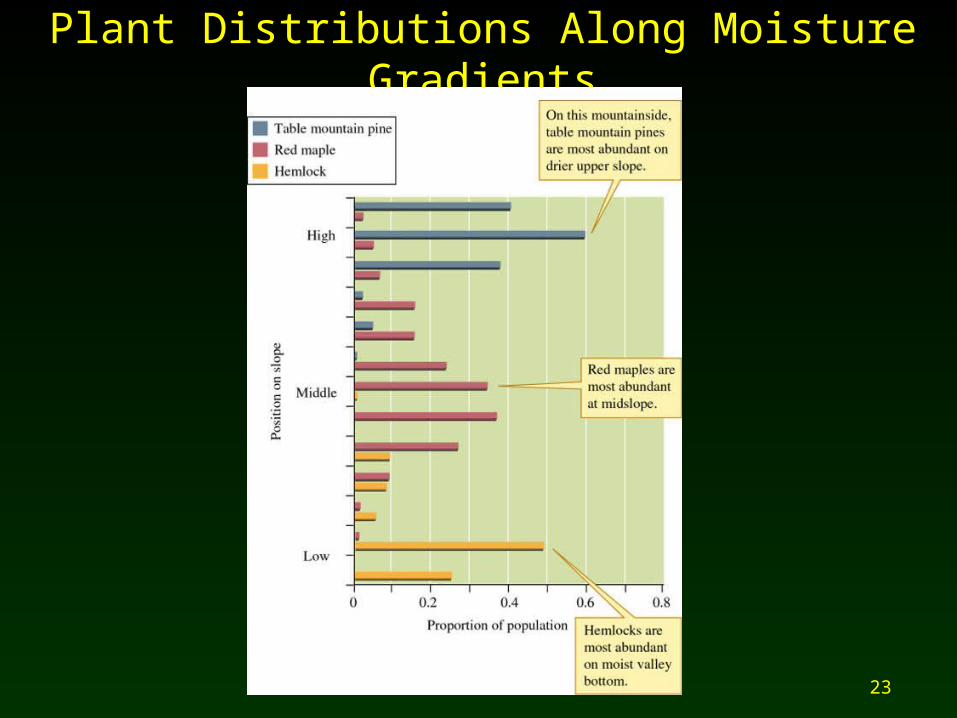
• Whittaker examined distributions of woody plants along moisture gradients in several North American mountain ranges. Documented moisture gradient from moist
canyon bottoms up to the dry southwest-facing slopes.
Tree species showed a highly clumped distribution along moisture gradients, with densities decreasing substantially toward the edges of their distribution.
23
Plant Distributions Along Moisture Gradients
24
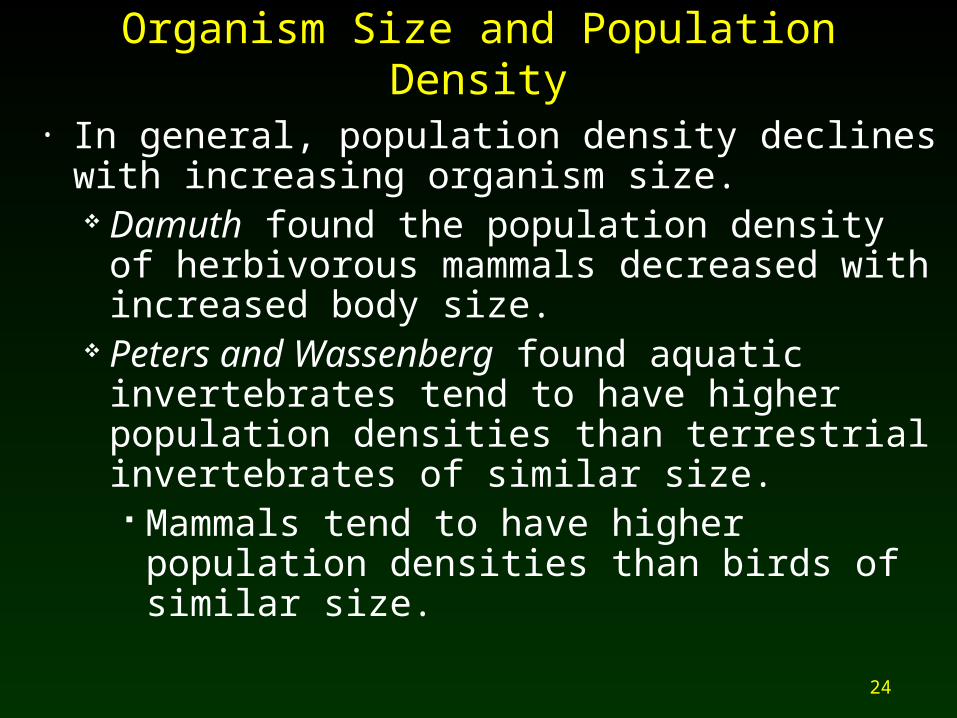
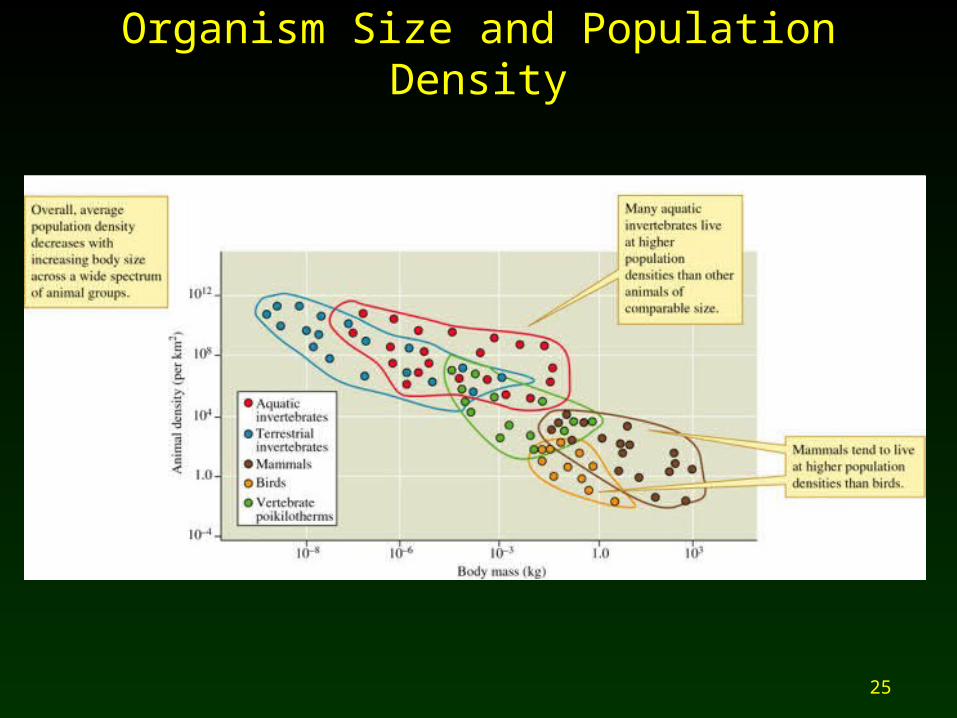
Organism Size and Population Density
• In general, population density declines with increasing organism size. Damuth found the population density of
herbivorous mammals decreased with increased body size.
Peters and Wassenberg found aquatic invertebrates tend to have higher population densities than terrestrial invertebrates of similar size.
Mammals tend to have higher population densities than birds of similar size.
25
Organism Size and Population Density
26
Plant Size and Population Density
• Plant population density decreases with increasing plant size. Underlying details are very different.
Tree seedlings can live at very high densities, but as the trees grow, density declines progressively until mature trees are at low densities.
27
Commonness and Rarity
• Rabinowitz devised commonness classification based on (3) factors:
Geographic Range of Species Habitat Tolerance Local Population Size
• Populations that are least threatened by extinction, have extensive geographic ranges, broad habitat tolerances, and some large local populations. All seven other combinations create some
kind of rarity.
28
Rarity
• Rarity I Extensive Range, Broad Habitat
Tolerance, Small Local Populations Peregrine Falcon
• Rarity II Extensive Rage, Large Populations,
Narrow Habitat Tolerance Passenger Pigeon
29
Rarity
• Rarity III Restricted Range, Narrow Habitat
Tolerance, Small Populations California Condor
30
Review
• Distribution Limits• Distribution Patterns• Organism Size and Population Density• Commonness and Rarity