Embed Size (px)
Citation preview
Phylogeny and Population Structure of Brown Rot- and MokoDisease-Causing Strains of Ralstonia solanacearum Phylotype II
G. Cellier,a,b* B. Remenant,a,c* F. Chiroleu,a P. Lefeuvre,a and P. Priora,c
CIRAD, UMR PVBMT, Pôle de Protection des Plantes, Saint-Pierre, La Réunion, Francea; AgroParisTech, ENGREF, Paris, Franceb; and INRA, Département Santé des Plantes etEnvironnement, Paris, Francec
The ancient soilborne plant vascular pathogen Ralstonia solanacearum has evolved and adapted to cause severe damage in anunusually wide range of plants. In order to better describe and understand these adaptations, strains with very similar lifestylesand host specializations are grouped into ecotypes. We used comparative genomic hybridization (CGH) to investigate three par-ticular ecotypes in the American phylotype II group: (i) brown rot strains from phylotypes IIB-1 and IIB-2, historically known asrace 3 biovar 2 and clonal; (ii) new pathogenic variants from phylotype IIB-4NPB that lack pathogenicity for banana but can in-fect many other plant species; and (iii) Moko disease-causing strains from phylotypes IIB-3, IIB-4, and IIA-6, historically knownas race 2, that cause wilt on banana, plantain, and Heliconia spp. We compared the genomes of 72 R. solanacearum strains,mainly from the three major ecotypes of phylotype II, using a newly developed pangenomic microarray to decipher their popula-tion structure and gain clues about the epidemiology of these ecotypes. Strain phylogeny and population structure were recon-structed. The results revealed a phylogeographic structure within brown rot strains, allowing us to distinguish European out-break strains of Andean and African origins. The pangenomic CGH data also demonstrated that Moko ecotype IIB-4 isphylogenetically distinct from the emerging IIB-4NPB strains. These findings improved our understanding of the epidemiologyof important ecotypes in phylotype II and will be useful for evolutionary analyses and the development of new DNA-based diag-nostic tools.
Ralstonia solanacearum (Smith) Yabuuchi et al. (45), a highlydestructive and widespread bacterial plant pathogen, is surely
one of the most successful vascular bacteria. This soilborne xyleminhabitant encompasses thousands of different strains distributedworldwide and causes bacterial wilt disease in more than 50 bo-tanical families (21). As a highly genetically and phenotypicallyheterogeneous plant pathogen species, R. solanacearum is an ex-cellent case for study in order to understand genomic evolutionmechanisms in general and plant adaptation in particular. Classi-fication of R. solanacearum has undergone many changes duringthe past 20 years. Historically, the biodiversity of strains was char-acterized by the race and biovar system, based on phenotypic traits(2–4). Nevertheless, this classification evolved with the multipletechniques employed to assay genomic differences among closelyrelated bacterial species, strains, or lineages. The new tools devel-oped during the genomics era, combined with phenotypic andgeospatial data, allow the assessment of relationships betweenwidely heterogeneous organisms as regards their physiology, ecol-ogy, and gene content (7, 35). The latest hierarchical classificationscheme based on partial sequence analysis resulted in better un-derstanding of the phylogeny within this species complex; classi-fications were unified into four distinct phylotypes, relating to thegeographical origins of strains (13, 41). This phylotype classifica-tion largely correlates with the geographic origin and evolutionarypast of strains (41), which are assigned to Asian (phylotype I),American (phylotype II), African (phylotype III), and Indonesian(phylotype IV) phylotypes. Phylotype IV hosts the two closelyrelated species Ralstonia syzygii (the agent of Sumatra disease ofclove) and the banana blood disease bacterium (BDB) (36, 40).
The breakthrough of DNA-based technologies brought newinsights into the diversity and evolution of pathogens (22), andnovel classifications emerged. R. solanacearum is no exception;many studies revisited its diversity at the genus level (8, 9, 40), the
species complex level (14, 26, 41), or the ecological level (10, 37,39). Hence, as a high-throughput alternative to the full sequenc-ing of entire bacterial genomes, the pangenomic comparativegenomic hybridization (CGH) microarray developed in this studywas designed for fine investigation of the phylogenetic diversity ofR. solanacearum.
A former study used a CGH microarray approach to estimatethe distribution of genes among 18 R. solanacearum strains dis-tributed in the phylogeny (19). That microarray was designedfrom the GMI1000 genome sequence (phylotype I) and encom-passed about 5,000 oligonucleotides. Data from the whole genomeconfirmed the distribution of the phylogeny into four distinctphylotypes and brought a first estimation of the core genome con-tent. However, the design of that CGH microarray was restrictedto one phylotype I strain only, inducing a bias against estimatingspecific genes of the three other phylotypes. On the basis of thatstudy, going one step further, we chose here to develop a pan-genomic microarray from available sequenced genomes of sixstrains, distributed in the phylogeny of R. solanacearum.
As a first step, a genomic database was constituted around R.
Received 5 August 2011 Accepted 10 January 2012
Published ahead of print 20 January 2012
Address correspondence to G. Cellier, [email protected].
* Present address: G. Cellier, Agence Nationale de la Sécurité Sanitaire (ANSES),Laboratoire de la Santé des Végétaux, Unité Ravageurs et Pathogènes Tropicaux,Saint-Pierre, La Réunion, France; B. Remenant, University of Wisconsin—Madison,Department of Plant Pathology, Madison, Wisconsin, USA.
Supplemental material for this article may be found at http://aem.asm.org/.
Copyright © 2012, American Society for Microbiology. All Rights Reserved.
doi:10.1128/AEM.06123-11
0099-2240/12/$12.00 Applied and Environmental Microbiology p. 2367–2375 aem.asm.org 2367
Dow
nloa
ded
from
http
s://j
ourn
als.
asm
.org
/jour
nal/a
em o
n 14
Nov
embe
r 20
21 b
y 11
9.19
4.21
0.15
7.
solanacearum, three genomes of which were recently fully se-quenced and annotated (30), in addition to the three other ge-nomes already available (18, 31). In addition to confirming theprevious phylotype classification, this work highlighted the re-markable heterogeneity of this bacterial species between phylo-types and the probable need to further reshape its classificationinto at least three genomic species (30). Also, since the ancestralRalstonia prototype is assumed to be a plant pathogen (15, 19),study of the extent of the diversity of this genus, along with theevolutionary pathways involved, is of major importance for abroad understanding of pathogen evolution.
We hypothesized that there was much more biodiversity todiscover from genomic analysis of phylotype II strains of R. so-lanacearum, namely, cold-tolerant potato brown rot strains (IIB-1), previously recognized to be clonal after various neutral markerapproaches (5, 27, 34), tropical Moko disease-causing strains(IIB-4), and emerging strains (IIB-4NPB). We thus focus on phy-logenetically closely related phylotype II groups of strains withwell-characterized and diverging ecological and phenotypicaltraits, in an attempt to reconstruct their epidemiological pathwaysalong with the acquisition of their lifestyles.
MATERIALS AND METHODSBacterial strains. A set of 72 R. solanacearum strains was selected to coverthe known genetic diversity within the R. solanacearum species complex,especially in phylotype II (n � 60) (see Table S1 in the supplementalmaterial). Pathotypes of strains were previously assessed (5) on geneticresources obtained from potato (Solanum tuberosum), tomato (Solanumlycopersicum), eggplant (Solanum melongena), and banana (Musa spp.).Ralstonia pickettii strain LMG5942T was included as an outgroup. Strainswere obtained from different bacterial collections maintained at the Cen-tre de Coopération Internationale en Recherche Agronomique pour leDéveloppement (CIRAD; Saint Pierre, Réunion Island; Le Lamentin,Martinique, French West Indies), Laboratoire National de la Protectiondes Végétaux (LNPV; Angers, France), Institut National de la RechercheAgronomique (INRA; Rennes, France), University of Queensland (Bris-bane, Australia), and Collection Française de Bactéries Phytopathogènes(CFBP; Angers, France).
Probe design and microarray manufacture. Biological probes (n �10,761) were designed from six sequenced and fully annotated genomes ofR. solanacearum: GMI1000 (31), Molk2 and IPO1609 (18), CMR15,CFBP2957, and PSI07 (30). These six genomic sequences are publiclyavailable through the online MaGe interface (https://www.genoscope.cns.fr/agc/microscope/about/collabprojects.php?P_id�67). Probe de-sign was performed by Imaxio (Clermont-Ferrand, France) using the fol-lowing strategy. Two 60-mer probes were designed from each codingsequence (CDS). Three groups of probes, called “specific,” “core,” or“variable” according to their target specificity, were constituted. The “spe-cific” group was composed of probes specifically targeting a strain; theseprobes were encoded as “CFBP,” “CMR,” “GMI,” “IPO,” “MOLK,” or“PSI” depending on the target. The “core” group comprised probes tar-geting all orthologous genes in the six sequenced genomes. Finally, the“variable” group was composed of probes targeting genes in at least two,but not all, sequenced genomes. To avoid redundancy on orthologousgenes, probe filtering was performed using the BLASTN algorithm (1),based on an 80% minimum match, a melting temperature (Tm) of 77°C �9°C, and a G�C content of 57% � 20% (see Fig. S1 in the supplementalmaterial). Hence, only one probe was designed per CDS or among or-thologous CDSs. Microarrays were manufactured by Agilent Technolo-gies (Santa Clara, CA) using in situ synthesis. The final set of probes,randomly implemented on the array surface, was composed of 3,317“core,” 3,631 “variable,” and 3,963 “specific” probes. Hybridization qual-ity and interslide reproducibility were assessed with 10 replicates of 300
biological probes: 275 “core” group and 25 “variable” group probes, alongwith the microarray manufacturer controls. Negative controls were alsoadded, with 35 probes designed to target the close relative Cupriavidustaiwanensis and 7 random-sequence-based probes designed to be non-complementary with any sequenced R. solanacearum genomes.
DNA labeling and hybridization. Overnight liquid cultures were pel-leted at 5,400 rpm and were washed with 500 ml of 1 M NaCl beforegenomic DNA was purified by using a DNeasy Blood & Tissue kit (Qiagen,Hilden, Germany) according to the manufacturer’s recommendations.Genomic DNA was labeled with using Cy3 or Cy5 dye, according to themethod of Guidot et al. (19).
Labeled products were purified by using a CyScribe GFX purificationkit (GE Healthcare, Bucks, United Kingdom) according to the manufac-turer’s recommendations. DNA was adjusted at a concentration of 70 ng ·�l�1 in high-performance liquid chromatography (HPLC)-grade waterusing a NanoDrop 8000 spectrophotometer (NanoDrop Technologies,Wilmington, DE), for an average dye labeling concentration of 12 pmol ·liter�1. Hybridizations were done overnight (for approximately 16 h) inthe G2545A microarray hybridization oven (Agilent Technologies) byfollowing the 8�15K Custom CGH microarray protocol from AgilentTechnologies (reference G4410-90010).
Hybridizations of the six sequenced genomes were repeated threetimes to assess interslide reproducibility, and strain CMR15 genomicDNA labeled with Cy5 was included in each hybridization as a referencefor further reproducibility tests. Hybridizations of the other strains werenot repeated to verify reproducibility (see Results).
Image scanning and data analysis. Slides were scanned at a 5-�mresolution using the G2565CA scanner managed by Scan Control soft-ware, version 8.5 (Agilent Technologies). Data were extracted from the16-bit tagged-image format file (TIFF) image with Feature Extractionsoftware, version 10.5.1.1 (Agilent Technologies).
Data manipulation and statistical analysis were performed with thefree statistical software R, version 2.11.1 (29). Spot intensities were calcu-lated as the difference between the median foreground and backgroundintensities, normalized according to the standard normal deviationmethod, along with a base 2 logarithm. The dispersion of the mass distri-bution was assessed using a kernel density method with a Gaussian kernel(32, 33). To distinguish between the positive and negative responses, aresponse threshold was estimated independently for each hybridization asthe intensity value of the minimum density between the two peaks of thespot distribution. This response threshold allowed us to estimate tworesponses of probes based on their binary signals: a signal of 1 representedthe presence of a gene, and a signal of zero represented its absence. Allfurther analyses were performed on this binary data set.
Phylogeny and population structure reconstruction. The phylogenyof R. solanacearum was reconstructed using MrBayes, version 3.2, with thebinary evolution model implemented in and allowing for variation ofsubstitution rates among sites. Two runs with four Markov chains wereconducted simultaneously for 3,000,000 generations starting from ran-dom initial trees, sampled every 500 generations. Variations in the maxi-mum-likelihood (ML) scores for these samples were examined graphi-cally with Tracer, version 1.5 (A. Rambaut and A. J. Drummond, 2007;http://beast.bio.ed.ac.uk/Tracer). After discarding of the trees generatedprior to the stabilization of ML scores (burn in, 10%), the consensusphylogeny and posterior probability of the nodes were determined. Treeswere edited using FigTree, version 1.3.1 (A. Rambaut, 2007; http://tree.bio.ed.ac.uk/software/figtree/).
Population structure was estimated using STRUCTURE, version 2.3.3(28). This iterative-model-based analysis aimed to assess the populationstructure with the assignment of individuals to “K” clusters, allowing foradmixture. To infer the number of groups, a fully Bayesian process (28)was run with different values for the number of clusters (K). Analysislengths were set to a burning period of 50,000 iterations followed by100,000 iterations of simulation. A total of 20 independent simulationswere performed, with K ranging from 1 to 10. STRUCTURE would attri-
Cellier et al.
2368 aem.asm.org Applied and Environmental Microbiology
Dow
nloa
ded
from
http
s://j
ourn
als.
asm
.org
/jour
nal/a
em o
n 14
Nov
embe
r 20
21 b
y 11
9.19
4.21
0.15
7.
bute a probability, Pr(X|K) given the data (X), and the log Pr(X|K) wasused to determine the more likely number of clusters by following themethod described by Evanno et al. (11). STRUCTURE software also givesthe assignment probabilities of each individual for each cluster, and wethen inferred the most probable groups for each individual.
RESULTSMicroarray validation. The specificity and sensitivity of the pan-genomic CGH microarray were estimated through the gene con-tent by comparing results from the genome sequences and mi-croarray probing. First, all probes designed as negative controlswere always given a negative response. The data showed that morethan 98.1% of the genes found by the sequencing of the six refer-ence strains were retrieved by the pangenomic microarray, but1.9% of probe responses could be considered false-negative re-sponses. The proportion of false-positive probes was estimated tobe lower than 4.8% and corresponded to positive probes matchinga genome different from that for which they were designed.
The reproducibility of microarray hybridizations was assessedusing the replicated probes, including the 300 replicated probes oneach array, which showed an interslide reproducibility of 97.6%,and the 85 replicated CMR15 (III-29) strains labeled with Cy5,which showed an interslide reproducibility of 93.4% and an in-traslide reproducibility of 99.6% on the same array. Comparisonof the 3 replicates of Cy3-labeled CMR15 with the 3 replicates ofCy5-labeled CMR15 showed a reproducibility of 96.7%.
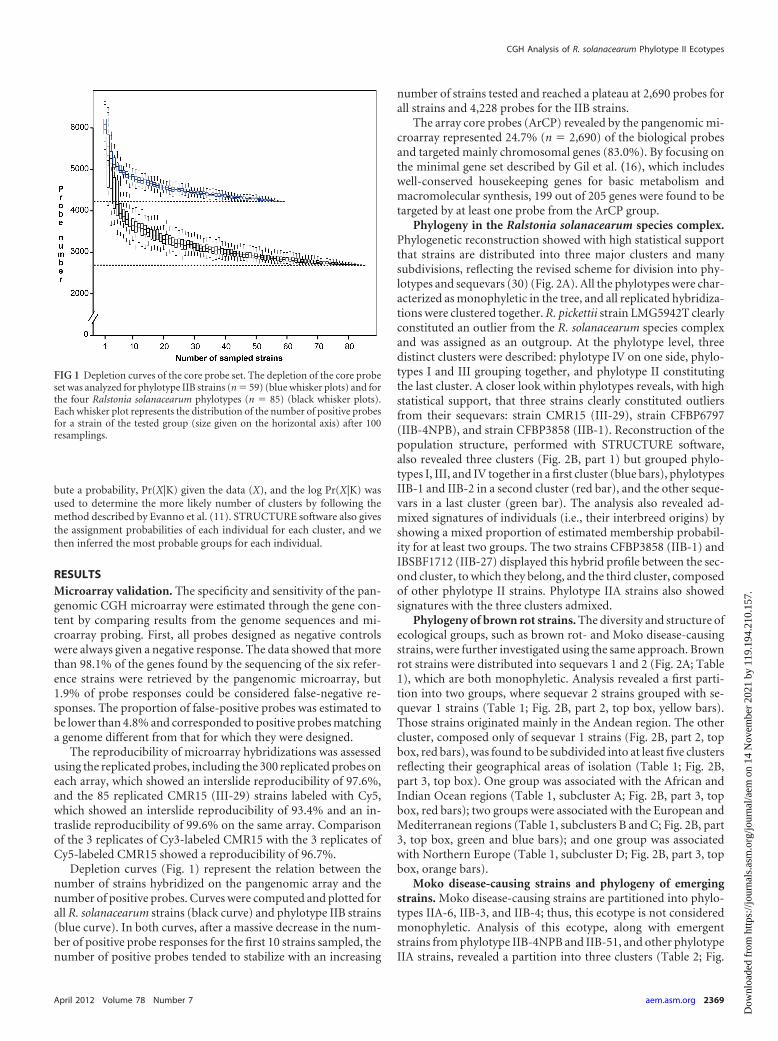
Depletion curves (Fig. 1) represent the relation between thenumber of strains hybridized on the pangenomic array and thenumber of positive probes. Curves were computed and plotted forall R. solanacearum strains (black curve) and phylotype IIB strains(blue curve). In both curves, after a massive decrease in the num-ber of positive probe responses for the first 10 strains sampled, thenumber of positive probes tended to stabilize with an increasing
number of strains tested and reached a plateau at 2,690 probes forall strains and 4,228 probes for the IIB strains.
The array core probes (ArCP) revealed by the pangenomic mi-croarray represented 24.7% (n � 2,690) of the biological probesand targeted mainly chromosomal genes (83.0%). By focusing onthe minimal gene set described by Gil et al. (16), which includeswell-conserved housekeeping genes for basic metabolism andmacromolecular synthesis, 199 out of 205 genes were found to betargeted by at least one probe from the ArCP group.
Phylogeny in the Ralstonia solanacearum species complex.Phylogenetic reconstruction showed with high statistical supportthat strains are distributed into three major clusters and manysubdivisions, reflecting the revised scheme for division into phy-lotypes and sequevars (30) (Fig. 2A). All the phylotypes were char-acterized as monophyletic in the tree, and all replicated hybridiza-tions were clustered together. R. pickettii strain LMG5942T clearlyconstituted an outlier from the R. solanacearum species complexand was assigned as an outgroup. At the phylotype level, threedistinct clusters were described: phylotype IV on one side, phylo-types I and III grouping together, and phylotype II constitutingthe last cluster. A closer look within phylotypes reveals, with highstatistical support, that three strains clearly constituted outliersfrom their sequevars: strain CMR15 (III-29), strain CFBP6797(IIB-4NPB), and strain CFBP3858 (IIB-1). Reconstruction of thepopulation structure, performed with STRUCTURE software,also revealed three clusters (Fig. 2B, part 1) but grouped phylo-types I, III, and IV together in a first cluster (blue bars), phylotypesIIB-1 and IIB-2 in a second cluster (red bar), and the other seque-vars in a last cluster (green bar). The analysis also revealed ad-mixed signatures of individuals (i.e., their interbreed origins) byshowing a mixed proportion of estimated membership probabil-ity for at least two groups. The two strains CFBP3858 (IIB-1) andIBSBF1712 (IIB-27) displayed this hybrid profile between the sec-ond cluster, to which they belong, and the third cluster, composedof other phylotype II strains. Phylotype IIA strains also showedsignatures with the three clusters admixed.
Phylogeny of brown rot strains. The diversity and structure ofecological groups, such as brown rot- and Moko disease-causingstrains, were further investigated using the same approach. Brownrot strains were distributed into sequevars 1 and 2 (Fig. 2A; Table1), which are both monophyletic. Analysis revealed a first parti-tion into two groups, where sequevar 2 strains grouped with se-quevar 1 strains (Table 1; Fig. 2B, part 2, top box, yellow bars).Those strains originated mainly in the Andean region. The othercluster, composed only of sequevar 1 strains (Fig. 2B, part 2, topbox, red bars), was found to be subdivided into at least five clustersreflecting their geographical areas of isolation (Table 1; Fig. 2B,part 3, top box). One group was associated with the African andIndian Ocean regions (Table 1, subcluster A; Fig. 2B, part 3, topbox, red bars); two groups were associated with the European andMediterranean regions (Table 1, subclusters B and C; Fig. 2B, part3, top box, green and blue bars); and one group was associatedwith Northern Europe (Table 1, subcluster D; Fig. 2B, part 3, topbox, orange bars).
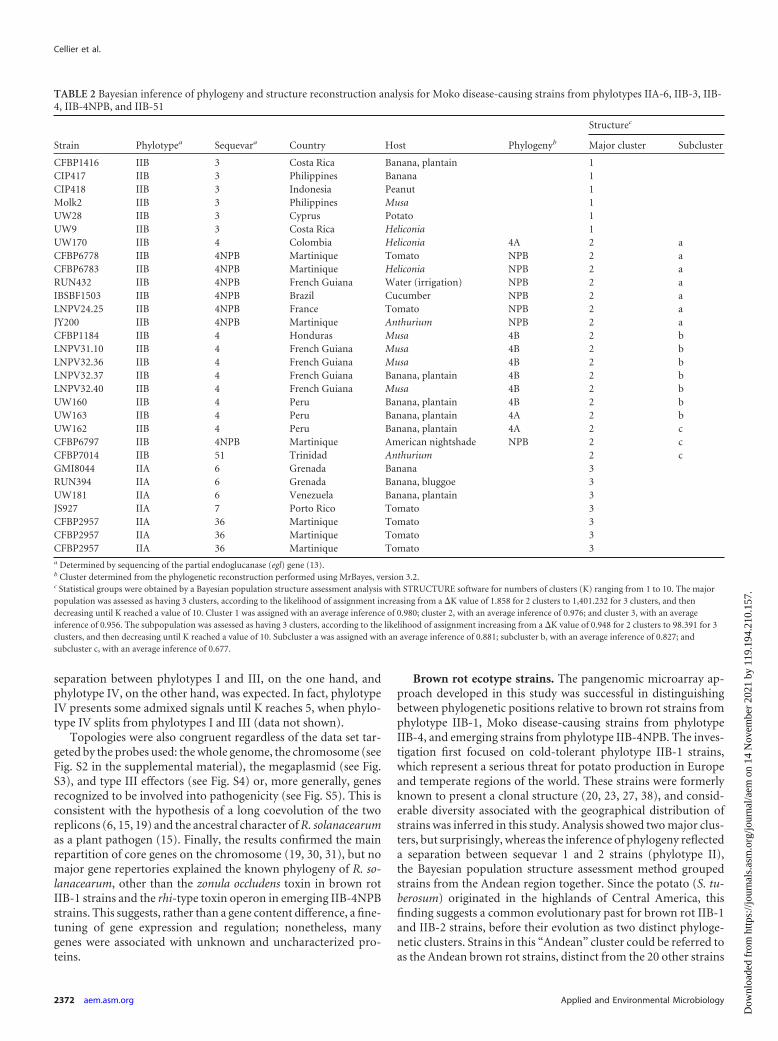
Moko disease-causing strains and phylogeny of emergingstrains. Moko disease-causing strains are partitioned into phylo-types IIA-6, IIB-3, and IIB-4; thus, this ecotype is not consideredmonophyletic. Analysis of this ecotype, along with emergentstrains from phylotype IIB-4NPB and IIB-51, and other phylotypeIIA strains, revealed a partition into three clusters (Table 2; Fig.
FIG 1 Depletion curves of the core probe set. The depletion of the core probeset was analyzed for phylotype IIB strains (n � 59) (blue whisker plots) and forthe four Ralstonia solanacearum phylotypes (n � 85) (black whisker plots).Each whisker plot represents the distribution of the number of positive probesfor a strain of the tested group (size given on the horizontal axis) after 100resamplings.
CGH Analysis of R. solanacearum Phylotype II Ecotypes
April 2012 Volume 78 Number 7 aem.asm.org 2369
Dow
nloa
ded
from
http
s://j
ourn
als.
asm
.org
/jour
nal/a
em o
n 14
Nov
embe
r 20
21 b
y 11
9.19
4.21
0.15
7.
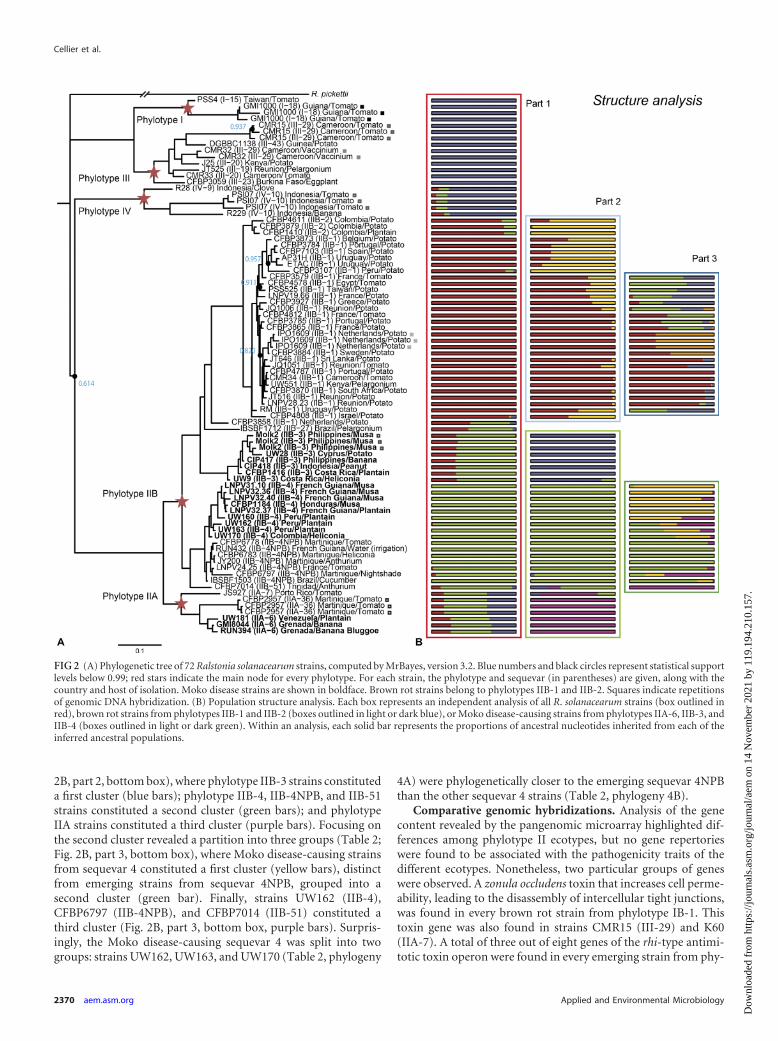
2B, part 2, bottom box), where phylotype IIB-3 strains constituteda first cluster (blue bars); phylotype IIB-4, IIB-4NPB, and IIB-51strains constituted a second cluster (green bars); and phylotypeIIA strains constituted a third cluster (purple bars). Focusing onthe second cluster revealed a partition into three groups (Table 2;Fig. 2B, part 3, bottom box), where Moko disease-causing strainsfrom sequevar 4 constituted a first cluster (yellow bars), distinctfrom emerging strains from sequevar 4NPB, grouped into asecond cluster (green bar). Finally, strains UW162 (IIB-4),CFBP6797 (IIB-4NPB), and CFBP7014 (IIB-51) constituted athird cluster (Fig. 2B, part 3, bottom box, purple bars). Surpris-ingly, the Moko disease-causing sequevar 4 was split into twogroups: strains UW162, UW163, and UW170 (Table 2, phylogeny
4A) were phylogenetically closer to the emerging sequevar 4NPBthan the other sequevar 4 strains (Table 2, phylogeny 4B).
Comparative genomic hybridizations. Analysis of the genecontent revealed by the pangenomic microarray highlighted dif-ferences among phylotype II ecotypes, but no gene repertorieswere found to be associated with the pathogenicity traits of thedifferent ecotypes. Nonetheless, two particular groups of geneswere observed. A zonula occludens toxin that increases cell perme-ability, leading to the disassembly of intercellular tight junctions,was found in every brown rot strain from phylotype IB-1. Thistoxin gene was also found in strains CMR15 (III-29) and K60(IIA-7). A total of three out of eight genes of the rhi-type antimi-totic toxin operon were found in every emerging strain from phy-
FIG 2 (A) Phylogenetic tree of 72 Ralstonia solanacearum strains, computed by MrBayes, version 3.2. Blue numbers and black circles represent statistical supportlevels below 0.99; red stars indicate the main node for every phylotype. For each strain, the phylotype and sequevar (in parentheses) are given, along with thecountry and host of isolation. Moko disease strains are shown in boldface. Brown rot strains belong to phylotypes IIB-1 and IIB-2. Squares indicate repetitionsof genomic DNA hybridization. (B) Population structure analysis. Each box represents an independent analysis of all R. solanacearum strains (box outlined inred), brown rot strains from phylotypes IIB-1 and IIB-2 (boxes outlined in light or dark blue), or Moko disease-causing strains from phylotypes IIA-6, IIB-3, andIIB-4 (boxes outlined in light or dark green). Within an analysis, each solid bar represents the proportions of ancestral nucleotides inherited from each of theinferred ancestral populations.
Cellier et al.
2370 aem.asm.org Applied and Environmental Microbiology
Dow
nloa
ded
from
http
s://j
ourn
als.
asm
.org
/jour
nal/a
em o
n 14
Nov
embe
r 20
21 b
y 11
9.19
4.21
0.15
7.
lotype IIB-4NPB. Variable numbers of genes in this operon werefound in phylotype IIB-4 and IIA strains PSI07 (IV-10),CFBP3059 (III-23), and DGBBC1138 (III-43).
DISCUSSION
Exploration of the diversity within almost clonal strains of R. so-lanacearum was necessary in order to understand their relation-ships and the evolutionary mechanisms that shaped this successfulplant pathogen. Hence, we analyzed the relationships of the 72 R.solanacearum strains, along with R. pickettii strain LMG5942T asthe outgroup strain, using statistical methods for phylogeny re-construction and population structure inference. It is importanthere to point out one of the particular features of this secondanalysis. The STRUCTURE software aims to infer groups of indi-viduals that are under the Hardy-Weinberg equilibrium and link-age equilibrium. While this assumption seems clearly valid forphylotypes I, III, and IV, concerns can be raised regarding phylo-
type II. This phylotype was recently estimated to be partly clonal,which may induce a bias into the population structure inference.The effect of complete population clonality would be that theinferred clustering of individuals would reflect subdivisions of thediversity, as a tree would do, rather than actual populations (12,24). It remains difficult to estimate the degree of disruption causedin our inference, and one must be cautious when interpretingthose particular results.
Unsurprisingly, major divisions and subdivisions of the phy-logeny were congruent with the revised phylotype/sequevarscheme obtained from genome analysis and with previous CGHmicroarray or genomic data analyses (19, 30, 44) that support thesubdivision of the R. solanacearum species complex into three dif-ferent groups: phylotypes I and III, phylotype II, and phylotypeIV. In the population structure analysis, phylotype IV appeared tobe associated with phylotypes I and III, while phylotype II wasdivided into two groups. This result was quite surprising in that a
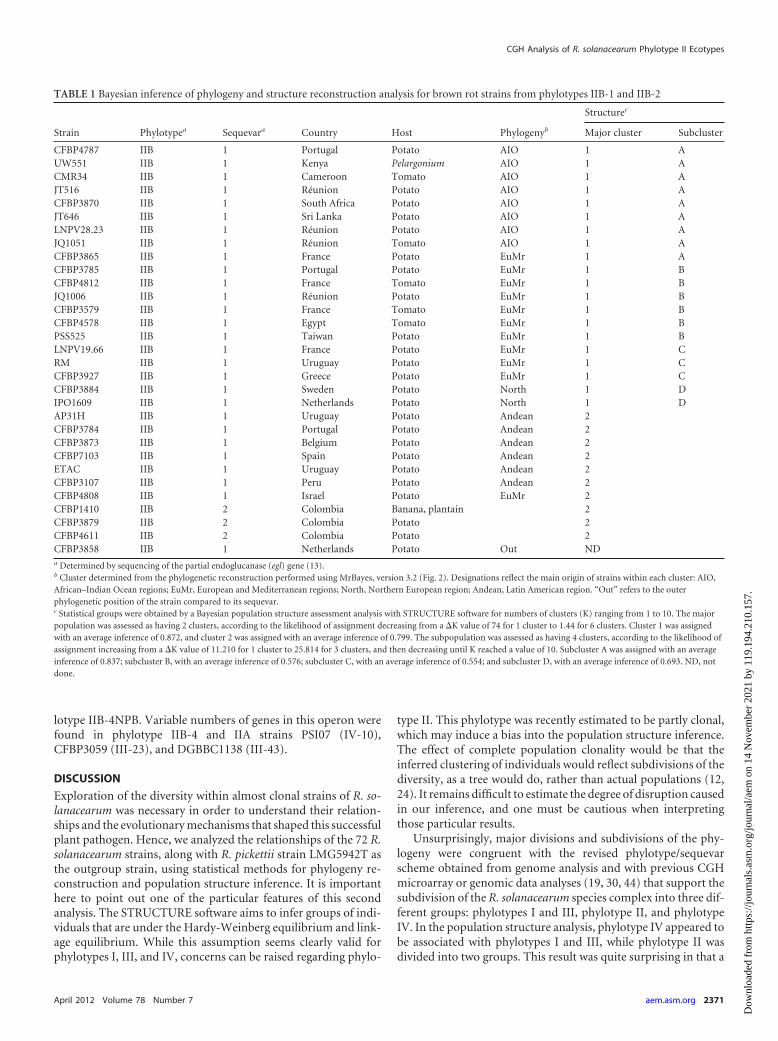
TABLE 1 Bayesian inference of phylogeny and structure reconstruction analysis for brown rot strains from phylotypes IIB-1 and IIB-2
Strain Phylotypea Sequevara Country Host Phylogenyb
Structurec
Major cluster Subcluster
CFBP4787 IIB 1 Portugal Potato AIO 1 AUW551 IIB 1 Kenya Pelargonium AIO 1 ACMR34 IIB 1 Cameroon Tomato AIO 1 AJT516 IIB 1 Réunion Potato AIO 1 ACFBP3870 IIB 1 South Africa Potato AIO 1 AJT646 IIB 1 Sri Lanka Potato AIO 1 ALNPV28.23 IIB 1 Réunion Potato AIO 1 AJQ1051 IIB 1 Réunion Tomato AIO 1 ACFBP3865 IIB 1 France Potato EuMr 1 ACFBP3785 IIB 1 Portugal Potato EuMr 1 BCFBP4812 IIB 1 France Tomato EuMr 1 BJQ1006 IIB 1 Réunion Potato EuMr 1 BCFBP3579 IIB 1 France Tomato EuMr 1 BCFBP4578 IIB 1 Egypt Tomato EuMr 1 BPSS525 IIB 1 Taiwan Potato EuMr 1 BLNPV19.66 IIB 1 France Potato EuMr 1 CRM IIB 1 Uruguay Potato EuMr 1 CCFBP3927 IIB 1 Greece Potato EuMr 1 CCFBP3884 IIB 1 Sweden Potato North 1 DIPO1609 IIB 1 Netherlands Potato North 1 DAP31H IIB 1 Uruguay Potato Andean 2CFBP3784 IIB 1 Portugal Potato Andean 2CFBP3873 IIB 1 Belgium Potato Andean 2CFBP7103 IIB 1 Spain Potato Andean 2ETAC IIB 1 Uruguay Potato Andean 2CFBP3107 IIB 1 Peru Potato Andean 2CFBP4808 IIB 1 Israel Potato EuMr 2CFBP1410 IIB 2 Colombia Banana, plantain 2CFBP3879 IIB 2 Colombia Potato 2CFBP4611 IIB 2 Colombia Potato 2CFBP3858 IIB 1 Netherlands Potato Out NDa Determined by sequencing of the partial endoglucanase (egl) gene (13).b Cluster determined from the phylogenetic reconstruction performed using MrBayes, version 3.2 (Fig. 2). Designations reflect the main origin of strains within each cluster: AIO,African–Indian Ocean regions; EuMr, European and Mediterranean regions; North, Northern European region; Andean, Latin American region. “Out” refers to the outerphylogenetic position of the strain compared to its sequevar.c Statistical groups were obtained by a Bayesian population structure assessment analysis with STRUCTURE software for numbers of clusters (K) ranging from 1 to 10. The majorpopulation was assessed as having 2 clusters, according to the likelihood of assignment decreasing from a �K value of 74 for 1 cluster to 1.44 for 6 clusters. Cluster 1 was assignedwith an average inference of 0.872, and cluster 2 was assigned with an average inference of 0.799. The subpopulation was assessed as having 4 clusters, according to the likelihood ofassignment increasing from a �K value of 11.210 for 1 cluster to 25.814 for 3 clusters, and then decreasing until K reached a value of 10. Subcluster A was assigned with an averageinference of 0.837; subcluster B, with an average inference of 0.576; subcluster C, with an average inference of 0.554; and subcluster D, with an average inference of 0.693. ND, notdone.
CGH Analysis of R. solanacearum Phylotype II Ecotypes
April 2012 Volume 78 Number 7 aem.asm.org 2371
Dow
nloa
ded
from
http
s://j
ourn
als.
asm
.org
/jour
nal/a
em o
n 14
Nov
embe
r 20
21 b
y 11
9.19
4.21
0.15
7.
separation between phylotypes I and III, on the one hand, andphylotype IV, on the other hand, was expected. In fact, phylotypeIV presents some admixed signals until K reaches 5, when phylo-type IV splits from phylotypes I and III (data not shown).
Topologies were also congruent regardless of the data set tar-geted by the probes used: the whole genome, the chromosome (seeFig. S2 in the supplemental material), the megaplasmid (see Fig.S3), and type III effectors (see Fig. S4) or, more generally, genesrecognized to be involved into pathogenicity (see Fig. S5). This isconsistent with the hypothesis of a long coevolution of the tworeplicons (6, 15, 19) and the ancestral character of R. solanacearumas a plant pathogen (15). Finally, the results confirmed the mainrepartition of core genes on the chromosome (19, 30, 31), but nomajor gene repertories explained the known phylogeny of R. so-lanacearum, other than the zonula occludens toxin in brown rotIIB-1 strains and the rhi-type toxin operon in emerging IIB-4NPBstrains. This suggests, rather than a gene content difference, a fine-tuning of gene expression and regulation; nonetheless, manygenes were associated with unknown and uncharacterized pro-teins.
Brown rot ecotype strains. The pangenomic microarray ap-proach developed in this study was successful in distinguishingbetween phylogenetic positions relative to brown rot strains fromphylotype IIB-1, Moko disease-causing strains from phylotypeIIB-4, and emerging strains from phylotype IIB-4NPB. The inves-tigation first focused on cold-tolerant phylotype IIB-1 strains,which represent a serious threat for potato production in Europeand temperate regions of the world. These strains were formerlyknown to present a clonal structure (20, 23, 27, 38), and consid-erable diversity associated with the geographical distribution ofstrains was inferred in this study. Analysis showed two major clus-ters, but surprisingly, whereas the inference of phylogeny reflecteda separation between sequevar 1 and 2 strains (phylotype II),the Bayesian population structure assessment method groupedstrains from the Andean region together. Since the potato (S. tu-berosum) originated in the highlands of Central America, thisfinding suggests a common evolutionary past for brown rot IIB-1and IIB-2 strains, before their evolution as two distinct phyloge-netic clusters. Strains in this “Andean” cluster could be referred toas the Andean brown rot strains, distinct from the 20 other strains
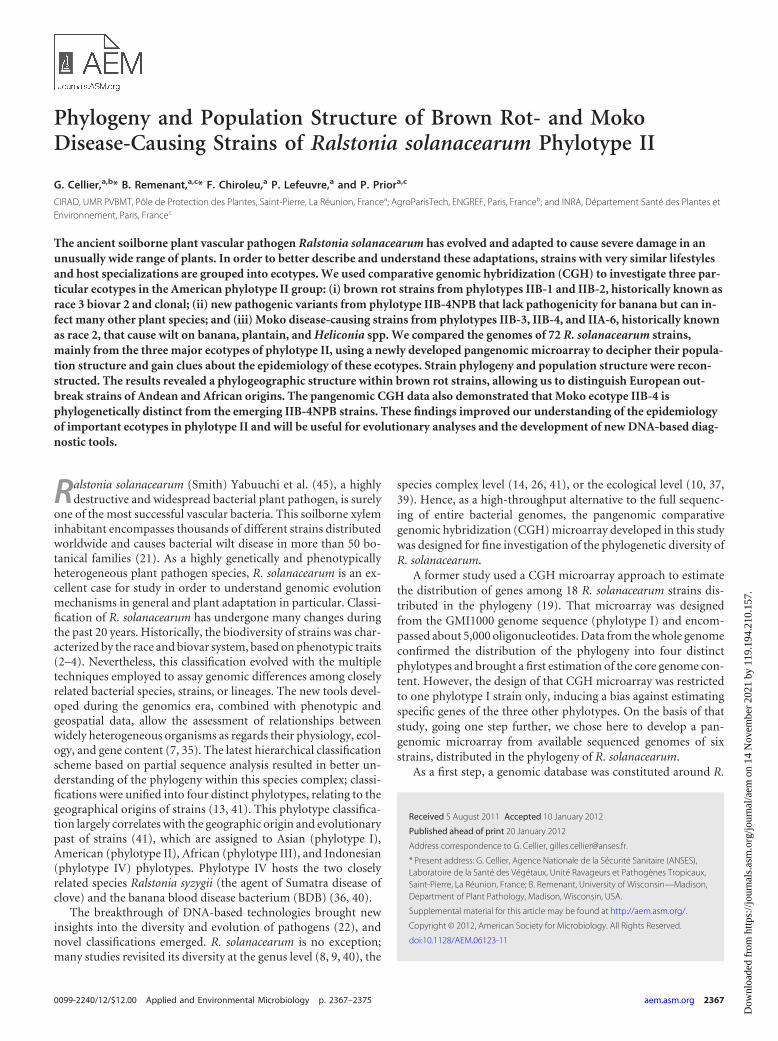
TABLE 2 Bayesian inference of phylogeny and structure reconstruction analysis for Moko disease-causing strains from phylotypes IIA-6, IIB-3, IIB-4, IIB-4NPB, and IIB-51
Strain Phylotypea Sequevara Country Host Phylogenyb
Structurec
Major cluster Subcluster
CFBP1416 IIB 3 Costa Rica Banana, plantain 1CIP417 IIB 3 Philippines Banana 1CIP418 IIB 3 Indonesia Peanut 1Molk2 IIB 3 Philippines Musa 1UW28 IIB 3 Cyprus Potato 1UW9 IIB 3 Costa Rica Heliconia 1UW170 IIB 4 Colombia Heliconia 4A 2 aCFBP6778 IIB 4NPB Martinique Tomato NPB 2 aCFBP6783 IIB 4NPB Martinique Heliconia NPB 2 aRUN432 IIB 4NPB French Guiana Water (irrigation) NPB 2 aIBSBF1503 IIB 4NPB Brazil Cucumber NPB 2 aLNPV24.25 IIB 4NPB France Tomato NPB 2 aJY200 IIB 4NPB Martinique Anthurium NPB 2 aCFBP1184 IIB 4 Honduras Musa 4B 2 bLNPV31.10 IIB 4 French Guiana Musa 4B 2 bLNPV32.36 IIB 4 French Guiana Musa 4B 2 bLNPV32.37 IIB 4 French Guiana Banana, plantain 4B 2 bLNPV32.40 IIB 4 French Guiana Musa 4B 2 bUW160 IIB 4 Peru Banana, plantain 4B 2 bUW163 IIB 4 Peru Banana, plantain 4A 2 bUW162 IIB 4 Peru Banana, plantain 4A 2 cCFBP6797 IIB 4NPB Martinique American nightshade NPB 2 cCFBP7014 IIB 51 Trinidad Anthurium 2 cGMI8044 IIA 6 Grenada Banana 3RUN394 IIA 6 Grenada Banana, bluggoe 3UW181 IIA 6 Venezuela Banana, plantain 3JS927 IIA 7 Porto Rico Tomato 3CFBP2957 IIA 36 Martinique Tomato 3CFBP2957 IIA 36 Martinique Tomato 3CFBP2957 IIA 36 Martinique Tomato 3a Determined by sequencing of the partial endoglucanase (egl) gene (13).b Cluster determined from the phylogenetic reconstruction performed using MrBayes, version 3.2.c Statistical groups were obtained by a Bayesian population structure assessment analysis with STRUCTURE software for numbers of clusters (K) ranging from 1 to 10. The majorpopulation was assessed as having 3 clusters, according to the likelihood of assignment increasing from a �K value of 1.858 for 2 clusters to 1,401.232 for 3 clusters, and thendecreasing until K reached a value of 10. Cluster 1 was assigned with an average inference of 0.980; cluster 2, with an average inference of 0.976; and cluster 3, with an averageinference of 0.956. The subpopulation was assessed as having 3 clusters, according to the likelihood of assignment increasing from a �K value of 0.948 for 2 clusters to 98.391 for 3clusters, and then decreasing until K reached a value of 10. Subcluster a was assigned with an average inference of 0.881; subcluster b, with an average inference of 0.827; andsubcluster c, with an average inference of 0.677.
Cellier et al.
2372 aem.asm.org Applied and Environmental Microbiology
Dow
nloa
ded
from
http
s://j
ourn
als.
asm
.org
/jour
nal/a
em o
n 14
Nov
embe
r 20
21 b
y 11
9.19
4.21
0.15
7.
constituting the other major cluster in phylotype IIB-1. However,strains CFBP3873 (Belgium) and CFBP4808 (Israel), assigned tothis “Andean” cluster, displayed high levels of membership inboth of those clusters, suggesting a hybrid profile and close pathsof evolution.
A focus on the major cluster composed only of phylotype IIB-1strains revealed at least four subclusters correlated with the geo-graphical origins of strains and named after these locations. Thegroup names must nevertheless be taken with caution, since thelocation of isolation may not represent the real center of origin. Afirst cluster, named “EuMr,” contained strains mainly originatingfrom Europe and the Mediterranean and was phylogeneticallyheterogeneous, partitioning into two structure clusters: B and C.The hybrid profile revealed by the estimated membership proba-bility values among strains from clusters B and C and amongstrains within each cluster suggests high gene flows between thosetwo populations. To our knowledge, assignment of strain PSS525,isolated in Taiwan from potato, to the European cluster B sup-ports the hypothesis of its introduction into Taiwan through Pe-largonium material (P. Prior, unpublished data; J.-F. Wang, per-sonal communication). Similarly, it is anticipated that strainJQ1006, isolated from wilted potato in Réunion Island, may alsohave been introduced, since it also belongs to the European clusterB. Such data provide epidemiological evidence of the introductionand spread of strains across countries, supposedly carried by in-fected material.
Whereas European strains were previously described as het-erogeneous, the AIO phylogenetic cluster, comprising strains witha geographical origin mainly in Africa or the Indian Ocean, wasconsistent with structure cluster A and was characterized by a highestimated membership. We could then hypothesize that thosestrains were exposed to limited gene flow and may be character-ized as endemic to the African and Indian Ocean regions, sincethey were limited to these regions. However, three strains presentwith possible gene flow events between the endemic Africanbrown rot strains and European strains. Strains CFBP3865 (iso-lated in France from potato), CFBP3785 (Portugal, potato), andCFBP4812 (France, tomato) were assigned to the EuMr phyloge-netic cluster but also to the African structure cluster, showing ahybrid profile with a European structure cluster. This suggests thatthese strains carry a hybrid profile between African–Indian Oceanand European populations and thus may represent a bridge be-tween these two major brown rot subclusters. Hence, two distinctevents may explain the diversity of brown rot strains observed inEurope: a former Andean origin that may have spread worldwidealong with a massive movement of potato material and a morerecent African–Indian Ocean origin. The African lineage forbrown rot strains is thus of major interest as a model for studyingmicroevolution events at a continental level.
The last subcluster found within the brown rot strains fromphylotype I was referred to as the “North” phylogenetic clusterand structure cluster D, corresponding to strains isolated in Neth-erlands and Sweden. The reference strain IPO1609 was isolated byJanse in 1995, and strain CFBP3884 was isolated by Ollson andreceived by Janse in 1980 (J. Janse, personal communication). Asrevealed by the pangenomic microarray, these two strains wereclearly distinct from other IIB-1 clusters. Strain IPO1609 was re-cently reported to carry a 77-kb DNA deletion (17) compared toother R. solanacearum genomes, especially IIB-1 strain UW551.This chromosomal region included 43 genes, from which 2 en-
coded proteins related to pathogenicity traits. The high similaritybetween IPO1609 and CFBP3884 and the negative probe signaltargeting this particular 68-kb region (confirmed by replicates[data not shown]) strongly indicate that this deletion is present inboth strains. This deletion event should not be considered an ex-ception in R. solanacearum strains. Both strains IPO1609 andCFBP3884 are nonpathogenic to potato (5), and IPO1609 wasproved to show limited aggressiveness to Solanaceae (25). A strainUW551 mutant with this large DNA fragment deleted showed adramatic reduction of virulence (17). This particular deletion wasnot the only difference in gene content between the “North” phy-logenetic cluster and those distributed in structure clusters A andB; the microarray data flagged at least 91 additional genes, 8 ofwhich were reported to be related to pathogenicity. Nevertheless,the lack of pathogenicity for potato and the generally low viru-lence traits of strains IPO1609 and CFBP3884 remain to be furtherinvestigated.
Moko disease-causing strains. Insect-transmitted and Mokodisease-causing strains that were distributed into phylotypesIIA-6, IIB-3, and IIB-4 are devastating to banana production. Amajor phylogenetic issue was that Moko IIB-4 strains were phylo-genetically undistinguishable from emergent strains and newpathological variants assigned to IIB-4NPB by use of a neutralmarker approach or partial egl sequencing. These emerging strainswere surveyed in the French West Indies (42) and clustered withthe Moko sequevar 4 strains, though they showed a completelydifferent host range: they were highly pathogenic to Solanaceae,along with brown rot phylotype IIB-1 strains (5), but nonpatho-genic to banana (NPB). This study resolved that disputed phylo-genetic position, since the microarray data clearly showed distinctlineages. However, Moko IIB-4 strains were distributed into twophylogenetic clusters, 4A and 4B; cluster 4A is closely related to theemerging IIB-4NPB strains, in contrast to cluster 4B. Althoughemerging strains and Moko disease-causing sequevar 4 strainsshowed a close phylogenetic relationship, it is difficult to explainhow virulence traits evolved over time among those two ecotypes.Emerging strains from sequevar 4NPB are not pathogenic to ba-nana and are highly aggressive on Solanaceae, whereas all MokoIIB-4 strains are highly pathogenic to banana, and some retainedpathogenicity to Solanaceae and could overcome genetic resis-tance resources (5). These data are consistent with the assumptionthat strains IIB-4NPB emerged from the IIB-4 lineage as a newecotype (43). This hypothesis suggests that a loss of particularpathogenicity traits could trigger an emergence of highly hostadapted strains. The phylogenetic position of strain CFBP6797(4NPB) outside the emerging cluster, but within cluster 4B, con-firms the close relationship between the Moko strains and theemerging ecotypes. The particular phylogenetic status of strainCFBP7014, of the newly described sequevar 51, is also a matter ofinterest, since this sequevar differed phylogenetically from Mokodisease-causing strains and emergent strains. Strain CFBP7014,previously characterized as sequevar 4NPB by PCR (42), was as-signed as a close outlier of 4NPB sequevars. This strain was shownto be highly pathogenic on sensitive Solanaceae and could estab-lish latent infections on resistant Solanaceae but did not penetrateinto banana plant tissues (5). Thus, like sequevar 4NPB strains inthe French West Indies, strain CFBP7014 might be considered anemergent pathological variant in Trinidad.
Combining the natural competence of R. solanacearum fortransformation and its wide phylogenetic diversity, it is easier to
CGH Analysis of R. solanacearum Phylotype II Ecotypes
April 2012 Volume 78 Number 7 aem.asm.org 2373
Dow
nloa
ded
from
http
s://j
ourn
als.
asm
.org
/jour
nal/a
em o
n 14
Nov
embe
r 20
21 b
y 11
9.19
4.21
0.15
7.
understand the success of R. solanacearum in extending its hostrange, its phenotype diversity, and its geographical distribution.Gene content explains the phylogenetic diversity, but not thepathogenic profile: a study focusing on gene expression and onfine-tuning of alleles within the pangenome should be carried out.Accessing those data by questioning the full genome content on alarge strain collection remains problematic; nevertheless, the useof the pangenomic microarray developed in this study provides aresolution never before reached for R. solanacearum diversitystudies.
This study brought new insights into aspects of the diversity ofR. solanacearum, especially with regard to the epidemiology ofthree ecotypes within phylotype II of this plant pathogen: brownrot-causing strains, Moko disease-causing strains, and emergingstrains. However, more research needs to be done on the evolu-tionary past in order to fully understand the relationships ofecotypes and phylotypes.
ACKNOWLEDGMENTS
We thank the institutions cited in the text for their courtesy in sharingRalstonia solanacearum strains; the staff of the supercomputer TITAN,Saint Denis, Université de la Réunion, for statistical analysis computation;and J. J. Cheron for microbiological laboratory support.
This work was funded by the Fédération Nationale des Producteurs dePlants de Pommes de Terre, Mission-DAR, grant 7124 of the French Min-istry of Food, Agriculture, and Fisheries. The European Regional Devel-opment Fund (ERDF) of the European Union, Conseil Régional de LaRéunion, also provided financial support as part of a Biorisk programdeveloped at CIRAD. We thank INRA for funding the “PARASOL” pro-ject for the development of the pangenomic DNA microarray.
REFERENCES1. Altschul SF, et al. 1997. Gapped BLAST and PSI-BLAST: a new genera-
tion of protein database search programs. Nucleic Acids Res. 25:3389 –3402.
2. Buddenhagen I, Kelman A. 1964. Biological and physiological aspects ofbacterial wilt caused by Pseudomonas solanacearum. Annu. Rev. Phyto-pathol. 2:203–230.
3. Buddenhagen I, Sequeira L, Kelman A. 1962. Designation of races inPseudomonas solanacearum. Phytopathology 52:726.
4. Buddenhagen IW. 1986. Bacterial wilt revisited. In Persley GJ, et al (ed),Bacterial wilt disease in Asia and the South Pacific: proceedings of aninternational workshop held at PCARRD, Los Baños, Philippines, 8 to 10October 1985, p. 126 –143. ACIAR proceedings no. 13. Australian Centrefor International Agricultural Research, Canberra, Australia.
5. Cellier G, Prior P. 2010. Deciphering phenotypic diversity of Ralstoniasolanacearum strains pathogenic to potato. Phytopathology 100:1250 –1261.
6. Coenye T, Vandamme P. 2003. Simple sequence repeats and composi-tional bias in the bipartite Ralstonia solanacearum GMI1000 genome.BMC Genomics 4:10.
7. Cohan FM, Perry EB. 2007. A systematics for discovering the fundamen-tal units of bacterial diversity. Curr. Biol. 17:R373–R386.
8. Cook D, Barlow E, Sequeira L. 1989. Genetic diversity of Pseudomonassolanacearum: detection of restriction fragment polymorphisms withDNA probes that specify virulence and hypersensitive response. Mol.Plant Microbe Interact. 2:113–121.
9. Cook D, Sequeira L. 1994. Strain differentiation of Pseudomonas so-lanacearum by molecular genetic methods, p 77–93. In Hayward AC,Hartman GL (ed), Bacterial wilt: the disease and its causative agent, Pseu-domonas solanacearum. CAB International, Wallingford, United King-dom.
10. Eden-Green SJ. 1994. Diversity of Pseudomonas solanacearum and relatedbacteria in South East Asia: new direction for Moko disease, p 25–34. InHayward AC, Hartman GL (ed), Bacterial wilt: the disease and its caus-ative organism, Pseudomonas solanacearum. CAB International, Walling-ford, United Kingdom.
11. Evanno G, Regnaut S, Goudet J. 2005. Detecting the number of clustersof individuals using the software STRUCTURE: a simulation study. Mol.Ecol. 14:2611–2620.
12. Falush D, Stephens M, Pritchard JK. 2003. Inference of populationstructure using multilocus genotype data: linked loci and correlated allelefrequencies. Genetics 164:1567–1587.
13. Fegan M, Prior P. 2005. How complex is the “Ralstonia solanacearumspecies complex,” p 449 – 461. In Allen C, Prior P, Hayward AC (ed),Bacterial wilt disease and the Ralstonia solanacearum species complex. APSPress, St. Paul, MN.
14. Fegan M, Taghavi M, Sly LI, Hayward AC. 1998. Phylogeny, diversityand molecular diagnostics of Ralstonia solanacearum, p 19 –33. In Prior P,Allen C, Elphinstone J (ed), Bacterial wilt disease: molecular and ecologi-cal aspects. INRA Editions, Paris, France.
15. Genin S, Boucher C. 2004. Lessons learned from the genome analysis ofRalstonia solanacearum. Annu. Rev. Phytopathol. 42:107–134.
16. Gil R, Silva FJ, Pereto J, Moya A. 2004. Determination of the core of aminimal bacterial gene set. Microbiol. Mol. Biol. Rev. 68:518 –537.
17. Gonzalez A, Plener L, Restrepo S, Boucher C, Genin S. 2011. Detectionand functional characterization of a large genomic deletion resulting indecreased pathogenicity in Ralstonia solanacearum race 3 biovar 2 strains.Environ. Microbiol. 13:3172–3185.
18. Guidot A, Coupat B, Fall S, Prior P, Bertolla F. 2009. Horizontal genetransfer between Ralstonia solanacearum strains detected by comparativegenomic hybridization on microarrays. ISME J. 3:549 –562.
19. Guidot A, et al. 2007. Genomic structure and phylogeny of the plantpathogen Ralstonia solanacearum inferred from gene distribution analysis.J. Bacteriol. 189:377–387.
20. Hayward AC. 1991. Biology and epidemiology of bacterial wilt caused byPseudomonas solanacearum. Annu. Rev. Phytopathol. 29:67– 87.
21. Hayward AC. 1994. The hosts of Pseudomonas solanacearum, p 9 –24. InHayward AC, Hartman GL (ed), Bacterial wilt: the disease and its caus-ative agent, Pseudomonas solanacearum. CAB International, Wallingford,United Kingdom.
22. Hudson ME. 2008. Sequencing breakthroughs for genomic ecology andevolutionary biology. Mol. Ecol. Res. 8:3–17.
23. Janse JD. 1996. Potato brown rot in western Europe— history, presentoccurrence and some remarks on possible origin. EPPO Bull. 26:17.
24. Kaeuffer R, Reale D, Coltman DW, Pontier D. 2007. Detecting popu-lation structure using STRUCTURE software: effect of background link-age disequilibrium. Heredity (Edinb.) 99:374 –380.
25. Mahbou Somo Toukam G, et al. 2009. Broad diversity of Ralstoniasolanacearum strains in Cameroon. Plant Dis. 93:1123–1130.
26. Poussier S, Prior P, Luisetti J, Hayward C, Fegan M. 2000. Partialsequencing of the hrpB and endoglucanase genes confirms and expandsthe known diversity within the Ralstonia solanacearum species complex.Syst. Appl. Microbiol. 23:479 – 486.
27. Poussier S, et al. 2000. Genetic diversity of Ralstonia solanacearum asassessed by PCR-RFLP of the hrp gene region, AFLP and 16S rRNA se-quence analysis, and identification of an African subdivision. Microbiol-ogy 146(Pt 7):1679 –1692.
28. Pritchard JK, Stephens M, Donnelly P. 2000. Inference of populationstructure using multilocus genotype data. Genetics 155:945–959.
29. R Development Core Team. 2009. R: a language and environment forstatistical computing. R Foundation for Statistical Computing, Vienna,Austria. http://www.R-project.org.
30. Remenant B, et al. 2010. Genomes of three tomato pathogens within theRalstonia solanacearum species complex reveal significant evolutionarydivergence. BMC Genomics 11:379.
31. Salanoubat M, et al. 2002. Genome sequence of the plant pathogenRalstonia solanacearum. Nature 415:497–502.
32. Sheather SJ, Jones MC. 1991. A reliable data-based bandwidth selectionmethod for kernel density estimation. J. R. Stat. Soc. Ser. B Stat. Methodol.53:683– 690.
33. Silverman BW. 1986. Density estimation. Chapman and Hall, London,United Kingdom.
34. Smith JJ, et al. 1998. Genetic diversity amongst Ralstonia solanacearumisolates of potato in Europe. EPPO Bull. 28:83– 84.
35. Staley JT. 2006. The bacterial species dilemma and the genomic-phylogenetic species concept. Philos. Trans. R. Soc. Lond. B Biol. Sci.361:1899 –1909.
36. Taghavi M, Hayward C, Sly LI, Fegan M. 1996. Analysis of the phylo-genetic relationships of strains of Burkholderia solanacearum, Pseudomo-
Cellier et al.
2374 aem.asm.org Applied and Environmental Microbiology
Dow
nloa
ded
from
http
s://j
ourn
als.
asm
.org
/jour
nal/a
em o
n 14
Nov
embe
r 20
21 b
y 11
9.19
4.21
0.15
7.
nas syzygii, and the blood disease bacterium of banana based on 16S rRNAgene sequences. Int. J. Syst. Bacteriol. 46:10 –15.
37. Thwaites R, Mansfield J, Eden-Green S, Seal S. 1999. RAPD and repPCR-based fingerprinting of vascular bacterial pathogens of Musa spp.Plant Pathol. 48:121–128.
38. Timms-Wilson TM, Bryant K, Bailey MJ. 2001. Strain characterizationand 16S-23S probe development for differentiating geographically dis-persed isolates of the phytopathogen Ralstonia solanacearum. Environ.Microbiol. 3:785–797.
39. van der Wolf JM, et al. 1998. Genetic diversity of Ralstonia solanacearumrace 3 in Western Europe determined by AFLP, RC-PFGE and Rep-PCR,p 44 – 49. In Prior P, Allen C, Elphinstone J (ed), Bacterial wilt disease:molecular and ecological aspects. Springer-Verlag, Berlin, Germany.
40. Vaneechoutte M, Kämpfer P, De Baere T, Falsen E, Verschraegen G.2004. Wautersia gen. nov., a novel genus accommodating the phylogeneticlineage including Ralstonia eutropha and related species, and proposal ofRalstonia [Pseudomonas] syzygii (Roberts et al. 1990) comb. nov. Int. J.Syst. Evol. Microbiol. 54:317–327.
41. Villa JE, et al. 2005. Phylogenetic relationships of Ralstonia solanacearum
species complex strains from Asia and other continents based on 16SrDNA, endoglucanase, and hrpB gene sequences. J. Gen. Plant Pathol.71:39 – 46.
42. Wicker E, et al. 2007. Ralstonia solanacearum strains from Martinique(French West Indies) exhibiting a new pathogenic potential. Appl. Envi-ron. Microbiol. 73:6790 – 6801.
43. Wicker E, Grassart L, Coranson-Beaudu R, Mian D, Prior P. 2009.Epidemiological evidence for the emergence of a new pathogenic variantof Ralstonia solanacearum in Martinique (French West Indies). PlantPathol. 58:853– 861.
44. Wicker E, et al. 17 November 2011. Contrasting recombination patternsand demographic histories of the plant pathogen Ralstonia solanacearuminferred from MLSA. ISME J. [Epub ahead of print.] doi:10.1038/ismej.2011.160.
45. Yabuuchi E, Kosako Y, Yano I, Hotta H, Nishiuchi Y. 1995. Transfer oftwo Burkholderia and an Alcaligenes species to Ralstonia gen. nov.: pro-posal of Ralstonia pickettii (Ralston, Palleroni and Doudoroff 1973) comb.nov., Ralstonia solanacearum (Smith 1896) comb. nov. and Ralstonia eu-tropha (Davis 1969) comb. nov. Microbiol. Immunol. 39:897–904.
CGH Analysis of R. solanacearum Phylotype II Ecotypes
April 2012 Volume 78 Number 7 aem.asm.org 2375
Dow
nloa
ded
from
http
s://j
ourn
als.
asm
.org
/jour
nal/a
em o
n 14
Nov
embe
r 20
21 b
y 11
9.19
4.21
0.15
7.