Embed Size (px)
Citation preview
1
Peak Oil: Impacts on MDGsand options for Australia
Bruce RobinsonConvenor
15th March 2008
2
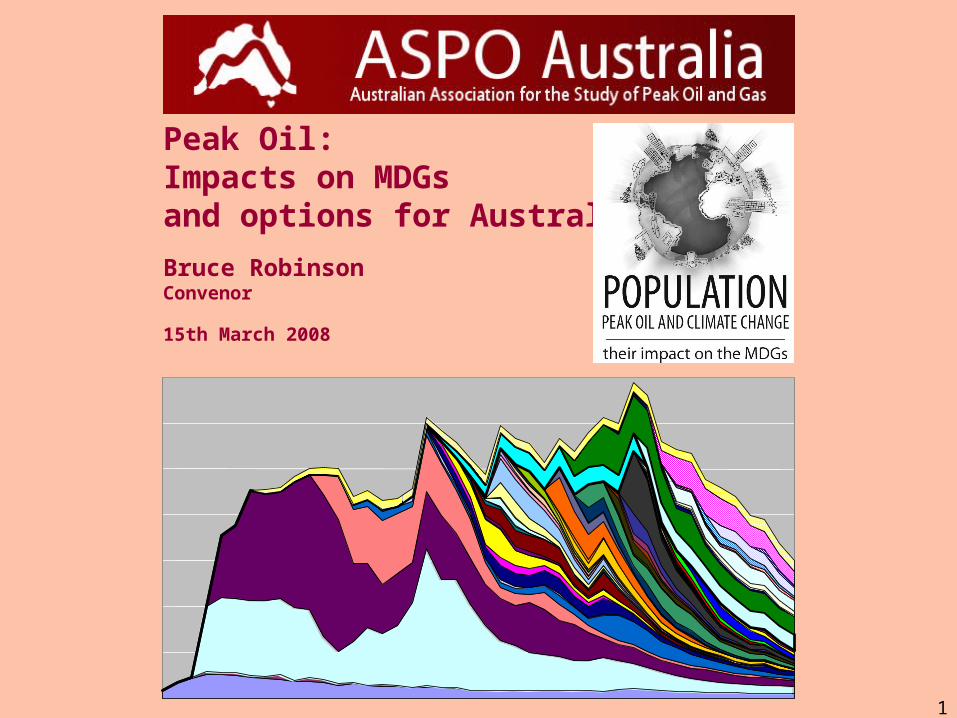
www.ASPO-Australia.org.auAn Australia-wide network of professionals working to reduce oil vulnerability
Working groupsFinance SectorHealth Sector Social Services SectorRemote indigenous communitiesActive transport (bicycle & walking)Agriculture, Fisheries and FoodBiofuels Urban and transport planning Oil & Gas industryRegional and city working groupsConstruction IndustryPublic transport sectorDefence and Security EconomicsTourism Children and Peak OilYoung Professionals working group
3
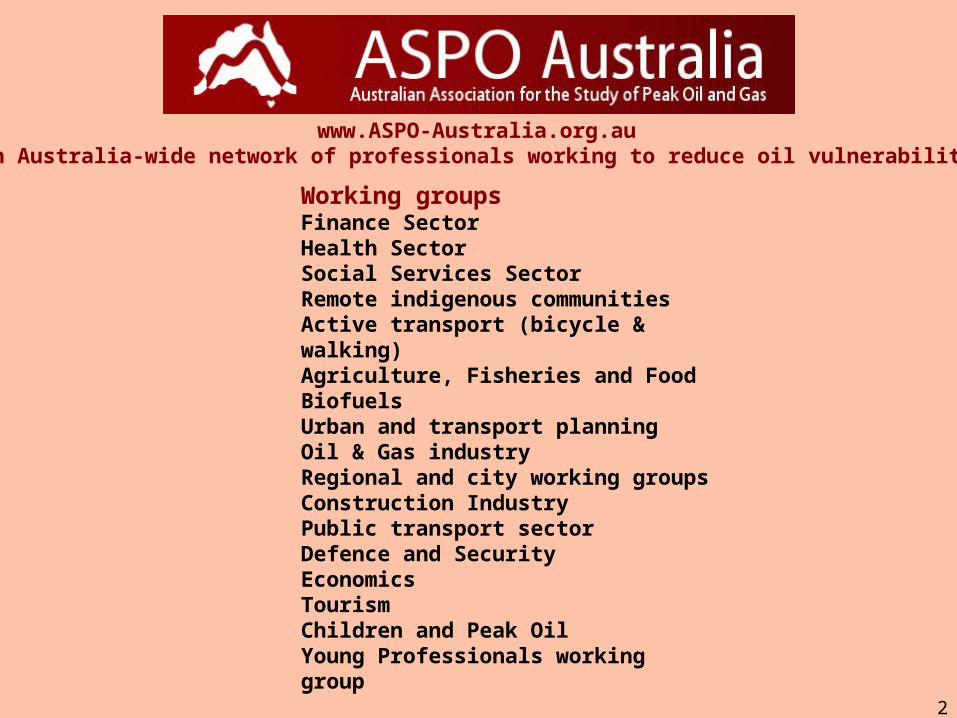
Outline
What is Peak Oil ?
the time when global oil production stops rising and starts its final decline
We will never "run out of oil"
● When is the most probable forecast date ? ? 2012 +/- 5 years
"Peak Exports" is even more important, and sooner
● Peak Oil will impact very dramatically on the MDGs, unless the developed world reduces its consumption to leave enough for developing countries.
● Options for Australia and Australians
1930 1970 2010 2050
Peak Oilbutwhen?

4
0
2
4
6
8
10
1900 1920 1940 1960 1980 2000
US Oil Production 1900-2006
(million barrels/day)
mb/d
US oil peak 1970
5
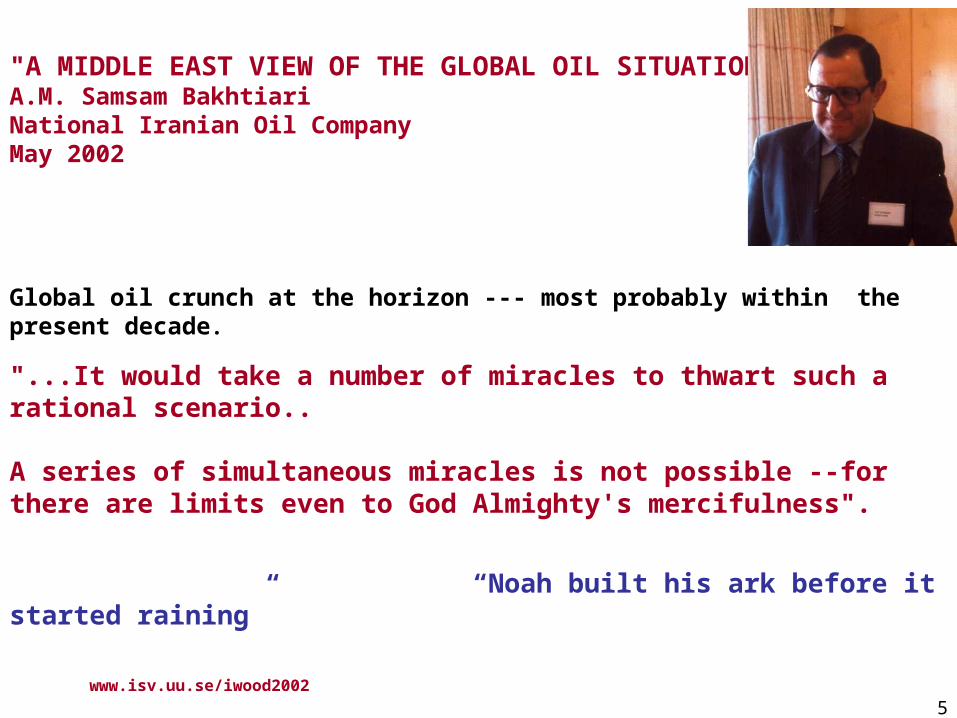
"A MIDDLE EAST VIEW OF THE GLOBAL OIL SITUATION"A.M. Samsam Bakhtiari National Iranian Oil CompanyMay 2002
Global oil crunch at the horizon --- most probably within the present decade.
"...It would take a number of miracles to thwart such a rational scenario..
A series of simultaneous miracles is not possible --for there are limits even to God Almighty's mercifulness".
“Noah built his ark before it started raining”
www.isv.uu.se/iwood2002

6
Dr. Sadad I. Al Husseini, ex Saudi AramcoOil and Money Conference, London, October 30, 2007
...predicts a 10 year plateau
a structural ceiling determined by geology
100
90
70
80
Production M b/dayPrice
$/barrel

7
Monday October 22 2007Fig. 7 Oil production world summary
2008 2015
MDG target
8

9
Chris Skrebowski Editor, Petroleum Review, London
The practical realities
• Worry about flows not reserves• "Deliverability"
“It isn't the size of the tank; it’s the size of the tap” (ASPO-USA)

10
A simple observation -- or why peak will be earlier than most people expect
‘Global production falls when loss of output from countries in decline exceeds gains in output from those that are expanding.’
Decline
Expansion

11
The real oil discovery trendLongwell, 2002

12
Jeff Rubin
September 2007
Canadian Imperial Banking Corporation
Iran 10c/litreVenezuela 2c/l
13
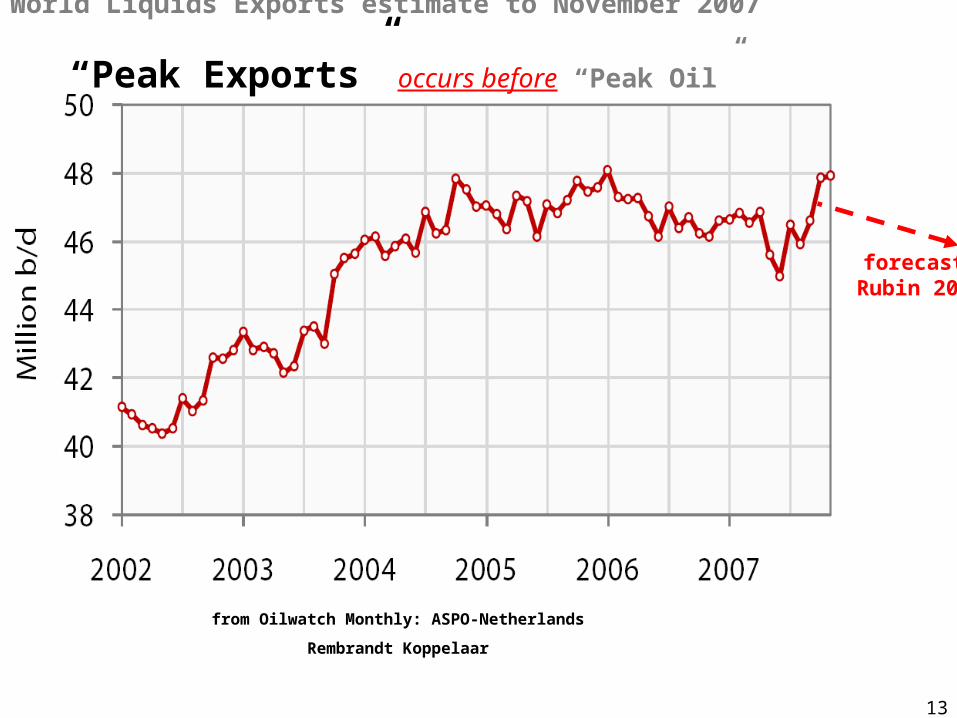
from Oilwatch Monthly: ASPO-Netherlands
Rembrandt Koppelaar
World Liquids Exports estimate to November 2007
“Peak Exports” occurs before “Peak Oil”
forecast Rubin 2007

14
•Please put your hand up if you think that we have crossed the Hubbert Peak
•and hands up those who don’t?
•UndecidedEric StreitbergEric StreitbergExecutive Director Executive Director ARC Energy LimitedARC Energy Limited
Australian Petroleum Production & Exploration Association conference
APPEAApril 2005Perth
•1/3rd
•1/3rd
•1/3rd
15
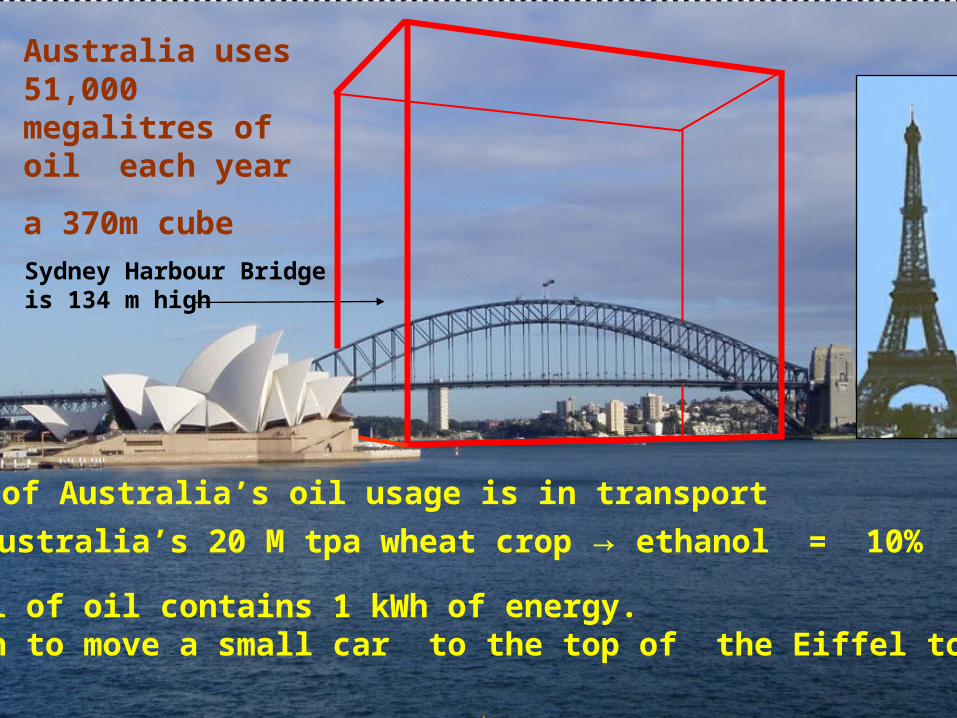
80% of Australia’s oil usage is in transport
If Australia’s 20 M tpa wheat crop → ethanol = 10%
Australia uses 51,000 megalitres of oil each year
a 370m cube
Sydney Harbour Bridge is 134 m high
100 ml of oil contains 1 kWh of energy. Enough to move a small car to the top of the Eiffel tower

16
Australia China United States
1 kml l
Million barrels/ day 2006 BP Statistical Review, 2007
Australia uses 0.9 China 7.4US 20.6World 83.7 US 1 cubic km oil / year

17
0.0
0.2
0.4
0.6
0.8
1.0
1965 1975 1985 1995 2005 2015 2025
Million barrels/day
Actual ForecastAustralia
}$12.5 billion2006/07
P50
Consumption
Production

18
0 5 10 15
5
0
15
25
Years After Crash Program Initiation
Impact (MM bpd)
20
35EOR
Coal Liquids
Heavy Oil
GTL
Efficient Vehicles
Worldwide Crash Program Mitigation of Conventional Oil Production Peaking
A Study for US DOE NETLHirsch, Bezdek and Wendling, 2005
Delay / Rapid growth.
Roughly 35 MM bpd at year 20.
2005
Study
19
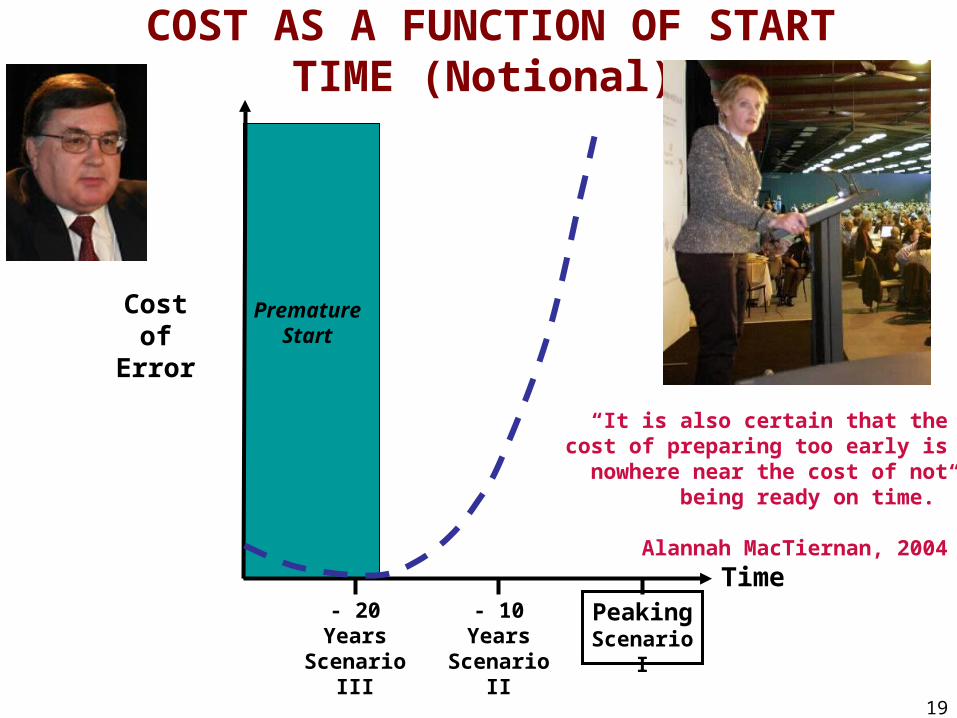
Time
Cost of Error
COST AS A FUNCTION OF START TIME (Notional)
Premature Start
Peaking Scenario I
- 10 Years Scenario II
- 20 Years Scenario III
“It is also certain that the cost of preparing too early is nowhere near the
cost of not being ready on time.”
Alannah MacTiernan, 2004

20
www.aspo-australia.org.au/content/view/120/55/
VAMPIRE Oil vulnerability and mortgage rate riskSydney Dodson & Sipe, Griffith University, 2006

21
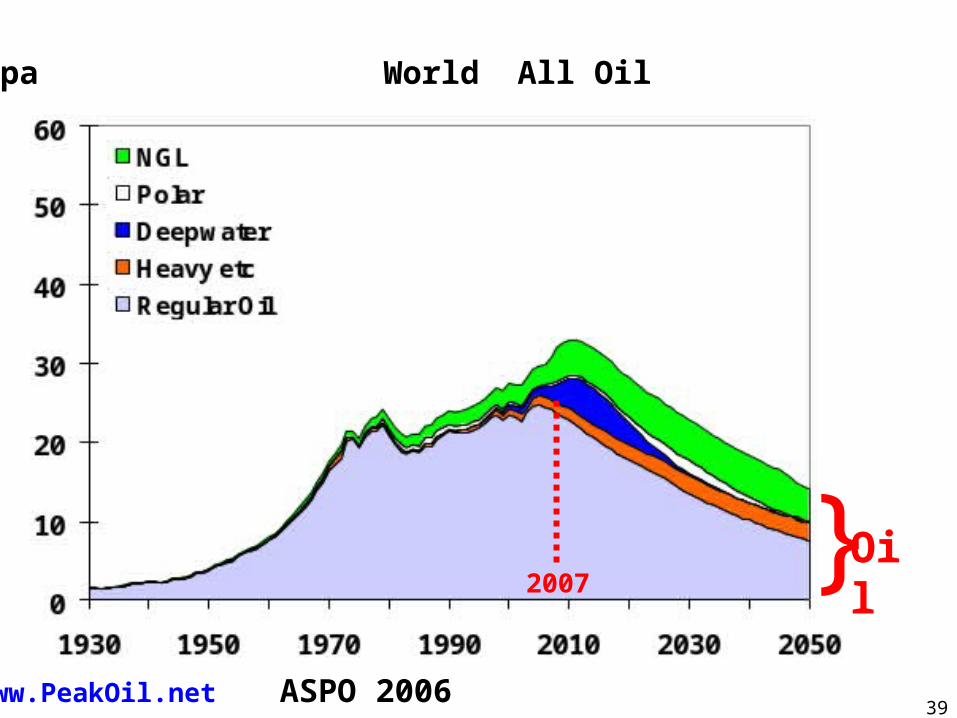
2007 }Oil
Gboe/pa World All Oil
www.PeakOil.net ASPO 2006
22
0102030405060708090
100
30/0
9/20
01
30/0
9/20
02
30/0
9/20
03
30/0
9/20
04
30/0
9/20
05
30/0
9/20
06
30/0
9/20
07
WT
I (U
S$
/ba
rre
l)
Actual price
March 2007prediction
March 2006prediction
March 2005prediction
March 2004prediction
March 2003prediction
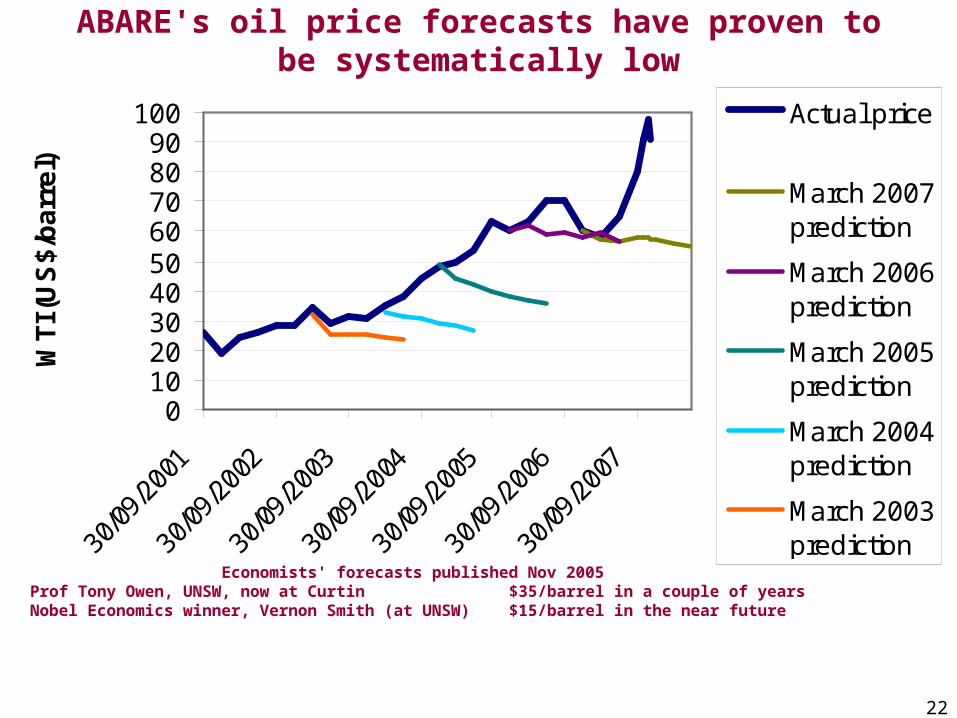
ABARE's oil price forecasts have proven to be systematically low
Economists' forecasts published Nov 2005 Prof Tony Owen, UNSW, now at Curtin $35/barrel in a couple of yearsNobel Economics winner, Vernon Smith (at UNSW) $15/barrel in the near future
23
1: “Talk about it, Talk about it”2. Engage people, “Participatory democracy”3. Dismantle the "perverse policies" that subsidise heavy car use and excessive freight transport.
Australian Government Policy and Action Options
4. Encourage frugal use of fuel, and disadvantage profligate users. Fuel taxes should be incrementally raised to European levels to reduce usage.5: SmartCard tradable personal fuel allocation system. A flexible mechanism for short-term oil shocks, as well for encouraging people to reduce their fuel usage..6. Concentrate on the psychological and social dimensions of automobile dependence, not just “technological fixes”7. Implement nationwide "individualised marketing" travel demand management.8. Railways, cyclepaths and public transport are better investments than more roads.9. Give priority for remaining oil and gas supplies to food production, essential services and indigenous communities, using the Smart-Card system.10. Review the oil vulnerability of every industry and community sector and how each may reduce their risks.11 Promote through the United Nations an Intergovernmental Panel on Oil Depletion, and a Kyoto-like protocol to allocate equitably the declining oil among nations. An international tradable sliding scale allocation mechanism is one hypothetical option.
24
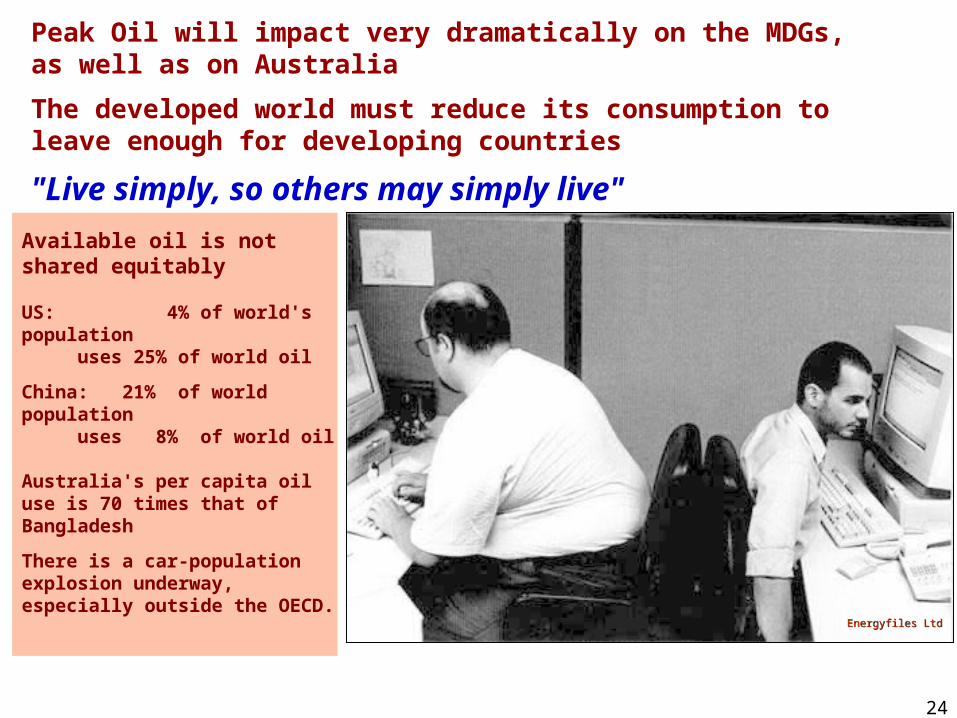
Peak Oil will impact very dramatically on the MDGs, as well as on Australia
The developed world must reduce its consumption to leave enough for developing countries
"Live simply, so others may simply live"
Energyfiles LtdEnergyfiles Ltd
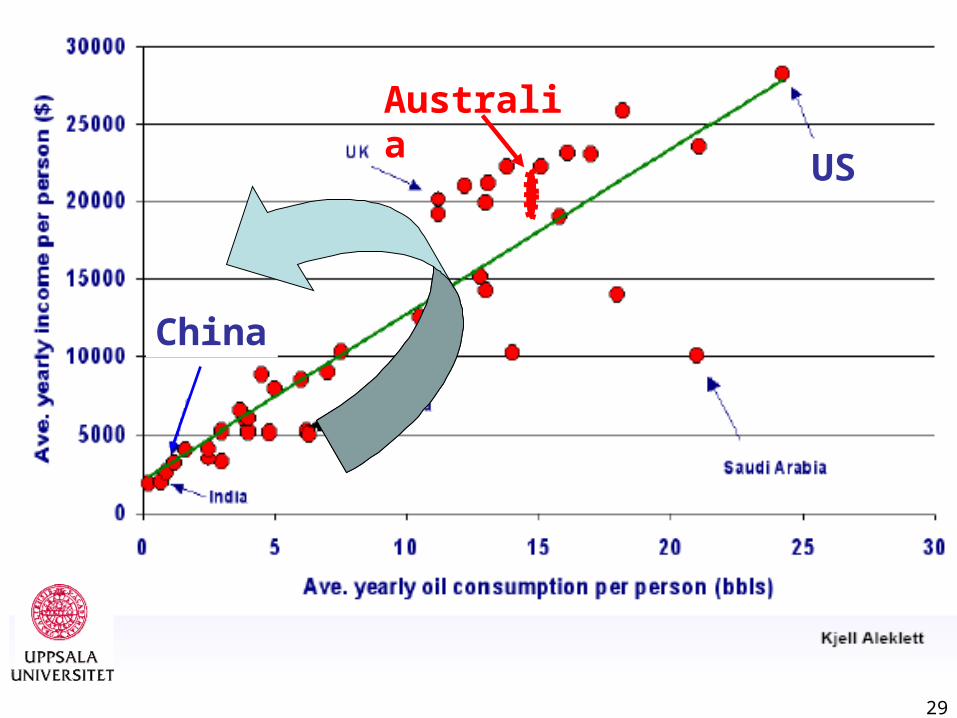
Available oil is not shared equitably
US: 4% of world's population uses 25% of world oil
China: 21% of world population uses 8% of world oil
Australia's per capita oil use is 70 times that of Bangladesh
There is a car-population explosion underway, especially outside the OECD.
25
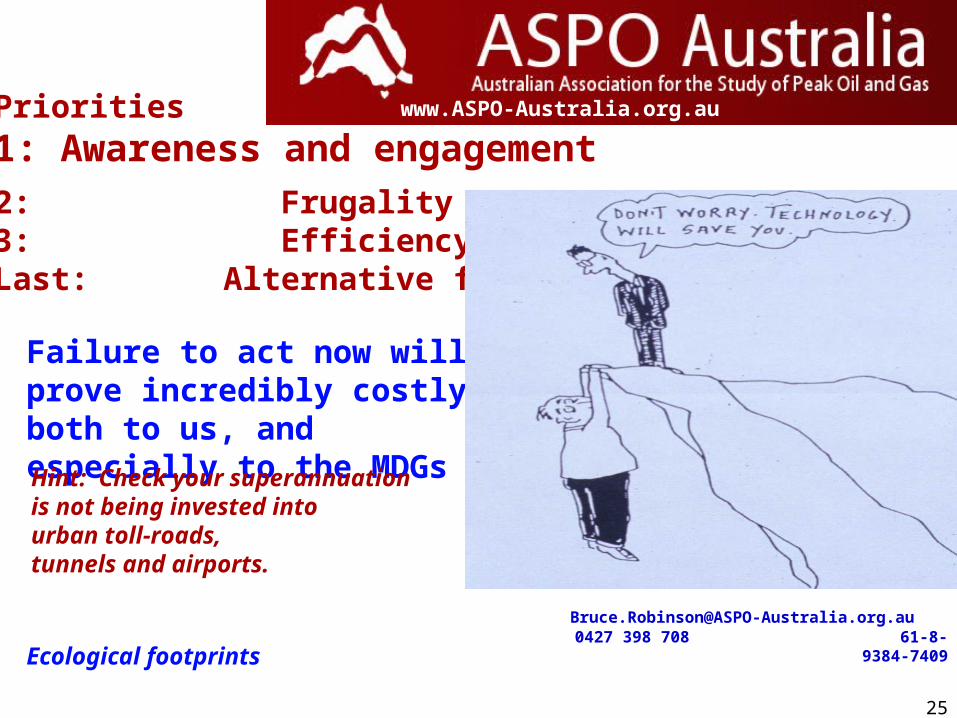
Priorities1: Awareness and engagement
2: Frugality3: EfficiencyLast: Alternative fuels
[email protected] 0427 398 708 61-8-9384-7409
Failure to act now will prove incredibly costly, both to us, and especially to the MDGs
Ecological footprints
www.ASPO-Australia.org.au
Hint: Check your superannuation is not being invested into urban toll-roads, tunnels and airports.

26
a few more slides follow,in case they are needed for questions

27
Petrol taxes OECD
IEA Dec 2003
PortugalUK
Australia
US
€ 0.80
0.60
0.00
0.20
0.40
Au$cents/litre

28
The UK Fuel Tax Escalator Margaret Thatcher
Australian fuel taxes should be raised to European levels on a fuel tax escalator
1988 1990 1992 1994 1996 1998
Nominal tax per litre (pence)
Real tax
10
30
50
40
20
0
pence
29
China
US
Australia

30
0%
20%
40%
60%
80%
2000 2005 2010 2015 2020 2025 2030
Australia's Self-Sufficiency Forecast Oil and Condensate
Geoscience Australia, 2006)

31www.ASPO-Australia.org.Au
Bicycles are powered by biofuel, renewable energy,
either Weetbix or abdominal fat
No shortage of either

32
Peak Oil: Impacts on MDGsand options for Australia
Bruce RobinsonConvenor
15th March 2008
? ? ? ?
Look out !! Something serious
is looming on the radar

33
Hurricane Katrina New Orleans
US Federal, State and local Governments were shown to be shortsighted, ill-prepared, uncaring and disorganised.
Australian governments are much less organised for Peak Oil

34
35

36
37
0
10
20
30
40
50
1930 1950 1970 1990 2010 2030 2050
0
1 0
2 0
3 0
4 0
5 0
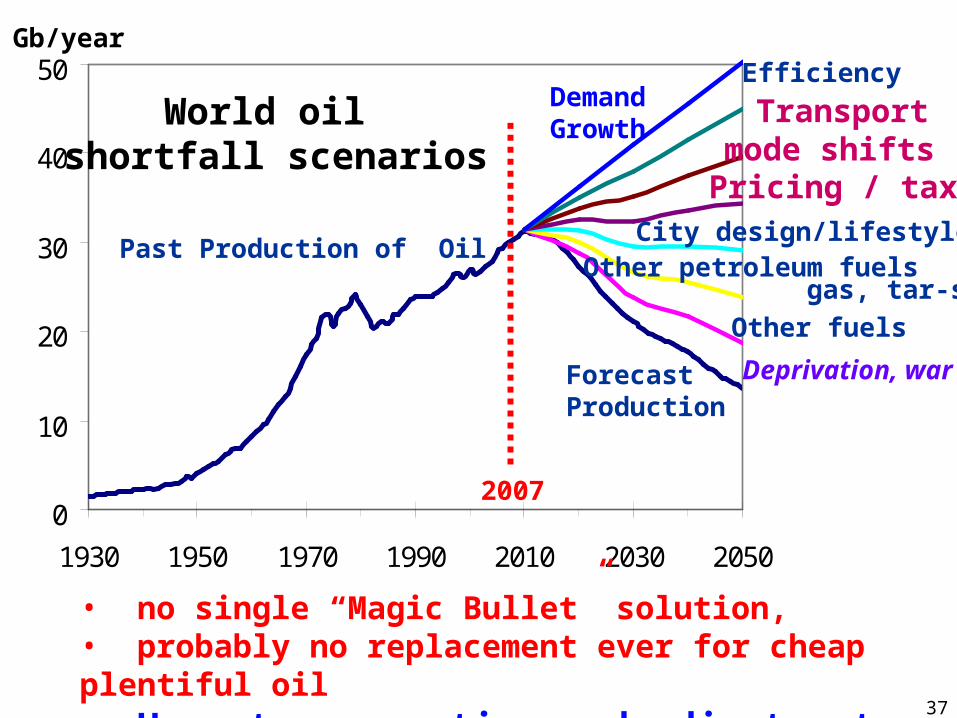
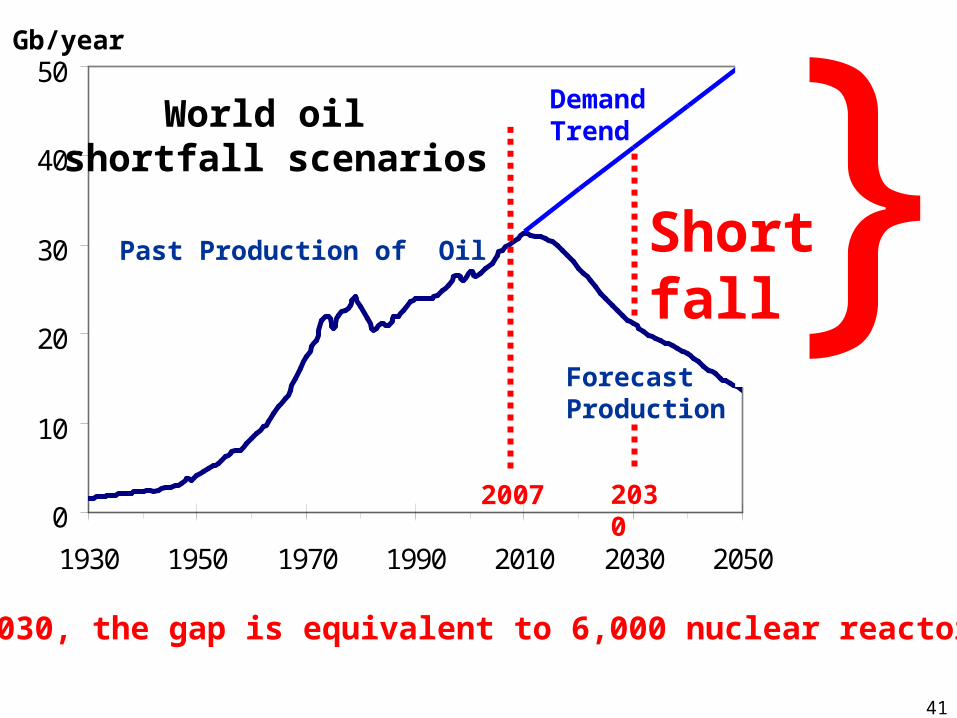
World oil shortfall scenarios
Past Production of Oil
ForecastProduction
Demand Growth
Deprivation, war
City design/lifestyle
Pricing / taxes
Transport mode shifts
Efficiency
Other petroleum fuels gas, tar-sands
Other fuels
Gb/year
• no single “Magic Bullet” solution, • probably no replacement ever for cheap plentiful oil• Urgent preparation and adjustment are vital
2007

38
Blue is water, green is water and oil mixed and red/purple is “dry” oil with little water in it
Ghawar is Saudi Arabia's and the world's biggest oilfieldIf it is at peak, then global peak is probably very close
39
2007 }Oil
Gboe/pa World All Oil
www.PeakOil.net ASPO 2006

40
2007}Oil
}Gas
Gboe/pa World All Oil & Gas (gas at 10,000 cft=1bbl)
www.PeakOil.net ASPO 2006
41
}0
10
20
30
40
50
1930 1950 1970 1990 2010 2030 2050
2007
World oil shortfall scenarios
Past Production of Oil
ForecastProduction
Demand Trend
Gb/year
0
10
20
30
40
50
Shortfall
By 2030, the gap is equivalent to 6,000 nuclear reactors
2030
42
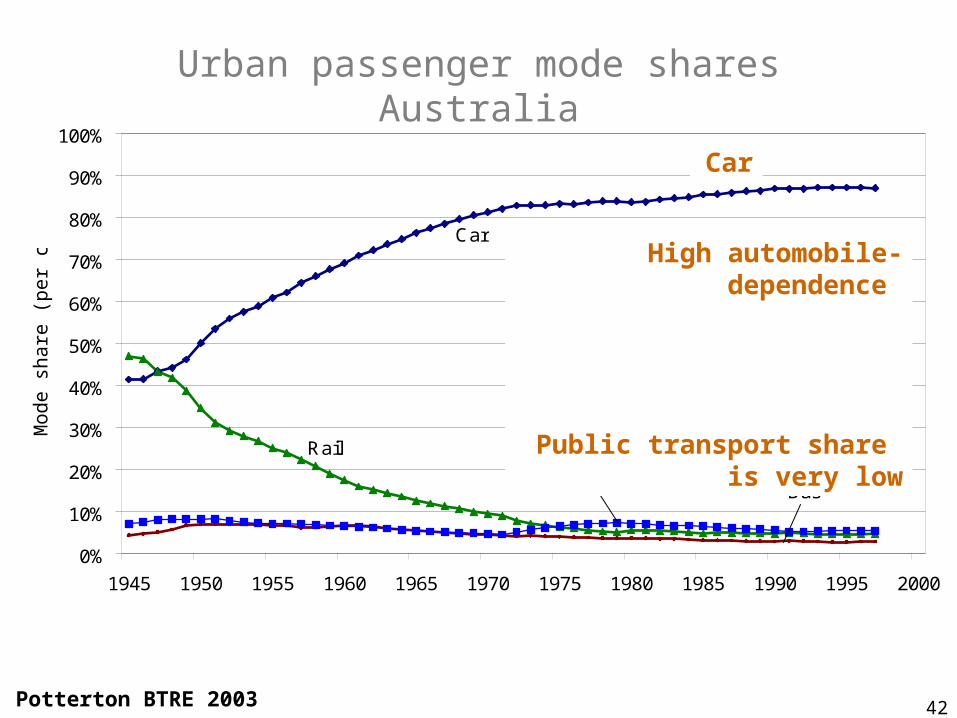
Urban passenger mode shares Australia
0%
10%
20%
30%
40%
50%
60%
70%
80%
90%
100%
1945 1950 1955 1960 1965 1970 1975 1980 1985 1990 1995 2000
Mo
de
sh
are
(p
er
cen
t)
Car
Rail
BusOther
Potterton BTRE 2003
High automobile-dependence
Public transport share is very low
Car
43
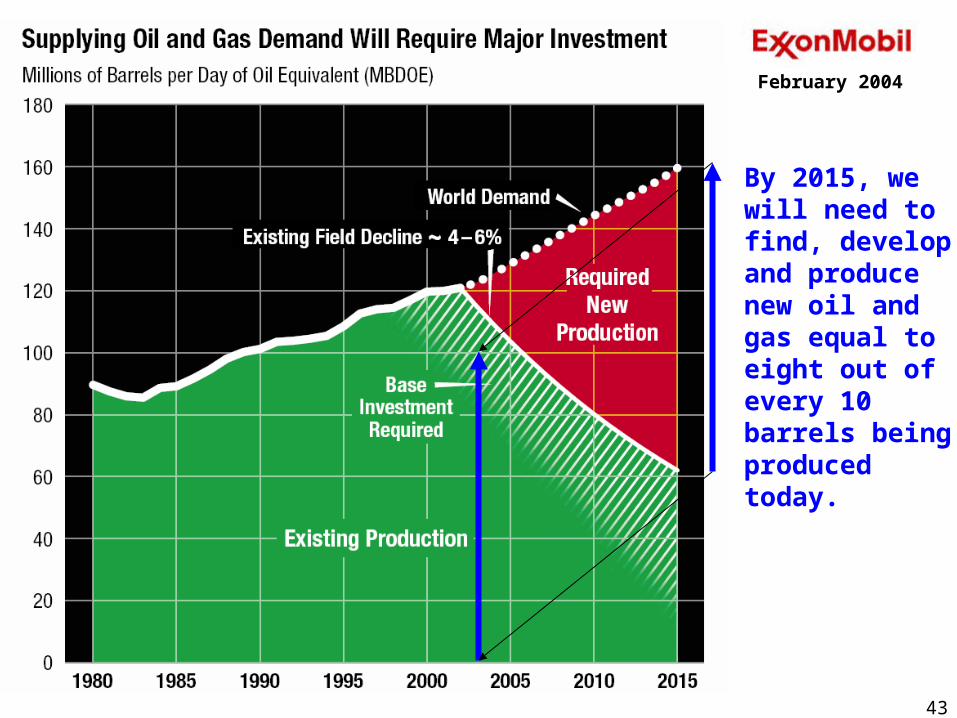
February 2004
By 2015, we will need to find, develop and produce new oil and gas equal to eight out of every 10 barrels being produced today.

44

45
Why are oil supplies peaking?
• Too many fields are old and declining• 54 of 65 oil producing countries are in decline!
• Oil supply will peak in 2010/2011 at around 92-94 million barrels/day
• Oil supply in internationaltrade may peak earlier
• Collectively we are still in denial

46
60.00
70.00
80.00
90.00
100.00
110.00
120.00
2000 2001 2002 2003 2004 2005 2006 2007 2008 2009 2010 2011 2012 2013 2014 2015
Year
Mil
lio
n b
/d Supply IEA
Capacity CS
Capacity CERA
Global liquids capacity to 2015

47
48
0
10
20
30
40
0
10
20
30
40
40
10
30
20
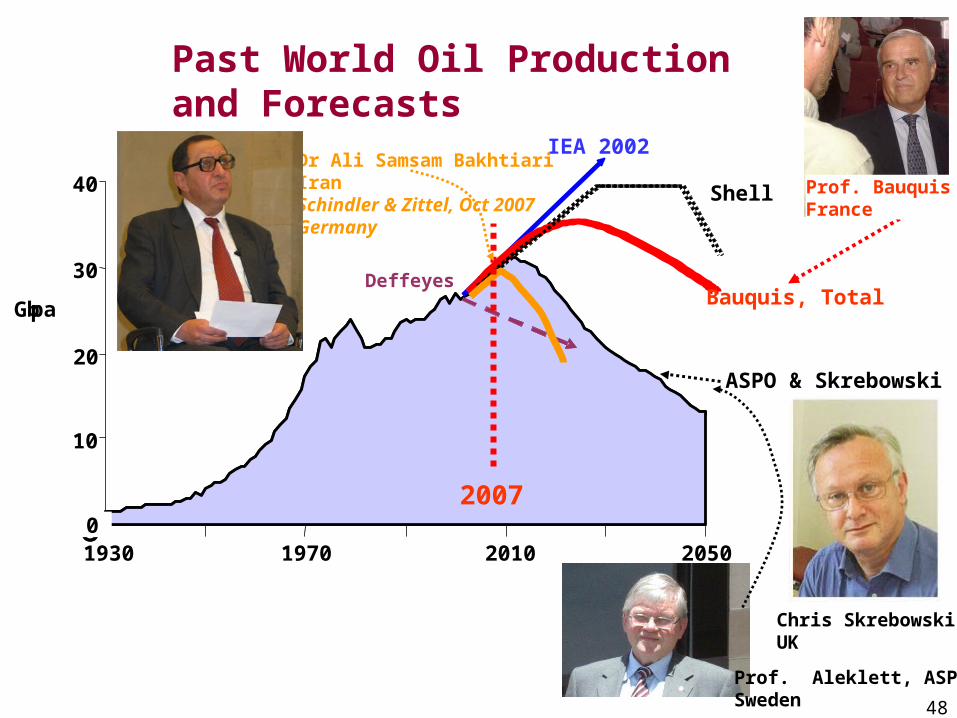
01930 1970 2010 2050
IEA 2002
Shell
Bauquis, Total Deffeyes
ASPO & Skrebowski
Gb pa
0
2007
Past World Oil Production and Forecasts
Prof. BauquisFrance
Dr Ali Samsam BakhtiariIranSchindler & Zittel, Oct 2007Germany
Chris SkrebowskiUK
Prof. Aleklett, ASPOSweden
49
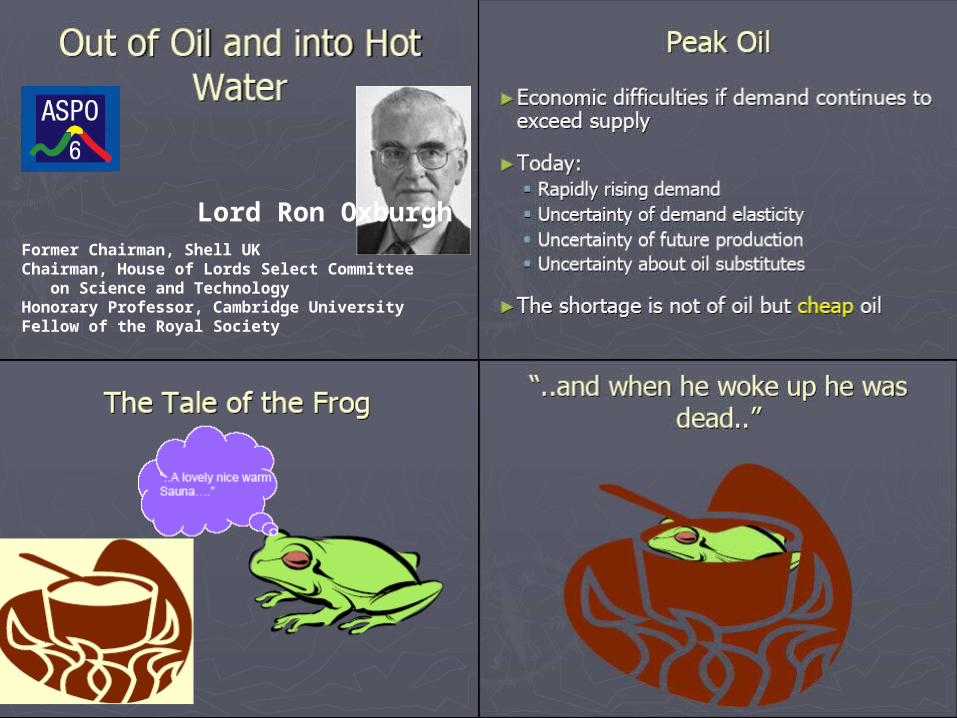
Lord Ron OxburghFormer Chairman, Shell UK Chairman, House of Lords Select Committee on Science and Technology Honorary Professor, Cambridge UniversityFellow of the Royal Society
50