Embed Size (px)
Citation preview
1
Paul PisanoFHWA, Team LeaderRoad Weather & Work Zone Management
Weather andthe Connected Vehicle
Presentation at the Connected Vehicle Program Public MeetingSeptember 25, 2013
2
Agenda
• What’s the need?• What are we doing about it?
3
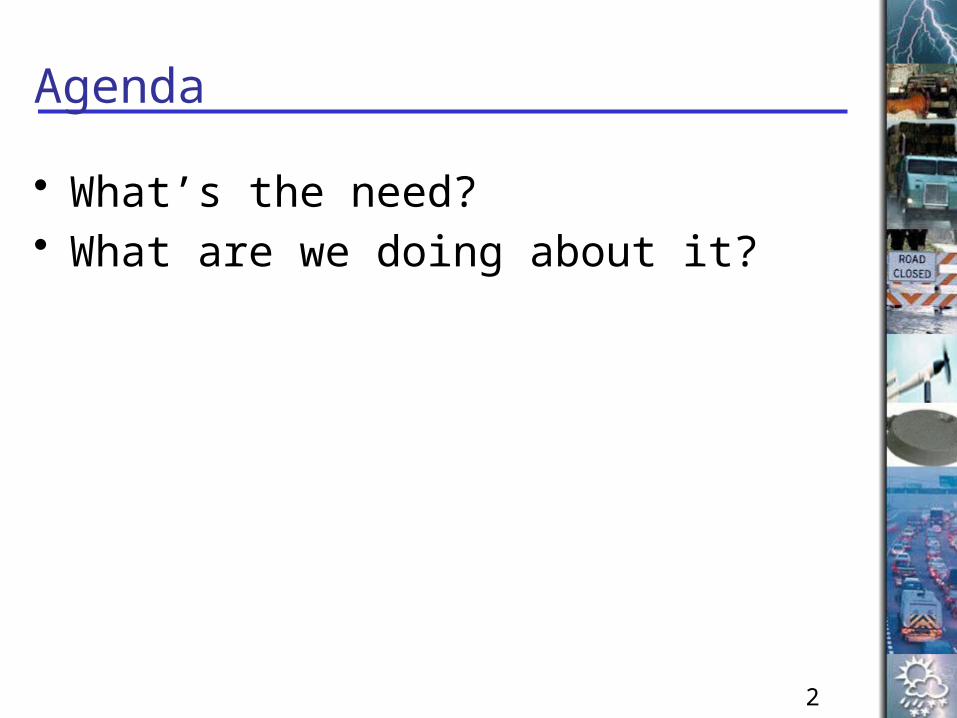
Crash Situation Under Adverse Weather
Weather Related Crashes
24%
Other Crashes
76%
Wet Pavement
75%
Icy Pave-ment13%Snow/Slushy
Pavement11%
Fog
1%
Total Annual CrashesAverage = 6,301,000
Weather Related Crashes By Road Weather Condition*
*Crashes that occurred under adverse conditions; additional factors such as rain, snow, and fog are not disaggregated from pavement conditions in this graphic. The percentage due to fog is for those crashes that occur under foggy conditions, but not wet, icy, or snowy pavement conditions.
Source: Road Weather Management Program, Table: Weather-Related Crash Statistics (Annual Averages), Available at: http://www.ops.fhwa.dot.gov/weather/q1_roadimpact.htm
4
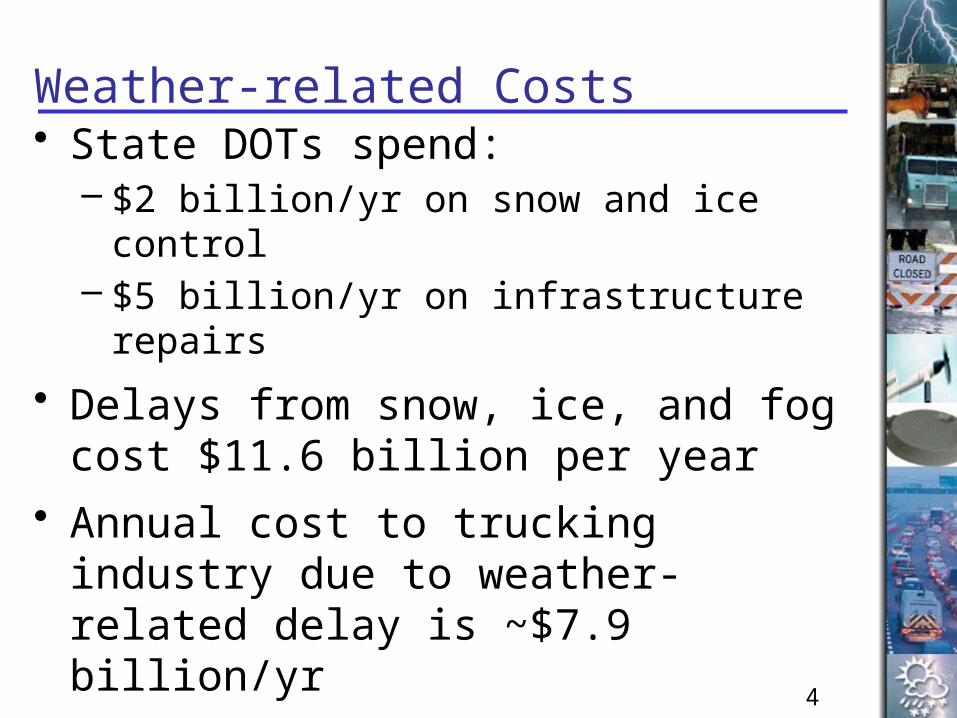
Weather-related Costs• State DOTs spend:
– $2 billion/yr on snow and ice control– $5 billion/yr on infrastructure repairs
• Delays from snow, ice, and fog cost $11.6 billion per year
• Annual cost to trucking industry due to weather-related delay is ~$7.9 billion/yr
• Lost commerce due to storm-closed roads is $3.82 billion in just 15 states
5
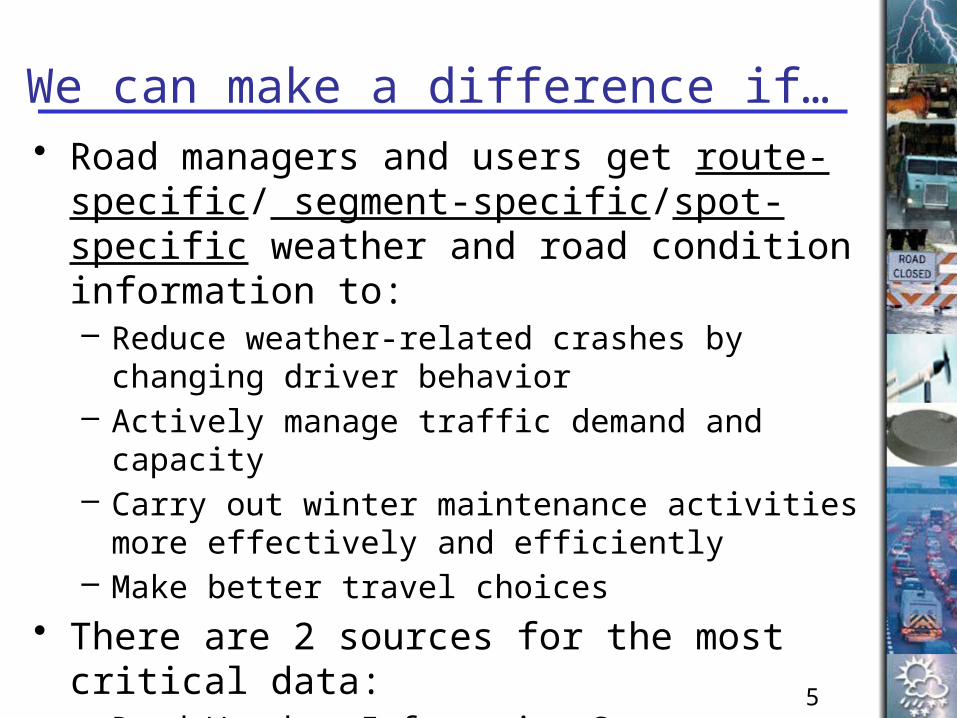
We can make a difference if…• Road managers and users get route-
specific/ segment-specific/spot-specific weather and road condition information to:– Reduce weather-related crashes by changing
driver behavior– Actively manage traffic demand and capacity– Carry out winter maintenance activities more
effectively and efficiently – Make better travel choices
• There are 2 sources for the most critical data:– Road Weather Information Systems– Connected Vehicles
6
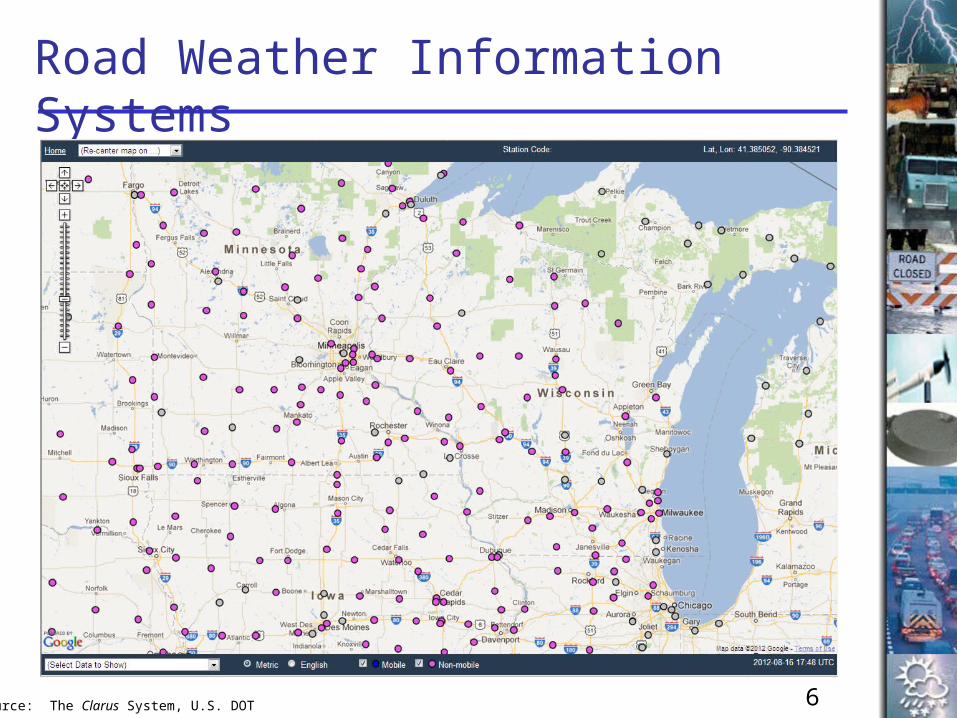
Road Weather Information Systems
Source: The Clarus System, U.S. DOT
7
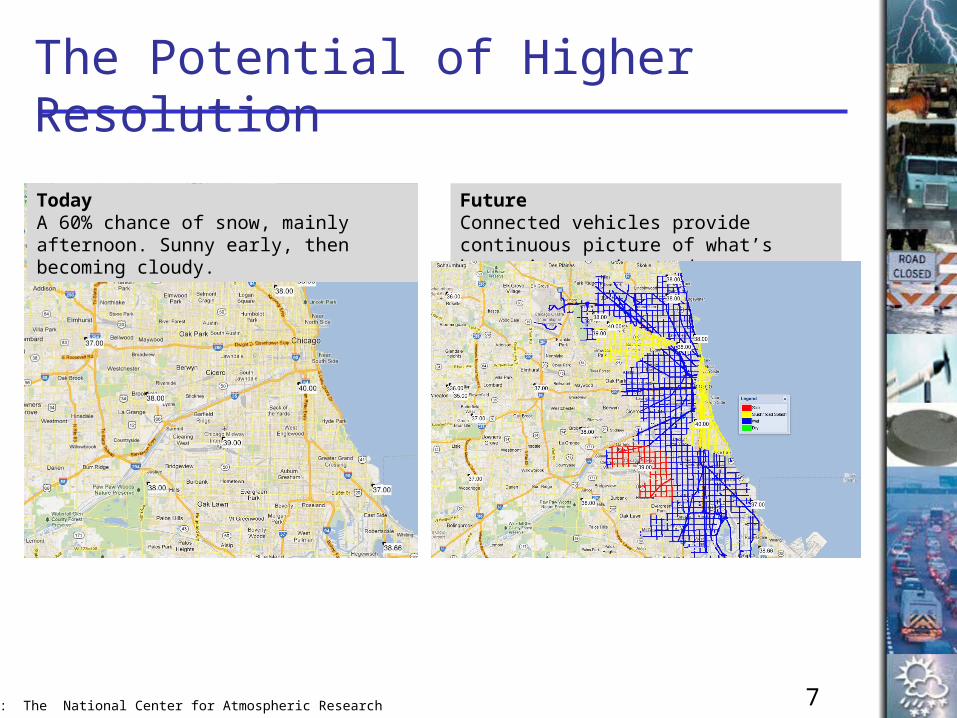
The Potential of Higher Resolution
TodayA 60% chance of snow, mainly afternoon. Sunny early, then becoming cloudy.
FutureConnected vehicles provide continuous picture of what’s happening on the roadways
Source: The National Center for Atmospheric Research
8
Agenda
• What’s the need?• What are we doing about it?
9
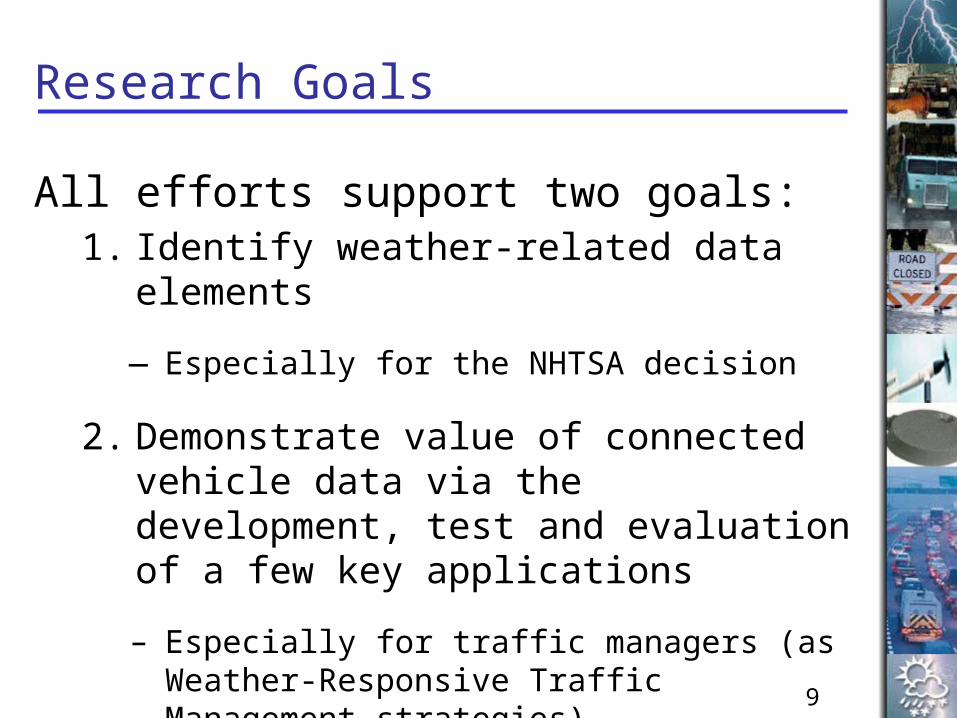
Research Goals
All efforts support two goals:1. Identify weather-related data
elements
—Especially for the NHTSA decision
2. Demonstrate value of connected vehicle data via the development, test and evaluation of a few key applications
– Especially for traffic managers (as Weather-Responsive Traffic Management strategies)
10
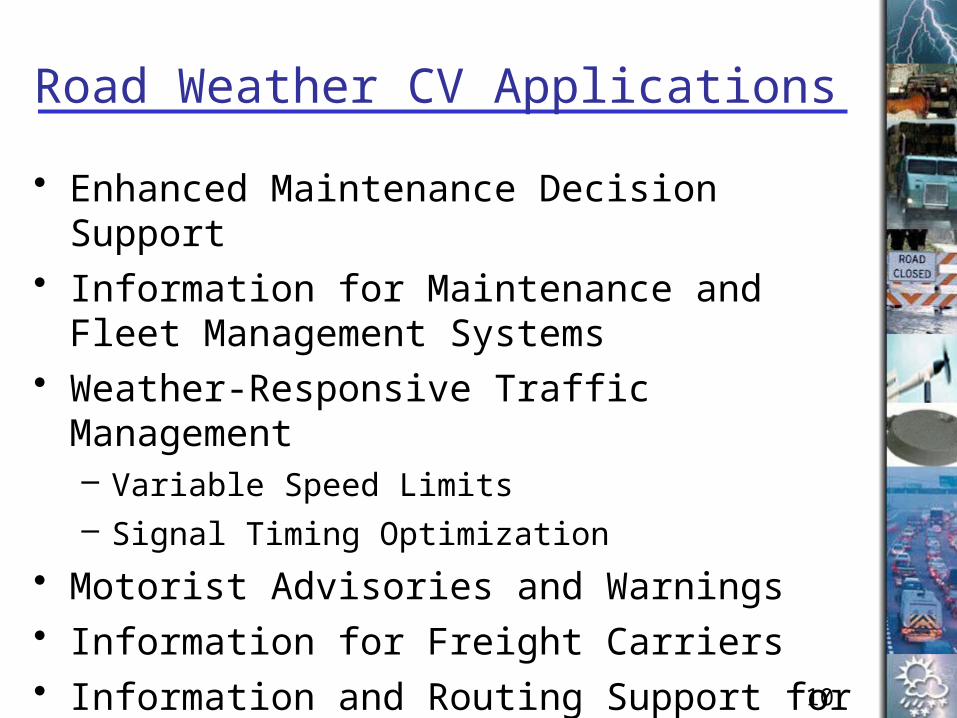
Road Weather CV Applications
• Enhanced Maintenance Decision Support• Information for Maintenance and Fleet
Management Systems• Weather-Responsive Traffic Management
– Variable Speed Limits– Signal Timing Optimization
• Motorist Advisories and Warnings• Information for Freight Carriers• Information and Routing Support for
Emergency Responders
11
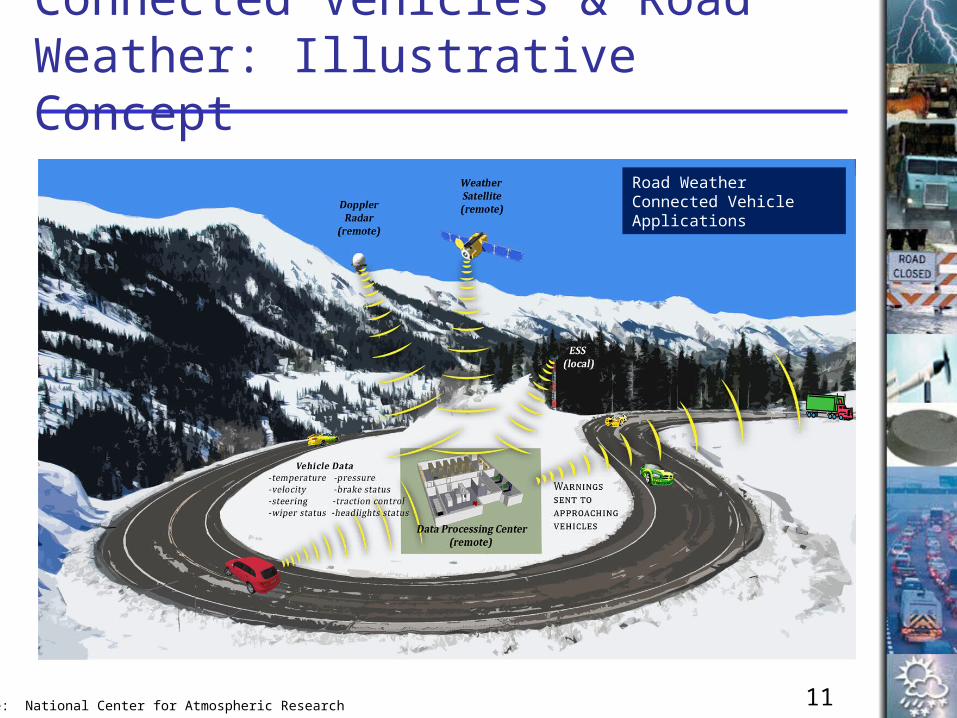
Connected Vehicles & Road Weather: Illustrative Concept
Road Weather Connected Vehicle Applications
Source: National Center for Atmospheric Research
12
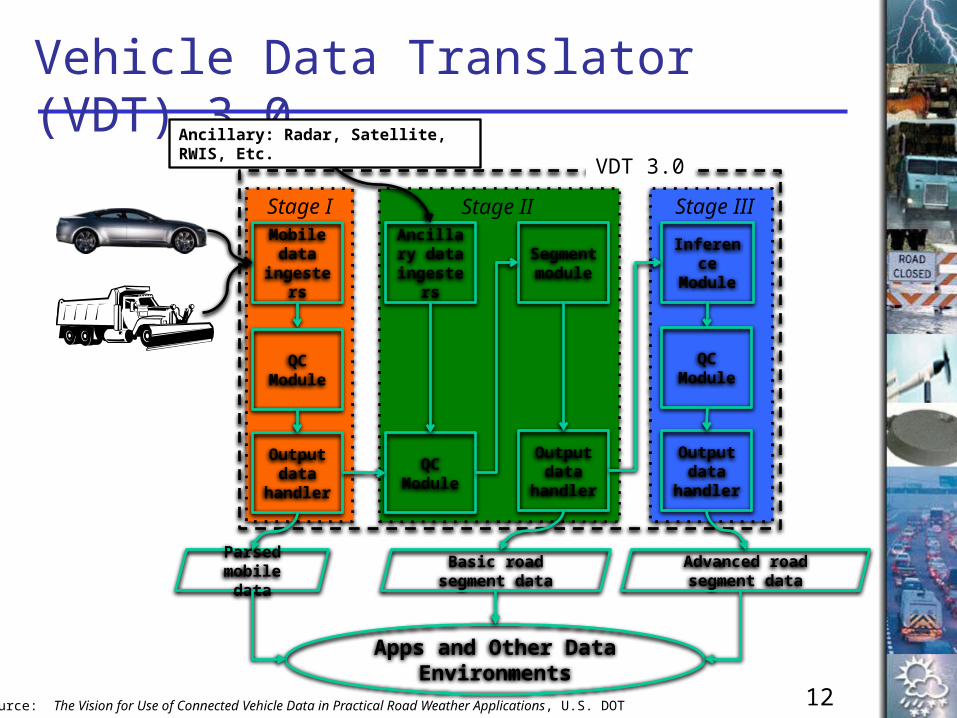
Vehicle Data Translator (VDT) 3.0
Mobile data
ingesters
Parsed mobile data
Output data
handler
QC Module
Segment
module
Ancillary data ingeste
rs
Basic road segment data
Output data
handler
Inference
Module
Advanced road segment data
Output data
handler
Apps and Other Data Environments
Stage I Stage II Stage III
VDT 3.0
Ancillary: Radar, Satellite, RWIS, Etc.
QC Module
QC Module
Source: The Vision for Use of Connected Vehicle Data in Practical Road Weather Applications, U.S. DOT
13
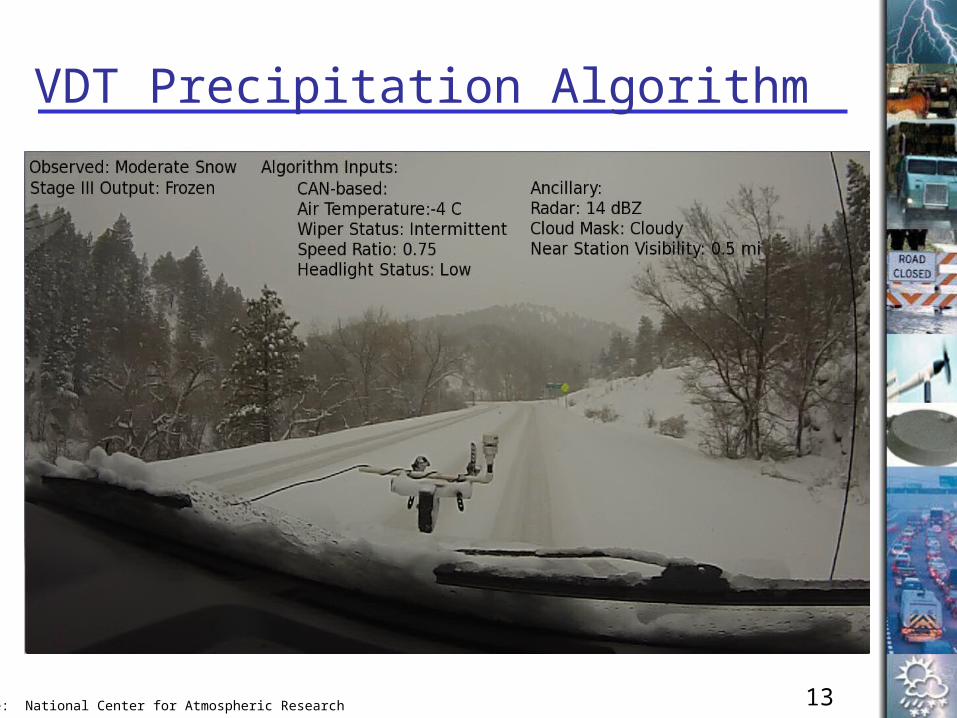
VDT Precipitation Algorithm
Source: National Center for Atmospheric Research
14
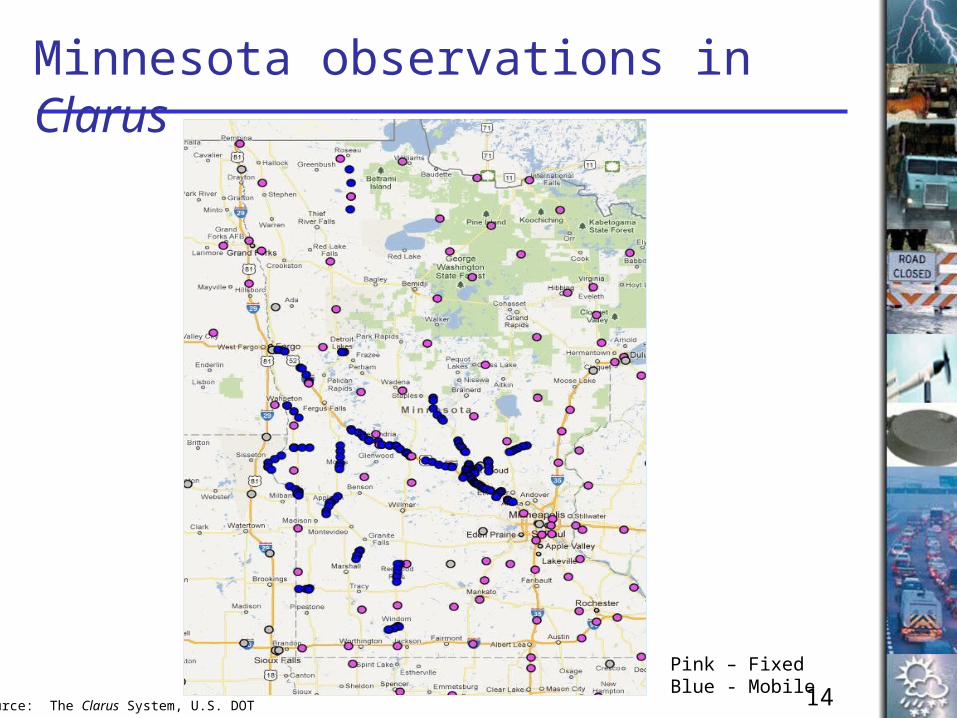
Minnesota observations in Clarus
Pink – FixedBlue - Mobile
Source: The Clarus System, U.S. DOT
15
Integrating Mobile Observations 2.0Participating states are serving as both providers of mobile data (CAN-Bus and external sensors) as well as users of the information / RdWx CV applications• Michigan DOT
– Instrument and deploy 20 snow plows and 50 light trucks with CV technologies
– Implement weather information communications application
• Minnesota DOT– 305 heavy duty trucks and 30 light duty trucks– Implement and operate applications (Enhanced MDSS,
Information for Maintenance or Fleet Management Systems, Records Automation, and Motorist Advisory Warning)
• Nevada DOT– 25 vehicles (mix of plows, light duty vehicles, and passenger
cars)– Enhance Maintenance Management System (MMS)
16
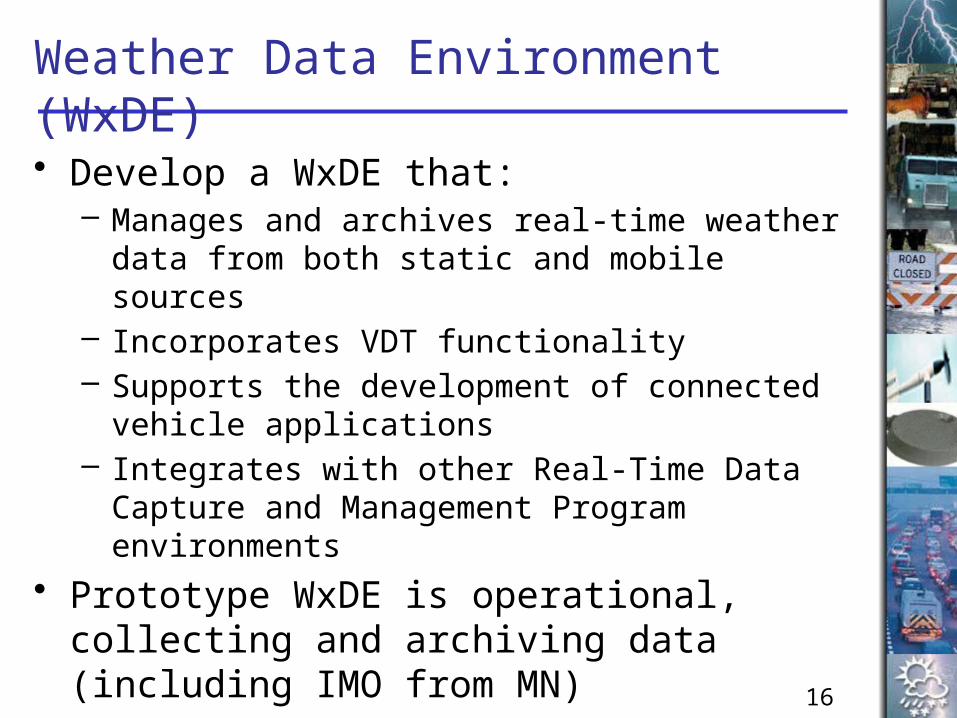
Weather Data Environment (WxDE)• Develop a WxDE that:
– Manages and archives real-time weather data from both static and mobile sources
– Incorporates VDT functionality– Supports the development of connected
vehicle applications– Integrates with other Real-Time Data Capture
and Management Program environments• Prototype WxDE is operational, collecting
and archiving data (including IMO from MN)
17
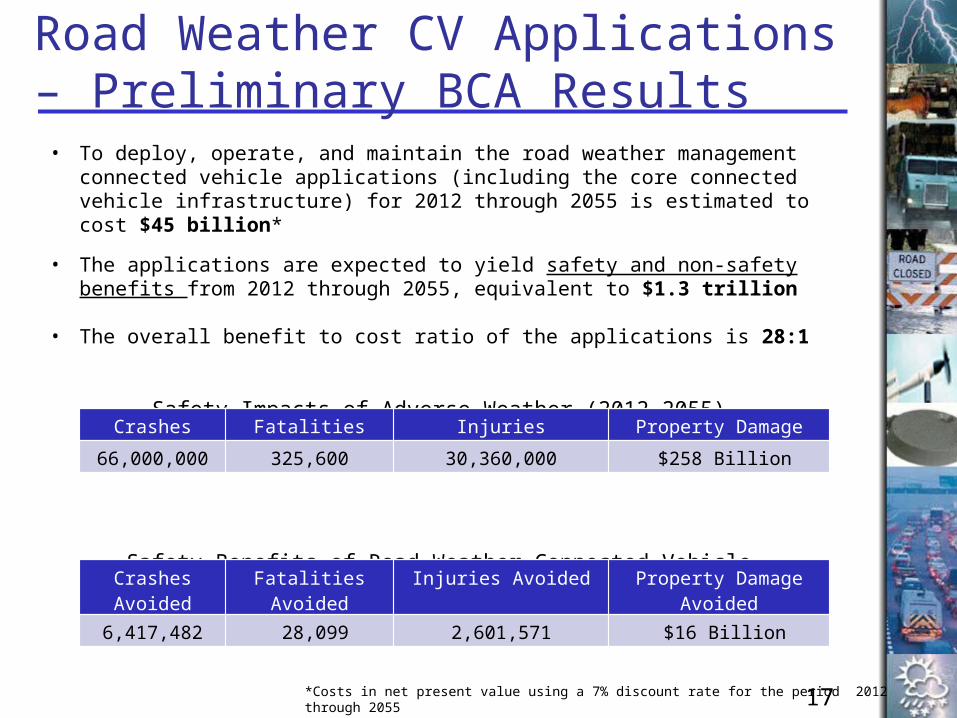
Road Weather CV Applications – Preliminary BCA Results• To deploy, operate, and maintain the road weather management
connected vehicle applications (including the core connected vehicle infrastructure) for 2012 through 2055 is estimated to cost $45 billion*
• The applications are expected to yield safety and non-safety benefits from 2012 through 2055, equivalent to $1.3 trillion
• The overall benefit to cost ratio of the applications is 28:1
Safety Impacts of Adverse Weather (2012-2055)
Safety Benefits of Road Weather Connected Vehicle Applications (2012-2055)
*Costs in net present value using a 7% discount rate for the period 2012 through 2055
Crashes Fatalities Injuries Property Damage
66,000,000 325,600 30,360,000 $258 Billion
Crashes Avoided
Fatalities Avoided
Injuries Avoided Property Damage Avoided
6,417,482 28,099 2,601,571 $16 Billion
18
Conclusion
• We are on the cusp of a major game-changer with respect to Connected Vehicles and Road Weather
• This is an interdisciplinary program that needs interdisciplinary collaborationPaul Pisano
Team Leader, Road Weather & Work Zone ManagementFHWA Office of Operations(202) [email protected]