Embed Size (px)
Citation preview
1
P009-Use of data mining techniques for better
insights of iron making processes at Tata Steel
Team1.Arunabh Bhattacharjee(Speaker)2.Shambhu Tiwary3.Ashish Chakravorty
Agenda
Why do you need data mining?
Data mining and business intelligence
Business value
Methodology
Application Case
Reduce NH3 in clean coke oven gas
Conclusions
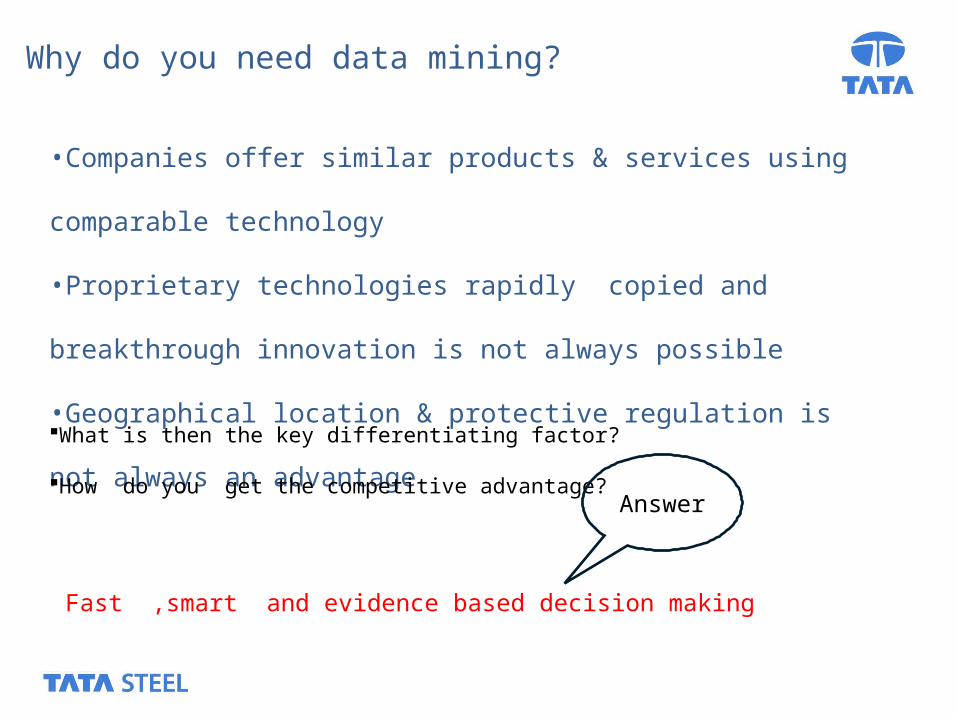
Why do you need data mining?
•Companies offer similar products & services using comparable technology
•Proprietary technologies rapidly copied and breakthrough innovation is not
always possible
•Geographical location & protective regulation is not always an advantage
What is then the key differentiating factor?
How do you get the competitive advantage?
Fast ,smart and evidence based decision making
Answer
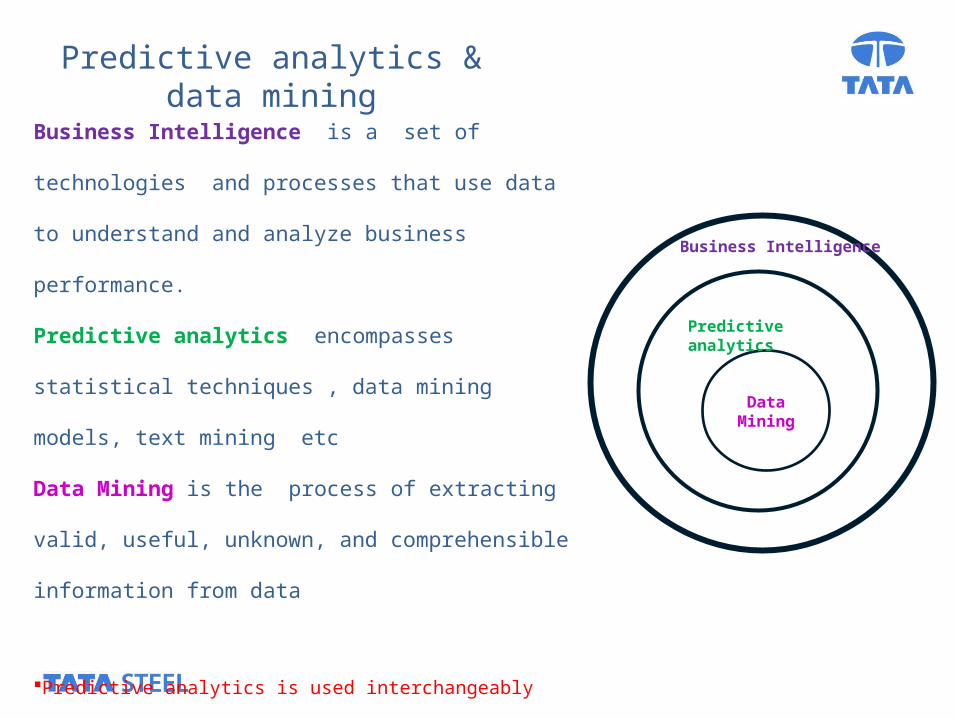
Predictive analytics & data mining
Business Intelligence is a set of technologies and processes
that use data to understand and analyze business
performance.
Predictive analytics encompasses statistical techniques , data
mining models, text mining etc
Data Mining is the process of extracting valid, useful,
unknown, and comprehensible information from data
Predictive analytics is used interchangeably with data mining
Term has become popular and used by most IT vendors
Data Mining
Predictive analytics
Business Intelligence
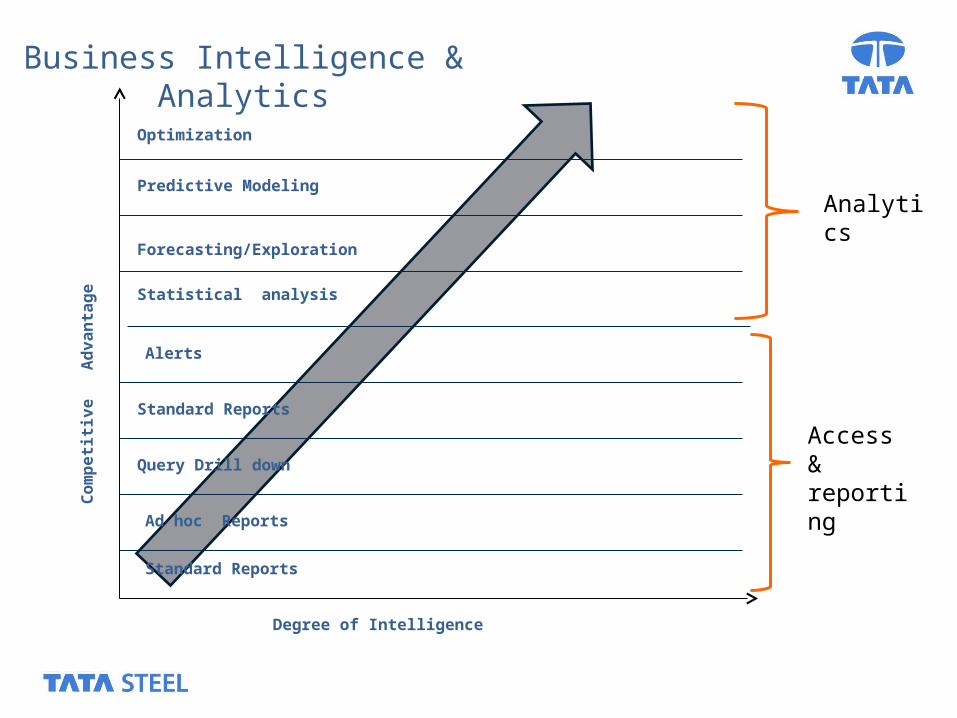
Business Intelligence & Analytics
Degree of Intelligence
Co
mp
eti
tiv
e
Ad
va
nta
ge
Standard Reports
Ad hoc Reports
Query Drill down
Standard Reports
Statistical analysis
Alerts
Predictive Modeling
Forecasting/Exploration
Optimization
Access & reporting
Analytics
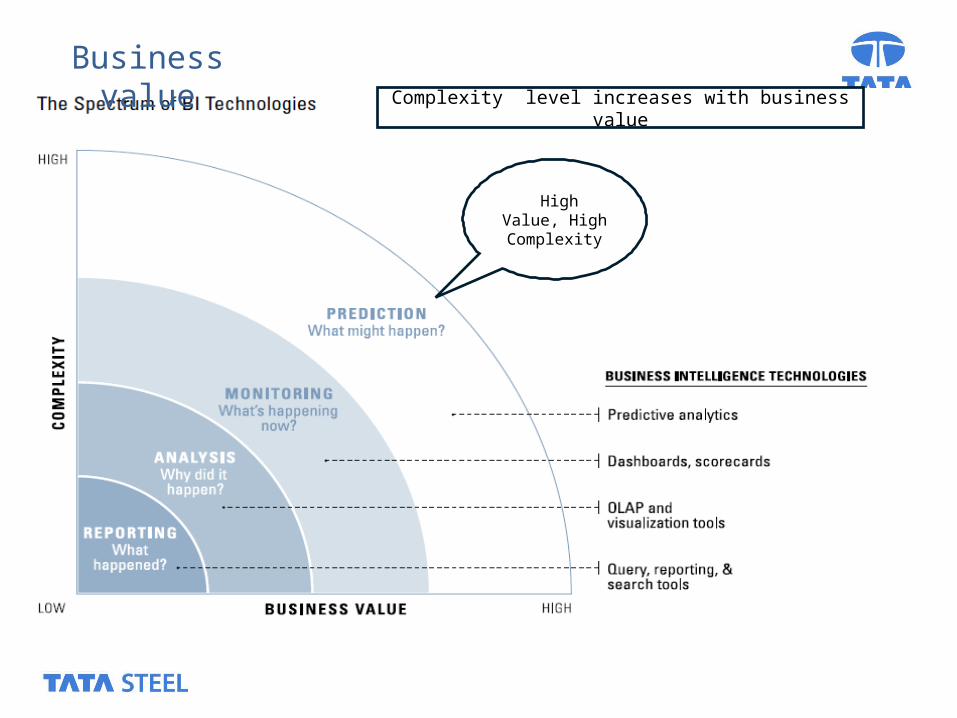
Business valueComplexity level increases with business value
High Value, High
Complexity
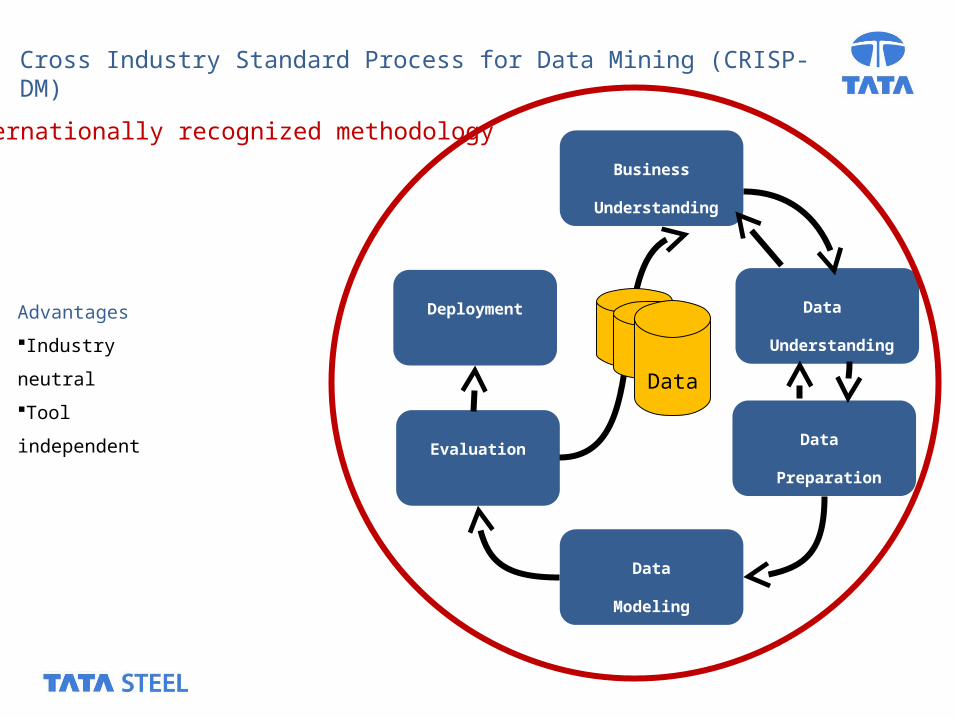
Business
Understanding
Data
Preparation
Data
Understanding
Data
Modeling
Evaluation
Deployment
Data
Advantages
Industry neutral
Tool independent
Cross Industry Standard Process for Data Mining (CRISP-DM)
Internationally recognized methodology
Application Case
Reduce NH3 in Clean coke oven gas
Oven
Heating Chamber
Cle
an g
as
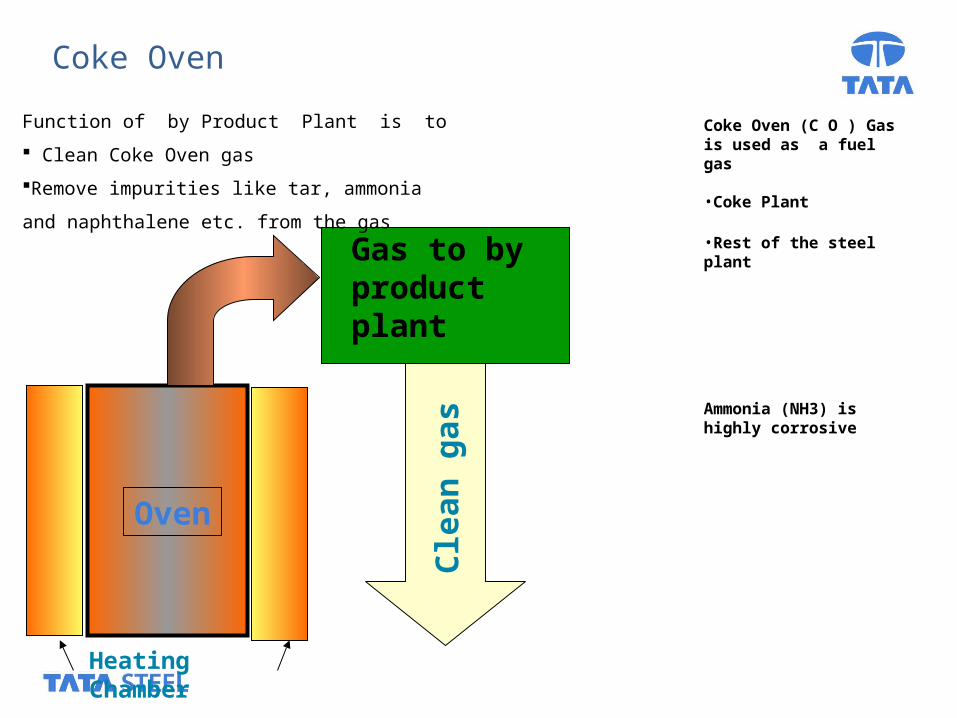
Gas to by product plant
Coke Oven (C O ) Gas is used as a fuel gas •Coke Plant
•Rest of the steel plant
Ammonia (NH3) is highly corrosive
Function of by Product Plant is to
Clean Coke Oven gas
Remove impurities like tar, ammonia and
naphthalene etc. from the gas
Coke Oven
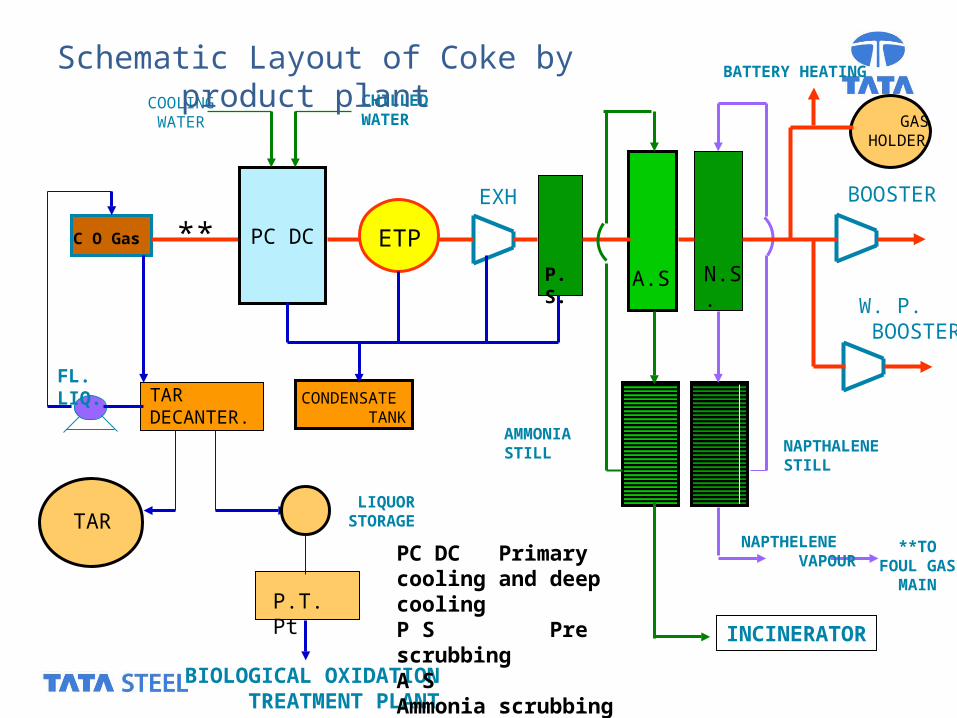
CONDENSATE TANK
COOLING WATER
CHILLED WATER
EXH
INCINERATOR
NAPTHELENE VAPOUR
**TOFOUL GAS
MAIN
LIQUORSTORAGE
BIOLOGICAL OXIDATION TREATMENT PLANT
GASHOLDER
BOOSTER
BATTERY HEATING
W. P. BOOSTER
FL. LIQ.
P. S. A.S. N.S.
TAR
P.T. Pt
TAR DECANTER.
AMMONIA STILL NAPTHALENE
STILL
**C O Gas ETPPC DC
PC DC Primary cooling and deep coolingP S Pre scrubbingA S Ammonia scrubbing
Schematic Layout of Coke by product plant
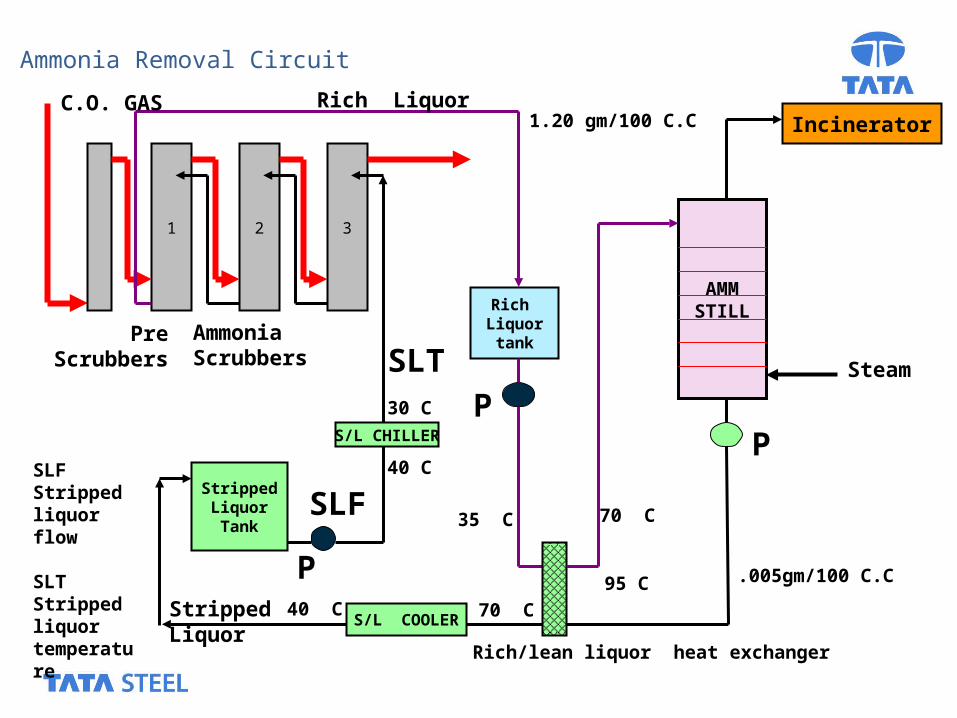
1 2 3
StrippedLiquorTank
Rich Liquortank
AMMSTILL
S/L CHILLER
IncineratorC.O. GAS
AmmoniaScrubbers
PreScrubbers
Rich/lean liquor heat exchanger
S/L COOLER
P
SLF
95 C
70 C
35 C 70 C
Rich Liquor
StrippedLiquor
1.20 gm/100 C.C
.005gm/100 C.C
40 C
30 C
40 C
Steam
P
P
SLT
SLF Stripped liquor flow
SLT Stripped liquor temperature
Ammonia Removal Circuit
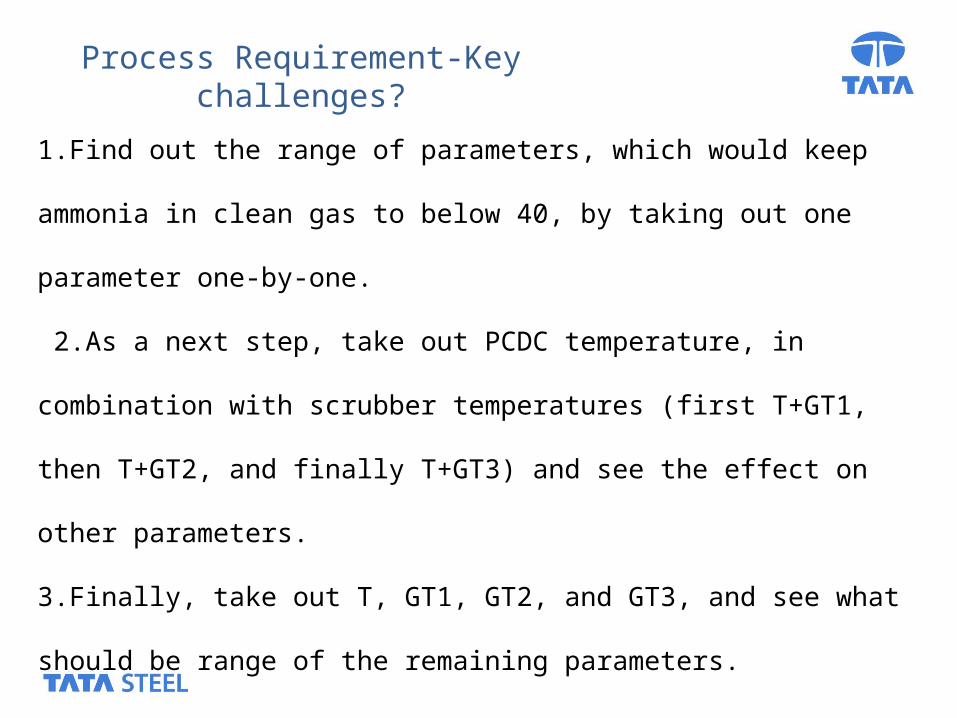
1.Find out the range of parameters, which would keep ammonia in clean gas to
below 40, by taking out one parameter one-by-one.
2.As a next step, take out PCDC temperature, in combination with scrubber
temperatures (first T+GT1, then T+GT2, and finally T+GT3) and see the effect on
other parameters.
3.Finally, take out T, GT1, GT2, and GT3, and see what should be range of the
remaining parameters.
Process Requirement-Key challenges?
Data Preparation
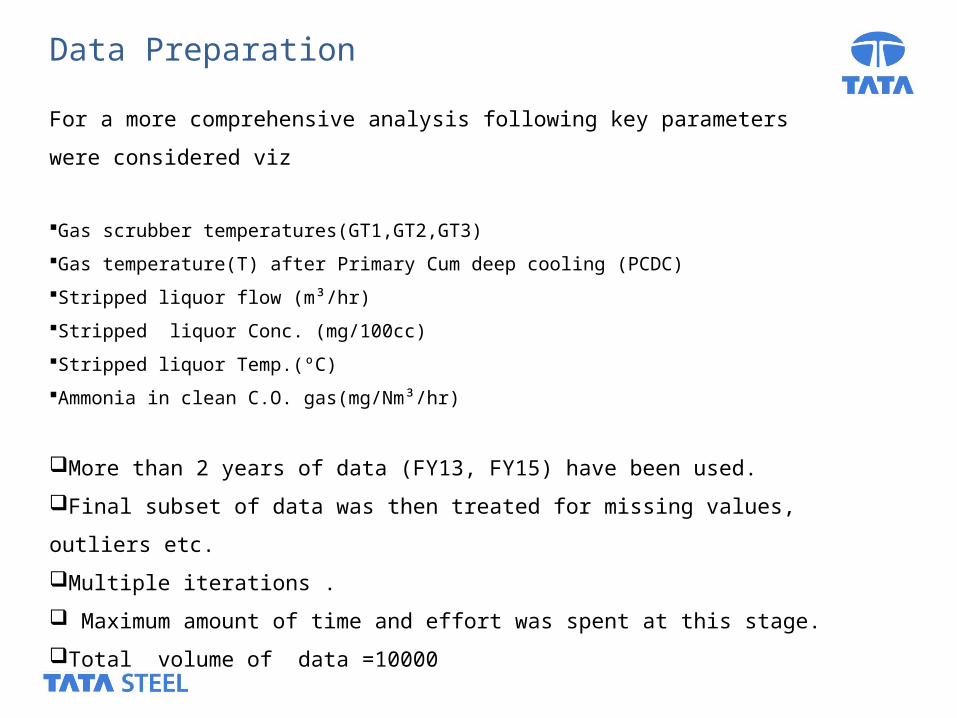
For a more comprehensive analysis following key parameters were considered viz
Gas scrubber temperatures(GT1,GT2,GT3)
Gas temperature(T) after Primary Cum deep cooling (PCDC)
Stripped liquor flow (m³/hr)
Stripped liquor Conc. (mg/100cc)
Stripped liquor Temp.(ºC)
Ammonia in clean C.O. gas(mg/Nm³/hr)
More than 2 years of data (FY13, FY15) have been used.
Final subset of data was then treated for missing values, outliers etc.
Multiple iterations .
Maximum amount of time and effort was spent at this stage.
Total volume of data =10000
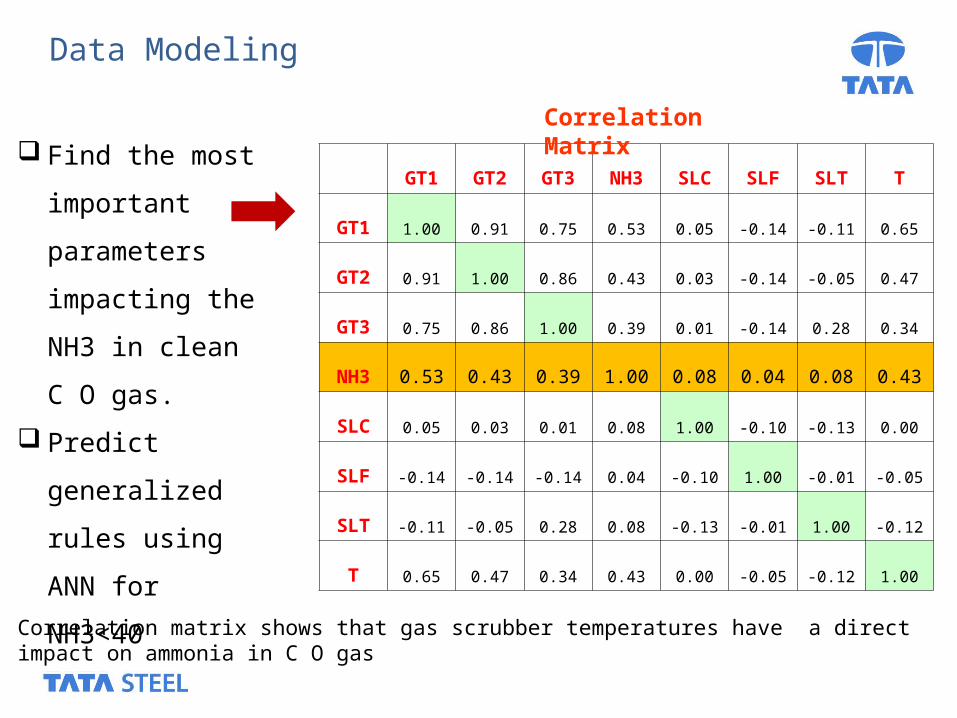
GT1 GT2 GT3 NH3 SLC SLF SLT T
GT1 1.00 0.91 0.75 0.53 0.05 -0.14 -0.11 0.65
GT2 0.91 1.00 0.86 0.43 0.03 -0.14 -0.05 0.47
GT3 0.75 0.86 1.00 0.39 0.01 -0.14 0.28 0.34
NH3 0.53 0.43 0.39 1.00 0.08 0.04 0.08 0.43
SLC 0.05 0.03 0.01 0.08 1.00 -0.10 -0.13 0.00
SLF -0.14 -0.14 -0.14 0.04 -0.10 1.00 -0.01 -0.05
SLT -0.11 -0.05 0.28 0.08 -0.13 -0.01 1.00 -0.12
T 0.65 0.47 0.34 0.43 0.00 -0.05 -0.12 1.00
Correlation Matrix
Correlation matrix shows that gas scrubber temperatures have a direct impact on ammonia in C O gas
Data Modeling
Find the most
important
parameters
impacting the NH3
in clean C O gas.
Predict
generalized rules
using ANN for
NH3<40
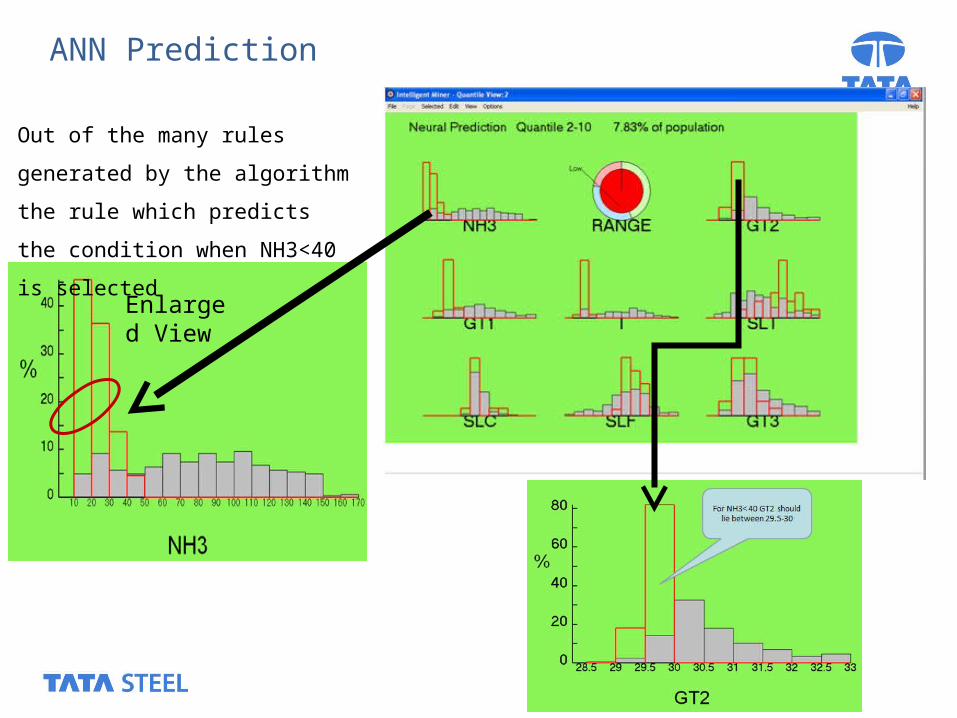
Enlarged View
Out of the many rules generated by
the algorithm the rule which
predicts the condition when
NH3<40 is selected
ANN Prediction
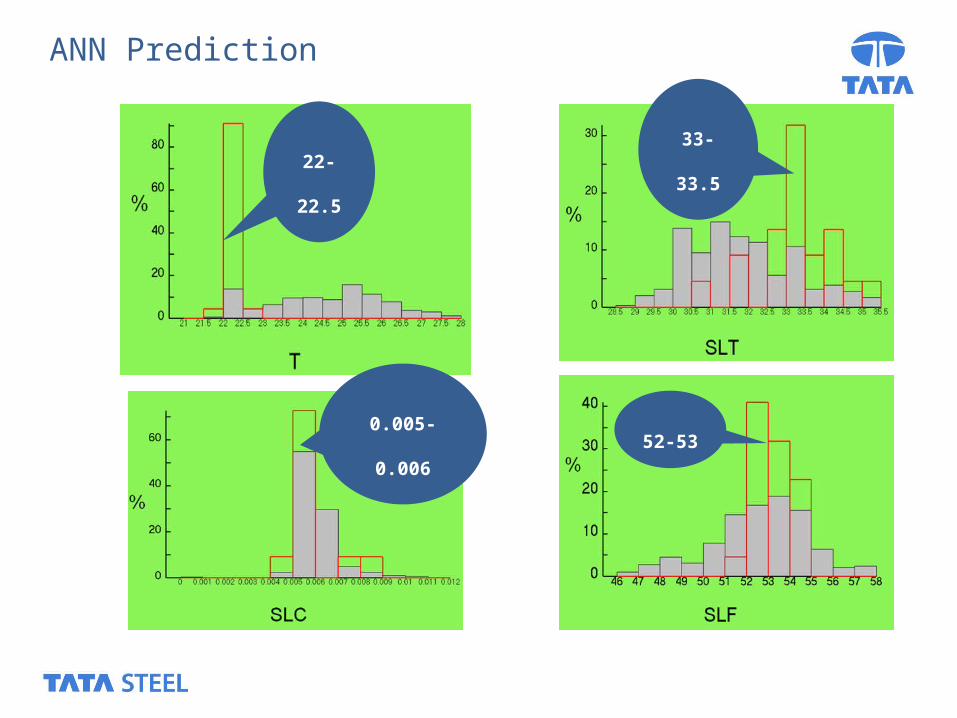
22-22.533-33.5
0.005-0.006 52-53
ANN Prediction
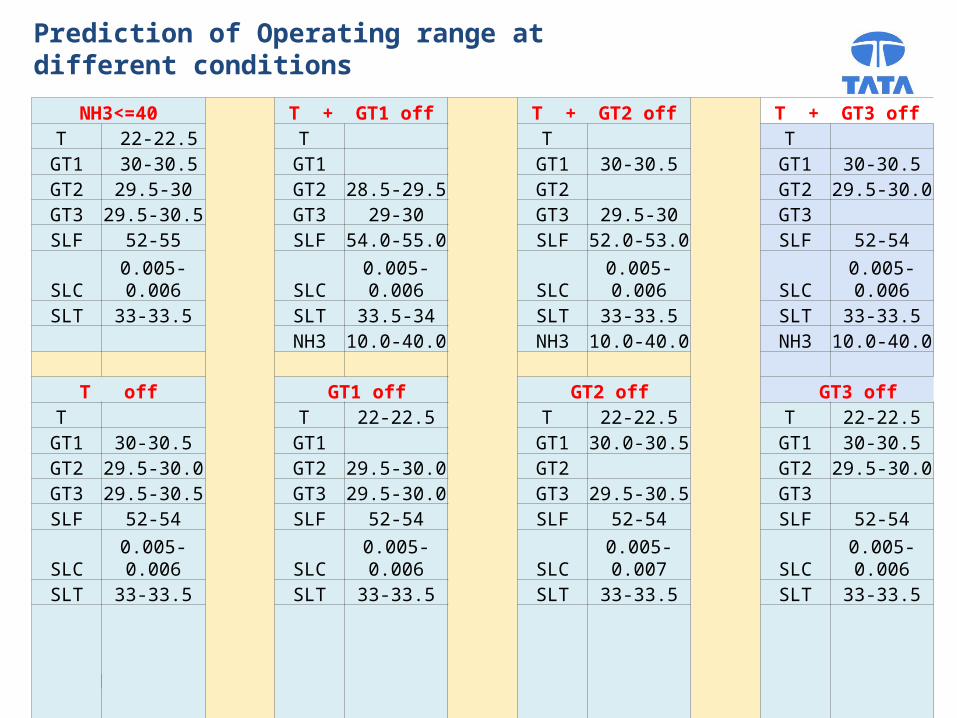
NH3<=40
T + GT1 off
T + GT2 off
T + GT3 offT 22-22.5 T T T
GT1 30-30.5 GT1 GT1 30-30.5 GT1 30-30.5GT2 29.5-30 GT2 28.5-29.5 GT2 GT2 29.5-30.0GT3 29.5-30.5 GT3 29-30 GT3 29.5-30 GT3 SLF 52-55 SLF 54.0-55.0 SLF 52.0-53.0 SLF 52-54SLC 0.005-0.006 SLC 0.005-0.006 SLC 0.005-0.006 SLC 0.005-0.006SLT 33-33.5 SLT 33.5-34 SLT 33-33.5 SLT 33-33.5
NH3 10.0-40.0 NH3 10.0-40.0 NH3 10.0-40.0
T off GT1 off GT2 off GT3 offT T 22-22.5 T 22-22.5 T 22-22.5
GT1 30-30.5 GT1 GT1 30.0-30.5 GT1 30-30.5GT2 29.5-30.0 GT2 29.5-30.0 GT2 GT2 29.5-30.0GT3 29.5-30.5 GT3 29.5-30.0 GT3 29.5-30.5 GT3 SLF 52-54 SLF 52-54 SLF 52-54 SLF 52-54SLC 0.005-0.006 SLC 0.005-0.006 SLC 0.005-0.007 SLC 0.005-0.006SLT 33-33.5 SLT 33-33.5 SLT 33-33.5 SLT 33-33.5
NH3 10.0-40.0 NH3 10.0-40.0 NH3 10.0-40.0 NH3 10.0-40.0
Prediction of Operating range at different conditions
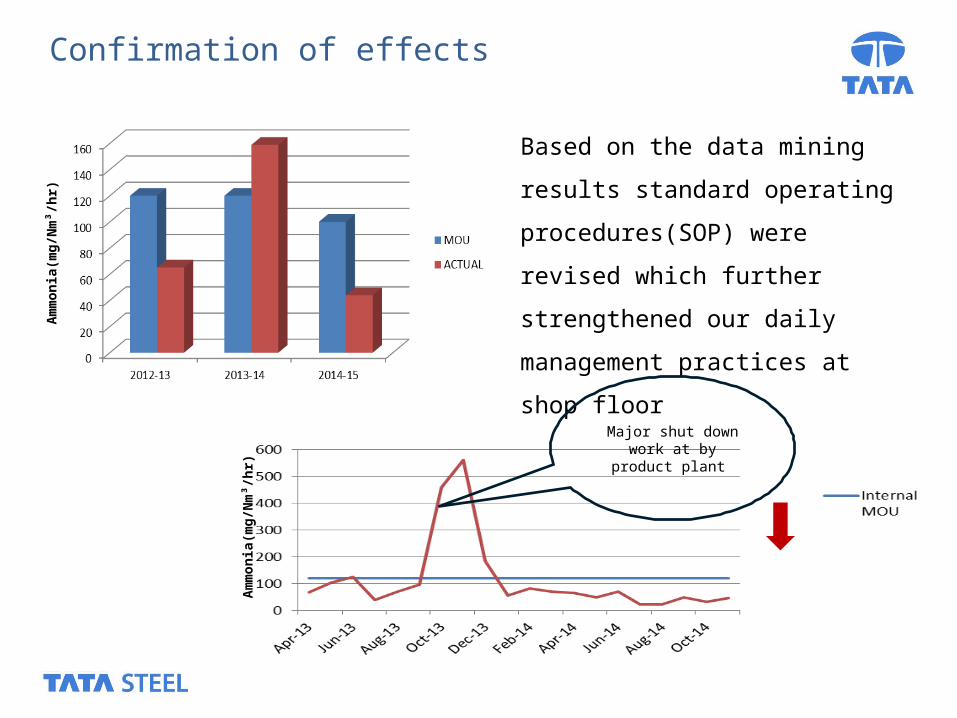
Confirmation of effectsA
mm
on
ia(m
g/N
m³/
hr)
Am
mo
nia
(mg
/Nm
³/h
r)
Based on the data mining results
standard operating procedures(SOP)
were revised which further
strengthened our daily management
practices at shop floor
Major shut down work at by product plant
In addition to the well known areas like marketing & sales, fraud detection etc.
data mining can also be used in complex processes like that of iron and steel
making.
Data mining is a very intelligent technique to get meaningful insights from large
volumes of data in just few seconds.
Data mining can be a key differentiator in fast and evidence based decision
making
Conclusions
End of presentation
Thank You!