Embed Size (px)
Citation preview

1
Overview of theCanadian dairy industry
Gilles Froment, M.Sc., P.Ag.Senior Director, Policy and Corporate Affairs
Canadian Dairy Commission, OttawaMarch 26, 2009
DM146846

2
Outline
The Canadian marketing system and its component
3 pillars of supply management Seasonality programs Milk pools Marketing and innovation initiatives Current issues

3
The Canadian Milk Marketing System and its Components

4
14,036 farms producing more than 80 billion litres of milk (8 million tonnes)
445 processing plants Milk sales: $5.2 billion Adds a net $9.7 billion to the GDP Processed products sales: $11.6 billion Supports $30 billion of economic activity Sustains more than 160,600 jobs
Snapshot of theCanadian Dairy Industry

5

6
Major Milk Producing Countries(cow milk, 2007)
020406080
100120140160
EU 27
India
USACh
ina
Russia
German
yBr
azil
Fran
ce
New
Zealan
dUK
Mexico
Austr
alia
Cana
da
(Mill
ion
tonn
es)
Source: International Dairy Federation

7
Canada’s Milk Marketing System
Producer
Marketing Board (provincial)
Processor
Further processor
Consumer
Retailer

8
CMSMC
Canadian Milk Supply Management Committee Permanent body of signatories of the National Milk
Marketing Plan - NMMP (voting members)
– One vote per province Dairy Farmers of Canada, Dairy Processors Association of
Canada and Consumers’ Association of Canada (non-voting members)
Responsible for policy determination and supervision of the NMMP provisions
Meets 4 times a year Virtually all decisions require unanimity

9
The CMSMC directs the implementation of the National Milk Marketing Plan (NMMP) to coordinate actions of provincial producer boards and governments
Non-votingmembers
CDCchair
DPAC
CAC
DFC
Sask (3)
Quebec (4)
P.E.I. (3)
Ontario (4)
N.S. (3)
N.B. (3)
Newfoundland (3)
Alberta (3)
B.C. (3)
Manitoba (3)

10
NMMP
National Milk Marketing Plan Federal-provincial agreement Regulates marketing of industrial milk Balances supply and demand Sets out the establishment, distribution and
adjustment of industrial milk quota

11
The Canadian Dairy Commission Crown corporation created in 1966 Reports to Parliament through Minister 3 commissioners, 63 employees Generally deals with industrial milk Total budget for 2007-2008: $7.8 million Funded by government, dairy producers
and the marketplace

12
Legislated Mandate
Provide efficient producers of milk and cream with the opportunity to obtain a fair return for their labour and investment.
Provide consumers of dairy products with a continuous and adequate supply of dairy products of high quality.

13
Overview of Key Activities Chair the CMSMC Calculate Estimated Requirements (demand) Recommend Market Sharing Quota Establish Support Prices Administer Revenue and Market Sharing
Agreements (pools) Administer Special Milk Class Permit Program Carry out external audits Create and administer marketing programs Remove surplus production Administer Seasonality Programs

14
Milk Categories
Industrial (Classes 2-4) used in the manufacture of
butter, cheese, ice cream, yogurt, milk powders
longer shelf life federal responsibility –
interprovincial movement of product
Fluid (Class 1) used in 1%, 2%, skim milk,
etc. and creams short shelf life provincial responsibility
– historically made and consumed in province of origin

15
3 Pillars of Supply Management controlled prices controlled
imports controlled
production

16
Pillar 1: Controlled Prices
Industrial milk prices Are determined by provinces based on CDC
support prices and vary depending on the end use of the milk
Support prices are the prices at which the CDC buys and sells butter and skim milk powder under its various programs.
Support prices are announced in December by the CDC to be effective February 1.

17
Support prices 1997-2009 ($/kg)
3
3,5
4
4,5
5
5,5
6
6,5
7
7,5
ButterSMP
18
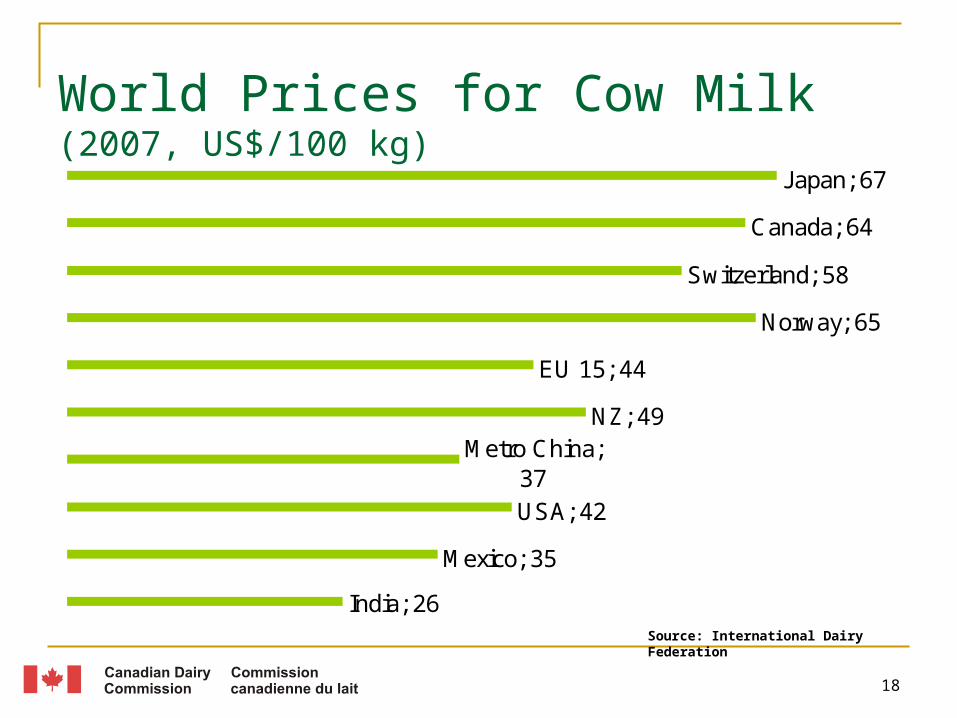
World Prices for Cow Milk (2007, US$/100 kg)
India; 26
Mexico; 35
USA; 42
Metro China; 37
NZ; 49
EU 15; 44
Norway; 65
Switzerland; 58
Canada; 64
Japan; 67
Source: International Dairy Federation

19
Evolution of Farm Prices in Canada and the US1999 to 2009
$20,00
$30,00
$40,00
$50,00
$60,00
$70,00
$80,00
1999 2000 2001 2002 2003 2004 2005 2006 2007 2008 2009
CA
$ p
er
HL
Canada Target Price Highest of Class III and Class IV Prices in the US (converted to CA$ per HL)

20
Pillar 1: Controlled Prices
Fluid milk prices are determined by provinces according to
a formula 40% indexed COP 30%CPI 30%PDI/capita
Valid until Jan 31, 2010 Currently negotiating a new formula with
all 10 provinces

21
Milk Prices in last 12 monthsFebruary 2008 – January 2009
Average in-quota revenues : $72.20
Average price for fluid: $85.41
Average price for industrial: $63.53

22
Example - Prices per component
Class $/kg
BF
$/kg protein
$/kg other solids
$/hl standard
@3.6 kg
Fluid milk 1(a) 7.37 66.01 $/hl for SNF 92.53
Cheddar 3(b) 7.65 13.31 0.85 75.51
Butter 4(a) 7.65 5.27 5.27 74.66
Cheese as ingredient 5(a)
3.54 9.36 0.0001 43.05
23
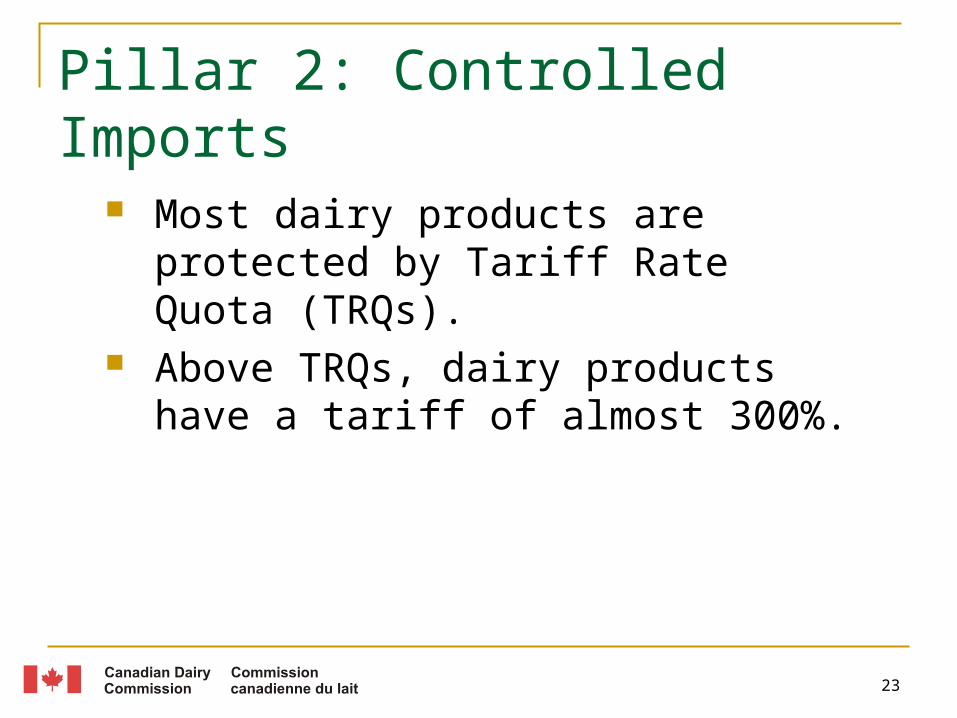
Pillar 2: Controlled Imports
Most dairy products are protected by Tariff Rate Quota (TRQs).
Above TRQs, dairy products have a tariff of almost 300%.

24
Pillar 2: Controlled Imports
Examples of TRQ and over-quota tariffs
Product TRQ (t) Tariff (%)
Skim milk powder 0 201.5
Dry whey 3.2 208.0
Butter 3.3 298.5
Cheese 21.4 245.5
Ice cream 0.484 277.0

25
Landed Price vs Domestic Price (Butter)2001-2009
0,00
5,00
10,00
15,00
20,00
25,00
2001 2002 2003 2004 2005 2006 2007 2008 2009
CA
$ /
Kg
Landed Price (Low) Domestic Price

26
Landed Price vs Domestic Price (Skim Milk Powder)
0,00
2,00
4,00
6,00
8,00
10,00
12,00
14,00
16,00
2001 2002 2003 2004 2005 2006 2007 2008 2009
CA
$ /K
g
Landed Price (Low) Domestic Price

27
Pillar 3: Controlled Production Provincial milk marketing boards allocate
production quota to their respective dairy farmers. This quota combines both fluid milk quota and
industrial milk quota. Fluid milk quota is established by provincial
marketing boards and equals demand. Industrial milk quota is established nationally by the
CMSMC and is called Market Sharing Quota (MSQ).
Quota is calculated and expressed in kg of BF.

28
Establishing MSQ
The CDC calculates the Estimated Canadian Requirements - ECR (demand) on a monthly basis.
ECR= Production + Opening Stocks + Imports – Closing stocks – exports – DDPIP – Class 4(m)
MSQ is adjusted every two months when ECR increase or decrease.

29
The 7 steps in sharing quota adjustments among provinces
1 Skim-off
2 The 10:90 rule
3 PEI’s share
4 DDPIP
5 Growth allowance
6 Exports
7 Fluid quota

30
100
120
140
160
180
200
220
1974
1976
1978
1980
1982
1984
1986
1988
1990
1992
1994
1996
1998
2000
2002
2004
2006
'2008
mill
ion
kg
BF
Evolution of MSQ
Quota cut of 1976
1% and 2% milk more popular; lower butter consumption
Low butter stocks

31
Respecting production targets Provincial production targets:
Upper limit: 0.5% Lower limit: 1.5%
Provinces are free to have their own policies to adjust their farm quota or not, however, provinces will be penalized if they over or under produce their share of quota.
Over production: no payment for the milk Under production: lost opportunity to produce

32
Evolution of production, demand and stocks
46,00
47,00
48,00
49,00
50,00
51,00
52,00
Nov/n
ov 2
006
Dec/d
éc 2
006
Jan/
janv 2
007
Feb/fé
v 200
7
Mar
/mar
s 200
7
Apr/a
vril 2
007
May
/mai
2007
Jun/
juin
2007
Jul/ju
ill 20
07
Aug/a
oût 2
007
Sept/s
ept 2
007
Oct/oc
t 200
7
Nov/n
ov 2
007
Dec/d
éc 2
007
Jan/
jan 2
008
Feb/fé
v 200
8
Mar
/mar
s 200
8
Apr/a
vril 2
008
May
/mai
2008
Jun/
juin
2008
Jul/ju
ill 20
08
Aug/a
oût 2
008
Sept/s
ept 2
008
Oct/oc
t 200
8
Nov/n
ov 2
008
Pro
du
ctio
n a
nd
CR
(m
il h
l)
10 000
15 000
20 000
25 000
30 000
35 000
40 000
Sto
cks
(t)
CDC + Private Butter Stocks Industrial production. Canadian requirements

33
CDC Seasonality Programs While milk production is quite stable year
round, people consume more dairy products in the fall/winter and less in the spring.
To offset this, the CDC buys and stores butter and skim milk powder in the spring and puts those products back in the market in the fall/winter.
These transactions are done at support prices.

34
Seasonality Programs - Butter Plan A
Becomes the property of the CDC
25 kg blocks
Plan B Must buy back within
one year of production of the product
One-pound prints ready for retail sales.

35
Managing Surpluses Production is managed on butterfat basis. Surpluses of milk solids non fat (SNF) arise
because consumers want the fat portion of the milk more than the SNF portion.
The CDC buys the surplus SNF and disposes of it by exporting it or selling it for animal feed.
Both these markets yield a lower return to producers than regular sales.

36
CDC Import / Export
IMPORTS According to WTO
(3,274 mt) Butter : sold to further
processors Cheese: private sector
imports (21,800 mt)
EXPORTS Subsidized exports
according to WTO limits (none to USA)
SMP (CDC exports to Cuba and Mexico)
Permits for private exporters including non-contingent classes

37
The Milk Pools

38
Pools were established in themid-1990’s in response to… Increased concentration at the retail and
processing levels New trade rules (FTA, NAFTA, WTO) Differing provincial policies (for ex. Milk
allocation to plants) Fluid milk moving between provinces Inequities in producer returns

39
The CDC administers 3 milk pools The P10 (all 10 provinces) The P5 (in the East) The WMP (in the West) These pools allow dairy farmers to share
and balance revenues, markets and in some cases, transportation costs.

40
Market Shares – All Milk
Fluid Industrial Pool
Region A (hl) 1,000 1,000 2,000
Region B (hl) 2,800 5,200 8,000
Total (hl) 3,800 6,200 10,000
Region A 50% 50% 20%
Region B 35% 65% 80%
Pool (%) 38% 62% 100%
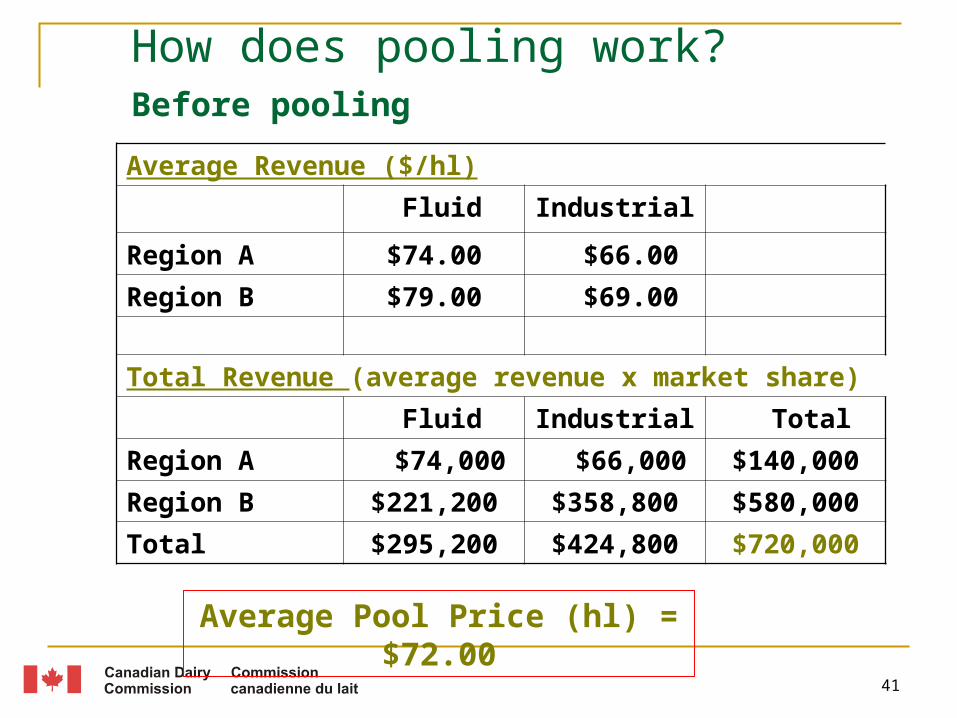
How does pooling work?Revenue Sharing
41
Average Revenue ($/hl)
Fluid Industrial
Region A $74.00 $66.00
Region B $79.00 $69.00
Total Revenue (average revenue x market share)
Fluid Industrial Total
Region A $74,000 $66,000 $140,000
Region B $221,200 $358,800 $580,000
Total $295,200 $424,800 $720,000
How does pooling work? Before pooling
Average Pool Price (hl) = $72.00

42
Revenue needed (market share x average pool revenue)
All Milk
Region A 2,000 $72.00 $144,000
Region B 8,000 $72.00 $576,000
Resulting Cash Transfers (Equalization Pool Payments)
Total $/hl
Region A $4,000 $2.00
Region B ($4,000) ($0.50)
Total ($0.00)
How does pooling work? After pooling
43
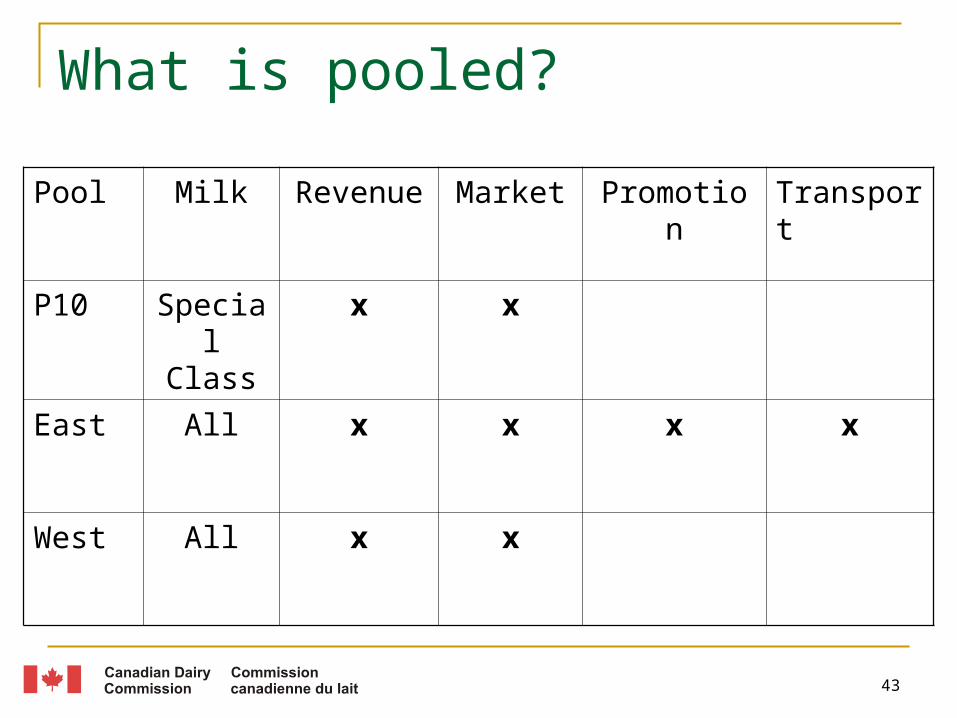
What is pooled?
Pool Milk Revenue Market Promotion Transport
P10 Special Class
x x
East All x x x x
West All x x

44
How pools are administered
Provinces report production and sales data (by milk class) monthly to the CDC.
The CDC calculates money transfers between members to equalize returns.
The CDC calculates quota allocations when demand changes.
The CDC keeps a bank account for pool operations.

45
Resulting in harmonization of…
Multiple component pricing Producer prices Milk classification Quota policies
POOL = RISK MANAGEMENT TOOL

46
Marketing and Innovation Initiatives of the CDC

47
Some of the CDC initiatives The Dairy Marketing Program The Domestic Dairy Product Innovation Program The Special Milk Class Permit Program

48
Strong market growth sectors
The finished products: - Sports recovery drinks/powders- Meal replacement products (bars, beverages)- Meal / dietary supplements- Organic products- Pet food
The dairy components:- Organic milk protein concentrates and isolates, casein,
caseinates, peptides The challenges:
- Ingredients that are still relatively new or not available from our industry (MPC,MPI)
- World market priced/ highly competitive market- Manufacturers/users looking for level playing field conditions

49
Current Issues

50
Current challenges Growing structural surplus of SMP - Finding
new markets for solids non fat current stocks of 35 million kgs
Evolving demand from consumers – substitution from non-dairy ingredients Soy-based products (imitation cheeses) frozen desserts
The market for dairy products is fairly mature Effect of the economic crisis on dairy
consumption?

51
Current challenges World Trade Organization: an unknown but so
far nothing to help supply management Increase market access? Lower tariffs? Sensitive products?
Harmonization issues Milk allocation in the East (P2) and Maritimes Quota policies Transportation Audit rules

52
Fragility of tariff wall The world prices for dairy products have dropped
significantly in 2008 with butter, SMP and cheese trading near support price levels in the US.
US milk prices at record low: below $10/cwt Price decline mainly driven by falling consumer
demand due to the current economic weakness and to an over supply situation from high prices in 2007.
At current world prices for butter and SMP (both at $1,600 US per tonne), the landed price plus the tariff exceeds the domestic support prices by $1.28/kg and $0.13/kg respectively.

53
Cheese Compositional Standards
Canadian Food Inspection Agency (CFIA) is responsible
Came into force in December 2008 The use of milk protein concentrate and milk
protein isolates is limited Processors warn of an increase in production
costs which will translate in an increase in retail price
Challenged in court by Saputo, Kraft and Parmalat

54
Future Pricing Issues Impact of current tariff protection Impact of future trade agreements Price sensitivity of particular classes Differential impact of fluid vs industrial pricing Expansion of Special Milk Class Permit Program Should support prices continue to drive industrial
milk pricing? Methodology for future price changes Difficulty to reach an agreement with dairy
industry stakeholders

55
A note of interest for students…

56
CDC Graduate Scholarships (2006-2011) To ensure that Canada has
enough specialists in the areas of Food and dairy science Economics and policy (Supply mgt) Animal science
M.Sc. and Ph.D.

57
QUESTIONS
www.cdc-ccl.gc.ca
www.dairyinfo.gc.ca
www.milkingredients.ca