Embed Size (px)
Citation preview

1. Our opinion is unmodifiedWe have audited the financial statements of Saga plc (‘the Company’ or ‘Group’ or ‘Parent’) for the year ended 31 January 2019 which comprise the Consolidated Income Statement, Consolidated Statement of Comprehensive Income, Consolidated Statement of Financial Position, Consolidated Statement of Changes in Equity and Consolidated Statement of Cash Flows, Parent Company Statement of Financial Position, Parent Company Statement of Changes in Equity, and the related notes, including the accounting policies notes.
In our opinion:• the financial statements give a true and fair view of the state of the Group’s and of the parent company’s affairs as at
31 January 2019 and of the Group’s loss for the year then ended• the Group financial statements have been properly prepared in accordance with International Financial Reporting
Standards as adopted by the European Union• the parent company financial statements have been properly prepared in accordance with UK accounting standards,
including FRS 101 Reduced Disclosure Framework and as applied in accordance with the provisions of the Companies Act 2006
• the financial statements have been prepared in accordance with the requirements of the Companies Act 2006 and, as regards the Group financial statements, Article 4 of the International Auditing Standards (‘IAS’) Regulation.
Basis for opinionWe conducted our audit in accordance with International Standards on Auditing (UK) (‘ISAs (UK)’) and applicable law. Our responsibilities are described below. We believe that the audit evidence we have obtained is a sufficient and appropriate basis for our opinion. Our audit opinion is consistent with our report to the Audit Committee.
We were first appointed as auditor by the shareholders on 22 June 2017. The period of total uninterrupted engagement is for the two financial years ended 31 January 2019. We have fulfilled our ethical responsibilities under, and we remain independent of the Group in accordance with, UK ethical requirements including the FRC Ethical Standard as applied to listed public interest entities. No non-audit services prohibited by that standard were provided.
Overview
Materiality: Group financial statements as a whole
£6.8m (2018: £9.0m) 3.9% (2018: 5.0%) of normalised profit before tax from continuing operations
Coverage 98% (2018: 98%) of total profits and losses that made up Group loss before tax
Key audit matter vs 2018
Event driven New: The impact of uncertainties due to Britain exiting the European Union on our audit
Recurring risks Valuation of claims outstanding (gross and net)
Recoverability of Group goodwill and the parent company’s investment in subsidiaries
Saga plc Annual Report and Accounts 2019118
Independent Auditor’s Report to the members of Saga plc
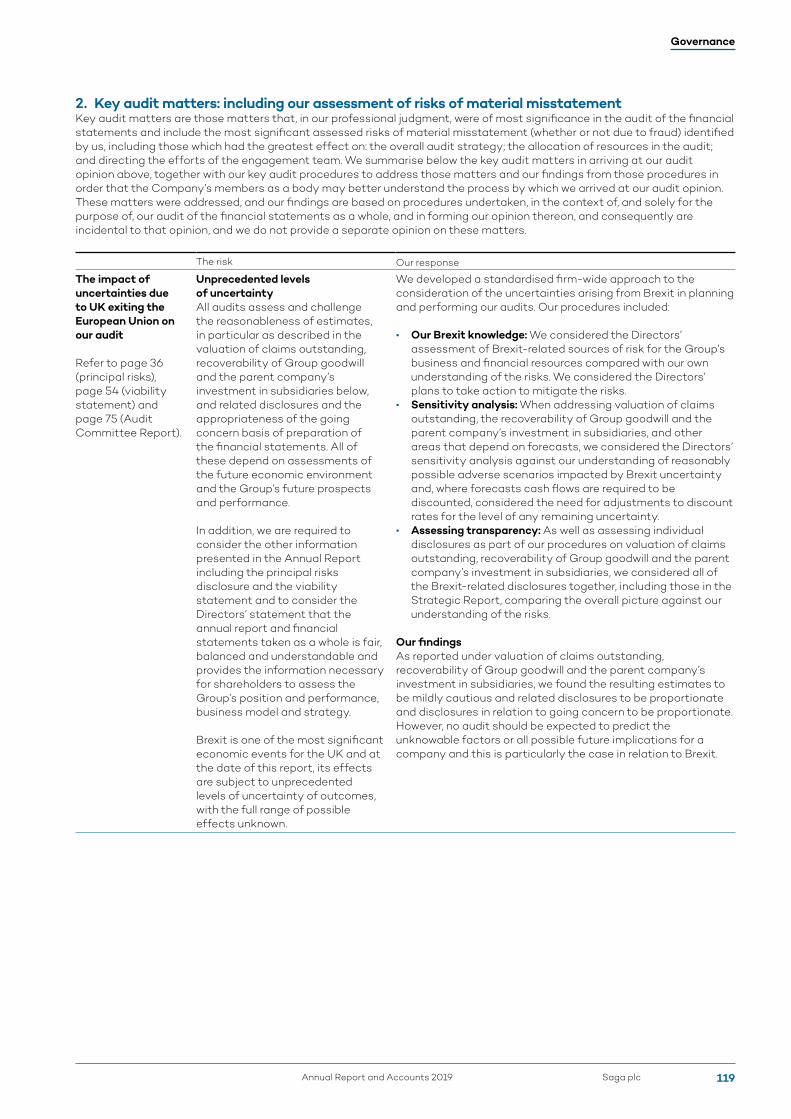
2. Key audit matters: including our assessment of risks of material misstatementKey audit matters are those matters that, in our professional judgment, were of most significance in the audit of the financial statements and include the most significant assessed risks of material misstatement (whether or not due to fraud) identified by us, including those which had the greatest effect on: the overall audit strategy; the allocation of resources in the audit; and directing the efforts of the engagement team. We summarise below the key audit matters in arriving at our audit opinion above, together with our key audit procedures to address those matters and our findings from those procedures in order that the Company’s members as a body may better understand the process by which we arrived at our audit opinion. These matters were addressed, and our findings are based on procedures undertaken, in the context of, and solely for the purpose of, our audit of the financial statements as a whole, and in forming our opinion thereon, and consequently are incidental to that opinion, and we do not provide a separate opinion on these matters.
The risk Our response
The impact of uncertainties due to UK exiting the European Union on our audit
Refer to page 36 (principal risks), page 54 (viability statement) and page 75 (Audit Committee Report).
Unprecedented levels of uncertainty All audits assess and challenge the reasonableness of estimates, in particular as described in the valuation of claims outstanding, recoverability of Group goodwill and the parent company’s investment in subsidiaries below, and related disclosures and the appropriateness of the going concern basis of preparation of the financial statements. All of these depend on assessments of the future economic environment and the Group’s future prospects and performance.
In addition, we are required to consider the other information presented in the Annual Report including the principal risks disclosure and the viability statement and to consider the Directors’ statement that the annual report and financial statements taken as a whole is fair, balanced and understandable and provides the information necessary for shareholders to assess the Group’s position and performance, business model and strategy.
Brexit is one of the most significant economic events for the UK and at the date of this report, its effects are subject to unprecedented levels of uncertainty of outcomes, with the full range of possible effects unknown.
We developed a standardised firm-wide approach to the consideration of the uncertainties arising from Brexit in planning and performing our audits. Our procedures included:
• Our Brexit knowledge: We considered the Directors’ assessment of Brexit-related sources of risk for the Group’s business and financial resources compared with our own understanding of the risks. We considered the Directors’ plans to take action to mitigate the risks.
• Sensitivity analysis: When addressing valuation of claims outstanding, the recoverability of Group goodwill and the parent company’s investment in subsidiaries, and other areas that depend on forecasts, we considered the Directors’ sensitivity analysis against our understanding of reasonably possible adverse scenarios impacted by Brexit uncertainty and, where forecasts cash flows are required to be discounted, considered the need for adjustments to discount rates for the level of any remaining uncertainty.
• Assessing transparency: As well as assessing individual disclosures as part of our procedures on valuation of claims outstanding, recoverability of Group goodwill and the parent company’s investment in subsidiaries, we considered all of the Brexit-related disclosures together, including those in the Strategic Report, comparing the overall picture against our understanding of the risks.
Our findings As reported under valuation of claims outstanding, recoverability of Group goodwill and the parent company’s investment in subsidiaries, we found the resulting estimates to be mildly cautious and related disclosures to be proportionate and disclosures in relation to going concern to be proportionate. However, no audit should be expected to predict the unknowable factors or all possible future implications for a company and this is particularly the case in relation to Brexit.
Governance
Saga plcAnnual Report and Accounts 2019 119
The risk Our response
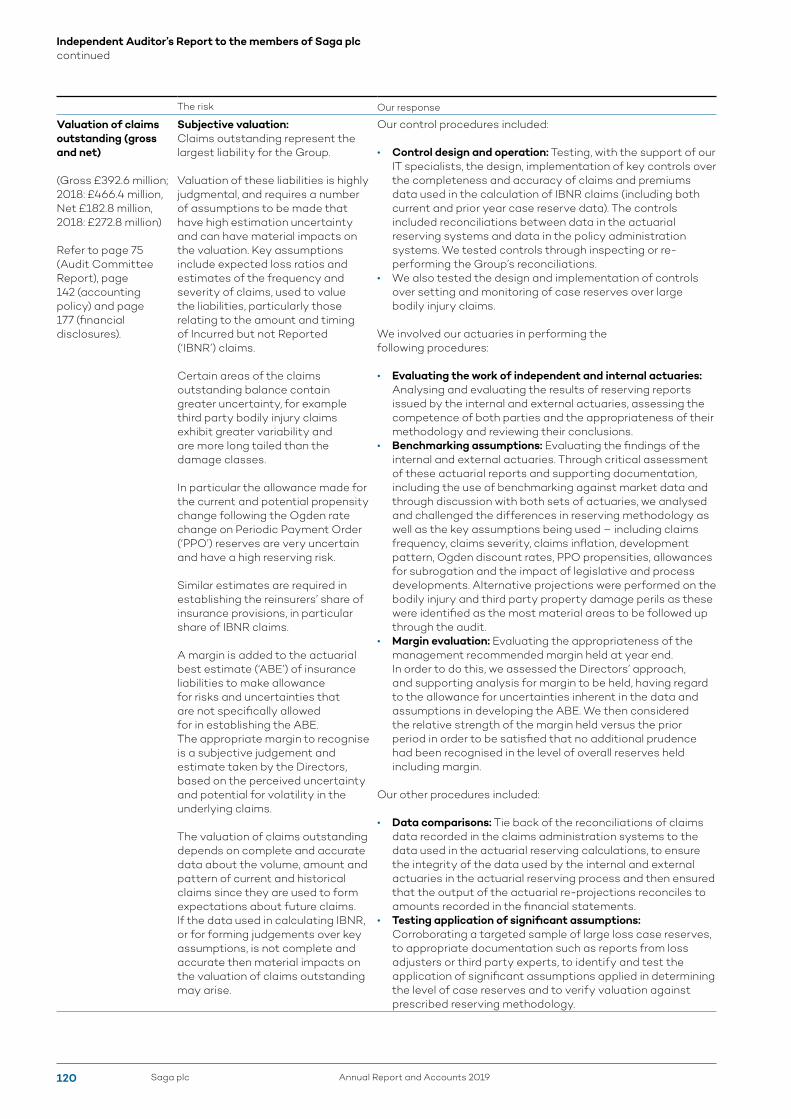
Valuation of claims outstanding (gross and net)
(Gross £392.6 million; 2018: £466.4 million, Net £182.8 million, 2018: £272.8 million)
Refer to page 75 (Audit Committee Report), page 142 (accounting policy) and page 177 (financial disclosures).
Subjective valuation: Claims outstanding represent the largest liability for the Group.
Valuation of these liabilities is highly judgmental, and requires a number of assumptions to be made that have high estimation uncertainty and can have material impacts on the valuation. Key assumptions include expected loss ratios and estimates of the frequency and severity of claims, used to value the liabilities, particularly those relating to the amount and timing of Incurred but not Reported (‘IBNR’) claims.
Certain areas of the claims outstanding balance contain greater uncertainty, for example third party bodily injury claims exhibit greater variability and are more long tailed than the damage classes.
In particular the allowance made for the current and potential propensity change following the Ogden rate change on Periodic Payment Order (‘PPO’) reserves are very uncertain and have a high reserving risk.
Similar estimates are required in establishing the reinsurers’ share of insurance provisions, in particular share of IBNR claims.
A margin is added to the actuarial best estimate (‘ABE’) of insurance liabilities to make allowance for risks and uncertainties that are not specifically allowed for in establishing the ABE. The appropriate margin to recognise is a subjective judgement and estimate taken by the Directors, based on the perceived uncertainty and potential for volatility in the underlying claims.
The valuation of claims outstanding depends on complete and accurate data about the volume, amount and pattern of current and historical claims since they are used to form expectations about future claims. If the data used in calculating IBNR, or for forming judgements over key assumptions, is not complete and accurate then material impacts on the valuation of claims outstanding may arise.
Our control procedures included:
• Control design and operation: Testing, with the support of our IT specialists, the design, implementation of key controls over the completeness and accuracy of claims and premiums data used in the calculation of IBNR claims (including both current and prior year case reserve data). The controls included reconciliations between data in the actuarial reserving systems and data in the policy administration systems. We tested controls through inspecting or re-performing the Group’s reconciliations.
• We also tested the design and implementation of controls over setting and monitoring of case reserves over large bodily injury claims.
We involved our actuaries in performing the following procedures:
• Evaluating the work of independent and internal actuaries: Analysing and evaluating the results of reserving reports issued by the internal and external actuaries, assessing the competence of both parties and the appropriateness of their methodology and reviewing their conclusions.
• Benchmarking assumptions: Evaluating the findings of the internal and external actuaries. Through critical assessment of these actuarial reports and supporting documentation, including the use of benchmarking against market data and through discussion with both sets of actuaries, we analysed and challenged the differences in reserving methodology as well as the key assumptions being used – including claims frequency, claims severity, claims inflation, development pattern, Ogden discount rates, PPO propensities, allowances for subrogation and the impact of legislative and process developments. Alternative projections were performed on the bodily injury and third party property damage perils as these were identified as the most material areas to be followed up through the audit.
• Margin evaluation: Evaluating the appropriateness of the management recommended margin held at year end. In order to do this, we assessed the Directors’ approach, and supporting analysis for margin to be held, having regard to the allowance for uncertainties inherent in the data and assumptions in developing the ABE. We then considered the relative strength of the margin held versus the prior period in order to be satisfied that no additional prudence had been recognised in the level of overall reserves held including margin.
Our other procedures included:
• Data comparisons: Tie back of the reconciliations of claims data recorded in the claims administration systems to the data used in the actuarial reserving calculations, to ensure the integrity of the data used by the internal and external actuaries in the actuarial reserving process and then ensured that the output of the actuarial re-projections reconciles to amounts recorded in the financial statements.
• Testing application of significant assumptions: Corroborating a targeted sample of large loss case reserves, to appropriate documentation such as reports from loss adjusters or third party experts, to identify and test the application of significant assumptions applied in determining the level of case reserves and to verify valuation against prescribed reserving methodology.
Saga plc Annual Report and Accounts 2019120
Independent Auditor’s Report to the members of Saga plc continued

The risk Our response
Valuation of claims outstanding (gross and net) (cont.)
The effect of these matters is that, as part of our risk assessment, we determined that the valuation of insurance contracts liabilities has a high degree of estimation uncertainty, with a potential range of reasonable outcomes greater than our materiality for the financial statements as a whole, and possibly many times that amount.
• Tests of detail: For a sample of individual large bodily injury claims, we evaluated the level of review, oversight and third party evidence available and the frequency of updates against new information.
• Assessing the risk transfer elements of the reinsurance contracts and the accuracy of a sample of reinsurance recoveries recorded, including reinsurance recoveries related to IBNR, against the terms of relevant reinsurance agreements.
• Assessing transparency: Assessing whether the Group’s disclosures about the degree of estimation uncertainty and the sensitivity of the balance to changes in key assumptions reflected the risks inherent in the valuation of claims outstanding.
Our findings We found that the assumptions and estimates were cautious (2018: cautious) with proportionate (2018: proportionate) disclosure of the sensitivities to changes in key assumptions and estimates as inputs to the valuation.
Recoverability of Group Goodwill and the parent company’s investment in subsidiaries
(Group goodwill: £1,175.0 million; 2018: £1,485.0 million; parent company’s investment in subsidiaries: £1,069.8 million, 2018: £2,104.2 million)
Refer to page 75 (Audit Committee Report), pages 136 and 194 (accounting policy) and pages 159 and 196 (financial disclosures).
Forecast-based valuation: Goodwill in the Group and the carrying amount of the parent company’s investment in subsidiaries are significant and at risk of irrecoverability if forecast business performance for the Group’s retail insurance broking and travel businesses, in particular, were to fall significantly short of business plans. The estimated recoverable amount of goodwill and the parent company’s investment in subsidiaries are subjective due to the inherent uncertainty involved in forecasting and discounting future cash flows.
The effect of these matters is that, as part of our risk assessment, we determined that the valuation of Group goodwill and the parent company’s investment in subsidiaries has a high degree of estimation uncertainty, with a potential range of reasonable outcomes greater than our materiality for the financial statements as a whole, and possibly many times that amount.
Our procedures included:
• Control design: Evaluating the design and implementation of the Group’s impairment assessment procedures, including those controls over the approvals of business plans, including as applied to the parent company.
• Historical comparisons: Assessing the reasonableness of cash flow projections against historical performance.
• Benchmarking assumptions: Comparing the Group’s and the parent company’s assumptions to externally derived data in relation to key inputs such as projected economic growth, competition, cost inflation and discount rates with the support of our valuation specialists.
• Comparing valuations: Comparing and reconciling the sum of the value-in-use for the Group’s cash generating units and for the parent company investment in subsidiaries to the market capitalisation of the Group and corroborating any significant differences.
• Sensitivity analysis: Using our analytical tools to: assess the sensitivity of the goodwill headroom and to conclude on the appropriateness of the impairment recognised in relation to the goodwill attributed to the Group’s Insurance cash generating unit, having regard to reasonably possible changes in key assumptions, both individually and collectively; and to assess and conclude on the appropriateness of the impairment recognised in relation to the carrying value of the parent company’s investment in subsidiaries.
• Assessing transparency: Assessing whether the Group disclosures about the sensitivity of the outcome of the impairment assessment to changes in key assumptions reflects the risks inherent in the valuation of goodwill and in the carrying value of the parent company’s investment in subsidiaries.
Our findings We found that the resulting estimates over the recoverable amount of Group goodwill and of the parent company’s investment in subsidiaries to be mildly cautious (2018 finding: mildly optimistic) and, when taken with the estimates at the start of the year, the effect on the reported loss for the year to be cautious. We found the disclosures of the drivers of impairment and the sensitivities of goodwill headroom and carrying value of parent company investment in subsidiaries to changes in key assumptions to be proportionate (2018: proportionate).
Governance
Saga plcAnnual Report and Accounts 2019 121
3. Our application of materiality and an overview of the scope of our auditMateriality for the Group financial statements as a whole was set at £6.8m (2018: £9.0m), determined with reference to a benchmark of Group loss before tax, normalised to exclude this year’s impairment charge as disclosed in note 15a, of £175.4m (2018: £178.7m), of which it represents 3.9% (2018: 5.0%).
Materiality for the parent company financial statements as a whole was set at £5.0m (2018: £2.5m), which represents 0.5% (2018: 0.1%) of total assets. This is lower than the materiality we would otherwise have determined by reference to Company total assets.
We agreed to report to the Audit Committee any corrected or uncorrected identified misstatements exceeding £0.27m (2018: £0.36m), in addition to other identified misstatements that warranted reporting on qualitative grounds.
Of the Group’s 14 (2018: 14) reporting components, we subject 4 (2018: 4) to full scope audits for Group purposes and 3 (2018: 4) to specified risk-focused audit procedures. The latter were not individually financially significant enough to require a full scope audit for Group purposes, but did present specific individual risks that needed to be addressed. For the residual components, we performed analysis at an aggregated Group level to re-examine our assessment that there were no significant risks of material misstatement within these.
The components within the scope of our work accounted for the percentages illustrated opposite.
The Group team instructed component auditors as to the significant areas to be covered, including the relevant risks detailed above and the information to be reported back. The Group team approved the component materialities, which ranged from £1.0m to £5.0m (2018: £1.1m-£4.5m), having regard to the size and risk profile of the Group across the components. The work on 3 of the 14 components was performed by component auditors and the rest, including the audit of the parent company, was performed by the Group team. The Group audit team performed specific procedures on the impairment of goodwill of £310m which was excluded in arriving at the normalised Group profit before tax for the year as identified above.
The Group audit team met KPMG Gibraltar during 2018 and 2019 to assess the audit risks and strategy. Telephone conference meetings were also held with KPMG Gibraltar. At these visits and meetings, the findings reported to the Group audit team were discussed in more detail, and any further work required by the Group audit team was then performed by the component auditor.
Saga plc Annual Report and Accounts 2019122
Independent Auditor’s Report to the members of Saga plc continued

Normalised profit before tax from continuing operations
Group materiality
Profit before tax
Group materiality£6.8m (2018: £9.0m)
£6.8mWhole financial statements materiality (2018: £9.0m)
£5.0mRange of materiality at 14 components (£1.0m-£5.0m) (2018: £1.1m-£4.5m)
£0.27mMisstatements reported to the Audit Committee (2018: £0.36m)
£175.4m (2018: £178.7m)
Group revenue Total profits and losses that made up the normalised Group profit before tax
Group total assets
97%(2018: 93%)
98%(2018: 98%)
99%(2018: 98%)
Full scope for Group audit purposes 2019 94%Specified risk-focused audit procedures 2019 3%Full scope for Group audit purposes 2018 85%Specified risk-focused audit procedures 2018 8%Residual components
Full scope for Group audit purposes 2019 90%Specified risk-focused audit procedures 2019 8%Full scope for Group audit purposes 2018 82%Specified risk-focused audit procedures 2018 16%Residual components
Full scope for Group audit purposes 2019 98%Specified risk-focused audit procedures 2019 1%Full scope for Group audit purposes 2018 95%Specified risk-focused audit procedures 2018 3%Residual components
4. We have nothing to report on going concernThe Directors have prepared the financial statements on the going concern basis as they do not intend to liquidate the Company or the Group or to cease their operations, and as they have concluded that the Company’s and the Group’s financial position means that this is realistic. They have also concluded that there are no material uncertainties that could have cast significant doubt over their ability to continue as a going concern for at least a year from the date of approval of the financial statements (‘the going concern period’).
Our responsibility is to conclude on the appropriateness of the Directors’ conclusions and, had there been a material uncertainty related to going concern, to make reference to that in this audit report. However, as we cannot predict all future events or conditions and as subsequent events may result in outcomes that are inconsistent with judgements that were reasonable at the time they were made, the absence of reference to a material uncertainty in this auditor’s report is not a guarantee that the Group and the Company will continue in operation.
In our evaluation of the Directors’ conclusions, we considered the inherent risks to the Group’s and Company’s business model, including the impact of Brexit, and analysed how those risks might affect the Group’s and Company’s financial resources or ability to continue operations over the going concern period. The risks that we considered most likely to adversely affect the Group’s and Company’s available financial resources over this period were:
• the ability of the Group’s trading businesses to deliver on business plans in the face of increasing market competition, cost pressure and a significant change agenda
• the external regulatory landscape and the impact that the increased focus on General Insurance pricing practices may have on future profitability
• the risk of a significant slowdown in the macro-economic environment, heightened by the increased risk of a disorderly Brexit, with the consequential impacts on the Group’s trading businesses.
Governance
Saga plcAnnual Report and Accounts 2019 123
As these were risks that could potentially cast significant doubt on the Group’s and the Company’s ability to continue as a going concern, we considered sensitivities over the level of available financial resources indicated by the Group’s financial forecasts taking account of reasonably possible (but not unrealistic) adverse effects that could arise from these risks individually and collectively and evaluated the achievability of the actions the Directors consider they would take to improve the position should the risks materialise. We also considered less predictable but realistic second order impacts, such as the impact of Brexit and the erosion of customer or supplier confidence, which could result in a rapid reduction of available financial resources.
Based on this work, we are required to report to you if:
• we have anything material to add or draw attention to in relation to the Directors’ statement on page 132 to the financial statements on the use of the going concern basis of accounting with no material uncertainties that may cast significant doubt over the Group and Company’s use of that basis for a period of at least 12 months from the date of approval of the financial statements
• the related statement under the Listing Rules set out on page 55 is materially inconsistent with our audit knowledge.
We have nothing to report in these respects, and we did not identify going concern as a key audit matter.
5. We have nothing to report on the other information in the annual report and accountsThe Directors are responsible for the other information presented in the annual report and accounts together with the financial statements. Our opinion on the financial statements does not cover the other information and, accordingly, we do not express an audit opinion or, except as explicitly stated below, any form of assurance conclusion thereon.
Our responsibility is to read the other information and, in doing so, consider whether, based on our financial statements audit work, the information therein is materially misstated or inconsistent with the financial statements or our audit knowledge. Based solely on that work we have not identified material misstatements in the other information.
Strategic Report and Directors’ ReportBased solely on our work on the other information:
• we have not identified material misstatements in the Strategic Report and the Directors’ Report• in our opinion the information given in those reports for the financial year is consistent with the financial statements• in our opinion those reports have been prepared in accordance with the Companies Act 2006.
Directors’ Remuneration ReportIn our opinion the part of the Directors’ Remuneration Report to be audited has been properly prepared in accordance with the Companies Act 2006.
Disclosures of principal risks and longer-term viabilityBased on the knowledge we acquired during our financial statements audit, we have nothing material to add or draw attention to in relation to:
• the Directors’ confirmation within the viability statement on page 54 that they have carried out a robust assessment of the principal risks facing the Group, including those that would threaten its business model, future performance, solvency and liquidity
• the principal risks and uncertainties disclosures describing these risks and explaining how they are being managed and mitigated
• the Directors’ explanation in the viability statement of how they have assessed the prospects of the Group, over what period they have done so and why they considered that period to be appropriate, and their statement as to whether they have a reasonable expectation that the Group will be able to continue in operation and meet its liabilities as they fall due over the period of their assessment, including any related disclosures drawing attention to any necessary qualifications or assumptions.
Under the Listing Rules we are required to review the viability statement. We have nothing to report in this respect.
Our work is limited to assessing these matters in the context of only the knowledge acquired during our financial statements audit. As we cannot predict all future events or conditions and as subsequent events may result in outcomes that are inconsistent with judgments that were reasonable at the time they were made, the absence of anything to report on these statements is not a guarantee as to the Group’s and Company’s longer-term viability.
Saga plc Annual Report and Accounts 2019124
Independent Auditor’s Report to the members of Saga plc continued
Corporate governance disclosuresWe are required to report to you if:
• we have identified material inconsistencies between the knowledge we acquired during our financial statements audit and the Directors’ statement that they consider that the annual report and financial statements taken as a whole is fair, balanced and understandable and provides the information necessary for shareholders to assess the Group’s position and performance, business model and strategy
• a corporate governance statement has not been prepared by the Company.
We are required to report to you if the Corporate Governance Statement does not properly disclose a departure from the 11 provisions of the UK Corporate Governance Code specified by the Listing Rules for our review.
We have nothing to report in these respects.
Based solely on our work on the other information described above:
• with respect to the Corporate Governance Statement disclosures about internal control and risk management systems in relation to financial reporting processes and about share capital structures:
– we have not identified material misstatements therein – the information therein is consistent with the financial statements
• in our opinion, the Corporate Governance Statement has been prepared in accordance with relevant rules of the Disclosure Guidance and Transparency Rules of the Financial Conduct Authority.
6. We have nothing to report on the other matters on which we are required to report by exception
Under the Companies Act 2006, we are required to report to you if, in our opinion:
• adequate accounting records have not been kept by the parent company, or returns adequate for our audit have not been received from branches not visited by us
• the parent company financial statements and the part of the Directors’ Remuneration Report to be audited are not in agreement with the accounting records and returns
• certain disclosures of Directors’ remuneration specified by law are not made• we have not received all the information and explanations we require for our audit.
We have nothing to report in these respects.
7. Respective responsibilitiesDirectors’ responsibilitiesAs explained more fully in their statement set out on page 117, the Directors are responsible for: the preparation of the financial statements including being satisfied that they give a true and fair view; such internal control as they determine is necessary to enable the preparation of financial statements that are free from material misstatement, whether due to fraud or error; assessing the Group and parent company’s ability to continue as a going concern, disclosing, as applicable, matters related to going concern; and using the going concern basis of accounting unless they either intend to liquidate the Group or the parent company or to cease operations, or have no realistic alternative but to do so.
Auditor’s responsibilitiesOur objectives are to obtain reasonable assurance about whether the financial statements as a whole are free from material misstatement, whether due to fraud or other irregularities (see below), or error, and to issue our opinion in an auditor’s report. Reasonable assurance is a high level of assurance, but does not guarantee that an audit conducted in accordance with ISAs (UK) will always detect a material misstatement when it exists. Misstatements can arise from fraud, other irregularities or error and are considered material if, individually or in aggregate, they could reasonably be expected to influence the economic decisions of users taken on the basis of the financial statements.
A fuller description of our responsibilities is provided on the FRC’s website at www.frc.org.uk/auditorsresponsibilities
Irregularities – ability to detectWe identified areas of laws and regulations that could reasonably be expected to have a material effect on the financial statements from our general commercial and sector experience, through discussion with the Directors and other management (as required by auditing standards), and from inspection of the Group’s regulatory and legal correspondence and discussed with the Directors and other management the policies and procedures regarding compliance with laws and regulations. We communicated identified laws and regulations throughout our team and remained alert to any indications of non-compliance throughout the audit. This included communication from the Group to component audit teams of relevant laws and regulations identified at Group level.
Governance
Saga plcAnnual Report and Accounts 2019 125
The potential effect of these laws and regulations on the financial statements varies considerably.
Firstly, the Group is subject to laws and regulations that directly affect the financial statements including financial reporting legislation (including related companies legislation), distributable profits legislation, taxation legislation and pension legislation and we assessed the extent of compliance with these laws and regulations as part of our procedures on the related financial statement items.
Secondly, the Group is subject to many other laws and regulations where the consequences of non-compliance could have a material effect on amounts or disclosures in the financial statements, for instance through the imposition of fines or litigation or the loss of Group’s licences to operate. We identified the following areas as those most likely to have such an effect: regulatory capital, regulatory compliance, recognising that there are operations of the Group authorised and regulated by the Financial Conduct Authority (FCA) and the Civil Aviation Authority (CAA). We also identified certain aspects of company legislation recognising the financial and regulated nature of the Group’s activities and its legal form. Auditing standards limit the required audit procedures to identify non-compliance with these laws and regulations to enquiry of the Directors and other management and inspection of regulatory and legal correspondence, if any. Through these procedures we became aware of actual or suspected non-compliance and considered the effect as part of our procedures on the related financial statement items. The actual or suspected non-compliance was not sufficiently significant to our audit to result in our response being identified as a key audit matter.
Owing to the inherent limitations of an audit, there is an unavoidable risk that we may not have detected some material misstatements in the financial statements, even though we have properly planned and performed our audit in accordance with auditing standards. For example, the further removed non-compliance with laws and regulations (irregularities) is from the events and transactions reflected in the financial statements, the less likely the inherently limited procedures required by auditing standards would identify it. In addition, as with any audit, there remained a higher risk of non-detection of irregularities, as these may involve collusion, forgery, intentional omissions, misrepresentations, or the override of internal controls. We are not responsible for preventing non-compliance and cannot be expected to detect non-compliance with all laws and regulations.
8. The purpose of our audit work and to whom we owe our responsibilitiesThis report is made solely to the Company’s members, as a body, in accordance with Chapter 3 of Part 16 of the Companies Act 2006 and the terms of our engagement by the Company. Our audit work has been undertaken so that we might state to the Company’s members those matters we are required to state to them in an auditor’s report, and the further matters we are required to state to them in accordance with the terms agreed with the Company, and for no other purpose. To the fullest extent permitted by law, we do not accept or assume responsibility to anyone other than the Company and the Company’s members, as a body, for our audit work, for this report, or for the opinions we have formed.
Stuart Crisp (Senior Statutory Auditor)for and on behalf of KPMG LLP, Statutory Auditor Chartered Accountants 15 Canada Square London E14 5GL
3 April 2019
Saga plc Annual Report and Accounts 2019126
Independent Auditor’s Report to the members of Saga plc continued

Note2019
£’m
2018 (restated)
£’m
Revenue 3 841.5 860.2
Cost of sales 3 (405.7) (412.8)
Gross profit 435.8 447.4
Administrative and selling expenses 4 (244.5) (254.3)
Impairment of assets 5 (315.9) –
Investment income 6 0.7 7.6
Finance costs 7 (11.7) (19.1)
Finance income 8 1.0 1.5
Share of loss of joint ventures 36 – (2.2)
(Loss)/profit before tax from continuing operations (134.6) 180.9
Tax expense 10 (27.4) (33.9)
(Loss)/profit for the year from continuing operations (162.0) 147.0
Loss after tax for the year from discontinued operations – (7.6)
(Loss)/profit for the year (162.0) 139.4
Attributable to:
Equity holders of the parent (162.0) 139.4
Earnings Per Share:
Basic 12 (14.5p) 12.5p
Diluted 12 (14.5p) 12.4p
Earnings Per Share for continuing operations:
Basic 12 (14.5p) 13.1p
Diluted 12 (14.5p) 13.1p
Revenue of £841.5m (2018: £860.2m) is stated net of ceded reinsurance premiums earned on business underwritten by the Group of £136.0m (2018: £139.9m).
The notes on pages 132-191 form an integral part of these consolidated financial statements.
Financial Statements
Saga plcAnnual Report and Accounts 2019 127
Consolidated income statement for the year ended 31 January 2019

Note2019
£’m
2018 (restated)
£’m
(Loss)/profit for the year (162.0) 139.4
Other comprehensive income
Other comprehensive income to be reclassified to income statement in subsequent years
Net gains/(losses) on hedging instruments during the period 0.5 (5.3)
Recycling of previous gains to income statement on matured hedges (2.9) (18.8)
Total net loss on cash flow hedges 18 (2.4) (24.1)
Associated tax effect 0.4 4.1
Net losses on fair value financial assets during the period (1.3) (0.3)
Recycling of previous gains to income statement on sale of fair value financial assets during the year – (4.4)
Total net loss on fair value financial assets (1.3) (4.7)
Associated tax effect 0.2 0.8
Total other comprehensive losses with recycling to income statement (3.1) (23.9)
Other comprehensive income not to be reclassified to income statement in subsequent years
Re-measurement gains on defined benefit plans 24 2.1 10.2
Associated tax effect (0.4) (1.7)
Total other comprehensive gains without recycling to income statement 1.7 8.5
Total other comprehensive losses (1.4) (15.4)
Total comprehensive (losses)/income for the year (163.4) 124.0
Attributable to:
Equity holders of the parent (163.4) 124.0
The notes on pages 132-191 form an integral part of these consolidated financial statements.
Saga plc Annual Report and Accounts 2019128
Consolidated statement of comprehensive income for the year ended 31 January 2019
Note2019
£’m
2018 (restated)
£’m
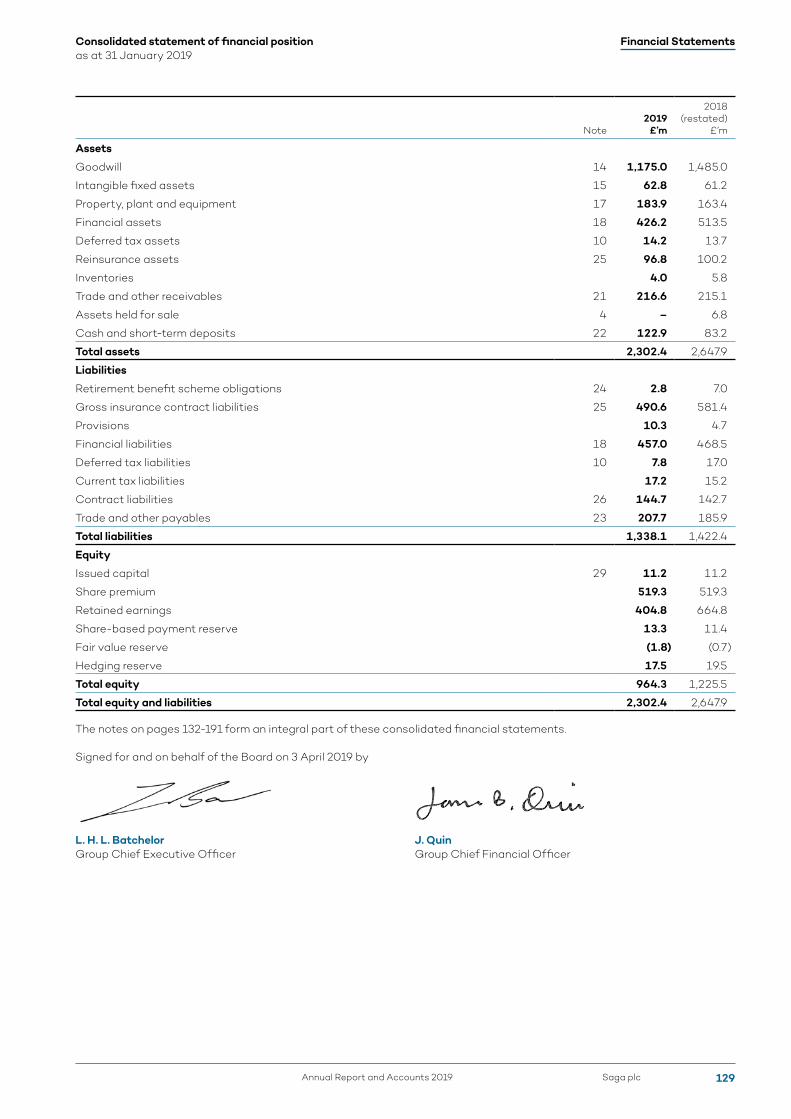
Assets
Goodwill 14 1,175.0 1,485.0
Intangible fixed assets 15 62.8 61.2
Property, plant and equipment 17 183.9 163.4
Financial assets 18 426.2 513.5
Deferred tax assets 10 14.2 13.7
Reinsurance assets 25 96.8 100.2
Inventories 4.0 5.8
Trade and other receivables 21 216.6 215.1
Assets held for sale 4 – 6.8
Cash and short-term deposits 22 122.9 83.2
Total assets 2,302.4 2,647.9
Liabilities
Retirement benefit scheme obligations 24 2.8 7.0
Gross insurance contract liabilities 25 490.6 581.4
Provisions 10.3 4.7
Financial liabilities 18 457.0 468.5
Deferred tax liabilities 10 7.8 17.0
Current tax liabilities 17.2 15.2
Contract liabilities 26 144.7 142.7
Trade and other payables 23 207.7 185.9
Total liabilities 1,338.1 1,422.4
Equity
Issued capital 29 11.2 11.2
Share premium 519.3 519.3
Retained earnings 404.8 664.8
Share-based payment reserve 13.3 11.4
Fair value reserve (1.8) (0.7)
Hedging reserve 17.5 19.5
Total equity 964.3 1,225.5
Total equity and liabilities 2,302.4 2,647.9
The notes on pages 132-191 form an integral part of these consolidated financial statements.
Signed for and on behalf of the Board on 3 April 2019 by
L. H. L. BatchelorGroup Chief Executive Officer
J. QuinGroup Chief Financial Officer
Financial Statements
Saga plcAnnual Report and Accounts 2019 129
Consolidated statement of financial position as at 31 January 2019
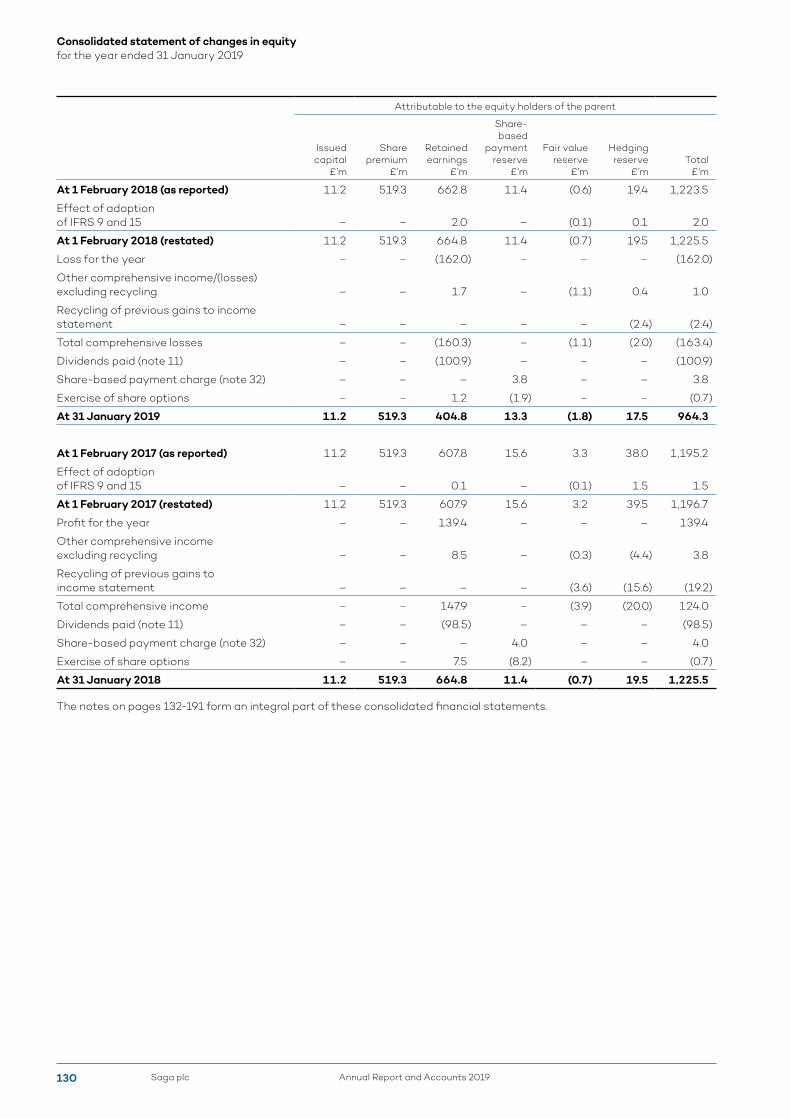
Attributable to the equity holders of the parent
Issued capital
£’m
Share premium
£’m
Retained earnings
£’m
Share-based
payment reserve
£’m
Fair value reserve
£’m
Hedging reserve
£’mTotal
£’m
At 1 February 2018 (as reported) 11.2 519.3 662.8 11.4 (0.6) 19.4 1,223.5
Effect of adoption of IFRS 9 and 15 – – 2.0 – (0.1) 0.1 2.0
At 1 February 2018 (restated) 11.2 519.3 664.8 11.4 (0.7) 19.5 1,225.5
Loss for the year – – (162.0) – – – (162.0)
Other comprehensive income/(losses) excluding recycling – – 1.7 – (1.1) 0.4 1.0
Recycling of previous gains to income statement – – – – – (2.4) (2.4)
Total comprehensive losses – – (160.3) – (1.1) (2.0) (163.4)
Dividends paid (note 11) – – (100.9) – – – (100.9)
Share-based payment charge (note 32) – – – 3.8 – – 3.8
Exercise of share options – – 1.2 (1.9) – – (0.7)
At 31 January 2019 11.2 519.3 404.8 13.3 (1.8) 17.5 964.3
At 1 February 2017 (as reported) 11.2 519.3 607.8 15.6 3.3 38.0 1,195.2
Effect of adoption of IFRS 9 and 15 – – 0.1 – (0.1) 1.5 1.5
At 1 February 2017 (restated) 11.2 519.3 607.9 15.6 3.2 39.5 1,196.7
Profit for the year – – 139.4 – – – 139.4
Other comprehensive income excluding recycling – – 8.5 – (0.3) (4.4) 3.8
Recycling of previous gains to income statement – – – – (3.6) (15.6) (19.2)
Total comprehensive income – – 147.9 – (3.9) (20.0) 124.0
Dividends paid (note 11) – – (98.5) – – – (98.5)
Share-based payment charge (note 32) – – – 4.0 – – 4.0
Exercise of share options – – 7.5 (8.2) – – (0.7)
At 31 January 2018 11.2 519.3 664.8 11.4 (0.7) 19.5 1,225.5
The notes on pages 132-191 form an integral part of these consolidated financial statements.
Saga plc Annual Report and Accounts 2019130
Consolidated statement of changes in equity for the year ended 31 January 2019
Note2019
£’m
2018 (restated)
£’m
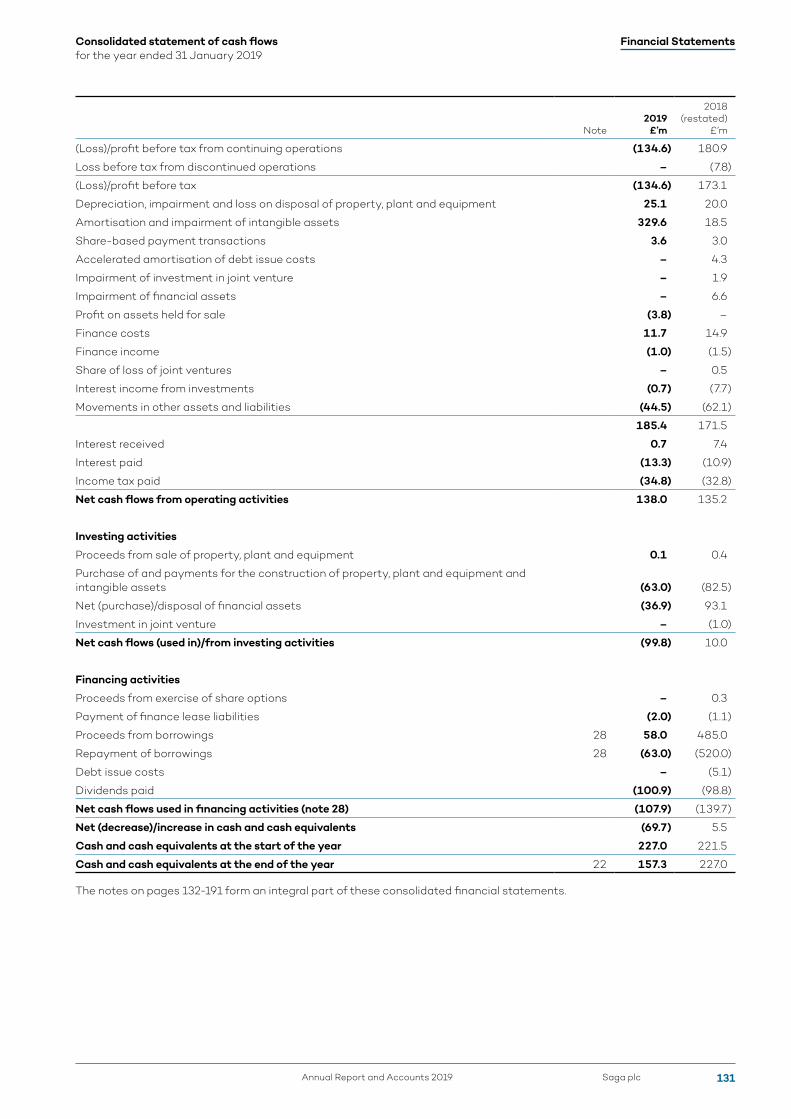
(Loss)/profit before tax from continuing operations (134.6) 180.9
Loss before tax from discontinued operations – (7.8)
(Loss)/profit before tax (134.6) 173.1
Depreciation, impairment and loss on disposal of property, plant and equipment 25.1 20.0
Amortisation and impairment of intangible assets 329.6 18.5
Share-based payment transactions 3.6 3.0
Accelerated amortisation of debt issue costs – 4.3
Impairment of investment in joint venture – 1.9
Impairment of financial assets – 6.6
Profit on assets held for sale (3.8) –
Finance costs 11.7 14.9
Finance income (1.0) (1.5)
Share of loss of joint ventures – 0.5
Interest income from investments (0.7) (7.7)
Movements in other assets and liabilities (44.5) (62.1)
185.4 171.5
Interest received 0.7 7.4
Interest paid (13.3) (10.9)
Income tax paid (34.8) (32.8)
Net cash flows from operating activities 138.0 135.2
Investing activities
Proceeds from sale of property, plant and equipment 0.1 0.4
Purchase of and payments for the construction of property, plant and equipment and intangible assets (63.0) (82.5)
Net (purchase)/disposal of financial assets (36.9) 93.1
Investment in joint venture – (1.0)
Net cash flows (used in)/from investing activities (99.8) 10.0
Financing activities
Proceeds from exercise of share options – 0.3
Payment of finance lease liabilities (2.0) (1.1)
Proceeds from borrowings 28 58.0 485.0
Repayment of borrowings 28 (63.0) (520.0)
Debt issue costs – (5.1)
Dividends paid (100.9) (98.8)
Net cash flows used in financing activities (note 28) (107.9) (139.7)
Net (decrease)/increase in cash and cash equivalents (69.7) 5.5
Cash and cash equivalents at the start of the year 227.0 221.5
Cash and cash equivalents at the end of the year 22 157.3 227.0
The notes on pages 132-191 form an integral part of these consolidated financial statements.
Financial Statements
Saga plcAnnual Report and Accounts 2019 131
Consolidated statement of cash flows for the year ended 31 January 2019

1 Corporate informationSaga plc (the ‘Company’) is a public limited company incorporated and domiciled in the United Kingdom under the Companies Act 2006 (registration number 08804263). The Company is registered in England and its registered office is located at Enbrook Park, Folkestone, Kent CT20 3SE.
Saga Group offers a wide range of products and services to its customer base which includes general insurance products, package and cruise holidays, personal finance products, domiciliary care services and a monthly subscription magazine.
2.1 Basis of preparationThe consolidated financial statements of the Group have been prepared in accordance with International Financial Reporting Standards (IFRSs) as adopted by the European Union (EU), and with the Companies Act 2006.
The consolidated financial statements have been prepared on a going concern basis and on a historical cost basis except as otherwise stated.
The Group’s consolidated financial statements are presented in pounds sterling which is also the parent company’s functional currency, and all values are rounded to the nearest hundred thousand (£’m), except when otherwise indicated. Each company in the Group determines its own functional currency and items included in the financial statements of each entity are measured using that functional currency.
The preparation of financial statements in compliance with IFRS as adopted by the EU requires the use of certain critical accounting estimates. It also requires Group management to exercise judgement in applying the Group’s accounting policies. The areas where significant judgements and estimates have been made in preparing the financial statements and their effect are disclosed in note 2.6.
This is the first set of the Group’s annual financial statements in which IFRS 15 Revenue from Contracts with Customers and IFRS 9 Financial Instruments have been applied. Changes to significant accounting policies are described in section 2.3 on pages 133-144.
2.2 Basis of consolidationThe consolidated financial statements incorporate the financial statements of the Company and entities controlled by the Company (its subsidiaries) made up to 31 January each year. Control is achieved when the Group is exposed, or has rights, to variable returns from its involvement with an investee entity and has the ability to affect those returns through its power over the investee entity. The existence and effect of potential voting rights that are currently exercisable or convertible are considered when assessing whether the Group controls another entity.
Subsidiary companies are consolidated using the acquisition method.
Subsidiaries are fully consolidated from the date of acquisition, being the date on which the Group obtained control, and continue to be consolidated until the date when such control ceases.
In preparing these consolidated financial statements, any intra-group balances, unrealised gains and losses or income and expenses arising from intra-group trading are eliminated. Where accounting policies used in individual financial statements of a subsidiary company differ from Group policies, adjustments are made to bring these policies in line with Group policies.
The results of subsidiaries acquired or disposed of during the year are included in the consolidated income statement from the effective date of acquisition or up to the effective date of disposal, as appropriate. Where a subsidiary which constituted a major line of business is disposed of or otherwise meets the requirements of IFRS 5 to be held for sale, it is disclosed as a discontinued operation.
A change in the ownership interest of a subsidiary, without a loss of control, is accounted for as an equity transaction.
If the Group loses control over a subsidiary, it derecognises the related assets (including goodwill), liabilities, non-controlling interest and other components of equity while any resultant gain or loss is recognised in profit or loss. Any investment retained is recognised at fair value.
Saga plc Annual Report and Accounts 2019132
Notes to the consolidated financial statements
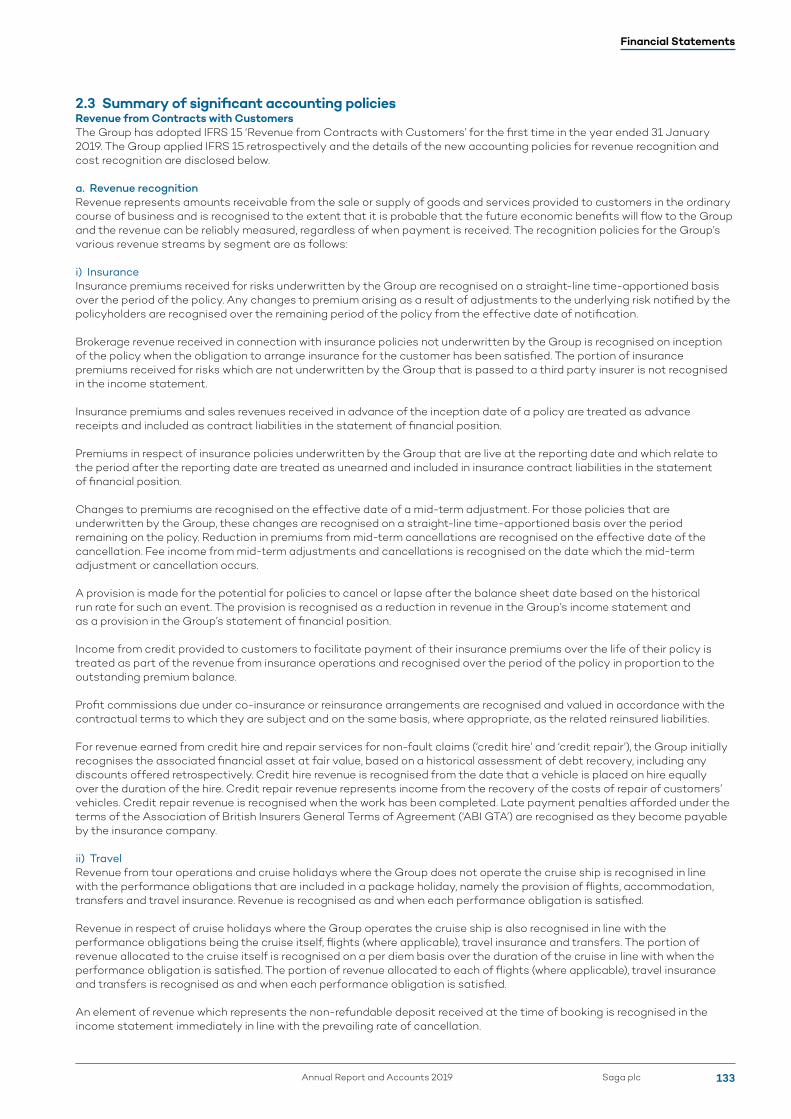
2.3 Summary of significant accounting policiesRevenue from Contracts with CustomersThe Group has adopted IFRS 15 ‘Revenue from Contracts with Customers’ for the first time in the year ended 31 January 2019. The Group applied IFRS 15 retrospectively and the details of the new accounting policies for revenue recognition and cost recognition are disclosed below.
a. Revenue recognitionRevenue represents amounts receivable from the sale or supply of goods and services provided to customers in the ordinary course of business and is recognised to the extent that it is probable that the future economic benefits will flow to the Group and the revenue can be reliably measured, regardless of when payment is received. The recognition policies for the Group’s various revenue streams by segment are as follows:
i) InsuranceInsurance premiums received for risks underwritten by the Group are recognised on a straight-line time-apportioned basis over the period of the policy. Any changes to premium arising as a result of adjustments to the underlying risk notified by the policyholders are recognised over the remaining period of the policy from the effective date of notification.
Brokerage revenue received in connection with insurance policies not underwritten by the Group is recognised on inception of the policy when the obligation to arrange insurance for the customer has been satisfied. The portion of insurance premiums received for risks which are not underwritten by the Group that is passed to a third party insurer is not recognised in the income statement.
Insurance premiums and sales revenues received in advance of the inception date of a policy are treated as advance receipts and included as contract liabilities in the statement of financial position.
Premiums in respect of insurance policies underwritten by the Group that are live at the reporting date and which relate to the period after the reporting date are treated as unearned and included in insurance contract liabilities in the statement of financial position.
Changes to premiums are recognised on the effective date of a mid-term adjustment. For those policies that are underwritten by the Group, these changes are recognised on a straight-line time-apportioned basis over the period remaining on the policy. Reduction in premiums from mid-term cancellations are recognised on the effective date of the cancellation. Fee income from mid-term adjustments and cancellations is recognised on the date which the mid-term adjustment or cancellation occurs.
A provision is made for the potential for policies to cancel or lapse after the balance sheet date based on the historical run rate for such an event. The provision is recognised as a reduction in revenue in the Group’s income statement and as a provision in the Group’s statement of financial position.
Income from credit provided to customers to facilitate payment of their insurance premiums over the life of their policy is treated as part of the revenue from insurance operations and recognised over the period of the policy in proportion to the outstanding premium balance.
Profit commissions due under co-insurance or reinsurance arrangements are recognised and valued in accordance with the contractual terms to which they are subject and on the same basis, where appropriate, as the related reinsured liabilities.
For revenue earned from credit hire and repair services for non-fault claims (‘credit hire’ and ‘credit repair’), the Group initially recognises the associated financial asset at fair value, based on a historical assessment of debt recovery, including any discounts offered retrospectively. Credit hire revenue is recognised from the date that a vehicle is placed on hire equally over the duration of the hire. Credit repair revenue represents income from the recovery of the costs of repair of customers’ vehicles. Credit repair revenue is recognised when the work has been completed. Late payment penalties afforded under the terms of the Association of British Insurers General Terms of Agreement (‘ABI GTA’) are recognised as they become payable by the insurance company.
ii) TravelRevenue from tour operations and cruise holidays where the Group does not operate the cruise ship is recognised in line with the performance obligations that are included in a package holiday, namely the provision of flights, accommodation, transfers and travel insurance. Revenue is recognised as and when each performance obligation is satisfied.
Revenue in respect of cruise holidays where the Group operates the cruise ship is also recognised in line with the performance obligations being the cruise itself, flights (where applicable), travel insurance and transfers. The portion of revenue allocated to the cruise itself is recognised on a per diem basis over the duration of the cruise in line with when the performance obligation is satisfied. The portion of revenue allocated to each of flights (where applicable), travel insurance and transfers is recognised as and when each performance obligation is satisfied.
An element of revenue which represents the non-refundable deposit received at the time of booking is recognised in the income statement immediately in line with the prevailing rate of cancellation.
Financial Statements
Saga plcAnnual Report and Accounts 2019 133

2.3 Summary of significant accounting policies (continued)a. Revenue recognition (continued)ii) Travel (continued)Revenue from sales in resort, for example for optional excursions, or onboard a cruise ship operated by the Group, for example bar sales or optional excursions, is recognised as it is earned.
Revenue from tour operations and cruising holidays received in advance of when each performance obligation is satisfied is included as other liabilities in the statement of financial position.
iii) Emerging Businesses and Central CostsPersonal financeRevenue from personal finance products is recognised when the customer contracts with the provider of the relevant personal finance product where the revenue comprises a one-off payment by the provider of the product.
Where the personal finance product is one that delivers a recurring income stream, the present value of the future expected revenue to be received is recognised when the customer contracts with the provider of the relevant personal finance product, and it is highly probable that a significant reversal of revenue recognised will not occur.
HealthcareRevenue from healthcare operations is recognised when services are provided to customers. The point of supply is generally defined as the point at which a service user has received care services from the Group and which are usually provided on an hourly basis.
Magazine subscriptionsMagazine subscription revenue is recognised on a straight-line basis over the period of the subscription. Revenue generated from advertising within the magazine is recognised when the magazine is provided to the customer.
The element of subscriptions and advertising revenue relating to the period after the reporting date is treated as unearned and included within contract liabilities in the statement of financial position.
Retirement villagesSales commission from retirement villages is recognised on the legal completion of a property.
Printing and mailingRevenue from printing and mailing services is recognised in line with the performance obligations within customer contracts.
b. Cost recognitioni) Direct costsCosts directly associated with the revenues generated by the Group’s principal activities (excluding insurance underwriting) are recognised in the income statement on a basis consistent with the relevant revenue recognition policy, unless it meets the criteria of costs to obtain or fulfil a contract.
ii) Acquisition costsAcquisition costs arising from the selling or renewing of insurance policies underwritten by the Group are recognised on a straight-line time-apportioned basis over the period of the policy in which the related revenues are earned. The proportion of acquisition costs relating to premiums treated as unearned at the reporting date are deferred and included as other receivables in the statement of financial position.
Incremental costs of obtaining an insurance contract not underwritten by the Group, namely fees charged by price-comparison websites are recognised as an asset on the statement of financial position. Such costs are amortised in line with the pattern of revenue for the related insurance contract, which incorporate the propensity for that contract to renew in future periods based on the prevailing rate of renewal for these types of contract. If the expected amortisation period is one year or less, then incremental costs are expensed when incurred.
iii) Claims costsClaims costs incurred in respect of insurance policies underwritten by the Group include claims made for losses reported as occurring during the period together with the related handling costs, any adjustments to claims outstanding from previous periods, and a provision for the estimated cost of claims incurred during the period but not reported at the reporting date. Further detail is provided in note 25.
iv) Reinsurance costsThe Group undertakes a programme of reinsurance in respect of the policies which it underwrites. Outward reinsurance premiums are accounted for in the same accounting period as the related inward insurance premiums and are presented as a deduction from earned premium.
Saga plc Annual Report and Accounts 2019134
Notes to the consolidated financial statements continued
2.3 Summary of significant accounting policies (continued)b. Cost recognition (continued)v) Finance costsFinance costs comprise interest paid and payable which is calculated using the effective interest rate method and recognised in the income statement as it accrues. Accrued interest is included within the carrying value of the interest-bearing financial liability in the statement of financial position. Finance costs also include debt issue costs which are initially recognised in the statement of financial position and amortised over the life of the debt.
vi) Other expensesOther expenses are taken to the income statement as incurred.
c. Recognition of other income statement itemsi) Investment incomeInvestment income in the form of interest is recognised in the income statement as it accrues and is calculated using the effective interest rate method. Fees and commissions which are an integral part of the effective yield of the financial asset or liability are recognised as an adjustment to the effective interest rate of the instrument.
Investment income in the form of dividends is recognised when the right to receive payment is established. For listed securities, this is the date that the security is listed as ex-dividend.
ii) Gains and losses on financial investments at fair value through profit or lossRealised and unrealised gains and losses on financial investments are recorded as finance income or finance costs in the income statement. Realised gains and losses on the sale of investments are calculated as the difference between net sales proceeds and the original or amortised cost and are recorded on the date of sale. Unrealised gains and losses arising on financial assets measured at fair value through profit and loss, which have not been derecognised as a result of disposal or transfer, represent the difference between the carrying value at the year end and the carrying value at the previous year end or the purchase value for investments acquired during the year, net of the reversal of previously recognised unrealised gains and losses in respect of disposals made during the year.
iii) Non-trading itemsItems which derive from events or transactions that are not representative of the underlying financial performance and which are material, or if of a similar type are material in aggregate, are treated as non-trading. Non-trading items are charged or credited to the income statement as appropriate and are not separated from the line item to which they relate on the face of the income statement. Amounts attributable to non-trading items are in note 4b.
d. Taxesi) Current income taxCurrent income tax assets and liabilities for the current period are measured at the amount expected to be recovered from or paid to the taxation authorities. The tax rates and tax laws used to compute the amount are those that are enacted or substantively enacted at the reporting date. Current income tax assets and liabilities also include adjustments in respect of tax expected to be payable or recoverable in respect of previous periods. Current income tax relating to items recognised in other comprehensive income and directly in equity is recognised in other comprehensive income or equity and not in the income statement.
ii) Deferred taxDeferred tax is provided on temporary differences between the tax bases of assets and liabilities and their carrying amounts for financial reporting purposes at the reporting date.
Deferred tax liabilities are recognised for all taxable temporary differences and deferred tax assets are recognised to the extent that it is probable that taxable profit will be available against which the deductible temporary differences and the carry forward of unused tax credits and unused tax losses can be utilised.
The carrying amount of deferred tax assets is reviewed at each reporting date and reduced to the extent that it is no longer probable that sufficient taxable profit will be available to allow all or part of the deferred tax asset to be utilised. Unrecognised deferred tax assets are reassessed at each reporting date and are recognised to the extent that it has become probable that future taxable profits will allow the deferred tax asset to be recovered.
Deferred tax assets and liabilities are measured at the tax rates that are expected to apply in the year when the asset is realised or the liability is settled, based on tax rates (and tax laws) that have been enacted or substantively enacted at the reporting date. Deferred tax is charged or credited in the income statement, except when it relates to items charged or credited in other comprehensive income or equity, in which case the deferred tax is recognised in other comprehensive income or equity as appropriate.
Deferred tax assets and deferred tax liabilities are offset if a legally enforceable right exists to set off current tax assets against current tax liabilities and the deferred taxes relate to the same taxable entity and the same taxation authority.
Financial Statements
Saga plcAnnual Report and Accounts 2019 135

2.3 Summary of significant accounting policies (continued)e. Foreign currenciesi) Transactions and balancesTransactions in foreign currencies are initially recorded by the Group at their respective functional currency spot rate at the date that the transaction first qualifies for recognition. Monetary assets and liabilities denominated in foreign currencies are retranslated at the functional currency spot rate of exchange ruling at the reporting date. Differences arising on settlement or translation of monetary items are recognised in the income statement.
Non-monetary items that are measured at historical cost are translated using the exchange rate at the date of the initial transaction. Non-monetary items measured at fair value are translated using the exchange rate at the date when the fair value is determined. The gains or losses arising on translation of non-monetary items measured at fair value are treated in line with the recognition of gains or losses arising on a change in the fair value of the item (i.e. the translation differences on items whose fair value gain or loss is recognised in other comprehensive income or the income statement are also recognised in other comprehensive income or the income statement respectively).
f. Intangible assetsIntangible assets acquired are measured on initial recognition at cost. Intangible assets acquired in a business combination are measured at their fair value at the date of acquisition and, following initial recognition, are carried at cost less any accumulated amortisation and accumulated impairment losses. Internally generated intangibles, excluding internally developed software, are not capitalised and the related expenditure is reflected in the income statement in the period in which the expenditure is incurred.
The useful lives of intangible assets and goodwill are assessed as either finite or indefinite. Estimated useful lives are as follows:
Goodwill Indefinite
Brands 10 years
Customer relationships Over the life of the customer relationship
Contracts acquired Over the life of the contract
Software 3-10 years
Intangible assets with finite lives are amortised over their useful economic life on a basis appropriate to the consumption of the asset and are assessed for impairment whenever there is an indication that the intangible asset may be impaired. The amortisation period and the amortisation method for an intangible asset with a finite useful life are reviewed at least at the end of each reporting period. Changes in the expected useful life or the expected pattern of consumption of future economic benefits embodied in the asset are considered to modify the amortisation period or method, as appropriate, and are treated as changes in accounting estimates. The amortisation expense on intangible assets with finite lives is recognised in the income statement in the expense category that is consistent with the function of the intangible assets.
Intangible assets and goodwill with indefinite useful lives are not amortised but are tested for impairment annually, either individually or at the CGU level. The assessment of indefinite life is reviewed annually to determine whether the indefinite life continues to be supportable. If not, the change in useful life from indefinite to finite is made on a prospective basis.
Gains or losses arising from derecognition of an intangible asset are measured as the difference between the net disposal proceeds and the carrying amount of the asset and are recognised in the income statement when the asset is derecognised.
Saga plc Annual Report and Accounts 2019136
Notes to the consolidated financial statements continued

2.3 Summary of significant accounting policies (continued)g. Business combinations and goodwillBusiness combinations are accounted for using the acquisition method. The cost of an acquisition is measured as the aggregate of the consideration transferred measured at acquisition date at fair value and the amount of any non-controlling interests in the acquiree. For each business combination, the Group elects whether to measure the non-controlling interests in the acquiree at fair value or at the proportionate share of the acquiree’s identifiable net assets.
When the Group acquires a business, it assesses the financial assets and liabilities assumed for appropriate classification and designation in accordance with the contractual terms, economic circumstances and pertinent conditions as at the acquisition date.
Any contingent consideration to be transferred by the acquirer will be recognised at fair value at the acquisition date. Contingent consideration classified as an asset or liability that is a financial instrument within the scope of IFRS 9 ‘Financial Instruments’ is measured at fair value with the changes in fair value recognised in the income statement.
Any excess of the cost of acquisition over the fair values of the identifiable assets and liabilities is recognised as goodwill. If the cost of acquisition is less than the fair values of the identifiable assets and liabilities of the acquired business, the difference is recognised directly in the income statement in the year of acquisition.
Acquisition-related costs are expensed as incurred and included in administrative expenses.
After initial recognition, goodwill is measured at cost less any accumulated impairment losses. Goodwill is allocated to CGUs at the point of acquisition and is reviewed annually for impairment.
h. Impairment of non-financial assetsThe Group undertakes a full impairment review of the carrying value of goodwill at each reporting date. The Group also assesses at each reporting date whether there is any indication that any other non-financial assets may be impaired. If such an indication exists, the recoverable amount is estimated and compared with the carrying amount. If the recoverable amount is less than the carrying amount, the asset is considered impaired and is written down to its recoverable amount and the impairment loss is recognised immediately in the income statement.
In assessing value-in-use, estimated future cash flows are discounted to their present value using a pre-tax discount rate that reflects current market assessments of the time value of money and the risks specific to the asset. In determining fair value less costs of disposal, recent market transactions are taken into account. If no such transactions can be identified, an appropriate valuation model is used. These calculations are corroborated by valuation multiples, quoted share prices for publicly traded companies or other available fair value indicators. The Group bases its impairment calculations on detailed budgets, plans and long-term growth assumptions, which are prepared separately for each of the Group’s CGUs to which individual assets are allocated.
i. Joint arrangementsThe Group participates in joint arrangements where control of the arrangement is shared with another party. A joint arrangement is classified as a joint operation or joint venture, depending on management’s assessment of the legal form and substance of the arrangement.
The Group’s share of assets, liabilities, revenue, expenses and cash flows of joint operations are included in the consolidated financial statements on a line-by-line basis, whereas the Group’s investment and share of results of joint ventures are shown within single line items in the consolidated statement of financial position and the consolidated income statement respectively.
Financial Statements
Saga plcAnnual Report and Accounts 2019 137

2.3 Summary of significant accounting policies (continued)j. Property, plant and equipmentProperty, plant and equipment are stated at cost, net of accumulated depreciation and impairment losses, if any. Where an item of property, plant and equipment comprises major components having different useful lives, they are accounted for separately.
Assets in the course of construction at the balance sheet date are classified separately. These assets are transferred to other asset categories when they become available for their intended use.
Depreciation is charged to the income statement on a straight-line basis so as to write off the depreciable amount of property, plant and equipment over their estimated useful lives. The depreciable amount is the cost of an asset less its residual value. Land and assets in the course of construction are not depreciated. Estimated useful lives are as follows:
Buildings, properties and related fixtures:
Buildings 50 years
Related fittings 3-20 years
Leasehold properties Over the period of the lease
Cruise ships 2-15 years
Computers 3-6 years
Plant, vehicles and other equipment 3-10 years
Costs relating to cruise ship mandatory dry-dockings are capitalised and depreciated over the period up to the next dry-docking where appropriate. All other repairs and maintenance costs are recognised in the income statement as incurred.
An item of property, plant and equipment is derecognised upon disposal or when no future economic benefits are expected from its use or disposal. Any gain or loss arising on derecognition of an asset (calculated as the difference between the net disposal proceeds and the carrying amount of the asset) is included in the income statement when the asset is derecognised.
Estimated residual values and useful lives are reviewed annually.
k. Non-current assets held for sale and discontinued operationsThe Group classifies non-current assets as held for sale if their carrying amount will be recovered principally through a sale transaction rather than through continuing use. To be classified as held for sale, an asset must be available for immediate sale in its present condition subject only to terms that are usual and customary for the sale of such assets, and the sale must be highly probable. Sale is considered to be highly probable when management is committed to a plan to sell an asset and an active programme to locate a buyer and complete the plan has been initiated at a price that is reasonable in relation to its current fair value, and there is an expectation that the sale will be completed within one year from the date of classification. Non-current assets classified as held for sale are carried on the Group’s statement of financial position at the lower of their carrying amount and fair value less costs to sell.
Property, plant and equipment and intangible assets once classified as held for sale are not depreciated or amortised.
Discontinued operations are excluded from the results of continuing operations and are presented as a single amount of profit or loss after tax from discontinued operations in the income statement.
Saga plc Annual Report and Accounts 2019138
Notes to the consolidated financial statements continued
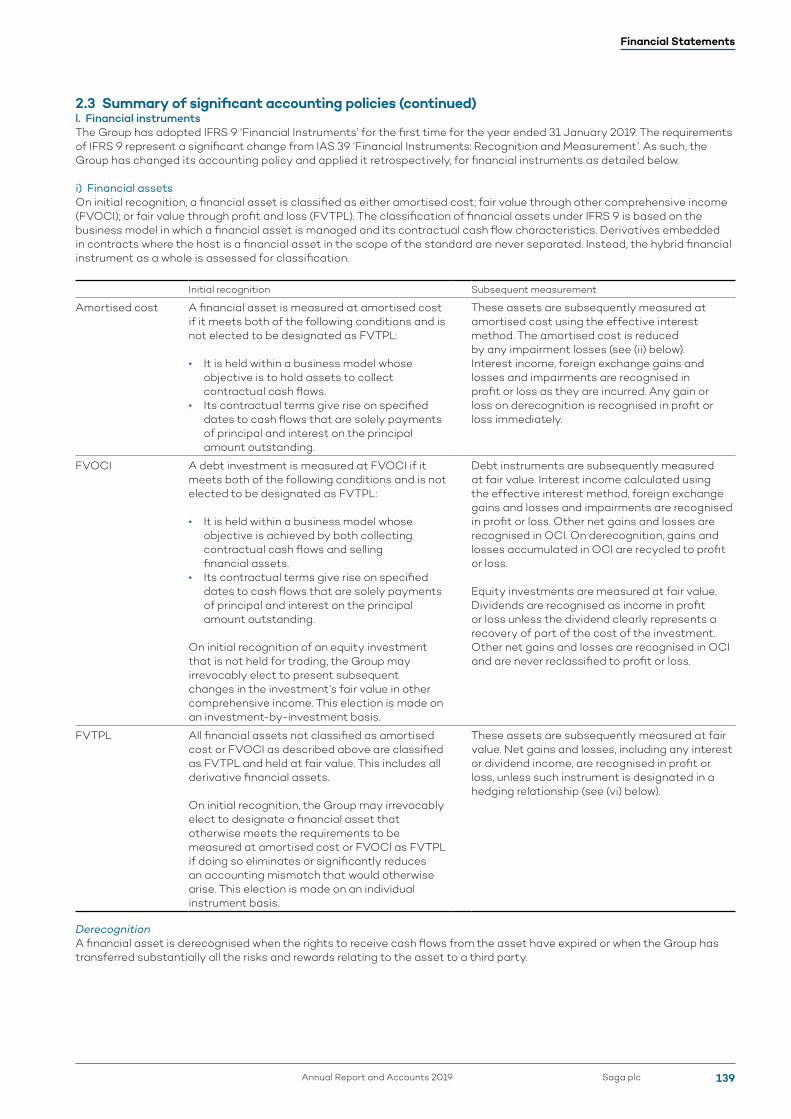
2.3 Summary of significant accounting policies (continued)l. Financial instrumentsThe Group has adopted IFRS 9 ‘Financial Instruments’ for the first time for the year ended 31 January 2019. The requirements of IFRS 9 represent a significant change from IAS 39 ‘Financial Instruments: Recognition and Measurement’. As such, the Group has changed its accounting policy and applied it retrospectively, for financial instruments as detailed below.
i) Financial assetsOn initial recognition, a financial asset is classified as either amortised cost; fair value through other comprehensive income (FVOCI); or fair value through profit and loss (FVTPL). The classification of financial assets under IFRS 9 is based on the business model in which a financial asset is managed and its contractual cash flow characteristics. Derivatives embedded in contracts where the host is a financial asset in the scope of the standard are never separated. Instead, the hybrid financial instrument as a whole is assessed for classification.
Initial recognition Subsequent measurement
Amortised cost A financial asset is measured at amortised cost if it meets both of the following conditions and is not elected to be designated as FVTPL:
• It is held within a business model whose objective is to hold assets to collect contractual cash flows.
• Its contractual terms give rise on specified dates to cash flows that are solely payments of principal and interest on the principal amount outstanding.
These assets are subsequently measured at amortised cost using the effective interest method. The amortised cost is reduced by any impairment losses (see (ii) below). Interest income, foreign exchange gains and losses and impairments are recognised in profit or loss as they are incurred. Any gain or loss on derecognition is recognised in profit or loss immediately.
FVOCI A debt investment is measured at FVOCI if it meets both of the following conditions and is not elected to be designated as FVTPL:
• It is held within a business model whose objective is achieved by both collecting contractual cash flows and selling financial assets.
• Its contractual terms give rise on specified dates to cash flows that are solely payments of principal and interest on the principal amount outstanding.
On initial recognition of an equity investment that is not held for trading, the Group may irrevocably elect to present subsequent changes in the investment’s fair value in other comprehensive income. This election is made on an investment-by-investment basis.
Debt instruments are subsequently measured at fair value. Interest income calculated using the effective interest method, foreign exchange gains and losses and impairments are recognised in profit or loss. Other net gains and losses are recognised in OCI. On derecognition, gains and losses accumulated in OCI are recycled to profit or loss.
Equity investments are measured at fair value. Dividends are recognised as income in profit or loss unless the dividend clearly represents a recovery of part of the cost of the investment. Other net gains and losses are recognised in OCI and are never reclassified to profit or loss.
FVTPL All financial assets not classified as amortised cost or FVOCI as described above are classified as FVTPL and held at fair value. This includes all derivative financial assets.
On initial recognition, the Group may irrevocably elect to designate a financial asset that otherwise meets the requirements to be measured at amortised cost or FVOCI as FVTPL if doing so eliminates or significantly reduces an accounting mismatch that would otherwise arise. This election is made on an individual instrument basis.
These assets are subsequently measured at fair value. Net gains and losses, including any interest or dividend income, are recognised in profit or loss, unless such instrument is designated in a hedging relationship (see (vi) below).
DerecognitionA financial asset is derecognised when the rights to receive cash flows from the asset have expired or when the Group has transferred substantially all the risks and rewards relating to the asset to a third party.
Financial Statements
Saga plcAnnual Report and Accounts 2019 139
2.3 Summary of significant accounting policies (continued)l. Financial instruments (continued)ii) Impairment of financial assetsThe IFRS 9 expected credit loss (ECL) impairment model applies to financial assets measured at amortised cost and debt investments at FVOCI.
The Group measures loss allowances at an amount equal to 12 month ECLs, except for the following, which are measured as lifetime ECLs:
• Debt securities that are determined to have high credit risk at the reporting date.• Other debt securities and bank balances for which credit risk has increased significantly since initial recognition.• Trade receivables and contract assets that result from transactions within the scope of IFRS 15.
When determining whether the credit risk of a financial asset has increased significantly since initial recognition and when estimating ECLs, the Group considers reasonable and supportable information that is relevant and available without undue cost or effort. This includes both quantitative and qualitative information and analysis, based on the Group’s historical experience and informed credit assessment and including forward-looking information.
The Group considers a debt security to have low credit risk when its credit risk rating is equivalent to the definition of ‘investment grade’. The Group considers this to be BBB or higher as per Standard & Poor’s rating scale.
Measurement of ECLsECLs are measured as a probability-weighted estimate of credit losses. Credit losses are measured as the probability of default in conjunction with the present value of the Group’s exposure. Loss allowances for ECLs on financial assets measured at amortised cost are recognised as a provision in the statement of financial position with a corresponding charge to the income statement. For debt instruments measured at FVOCI the loss allowance is recognised in the statement of comprehensive income and does not reduce the carrying amount of the financial asset in the statement of financial position.
Credit-impaired financial assetsAt each reporting date, the Group assesses whether financial assets carried at amortised cost and debt securities at FVOCI are credit-impaired. A financial asset is credit-impaired when one or more events that have a detrimental impact on the estimated future cash flows of the financial asset have occurred. In such an event, the lifetime ECL will be recognised in lieu of the 12 month ECL.
iii) Financial liabilitiesInitial recognition and measurementAll financial liabilities are classified as financial liabilities at amortised cost on initial recognition except for derivatives, which are classified at FVTPL, the gains or losses for which are recognised through other comprehensive income if the instrument is designated as a hedging instrument in an effective hedge.
All financial liabilities are recognised initially at fair value and, in the case of loans and borrowings, net of directly attributable transaction costs.
The Group’s financial liabilities include trade and other payables, loans and borrowings, derivative financial instruments, obligations under finance leases and hire purchase.
Subsequent measurementAfter initial recognition, interest bearing loans and borrowings and other payables are subsequently measured at amortised cost using the effective interest rate (EIR) method. Amortised cost is calculated by taking into account any discount or premium on acquisition and fees or costs that are an integral part of the EIR. The EIR amortisation is included in finance costs in the income statement.
DerecognitionA financial liability is derecognised when the obligation under the liability is discharged or cancelled or expires.
When an existing financial liability is replaced by another from the same lender on substantially different terms, or the terms of an existing liability are substantially modified, such an exchange or modification is treated as a derecognition of the original liability and the recognition of a new liability. The difference in the respective carrying amounts is recognised in the income statement.
Saga plc Annual Report and Accounts 2019140
Notes to the consolidated financial statements continued

2.3 Summary of significant accounting policies (continued)l. Financial instruments (continued)iv) DerivativesDerivatives are measured at fair value both initially and subsequent to initial recognition. All changes in fair value of non-designated derivatives are recognised in the income statement immediately. Changes in fair value of derivatives designated as hedges are initially recognised in other comprehensive income until such a point that they are recycled to profit or loss in the same period as the hedged item is recognised in profit or loss, or immediately if the hedged item is no longer expected to occur.
Derivatives are presented as assets when the fair values are positive and as liabilities when the fair values are negative. A derivative is presented as a non-current asset or a non-current liability if the remaining maturity of the instrument is more than 12 months and it is not expected to be realised or settled within 12 months.
v) Fair valuesThe Group measures financial instruments, such as derivatives and financial instruments not designated as a hedge classified as FVOCI and at FVTPL, at fair value at each reporting date.
Fair value is the price that would be required to sell an asset or to transfer a liability in an orderly transaction between market participants at the measurement date. The fair value measurement is based on the presumption that the transaction to sell the asset or transfer the liability takes place either in the principal market accessible by the Group for the asset or liability or, in the absence of a principal market, in the most advantageous market accessible by the Group for the asset or liability.
The fair values are quoted market prices where there is an active market or are based on valuation techniques when there is no active market or the instruments are unlisted. Valuation techniques include the use of recent arm’s length market transactions, discounted cash flow analysis and other commonly used valuation techniques.
All assets and liabilities for which fair value is measured or disclosed in the financial statements are categorised within the fair value hierarchy based on the lowest level possible for each instrument.
For assets and liabilities that are recognised in the financial statements on a recurring basis, the Group determines whether transfers have occurred between levels in the hierarchy by reassessing categorisation at the end of each reporting period.
vi) Hedge accountingThe Group designates certain derivative financial instruments as cash flow hedges of certain forecast transactions. These transactions are highly probable to occur and present an exposure to variations in cash flows that could ultimately affect amounts determined in profit or loss.
The Group has elected to adopt the general hedge accounting model in IFRS 9. This requires the Group to ensure that hedge accounting relationships are aligned with its risk management objectives and strategy and to apply a qualitative and forward-looking approach to assessing hedge effectiveness.
The Group uses forward foreign exchange contracts and commodity swap contracts to hedge the variability in cash flows arising from changes in foreign currency rates and oil prices respectively. For foreign exchange contracts, the Group designates the fair value change of the full forward price as the hedging instrument in cash flow hedging relationships. For commodity hedging, the Group designates the fair value change of the benchmark price. The effective portion of changes in fair value of hedging instruments is accumulated in a cash flow hedge reserve as a separate component of equity. Any ineffective portion of the fair value gain or loss is recognised immediately within the income statement.
When a hedging instrument no longer meets the criteria for hedge accounting (through maturity, sale, or other termination), hedge accounting is discontinued prospectively. If the hedged forecast transaction is still expected to occur, the associated cumulative gain or loss remains in the hedging reserve and is recognised in accordance with the above policy when the transaction occurs. If the hedged transaction is no longer expected to occur, the cumulative unrealised gain or loss is recognised in the income statement immediately.
See note 37 for a reconciliation of the impact on the financial statements arising from the transition to IFRS 9.
Financial Statements
Saga plcAnnual Report and Accounts 2019 141
2.3 Summary of significant accounting policies (continued)m. LeasesLeases under which substantially all of the risks and rewards of ownership are transferred to the Group are finance leases. All other leases are operating leases.
Assets held under finance leases are recognised at the lower of the fair value of the asset and the present value of the minimum lease payments within property, plant and equipment on the statement of financial position and depreciated over the shorter of the lease term or their expected useful lives. The interest element of finance lease payments represents a constant proportion of the capital balance outstanding and is charged to the income statement over the period of the lease.
Operating lease rentals are charged to the income statement on a straight-line basis over the lease term.
Income arising from operating leases where the Group acts as lessor is recognised on a straight-line basis over the lease term and is included in operating income.
n. Borrowing costsBorrowing costs directly attributable to the acquisition, construction or production of an asset that necessarily takes a substantial period of time to get ready for its intended use or sale are capitalised as part of the cost of the respective asset. All other borrowing costs are expensed in the period in which they occur.
Borrowing costs consist of interest and other costs that an entity incurs in connection with the borrowing of funds.
o. Cash and short-term depositsCash and short-term deposits in the statement of financial position comprise cash at bank and in hand and short-term deposits with a maturity of three months or less from their inception date.
For the purpose of the consolidated statement of cash flows, cash and cash equivalents consist of cash, short-term deposits as defined above and short-term highly liquid investments (including money market funds) with original maturities of three months or less which are subject to an insignificant risk of change in value, net of outstanding bank overdrafts.
p. Trade and other receivablesTrade and other receivables are initially recognised at their transaction price and subsequently measured at amortised cost. Appropriate allowances for estimated irrecoverable amounts are recognised in the statement of profit or loss when there is evidence that the asset is impaired. These are reversed when the triggering event that caused the impairment is reversed.
q. InventoriesInventories are stated at the lower of cost and net realisable value. Costs include all costs incurred in bringing each product to its present location and condition. Net realisable value is based on estimated selling price less any further costs expected to be incurred prior to completion and disposal.
r. Insurance contract liabilitiesInsurance contract liabilities include an outstanding claims provision, a provision for unearned premiums and, if required, a provision for premium deficiency.
Outstanding claims provisionThe provision for outstanding claims is set on an individual claim basis and is based on the ultimate cost of all claims notified but not settled less amounts already paid by the reporting date, together with a provision for related claims handling costs. The provision also includes the estimated cost of claims incurred but not reported at the statement of financial position date, which is set using statistical methods. The outstanding claims provision is not discounted for the time value of money with the exception of claims settled as periodical payment orders (PPOs).
The amount of any anticipated reinsurance, salvage or subrogation recoveries is separately identified and reported within reinsurance assets and insurance contract liabilities respectively.
Differences between the provisions at the reporting date and settlements and provisions in the following year (known as ‘run off deviations’) are recognised in the income statement as they arise.
Provision for unearned premiumsThe provision for unearned premiums represents that portion of premiums received or receivable that relates to risks that have not yet expired at the reporting date. The provision is recognised when contracts are entered into and premiums are charged, and is brought to account as premium income over the term of the contract in accordance with the pattern of release from risk under the contract.
Saga plc Annual Report and Accounts 2019142
Notes to the consolidated financial statements continued

2.3 Summary of significant accounting policies (continued)r. Insurance contract liabilities (continued)Provision for premium deficiencyAt each reporting date, the Group reviews its unexpired risks and a liability adequacy test is performed to determine whether there is any overall excess of expected claims and deferred acquisition costs over unearned premiums. This calculation uses current estimates of future contractual cash flows after taking account of the investment return expected to arise on assets relating to the relevant insurance technical provisions. If these estimates show that the carrying amount of the unearned premiums (less related deferred acquisition costs) is inadequate, the deficiency is recognised in the income statement by setting up a provision for premium deficiency.
s. Reinsurance assetsContracts entered into by the Group with reinsurers under which the Group is compensated for losses on insurance contracts issued are classified as reinsurance contracts. A contract is only accounted for as a reinsurance contract where there is significant insurance risk transfer between the insurer and reinsurer.
Reinsurance assets include balances due from reinsurance companies for ceded insurance liabilities. Amounts recoverable from reinsurers are estimated in a consistent manner with the outstanding claims provisions in accordance with the relevant reinsurance contract.
The Group assesses its reinsurance assets for impairment at each balance sheet date. For assets that are directly exposed to long-tail PPO liabilities a general provision for impairment is provided, calculated on a wholesale basis by reference to published credit rating default curves. For all other reinsurance assets, the carrying value is written down to its recoverable amount only if there is objective evidence of impairment.
The amount of any anticipated reinsurance recoveries is presented as a reduction in claims costs. Where this amount is material, it is reported separately in the statement of financial position, except where the contractual terms of the reinsurance arrangement necessitates the set-off of its associated financial assets and liabilities.
For the funds-withheld quota share agreement in motor insurance, the obligation to pay funds and the right to receive reimbursement for incurred claims are presented on a net basis because there is a legally enforceable right to offset these amounts and there is an intention to settle on a net basis or realise both the asset and settle the liability simultaneously.
t. Share-based paymentsThe Group provides benefits to employees (including Executive Directors) in the form of share-based payment transactions, whereby employees render services as consideration for equity instruments (equity-settled transactions). The cost of equity-settled transactions is measured by reference to the fair value on the grant date and is recognised as an expense over the relevant vesting period, ending on the date on which the employee becomes fully entitled to the award.
Fair values of share-based payment transactions are calculated using Black-Scholes and Monte-Carlo modelling techniques. In valuing equity-settled transactions, assessment is made of any vesting conditions to categorise these into market performance conditions, non-market performance conditions and service conditions.
Where the equity-settled transactions have market performance conditions (that is, performance which is directly or indirectly linked to the share price), the fair value of the award is assessed at the time of grant and is not changed, regardless of the actual level of vesting achieved, except where the employee ceases to be employed prior to the vesting date.
For service conditions and non-market performance conditions, the fair value of the award is assessed at the time of grant and is reassessed at each reporting date to reflect updated expectations for the level of vesting. No expense is recognised for awards that ultimately do not vest.
At each reporting date prior to vesting, the cumulative expense is calculated, representing the extent to which the vesting period has expired and, in the case of non-market conditions, the best estimate of the number of equity instruments that will ultimately vest or, in the case of instruments subject to market conditions, the fair value on grant adjusted only for leavers. The movement in the cumulative expense since the previous reporting date is recognised in the income statement, with the corresponding increase in share-based payments reserve.
Upon vesting of an equity instrument, the cumulative cost in the share-based payments reserve is reclassified to retained earnings in equity.
The dilutive effect of outstanding options is reflected as additional share dilution in the computation of diluted Earnings Per Share.
Financial Statements
Saga plcAnnual Report and Accounts 2019 143

2.3 Summary of significant accounting policies (continued)u. Retirement benefit schemesDuring the year, the Group operated a defined benefit pension plan that requires contributions to be made to separately administered funds. The cost of providing benefits under the defined benefit plan is determined separately using the projected unit credit valuation method.
Actuarial gains and losses arising in the year are credited/charged to other comprehensive income and comprise the effects of changes in actuarial assumptions and experience adjustments due to differences between the previous actuarial assumptions and what has actually occurred. In particular, the difference between the interest income and the actual return on plan assets is recognised in other comprehensive income.
Other movements in the net surplus or deficit, which include the current service cost, any past service cost and the effect of any curtailment or settlements, are recognised in the income statement. Past service costs are recognised in the income statement on the earlier of the date of plan curtailment and the date that the Group recognises restructuring-related costs. The interest cost less interest income on assets held in the plans is also charged to the income statement.
The defined benefit schemes are funded, with assets of the schemes held separately from those of the Group, in separate Trustee administered funds. Scheme assets are measured using market values and scheme liabilities are measured using the projected unit actuarial method and are discounted at the current rate of return on a high-quality corporate bond of equivalent term and currency to the liability. Full actuarial valuations are obtained at least triennially and are updated at each reporting date. The resulting defined benefit asset or liability is presented separately after other net assets and liabilities on the face of the statement of financial position. The value of a pension benefit asset is restricted to the amount that may be recovered either through reduced contributions or agreed refunds from the scheme.
For defined contribution schemes, the amounts charged to the income statement are the contributions payable in the year.
v. ProvisionsProvisions are recognised when the Group has a present obligation (legal or constructive) as a result of a past event, and it is probable that an outflow of resources embodying economic benefits will be required to settle the obligation and a reliable estimate can be made of the amount of the obligation. Where the Group expects some or all of a provision to be reimbursed, the reimbursement is recognised as a separate asset, but only when the reimbursement is virtually certain. The expense relating to any provision is presented in the income statement net of any reimbursement. If the effect of the time value of money is material, provisions are discounted using a current pre-tax rate that reflects, where appropriate, the risks specific to the liability. Where discounting is used, the increase in the provision due to the passage of time is recognised as a finance cost.
A provision is recognised for onerous contracts in which the unavoidable costs of meeting the obligations under the contract exceed the economic benefits expected to be received under it. The unavoidable costs reflect the least net cost of exiting the contract, which is the lower of the cost of fulfilling it and any compensation or penalties arising from failure to fulfil it.
w. Trade and other payablesTrade and other payables are initially recognised at fair value and subsequently measured at amortised cost. They represent liabilities to pay for goods or services that have been received or supplied in the normal course of business, invoiced by the supplier before the year end, but for which payment has not yet been made.
x. EquityThe Group has ordinary shares that are classified as equity. Incremental external costs that are directly attributable to the issue of these shares are recognised in equity, net of tax.
Saga plc Annual Report and Accounts 2019144
Notes to the consolidated financial statements continued

2.4 Standards issued but not yet effectiveThe following is a list of standards and amendments to standards that are in issue but are not effective or adopted as at 31 January 2019.
a. IFRS 16 ‘Leases’The new accounting standard on leases, IFRS 16 ‘Leases’, ensures that all lease contracts are now recognised on balance sheet and require the recognition of the present value of future lease payments as a liability and corresponding recognition of a right-of-use asset for many leases that were previously only ever recognised as an operating expense. IFRS 16 ‘Leases’ will replace the existing standard, IAS 17.
The new standard is applicable for accounting periods commencing from 1 January 2019 and is required to be adopted by the Group from 1 February 2019. The Group has assessed the estimated impact that initial application of IFRS 16 will have on its consolidated financial statements, as described below. IFRS 16 will change how the Group accounts for leases previously classified as operating leases under IAS 17.
On initial application of IFRS 16, the Group will for all lease contracts:
i) recognise right-of-use assets and lease liabilities in the consolidated statement of financial position, initially measured at the present value of the future lease payments
ii) recognise depreciation of right-of-use assets and interest on lease liabilities in the consolidated statement of profit or loss
iii) separate the total amount of cash paid into a principal portion (presented within financing activities) and interest (presented within operating activities) in the consolidated cash flow statement.
The Group will recognise new assets and liabilities for its current operating leases of river cruise ships, leased properties, shipping telecommunications equipment and car leases. The nature of expenses related to those leases will now change because the Group will recognise a depreciation charge for right-of-use assets and interest expense on lease liabilities, instead of a periodic operating lease expense.
No significant impact is expected for the Group’s finance leases, as currently defined by IAS 17.
The Group intends to apply the standard retrospectively to all accounting periods using the full retrospective approach (FRA). For all leases held at the date of transition (being 1 February 2019 for the Group) the recognition and measurement provisions of IFRS 16 will be applied in full, and hence comparative financial information will be restated, and an adjustment will be made to equity at the beginning of the earliest period presented.
The estimated impact of adopting IFRS 16 on the financial statements for the year ended 31 January 2019 (had IFRS 16 been applied already) is summarised in the following table:
Financial year ended 31 January
2018
Financial year ended 31 January
2019
FRA £’m
FRA £’m
Balance sheet impact
Right-of-use asset 26.2 29.7
Lease liability (28.3) (32.1)
Net assets (2.1)* (2.4)
Income statement impact
Depreciation (11.3)
Lease interest cost (0.6)
Reverse operating lease expenses 11.6
Loss before tax (0.3)
* to be recognised as an adjustment to opening retained earnings
Financial Statements
Saga plcAnnual Report and Accounts 2019 145
2.4 Standards issued but not yet effective (continued)a. IFRS 16 ‘Leases’ (continued)Under the FRA, it has been estimated that an additional right-of-use asset of £29.7m as at 31 January 2019 would need to be recognised. A corresponding lease liability at the same date of £32.1m has been calculated, resulting in a reduction to net assets of £2.4m. This would result in a £0.3m additional expense needing to be recognised in the income statement for the 12 months ended 31 January 2019, and a £2.1m debit to opening profit and loss reserves as at 1 February 2018.
The additional expense arises due to the different amortisation profiles between the depreciation of the right-of-use asset on a straight-line basis and the amortisation of the lease liability using an EIR method.
b. IFRS 17 ‘Insurance Contracts’IFRS 17 was issued in May 2017 and established a principles-based accounting approach for insurance contracts and will replace IFRS 4. The impact of this standard on the Group’s financial statements is still being assessed. The standard is effective for annual reporting periods beginning on or after 1 January 2022, although this is yet to be endorsed by the EU.
c. Amendments to ‘References to the Conceptual Framework in IFRSs’Together with the revised Conceptual Framework published in March 2018, the IASB has also issued Amendments to References to the Conceptual Framework in IFRSs. The amendments are effective for annual periods beginning on or after 1 January 2020, with earlier application being permitted, although this is yet to be endorsed by the EU.
d. Amendments to IAS 28 ‘Long-term Interests in Associates and Joint Ventures’The amendments to IAS 28 clarify that an entity applies IFRS 9 ‘Financial Instruments’ to long-term interests in an associate or joint venture that form part of the net investments in the associate or joint venture but to which the equity method is not applied. The amendments are effective for annual periods beginning on or after 1 January 2019, with earlier application being permitted, although this is yet to be endorsed by the EU and will have no effect on the Group’s financial statements.
e. Amendments to IAS 19 ‘Plan Amendment, Curtailment or Settlement’The amendments to IAS 19 are if a plan amendment, curtailment or settlement occurs, it is now mandatory that the current service cost and the net interest for the period after the re-measurement are determined using the assumptions used for the re-measurement. In addition, amendments have been included to clarify the effect of a plan amendment, curtailment or settlement on the requirements regarding the asset ceiling. The amendments are effective for annual periods beginning on or after 1 January 2019, although this is yet to be endorsed by the EU and is not likely to have a material effect on the Group’s financial statements.
f. IFRIC 23 ‘Uncertainty over Income Tax Treatments’This interpretation of IAS 12 sets out how to determine taxable profit (tax loss), tax bases, unused tax losses, unused tax credits and tax rates where there is uncertainty over income tax treatments. The interpretation is effective for annual periods beginning on or after 1 January 2019, with earlier application being permitted, although this is yet to be endorsed by the EU and will have no effect on the Group’s financial statements.
g. Definition of a Business (Amendments to IFRS 3)The amendments in Definition of a Business clarify that, to be considered a business, an acquired set of activities and assets must include, at a minimum, an input and substantive process that together significantly contribute to the ability to create outputs. The definitions of a business and outputs are narrowed by focusing on goods and services provided to customers and by removing the reference to an ability to reduce costs. The amendments are effective for annual periods beginning on or after 1 January 2020, although this is yet to be endorsed by the EU.
h. Definition of Material (Amendments to IAS 1 and IAS 8)The amendments in Definition of Material clarify the definition of ‘material’ and align the definition used in the Conceptual Framework and the standards. The amendments are effective for annual periods beginning on or after 1 January 2020, although this is yet to be endorsed by the EU.
2.5 First time adoption of new standardsThe Group has adopted IFRS 15 ‘Revenue from Contracts with Customers’ and IFRS 9 ‘Financial Instruments’ retrospectively from 1 February 2018 and therefore the financial statements for the year ended 31 January 2019 include restated comparative information. See note 37 for a reconciliation between the reported and restated comparatives.
The transition to IFRS 15 has increased profit after tax by £0.3m for the year ended 31 January 2018. Net assets have increased by £2.5m as at 31 January 2018.
The transition to IFRS 9 has increased profit after tax by £1.6m for the year ended 31 January 2018. Net assets have decreased by £0.5m as at 31 January 2018.
Saga plc Annual Report and Accounts 2019146
Notes to the consolidated financial statements continued
2.5 First time adoption of new standards (continued)InsuranceThe adjustments made represent the deferral of aggregator fees as the incremental costs of obtaining a contract over the expected average renewal cycle of a policy not underwritten by the Group as required by IFRS 15.
Under IFRS 9, an expected loss provision is made on the investment portfolio held by the Insurance segment. It is calculated with reference to the rating of the asset held and credit default swap curves.
TravelUnder IFRS 15, it is necessary to allocate tour operations and cruise revenue to various performance obligations such as the provision of flights, accommodation, transfers and travel insurance. Therefore, it is appropriate to defer a proportion of revenue and associated direct costs in line with when these obligations are discharged. Previously, revenue from tour operations and cruise holidays where the Group does not operate the cruise ship was recognised in full on the date of departure.
Under IFRS 9, the hedging requirements are more closely aligned with the Group’s risk management strategy and risk management objectives, and therefore the Group expects to be able to designate a larger proportion of its derivative contracts into hedging relationships.
Emerging Businesses and Central CostsThe adjustments made represents a deferral of a proportion of revenue in respect of the performance obligations arising from the Group’s membership scheme, Saga Possibilities. The deferral is calculated as a proportion of the transaction price of the product or service purchased which is allocated with respect of the costs of the membership scheme relative to the cost of fulfilling the product or service. Revenue is deferred over the period in which a customer is expected to be a Saga Member.
2.6 Significant accounting judgements, estimates and assumptionsThe preparation of financial statements requires the Group to select accounting policies and make estimates and assumptions that affect items reported in the primary consolidated financial statements and notes to the consolidated financial statements.
The major areas of judgement used as part of accounting policy application are summarised below:
Significant judgementsAcc. policy Items involving judgement Critical accounting judgement
2.3a Revenue recognition – performance obligations
Identification of performance obligations within contracts with customers, and the subsequent allocation of the transaction price to each performance obligation.
2.3ai Classification of insurance contracts Assessment of whether significant insurance risk is transferred, and in particular assessment of whether reinsurance arrangements constitute a reinsurance contract under IFRS 4, for example, the funds-withheld quota share contract.
2.3f Intangible assets Assessment of whether expenditure is eligible for capitalisation under IAS 38.
2.3h Impairment testing of goodwill and other major classes of assets
The Group determines whether goodwill needs to be impaired on an annual basis, or more frequently as required. In the year to 31 January 2019, management has deemed it necessary to impair the goodwill allocated to the Insurance CGU.
In the year to 31 January 2019, management has exercised its judgement in relation to the impairment of each of the two cruise ships, the Saga Pearl II and the Saga Sapphire.
2.3l Financial instruments Classification of financial instruments, including assessment of market observability of valuation inputs.
Financial Statements
Saga plcAnnual Report and Accounts 2019 147
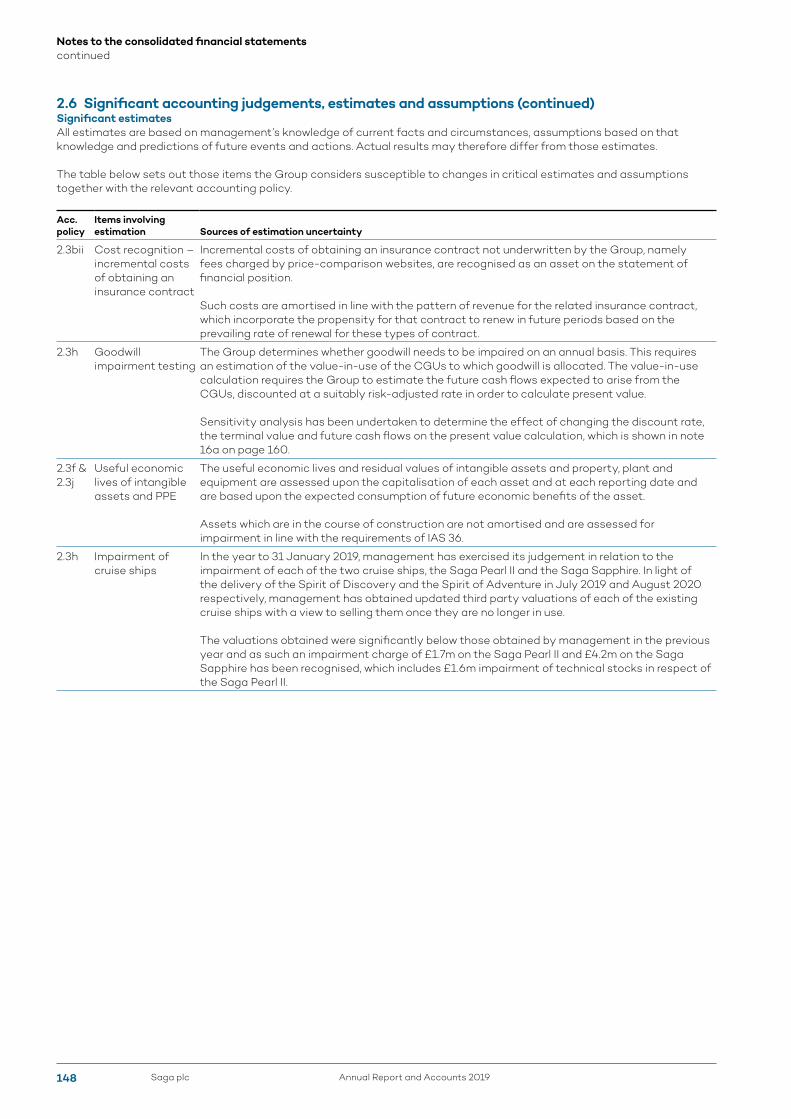
2.6 Significant accounting judgements, estimates and assumptions (continued)Significant estimatesAll estimates are based on management’s knowledge of current facts and circumstances, assumptions based on that knowledge and predictions of future events and actions. Actual results may therefore differ from those estimates.
The table below sets out those items the Group considers susceptible to changes in critical estimates and assumptions together with the relevant accounting policy.
Acc. policy
Items involving estimation Sources of estimation uncertainty
2.3bii Cost recognition – incremental costs of obtaining an insurance contract
Incremental costs of obtaining an insurance contract not underwritten by the Group, namely fees charged by price-comparison websites, are recognised as an asset on the statement of financial position.
Such costs are amortised in line with the pattern of revenue for the related insurance contract, which incorporate the propensity for that contract to renew in future periods based on the prevailing rate of renewal for these types of contract.
2.3h Goodwill impairment testing
The Group determines whether goodwill needs to be impaired on an annual basis. This requires an estimation of the value-in-use of the CGUs to which goodwill is allocated. The value-in-use calculation requires the Group to estimate the future cash flows expected to arise from the CGUs, discounted at a suitably risk-adjusted rate in order to calculate present value.
Sensitivity analysis has been undertaken to determine the effect of changing the discount rate, the terminal value and future cash flows on the present value calculation, which is shown in note 16a on page 160.
2.3f & 2.3j
Useful economic lives of intangible assets and PPE
The useful economic lives and residual values of intangible assets and property, plant and equipment are assessed upon the capitalisation of each asset and at each reporting date and are based upon the expected consumption of future economic benefits of the asset.
Assets which are in the course of construction are not amortised and are assessed for impairment in line with the requirements of IAS 36.
2.3h Impairment of cruise ships
In the year to 31 January 2019, management has exercised its judgement in relation to the impairment of each of the two cruise ships, the Saga Pearl II and the Saga Sapphire. In light of the delivery of the Spirit of Discovery and the Spirit of Adventure in July 2019 and August 2020 respectively, management has obtained updated third party valuations of each of the existing cruise ships with a view to selling them once they are no longer in use.
The valuations obtained were significantly below those obtained by management in the previous year and as such an impairment charge of £1.7m on the Saga Pearl II and £4.2m on the Saga Sapphire has been recognised, which includes £1.6m impairment of technical stocks in respect of the Saga Pearl II.
Saga plc Annual Report and Accounts 2019148
Notes to the consolidated financial statements continued

2.6 Significant accounting judgements, estimates and assumptions (continued)Significant estimates (continued)Acc. policy
Items involving estimation Sources of estimation uncertainty
2.3r Valuation of insurance contract liabilities
For insurance contracts, estimates have to be made both for the expected cost of claims known but not yet settled (case reserves) and for the expected cost of claims incurred but not yet reported (IBNR), as at the reporting date. It can take a significant period of time before the ultimate claims cost can be established with certainty. For some types of policies, IBNR claims form the majority of the liability in the statement of financial position.
The ultimate cost of outstanding claims is estimated by using a range of standard actuarial claims projection techniques, such as the Chain Ladder and Bornhuetter-Ferguson methods. The main assumption underlying these techniques is that past claims development experience can be used to project future claims development and hence ultimate claims costs. As such, these methods extrapolate the development of paid and incurred losses, average costs per claim and claim numbers based on the observed development of earlier years. Historical claims development is primarily analysed by accident year, geographical area, significant business line and peril. Additional qualitative judgement is used to assess the extent to which past trends may not apply in the future (e.g. to reflect one-off occurrences, changes in external or market factors such as public attitudes to claiming, economic conditions, levels of claims inflation, judicial decisions and legislation, as well as internal factors such as portfolio mix, policy features and claims handling procedures) in order to arrive at the best estimate of the ultimate cost of claims.
On 27 February 2017, the UK Government announced its decision to reduce the Ogden discount rate from 2.5% to -0.75%. Subsequently, the UK Government has launched a full consultation regarding the Ogden discount rate. The proposed changes mean the rate would be set by reference to ‘low risk’ rather than ‘very low risk’ and will ensure the rate is reviewed more regularly in future. If the proposed framework were to be applied immediately, the rate may increase to between 0% and 1%.
The ultimate cost of claims is not discounted except for those in respect of PPOs, which have been discounted at -1.5% for the year ended 31 January 2019 (2018: -1.5%). The valuation of these claims involves making assumptions about the rate of inflation and the expected rate of return on assets to determine the discount rate. Due to the size of PPO claims, the ultimate cost is highly sensitive to changes in these assumptions. The assumptions are reviewed at each reporting date, and the sensitivity of this assumption is shown in note 19d on pages 170-171.
Similar judgements, estimates and assumptions are employed in the assessment of the adequacy of provisions for unearned premium. Judgement is also required in determining whether the pattern of insurance service provided by a contract requires amortisation of unearned premium on a basis other than time apportionment.
2.3u Valuation of pension benefit obligation
The cost of defined benefit pension plans and the present value of the pension obligation are determined using actuarial valuations. The actuarial valuation involves making assumptions about discount rates, expected rates of return on assets, future salary increases, mortality rates and future pension increases. Due to the complexity of the valuation, the underlying assumptions and its long-term nature, a defined benefit obligation is highly sensitive to changes in these assumptions. All assumptions are reviewed at each reporting date.
All significant assumptions and estimates involved in arriving at the valuation of the pension scheme obligation are set out in note 24 on page 174.
Financial Statements
Saga plcAnnual Report and Accounts 2019 149

3 Segmental informationFor management purposes, the Group is organised into business units based on their products and services. The Group has three reportable operating segments as follows:
• Insurance: the segment primarily comprises general insurance products. Revenue is derived primarily from insurance premiums and broking revenues. This segment is further analysed into four product sub-segments:
– Retail broking, consisting of: – Motor broking – Home broking – Other insurance broking
– Underwriting.
• Travel: the segment primarily comprises the operation and delivery of package tours and cruise holiday products. The Group owns and operates two cruise ships. All other holiday products are packaged together with third party supplied accommodation, flights and other transport arrangements.
• Emerging Businesses and Central Costs: the segment comprises the Group’s other businesses, its central cost base and membership scheme. The other businesses primarily include the financial services product offering, the domiciliary care services offering, the sale of retirement village properties where the Group acts as an agent only, a monthly subscription magazine product and the Group’s internal mailing house.
Segment performance is primarily evaluated using the Group’s key performance measure of Underlying Profit Before Tax. Items not allocated to a segment relate to transactions that do not form part of the ongoing segment performance or which are managed at a Group level.
Transfer prices between operating segments are set on an arm’s length basis in a manner similar to transactions with third parties. Segment income, expenses and results include transfers between business segments which are then eliminated on consolidation.
Goodwill, current taxes, deferred taxes and bank loans are not allocated to segments as they are also managed on a Group basis.
Insurance Emerging Businesses and Central
Costs £’m2019
Motor broking
£’m
Home broking
£’m
Other insurance
broking £’m
Under-writing
£’mTotal
£’mTravel
£’mAdjustments
£’mTotal
£’m
Revenue 113.4 74.5 68.8 93.3 350.0 457.4 40.5 (6.4) 841.5
Cost of sales (2.2) – (12.9) (8.4) (23.5) (364.1) (18.1) – (405.7)
Gross profit 111.2 74.5 55.9 84.9 326.5 93.3 22.4 (6.4) 435.8
Administrative and selling expenses (77.2) (29.4) (29.2) (2.5) (138.3) (72.4) (40.2) 6.4 (244.5)
Investment income – – – 4.3 4.3 0.2 (3.8) – 0.7
Finance costs – – – – – – (11.7) – (11.7)
Finance income – – – – – – – – –
Underlying Profit Before Tax 34.0 45.1 26.7 86.7 192.5 21.1 (33.3) – 180.3
Net fair value gain on derivative financial instruments – – – – – 1.0 – – 1.0
Impairment of cruise ships – – – – – (5.9) – – (5.9)
Impairment of goodwill – – – – – – – (310.0) (310.0)
Profit/(loss) before tax from continuing operations 34.0 45.1 26.7 86.7 192.5 16.2 (33.3) (310.0) (134.6)
Total assets less liabilities 335.9 73.8 (181.4) 735.8 964.3
All revenue is generated solely in the UK.
Cost of sales within the Insurance segment comprises claims costs incurred on insurance policies underwritten by the Group (see note 3b).
Saga plc Annual Report and Accounts 2019150
Notes to the consolidated financial statements continued
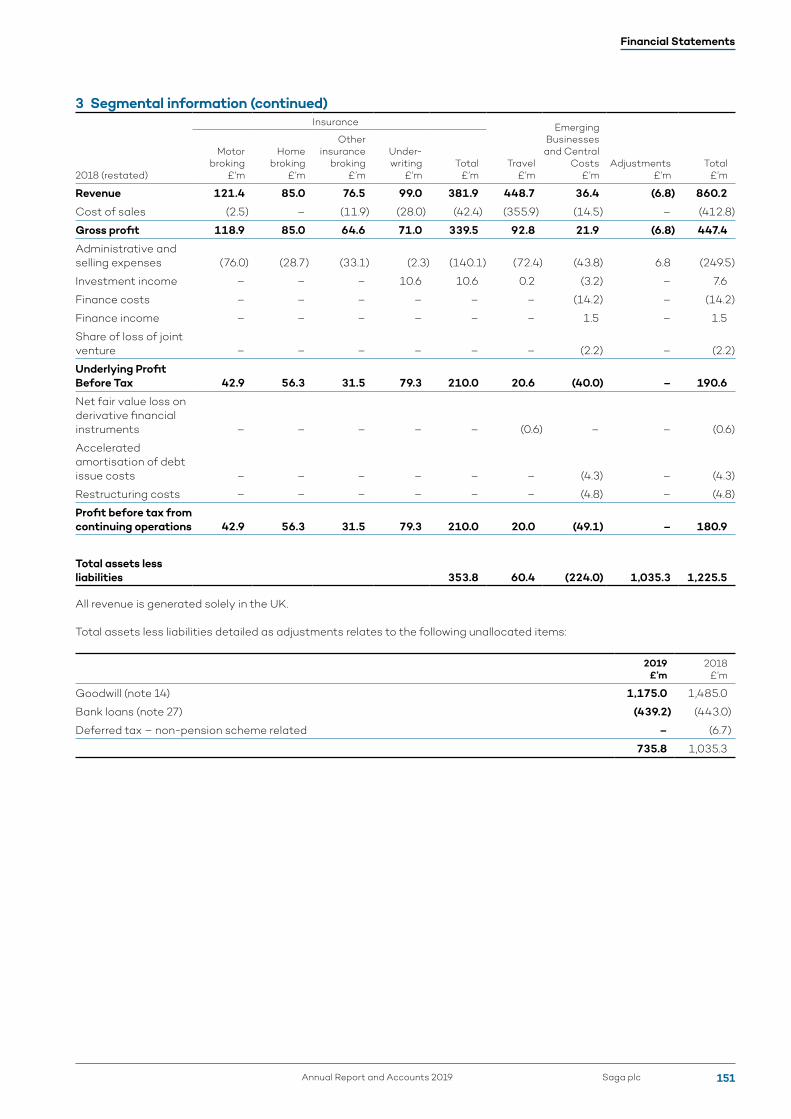
3 Segmental information (continued)Insurance Emerging
Businesses and Central
Costs £’m2018 (restated)
Motor broking
£’m
Home broking
£’m
Other insurance
broking £’m
Under-writing
£’mTotal
£’mTravel
£’mAdjustments
£’mTotal
£’m
Revenue 121.4 85.0 76.5 99.0 381.9 448.7 36.4 (6.8) 860.2
Cost of sales (2.5) – (11.9) (28.0) (42.4) (355.9) (14.5) – (412.8)
Gross profit 118.9 85.0 64.6 71.0 339.5 92.8 21.9 (6.8) 447.4
Administrative and selling expenses (76.0) (28.7) (33.1) (2.3) (140.1) (72.4) (43.8) 6.8 (249.5)
Investment income – – – 10.6 10.6 0.2 (3.2) – 7.6
Finance costs – – – – – – (14.2) – (14.2)
Finance income – – – – – – 1.5 – 1.5
Share of loss of joint venture – – – – – – (2.2) – (2.2)
Underlying Profit Before Tax 42.9 56.3 31.5 79.3 210.0 20.6 (40.0) – 190.6
Net fair value loss on derivative financial instruments – – – – – (0.6) – – (0.6)
Accelerated amortisation of debt issue costs – – – – – – (4.3) – (4.3)
Restructuring costs – – – – – – (4.8) – (4.8)
Profit before tax from continuing operations 42.9 56.3 31.5 79.3 210.0 20.0 (49.1) – 180.9
Total assets less liabilities 353.8 60.4 (224.0) 1,035.3 1,225.5
All revenue is generated solely in the UK.
Total assets less liabilities detailed as adjustments relates to the following unallocated items:
2019 £’m
2018 £’m
Goodwill (note 14) 1,175.0 1,485.0
Bank loans (note 27) (439.2) (443.0)
Deferred tax – non-pension scheme related – (6.7)
735.8 1,035.3
Financial Statements
Saga plcAnnual Report and Accounts 2019 151
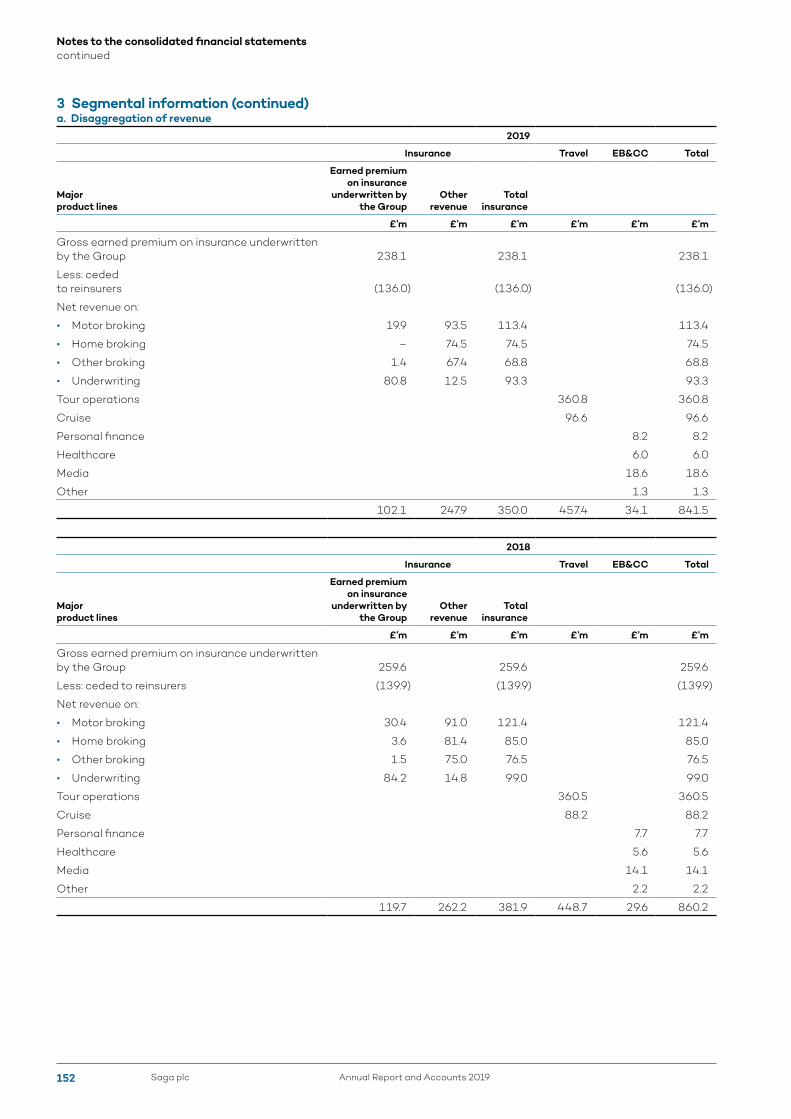
3 Segmental information (continued)a. Disaggregation of revenue
2019
Insurance Travel EB&CC Total
Major product lines
Earned premium on insurance
underwritten by the Group
Other revenue
Total insurance
£’m £’m £’m £’m £’m £’m
Gross earned premium on insurance underwritten by the Group 238.1 238.1 238.1
Less: ceded to reinsurers (136.0) (136.0) (136.0)
Net revenue on:
• Motor broking 19.9 93.5 113.4 113.4
• Home broking – 74.5 74.5 74.5
• Other broking 1.4 67.4 68.8 68.8
• Underwriting 80.8 12.5 93.3 93.3
Tour operations 360.8 360.8
Cruise 96.6 96.6
Personal finance 8.2 8.2
Healthcare 6.0 6.0
Media 18.6 18.6
Other 1.3 1.3
102.1 247.9 350.0 457.4 34.1 841.5
2018
Insurance Travel EB&CC Total
Major product lines
Earned premium on insurance
underwritten by the Group
Other revenue
Total insurance
£’m £’m £’m £’m £’m £’m
Gross earned premium on insurance underwritten by the Group 259.6 259.6 259.6
Less: ceded to reinsurers (139.9) (139.9) (139.9)
Net revenue on:
• Motor broking 30.4 91.0 121.4 121.4
• Home broking 3.6 81.4 85.0 85.0
• Other broking 1.5 75.0 76.5 76.5
• Underwriting 84.2 14.8 99.0 99.0
Tour operations 360.5 360.5
Cruise 88.2 88.2
Personal finance 7.7 7.7
Healthcare 5.6 5.6
Media 14.1 14.1
Other 2.2 2.2
119.7 262.2 381.9 448.7 29.6 860.2
Saga plc Annual Report and Accounts 2019152
Notes to the consolidated financial statements continued

3 Segmental information (continued)b. Analysis of insurance cost of sales
2019 £’m
2018 (restated)
£’m
Gross claims incurred on insurance underwritten by the Group 129.7 156.1
Less: ceded to reinsurers (120.1) (127.1)
Net claims incurred on insurance underwritten by the Group:
• Motor broking 2.2 2.5
• Underwriting 7.4 26.5
9.6 29.0
Other cost of sales 13.9 13.4
23.5 42.4
c. Contract balancesThe following table provides information about contract assets and contract liabilities from contracts with customers as accounted for under IFRS 15 (the amounts stated here do not include amounts accounted for under IFRS 4):
2019 £’m
2018£’m
Contract cost assets 4.5 2.8
Contract liabilities 144.7 142.7
The contract cost assets relate to commissions paid to price comparison websites to acquire new business policies not underwritten by the Group.
Management expects that incremental commission fees paid to price comparison websites as a result of obtaining insurance contracts are recoverable. The Group has therefore capitalised them as contract assets amounting to £7.8m for the year ended 31 January 2019 (2018: £4.4m). These fees are amortised over the period of the expected renewal cycle. In the year to 31 January 2019, the amount of amortisation was £6.1m (2018: £4.3m) and there was no impairment loss in relation to the costs capitalised.
Applying the practical expedient in paragraph 94 of IFRS 15, the Group recognises the incremental costs of obtaining contracts as an expense when incurred if the amortisation period of the assets that the Group otherwise would have recognised is one year or less.
The contract liabilities relate to the deferral of revenue for performance obligations not satisfied as at 31 January 2019 and the advance consideration received from customers for holidays or cruises booked but not travelled and insurance premiums received in advance of the inception date.
Significant changes in the contract assets and the contract liabilities during the year are as follows:
2019 2018
Contract cost assets
Contract liabilities
Contract cost assets
Contract liabilities
Balance as at 1 February 2.8 142.7 2.7 137.4
Released to the income statement in the period (6.1) (133.6) (4.3) (134.7)
Additional contract balances incurred during the period 7.8 135.6 4.4 140.0
Balance as at 31 January 4.5 144.7 2.8 142.7
d. Transaction price allocated to the remaining performance obligationsAs at 31 January 2019, the amount allocated to the Group’s Membership scheme, Saga Possibilities, is £0.8m (2018: £0.3m). This will be recognised as revenue over the duration of Membership, which is expected to be over the next one to three years depending on the duration of each Membership contract.
The transaction price allocated to customer contracts within the Travel segment where the remaining performance obligations are not expected to be satisfied within the next 12 months is £13.3m (2018: £15.0m). This is expected to be recognised as revenue in the next one to two years.
The Group applies the practical expedient in paragraph 121 of IFRS 15 and does not disclose information about remaining performance obligations that have original expected durations of one year or less.
Financial Statements
Saga plcAnnual Report and Accounts 2019 153
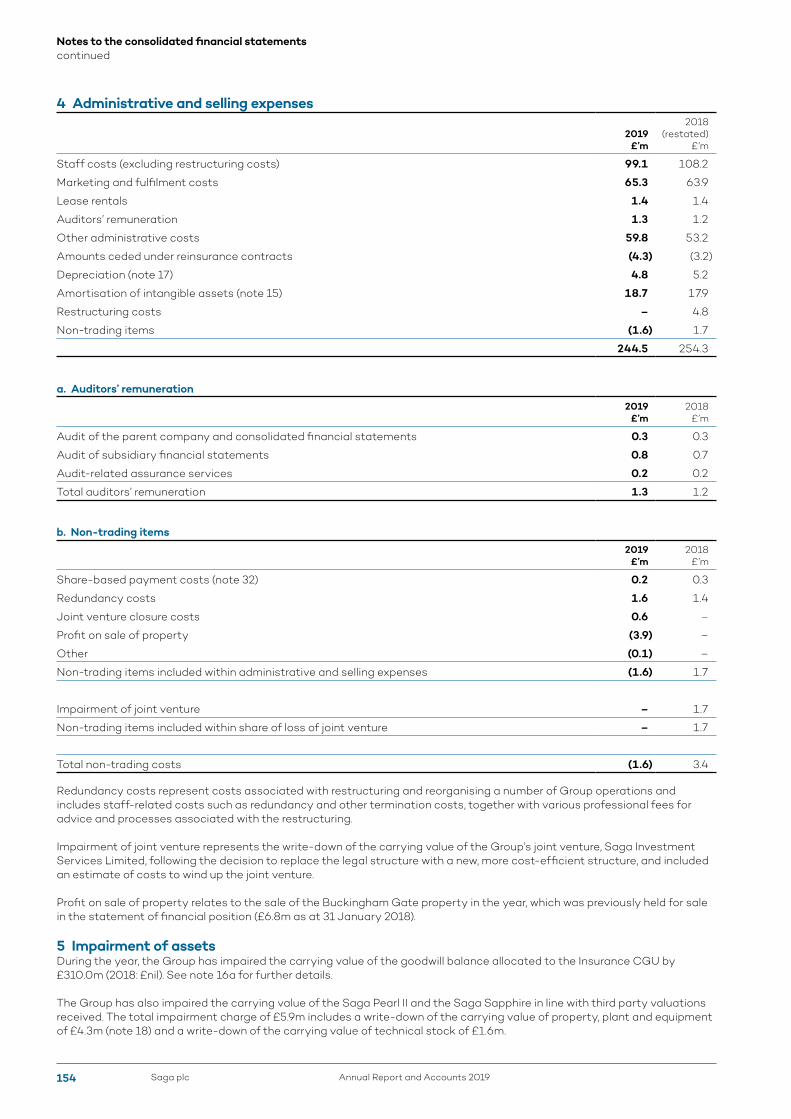
4 Administrative and selling expenses
2019 £’m
2018 (restated)
£’m
Staff costs (excluding restructuring costs) 99.1 108.2
Marketing and fulfilment costs 65.3 63.9
Lease rentals 1.4 1.4
Auditors’ remuneration 1.3 1.2
Other administrative costs 59.8 53.2
Amounts ceded under reinsurance contracts (4.3) (3.2)
Depreciation (note 17) 4.8 5.2
Amortisation of intangible assets (note 15) 18.7 17.9
Restructuring costs – 4.8
Non-trading items (1.6) 1.7
244.5 254.3
a. Auditors’ remuneration2019
£’m2018
£’m
Audit of the parent company and consolidated financial statements 0.3 0.3
Audit of subsidiary financial statements 0.8 0.7
Audit-related assurance services 0.2 0.2
Total auditors’ remuneration 1.3 1.2
b. Non-trading items2019
£’m2018
£’m
Share-based payment costs (note 32) 0.2 0.3
Redundancy costs 1.6 1.4
Joint venture closure costs 0.6 –
Profit on sale of property (3.9) –
Other (0.1) –
Non-trading items included within administrative and selling expenses (1.6) 1.7
Impairment of joint venture – 1.7
Non-trading items included within share of loss of joint venture – 1.7
Total non-trading costs (1.6) 3.4
Redundancy costs represent costs associated with restructuring and reorganising a number of Group operations and includes staff-related costs such as redundancy and other termination costs, together with various professional fees for advice and processes associated with the restructuring.
Impairment of joint venture represents the write-down of the carrying value of the Group’s joint venture, Saga Investment Services Limited, following the decision to replace the legal structure with a new, more cost-efficient structure, and included an estimate of costs to wind up the joint venture.
Profit on sale of property relates to the sale of the Buckingham Gate property in the year, which was previously held for sale in the statement of financial position (£6.8m as at 31 January 2018).
5 Impairment of assetsDuring the year, the Group has impaired the carrying value of the goodwill balance allocated to the Insurance CGU by £310.0m (2018: £nil). See note 16a for further details.
The Group has also impaired the carrying value of the Saga Pearl II and the Saga Sapphire in line with third party valuations received. The total impairment charge of £5.9m includes a write-down of the carrying value of property, plant and equipment of £4.3m (note 18) and a write-down of the carrying value of technical stock of £1.6m.
Saga plc Annual Report and Accounts 2019154
Notes to the consolidated financial statements continued

6 Investment income
2019 £’m
2018 (restated)
£’m
Interest income recognised using the EIR method 4.8 6.4
Gains on assets measured at FVTPL 1.6 2.6
Recycling of gains from other comprehensive income – 4.4
Amounts ceded under reinsurance contracts (5.7) (5.8)
0.7 7.6
7 Finance costs
2019 £’m
2018 (restated)
£’m
Interest and charges on debt and borrowings 11.5 13.5
Net fair value loss on derivative financial instruments – 0.6
Dividends paid by subsidiaries to non-controlling interests – 0.2
Net finance expense on pension schemes – 0.2
Net finance charges on finance leases and hire purchase contracts 0.2 0.3
Accelerated amortisation of debt issue costs – 4.3
11.7 19.1
8 Finance income2019
£’m2018
£’m
Net fair value gain on derivative financial instruments 1.0 –
Unwinding of discount rates – 1.5
1.0 1.5
9 Directors and employeesAmounts charged to the income statement for the year are as follows:
2019 £’m
2018 £’m
Wages and salaries 102.9 110.0
Social security costs 10.7 11.2
Pension costs (note 23) 10.3 15.5
Total staff costs 123.9 136.7
Staff costs (including restructuring and redundancy costs) of £23.2m (2018: £22.3m) and £100.7m (2018: £114.4m) have been allocated to cost of sales and to administrative and selling expenses respectively.
Average monthly number of employees:
2019 2018
Insurance 1,911 2,206
Travel 2,134 2,266
Emerging Businesses and Central Costs 997 857
Total staff numbers 5,042 5,329
The number of employees in the Travel segment includes 852 (2018: 839) crew who are employed indirectly via a manning agency.
Directors’ remunerationThe information required by the Companies Act 2006 and the Listing Rules of the FCA is contained on pages 83-97 in the Directors’ Remuneration Report.
Financial Statements
Saga plcAnnual Report and Accounts 2019 155
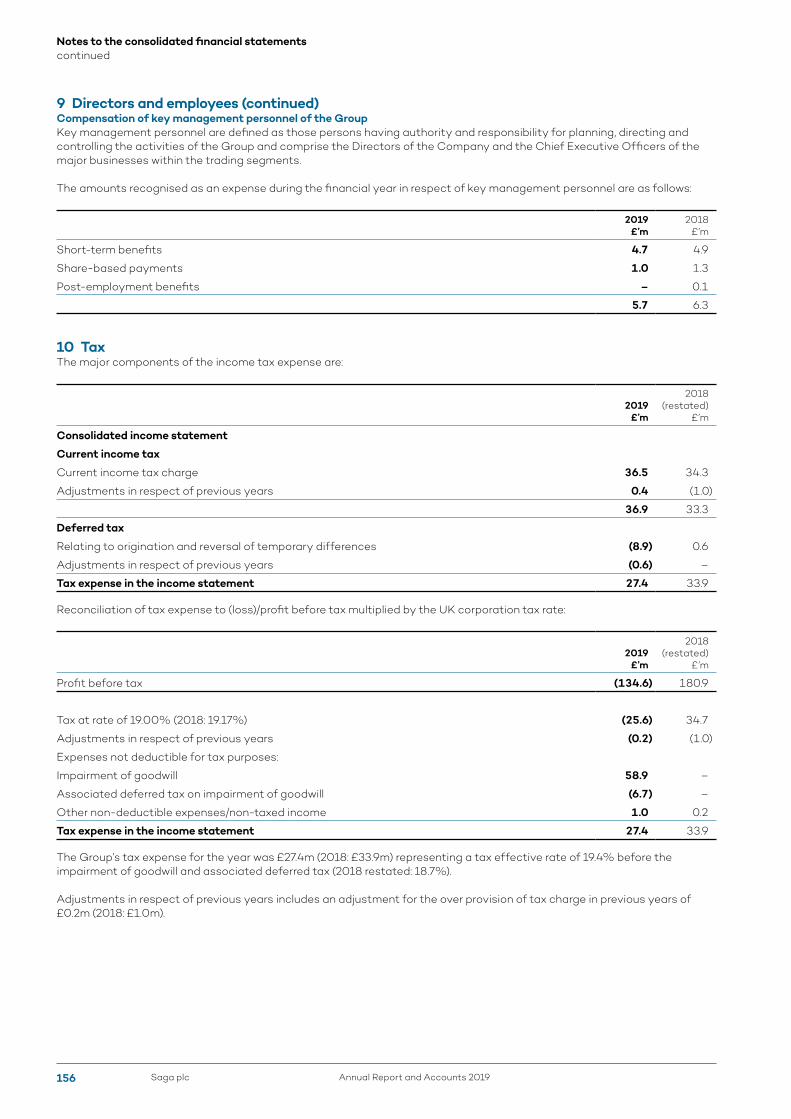
9 Directors and employees (continued)Compensation of key management personnel of the GroupKey management personnel are defined as those persons having authority and responsibility for planning, directing and controlling the activities of the Group and comprise the Directors of the Company and the Chief Executive Officers of the major businesses within the trading segments.
The amounts recognised as an expense during the financial year in respect of key management personnel are as follows:
2019 £’m
2018 £’m
Short-term benefits 4.7 4.9
Share-based payments 1.0 1.3
Post-employment benefits – 0.1
5.7 6.3
10 TaxThe major components of the income tax expense are:
2019 £’m
2018 (restated)
£’m
Consolidated income statement
Current income tax
Current income tax charge 36.5 34.3
Adjustments in respect of previous years 0.4 (1.0)
36.9 33.3
Deferred tax
Relating to origination and reversal of temporary differences (8.9) 0.6
Adjustments in respect of previous years (0.6) –
Tax expense in the income statement 27.4 33.9
Reconciliation of tax expense to (loss)/profit before tax multiplied by the UK corporation tax rate:
2019 £’m
2018 (restated)
£’m
Profit before tax (134.6) 180.9
Tax at rate of 19.00% (2018: 19.17%) (25.6) 34.7
Adjustments in respect of previous years (0.2) (1.0)
Expenses not deductible for tax purposes:
Impairment of goodwill 58.9 –
Associated deferred tax on impairment of goodwill (6.7) –
Other non-deductible expenses/non-taxed income 1.0 0.2
Tax expense in the income statement 27.4 33.9
The Group’s tax expense for the year was £27.4m (2018: £33.9m) representing a tax effective rate of 19.4% before the impairment of goodwill and associated deferred tax (2018 restated: 18.7%).
Adjustments in respect of previous years includes an adjustment for the over provision of tax charge in previous years of £0.2m (2018: £1.0m).
Saga plc Annual Report and Accounts 2019156
Notes to the consolidated financial statements continued

10 Tax (continued)Deferred tax
Consolidated statement of
financial positionConsolidated
income statement
2019 £’m
2018 (restated)
£’m2019
£’m
2018 (restated)
£’m
Excess of depreciation over capital allowances 4.5 5.4 0.9 0.2Intangible assets (1.3) (1.6) 0.3 1.9Retirement benefit scheme liabilities 0.5 1.2 (0.3) 0.6Short-term temporary differences 2.7 (8.3) 8.6 (3.3)Deferred tax credit/(charge) 9.5 (0.6)Net deferred tax assets/(liabilities) 6.4 (3.3)
Short-term temporary differences include deferred tax recognised on designated hedges recognised through OCI, the share-based payment reserve and general bad debt provision. Deferred tax is reflected in the statement of financial position as follows:
2019 £’m
2018 (restated)
£’m
Deferred tax assets 14.2 13.7Deferred tax liabilities (7.8) (17.0)Net deferred tax assets/(liabilities) 6.4 (3.3)
Reconciliation of net deferred tax assets/(liabilities)
2019 £’m
2018 (restated)
£’m
At 1 February (3.3) (5.9)Tax credit/(charge) recognised in the income statement 9.5 (0.6)Tax charge recognised in other comprehensive income 0.2 3.2At 31 January 6.4 (3.3)
Measures were enacted in the Finance Act 2015 to reduce the corporation tax rate from 20% to 19% from 1 April 2017, and to 18% from 1 April 2020. A further reduction to 17% from 1 April 2020 was announced on 16 March 2016 and has been enacted at the balance sheet date. As a result, the closing deferred tax balances have been reflected at 17%. We expect net deferred tax assets/(liabilities) to be normally settled within 12 months.
The Group has tax losses which arose in the UK of £4.2m (2018: £4.2m) that are available indefinitely for offsetting against future taxable profits of the companies in which the losses arose.
Deferred tax assets have not been recognised in respect of these losses as they may not be used to offset taxable profits elsewhere in the Group. They have arisen in subsidiaries that have been loss-making for some time, and there are no other tax planning opportunities or other evidence of recoverability in the near future. If the Group was able to recognise all unrecognised deferred tax assets, the profit would increase by £0.7m (2018: £0.7m).
11 Dividends
Declared during the year:2019
£’m2018
£’m
Final dividend for the year ended 31 January 2018: 6.0 pence per share (2017: 5.8 pence per share) 67.1 64.8Interim dividend for the year ended 31 January 2019: 3.0 pence per share (2018: 3.0 pence per share) 33.6 33.6
100.7 98.4
Proposed after the end of the reporting period and not recognised as a liability:Final dividend for the year ended 31 January 2019: 1.0 pence per share (2018: 6.0 pence per share) 11.2 67.2
The proposed dividend for the year ended 31 January 2019 is subject to approval by shareholders at the Annual General Meeting on 19 June 2019 and would be paid on 28 June 2019.
Saga offers a share alternative in the form of a dividend re-investment plan (DRIP) for those shareholders who wish to elect to use their dividend payments to purchase additional shares in the Group, rather than receiving a cash payment. The last date for shareholders to elect to participate in the DRIP will be 3 June 2019. The record date will be 17 May 2019 and the final dividend will be paid on 28 June 2019. Payment of the final dividend of 1.0p per share remains subject to shareholder approval at the Company’s 2019 Annual General Meeting.
Financial Statements
Saga plcAnnual Report and Accounts 2019 157
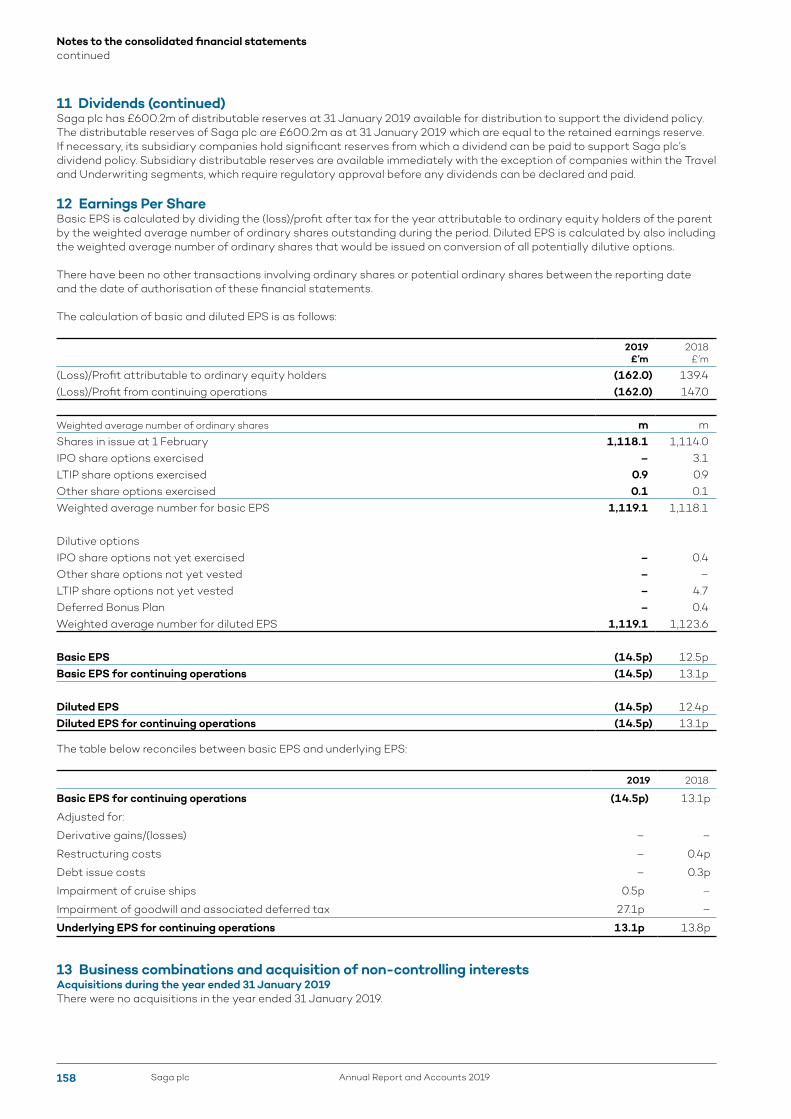
11 Dividends (continued)Saga plc has £600.2m of distributable reserves at 31 January 2019 available for distribution to support the dividend policy. The distributable reserves of Saga plc are £600.2m as at 31 January 2019 which are equal to the retained earnings reserve. If necessary, its subsidiary companies hold significant reserves from which a dividend can be paid to support Saga plc’s dividend policy. Subsidiary distributable reserves are available immediately with the exception of companies within the Travel and Underwriting segments, which require regulatory approval before any dividends can be declared and paid.
12 Earnings Per ShareBasic EPS is calculated by dividing the (loss)/profit after tax for the year attributable to ordinary equity holders of the parent by the weighted average number of ordinary shares outstanding during the period. Diluted EPS is calculated by also including the weighted average number of ordinary shares that would be issued on conversion of all potentially dilutive options.
There have been no other transactions involving ordinary shares or potential ordinary shares between the reporting date and the date of authorisation of these financial statements.
The calculation of basic and diluted EPS is as follows:
2019 £’m
2018 £’m
(Loss)/Profit attributable to ordinary equity holders (162.0) 139.4(Loss)/Profit from continuing operations (162.0) 147.0
Weighted average number of ordinary shares m mShares in issue at 1 February 1,118.1 1,114.0IPO share options exercised – 3.1LTIP share options exercised 0.9 0.9Other share options exercised 0.1 0.1Weighted average number for basic EPS 1,119.1 1,118.1
Dilutive optionsIPO share options not yet exercised – 0.4Other share options not yet vested – –LTIP share options not yet vested – 4.7Deferred Bonus Plan – 0.4Weighted average number for diluted EPS 1,119.1 1,123.6
Basic EPS (14.5p) 12.5pBasic EPS for continuing operations (14.5p) 13.1p
Diluted EPS (14.5p) 12.4pDiluted EPS for continuing operations (14.5p) 13.1p
The table below reconciles between basic EPS and underlying EPS:
2019 2018
Basic EPS for continuing operations (14.5p) 13.1p
Adjusted for:
Derivative gains/(losses) – –
Restructuring costs – 0.4p
Debt issue costs – 0.3p
Impairment of cruise ships 0.5p –
Impairment of goodwill and associated deferred tax 27.1p –
Underlying EPS for continuing operations 13.1p 13.8p
13 Business combinations and acquisition of non-controlling interestsAcquisitions during the year ended 31 January 2019There were no acquisitions in the year ended 31 January 2019.
Saga plc Annual Report and Accounts 2019158
Notes to the consolidated financial statements continued
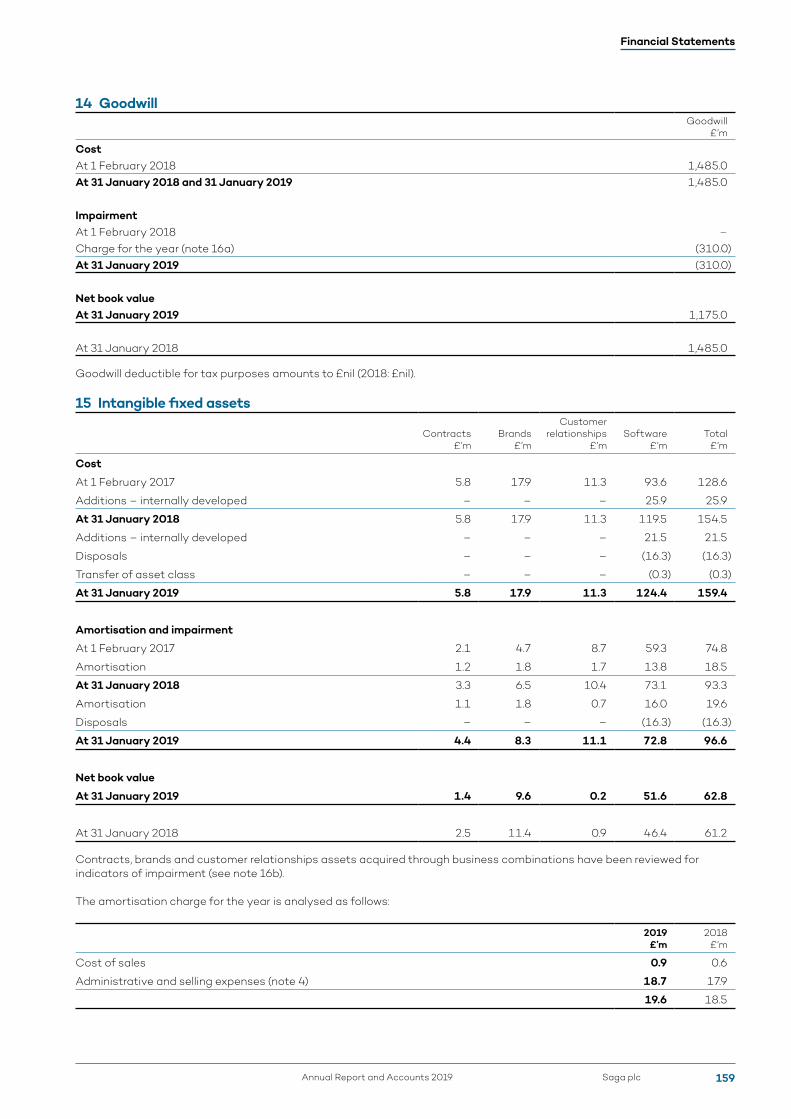
14 GoodwillGoodwill
£’m
CostAt 1 February 2018 1,485.0At 31 January 2018 and 31 January 2019 1,485.0
ImpairmentAt 1 February 2018 –Charge for the year (note 16a) (310.0)At 31 January 2019 (310.0)
Net book valueAt 31 January 2019 1,175.0
At 31 January 2018 1,485.0
Goodwill deductible for tax purposes amounts to £nil (2018: £nil).
15 Intangible fixed assets
Contracts £’m
Brands £’m
Customer relationships
£’mSoftware
£’mTotal
£’m
Cost
At 1 February 2017 5.8 17.9 11.3 93.6 128.6
Additions – internally developed – – – 25.9 25.9
At 31 January 2018 5.8 17.9 11.3 119.5 154.5
Additions – internally developed – – – 21.5 21.5
Disposals – – – (16.3) (16.3)
Transfer of asset class – – – (0.3) (0.3)
At 31 January 2019 5.8 17.9 11.3 124.4 159.4
Amortisation and impairment
At 1 February 2017 2.1 4.7 8.7 59.3 74.8
Amortisation 1.2 1.8 1.7 13.8 18.5
At 31 January 2018 3.3 6.5 10.4 73.1 93.3
Amortisation 1.1 1.8 0.7 16.0 19.6
Disposals – – – (16.3) (16.3)
At 31 January 2019 4.4 8.3 11.1 72.8 96.6
Net book value
At 31 January 2019 1.4 9.6 0.2 51.6 62.8
At 31 January 2018 2.5 11.4 0.9 46.4 61.2
Contracts, brands and customer relationships assets acquired through business combinations have been reviewed for indicators of impairment (see note 16b).
The amortisation charge for the year is analysed as follows:
2019 £’m
2018 £’m
Cost of sales 0.9 0.6
Administrative and selling expenses (note 4) 18.7 17.9
19.6 18.5
Financial Statements
Saga plcAnnual Report and Accounts 2019 159

16 Impairment of intangible assetsa. GoodwillGoodwill acquired through business combinations has been allocated to CGUs for the purpose of impairment testing. The carrying value of goodwill by CGU is as follows:
2019 £’m
2018 £’m
Insurance, excluding Bennetts 1,088.6 1,398.6Insurance, Bennetts 13.6 13.6Travel, excluding Destinology 59.8 59.8Travel, Destinology 13.0 13.0
1,175.0 1,485.0
The Group has tested all goodwill balances for impairment at 31 January 2019. The impairment test compares the recoverable amount of the goodwill of each CGU to its carrying value. The goodwill associated with the Bennetts and Destinology businesses have been considered separately, as these businesses represent separate CGUs.
The recoverable amount of each CGU has been determined based on a value-in-use calculation using cash flow projections from the Group’s Board-approved five year plan to 2023/24. Terminal values have been included using 2.25% as the expected long-term average growth rate of the UK economy, and calculated using the Gordon Growth Model. The cash flows have then been discounted to present value using a suitably risk-adjusted discount rate derived from the Group’s weighted average cost of capital. The pre-tax discount rates used for each CGU were as follows:
2019 2018
Insurance, excluding Bennetts 9.6% 9.7%Insurance, Bennetts 11.6% 10.6%Travel, excluding Destinology 11.8% 10.1%Travel, Destinology 12.2% 10.1%
The value-in-use calculation is most sensitive to the assumptions used for forecast cash flows, the long-term growth rate and the discount rate selected, all of which require significant judgement. Accordingly, stress testing has been performed on these key assumptions as part of the impairment review to determine whether any reasonably foreseeable change in those assumptions would cause the recoverable amount of the CGU to be lower than its carrying amount. Stress testing as to possible Brexit outcomes has also been considered.
The resultant headroom/(deficit) for each of the CGUs against the brought forward carrying value is as follows:
Headroom /(deficit) £’m
Insurance, excluding Bennetts (310.0)Insurance, Bennetts 30.9Travel, excluding Destinology 374.0Travel, Destinology 10.5
Due to the deficit calculated in the Insurance excluding Bennetts base case for the Insurance excluding Bennetts CGU, and taking into account the likelihood of each of the sensitivities, management considers it necessary to impair the Insurance excluding Bennetts CGU to its value-in-use of £1,157.9m, from which the value of PPE and intangibles assets of £69.3m must also be deducted. Therefore, a reduction to the carrying value of Goodwill allocated to the Insurance excluding Bennetts CGU of £310.0m has been recognised in the year to 31 January 2019. The impairment charge has been determined using a prudent view of forecast cash flows for the Insurance business, removing the benefit of future strategies that are not yet reflective of the asset in its current condition. No impairment is considered necessary for the three other CGUs.
The headroom calculated is most sensitive to the discount rate and terminal growth rate assumed. A quantitative sensitivity analysis for each of these as at 31 January 2019 and its impact on the headroom against brought forward goodwill carrying values is as follows:
Pre-tax discount rate Terminal growth rate
+1.0ppt £’m
–1.0ppt £’m
+1.0ppt £’m
–1.0ppt £’m
Insurance, excluding Bennetts (130.8) 171.5 134.0 (102.0)Insurance, Bennetts (4.6) 5.8 4.3 (3.4)Travel, excluding Destinology (93.8) 116.7 89.2 (72.3)Travel, Destinology (2.9) 3.6 2.6 (2.1)
Saga plc Annual Report and Accounts 2019160
Notes to the consolidated financial statements continued
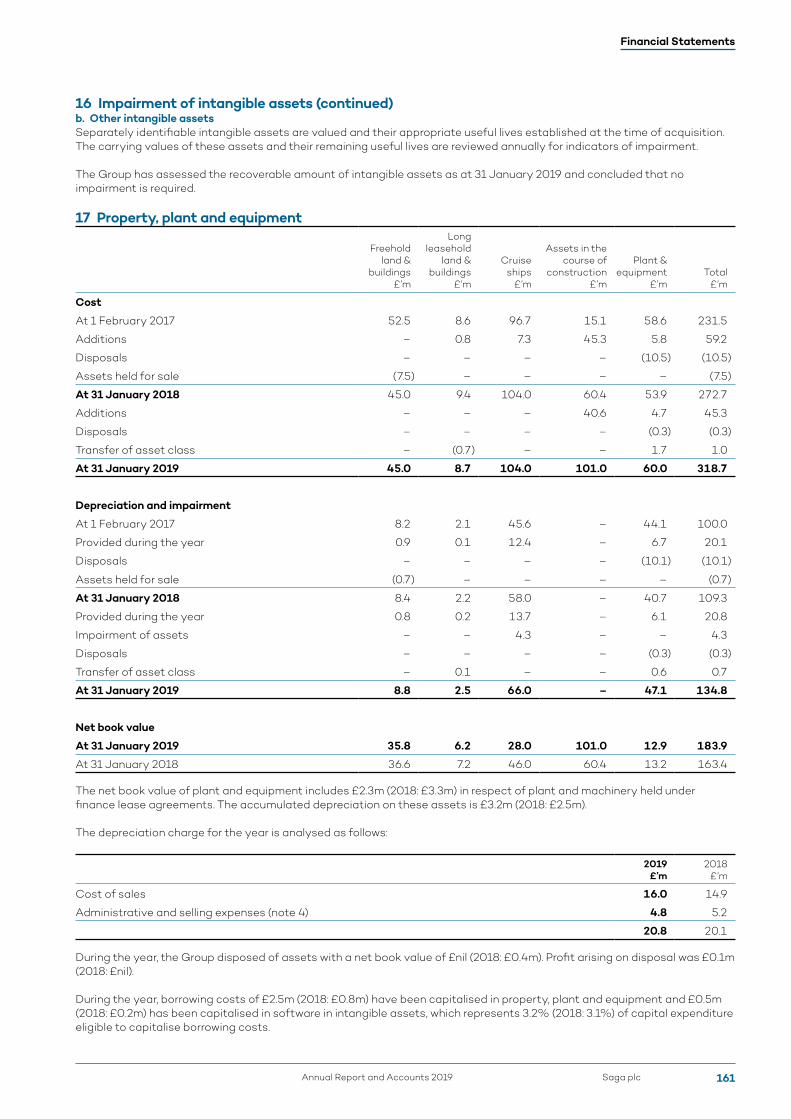
16 Impairment of intangible assets (continued)b. Other intangible assetsSeparately identifiable intangible assets are valued and their appropriate useful lives established at the time of acquisition. The carrying values of these assets and their remaining useful lives are reviewed annually for indicators of impairment.
The Group has assessed the recoverable amount of intangible assets as at 31 January 2019 and concluded that no impairment is required.
17 Property, plant and equipment
Freehold land &
buildings £’m
Long leasehold
land & buildings
£’m
Cruise ships
£’m
Assets in the course of
construction £’m
Plant & equipment
£’mTotal
£’m
Cost
At 1 February 2017 52.5 8.6 96.7 15.1 58.6 231.5
Additions – 0.8 7.3 45.3 5.8 59.2
Disposals – – – – (10.5) (10.5)
Assets held for sale (7.5) – – – – (7.5)
At 31 January 2018 45.0 9.4 104.0 60.4 53.9 272.7
Additions – – – 40.6 4.7 45.3
Disposals – – – – (0.3) (0.3)
Transfer of asset class – (0.7) – – 1.7 1.0
At 31 January 2019 45.0 8.7 104.0 101.0 60.0 318.7
Depreciation and impairment
At 1 February 2017 8.2 2.1 45.6 – 44.1 100.0
Provided during the year 0.9 0.1 12.4 – 6.7 20.1
Disposals – – – – (10.1) (10.1)
Assets held for sale (0.7) – – – – (0.7)
At 31 January 2018 8.4 2.2 58.0 – 40.7 109.3
Provided during the year 0.8 0.2 13.7 – 6.1 20.8
Impairment of assets – – 4.3 – – 4.3
Disposals – – – – (0.3) (0.3)
Transfer of asset class – 0.1 – – 0.6 0.7
At 31 January 2019 8.8 2.5 66.0 – 47.1 134.8
Net book value
At 31 January 2019 35.8 6.2 28.0 101.0 12.9 183.9
At 31 January 2018 36.6 7.2 46.0 60.4 13.2 163.4
The net book value of plant and equipment includes £2.3m (2018: £3.3m) in respect of plant and machinery held under finance lease agreements. The accumulated depreciation on these assets is £3.2m (2018: £2.5m).
The depreciation charge for the year is analysed as follows:
2019 £’m
2018 £’m
Cost of sales 16.0 14.9
Administrative and selling expenses (note 4) 4.8 5.2
20.8 20.1
During the year, the Group disposed of assets with a net book value of £nil (2018: £0.4m). Profit arising on disposal was £0.1m (2018: £nil).
During the year, borrowing costs of £2.5m (2018: £0.8m) have been capitalised in property, plant and equipment and £0.5m (2018: £0.2m) has been capitalised in software in intangible assets, which represents 3.2% (2018: 3.1%) of capital expenditure eligible to capitalise borrowing costs.
Financial Statements
Saga plcAnnual Report and Accounts 2019 161
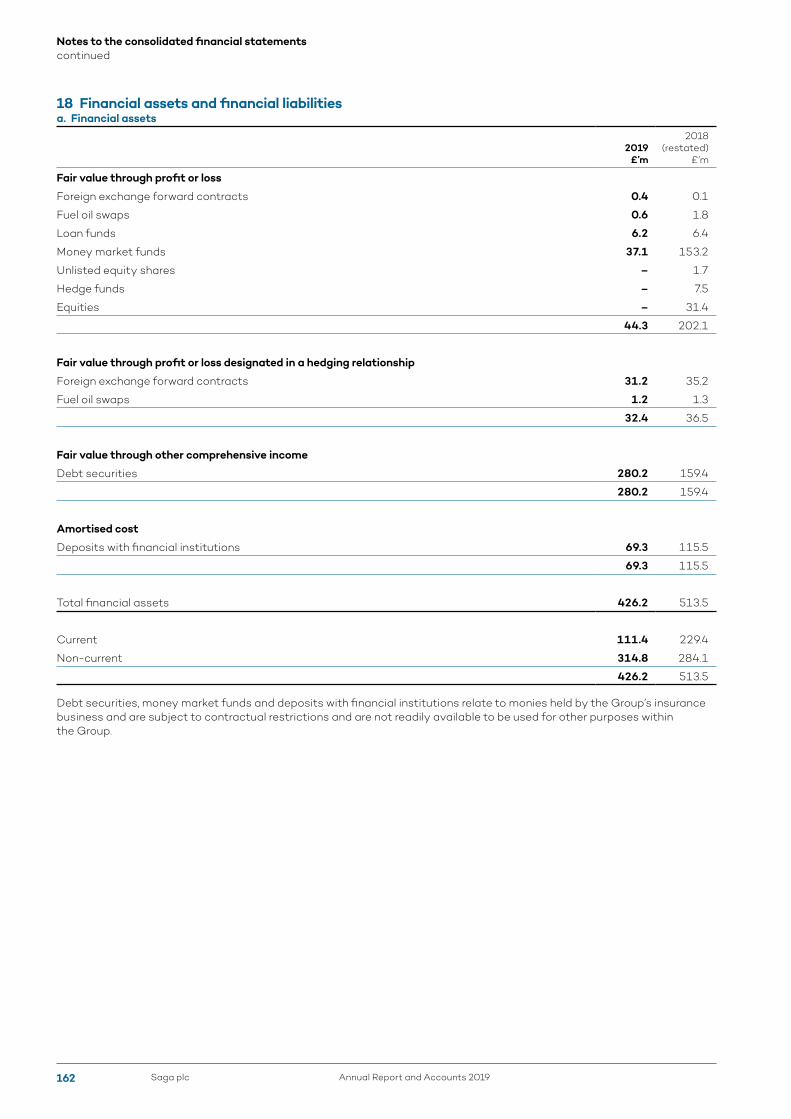
18 Financial assets and financial liabilitiesa. Financial assets
2019 £’m
2018 (restated)
£’m
Fair value through profit or loss
Foreign exchange forward contracts 0.4 0.1
Fuel oil swaps 0.6 1.8
Loan funds 6.2 6.4
Money market funds 37.1 153.2
Unlisted equity shares – 1.7
Hedge funds – 7.5
Equities – 31.4
44.3 202.1
Fair value through profit or loss designated in a hedging relationship
Foreign exchange forward contracts 31.2 35.2
Fuel oil swaps 1.2 1.3
32.4 36.5
Fair value through other comprehensive income
Debt securities 280.2 159.4
280.2 159.4
Amortised cost
Deposits with financial institutions 69.3 115.5
69.3 115.5
Total financial assets 426.2 513.5
Current 111.4 229.4
Non-current 314.8 284.1
426.2 513.5
Debt securities, money market funds and deposits with financial institutions relate to monies held by the Group’s insurance business and are subject to contractual restrictions and are not readily available to be used for other purposes within the Group.
Saga plc Annual Report and Accounts 2019162
Notes to the consolidated financial statements continued
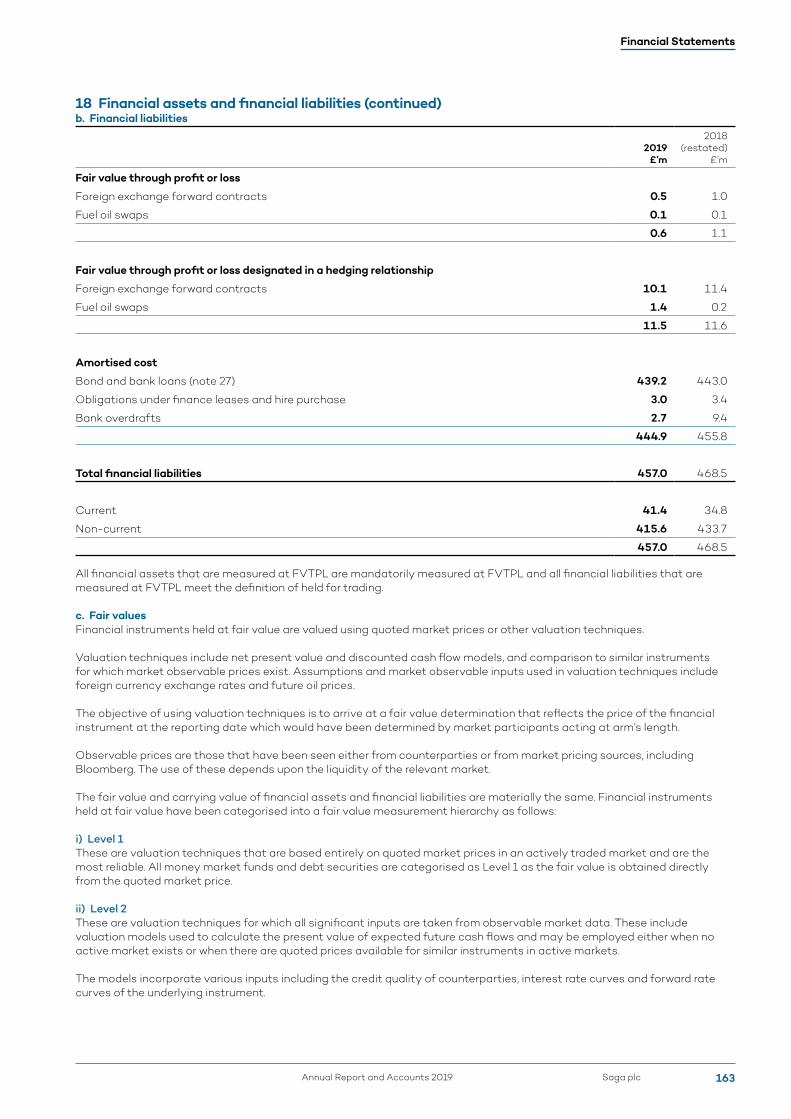
18 Financial assets and financial liabilities (continued)b. Financial liabilities
2019 £’m
2018 (restated)
£’m
Fair value through profit or loss
Foreign exchange forward contracts 0.5 1.0
Fuel oil swaps 0.1 0.1
0.6 1.1
Fair value through profit or loss designated in a hedging relationship
Foreign exchange forward contracts 10.1 11.4
Fuel oil swaps 1.4 0.2
11.5 11.6
Amortised cost
Bond and bank loans (note 27) 439.2 443.0
Obligations under finance leases and hire purchase 3.0 3.4
Bank overdrafts 2.7 9.4
444.9 455.8
Total financial liabilities 457.0 468.5
Current 41.4 34.8
Non-current 415.6 433.7
457.0 468.5
All financial assets that are measured at FVTPL are mandatorily measured at FVTPL and all financial liabilities that are measured at FVTPL meet the definition of held for trading.
c. Fair valuesFinancial instruments held at fair value are valued using quoted market prices or other valuation techniques.
Valuation techniques include net present value and discounted cash flow models, and comparison to similar instruments for which market observable prices exist. Assumptions and market observable inputs used in valuation techniques include foreign currency exchange rates and future oil prices.
The objective of using valuation techniques is to arrive at a fair value determination that reflects the price of the financial instrument at the reporting date which would have been determined by market participants acting at arm’s length.
Observable prices are those that have been seen either from counterparties or from market pricing sources, including Bloomberg. The use of these depends upon the liquidity of the relevant market.
The fair value and carrying value of financial assets and financial liabilities are materially the same. Financial instruments held at fair value have been categorised into a fair value measurement hierarchy as follows:
i) Level 1These are valuation techniques that are based entirely on quoted market prices in an actively traded market and are the most reliable. All money market funds and debt securities are categorised as Level 1 as the fair value is obtained directly from the quoted market price.
ii) Level 2These are valuation techniques for which all significant inputs are taken from observable market data. These include valuation models used to calculate the present value of expected future cash flows and may be employed either when no active market exists or when there are quoted prices available for similar instruments in active markets.
The models incorporate various inputs including the credit quality of counterparties, interest rate curves and forward rate curves of the underlying instrument.
Financial Statements
Saga plcAnnual Report and Accounts 2019 163
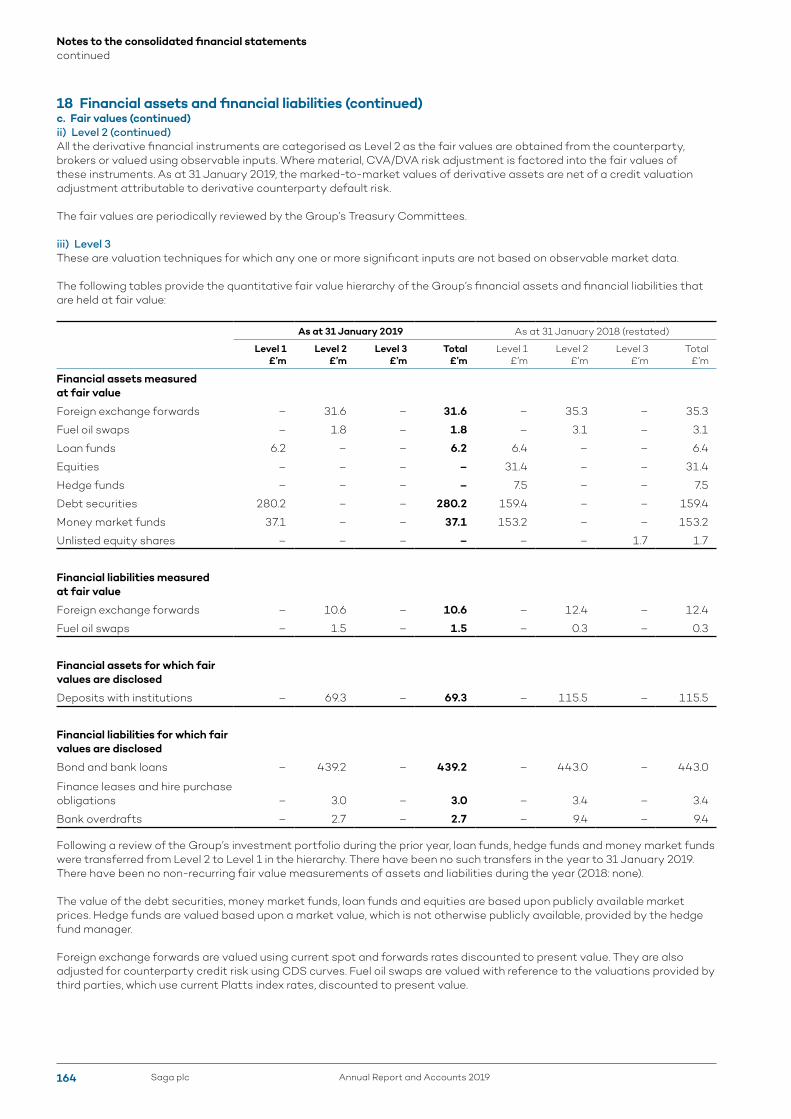
18 Financial assets and financial liabilities (continued)c. Fair values (continued)ii) Level 2 (continued)All the derivative financial instruments are categorised as Level 2 as the fair values are obtained from the counterparty, brokers or valued using observable inputs. Where material, CVA/DVA risk adjustment is factored into the fair values of these instruments. As at 31 January 2019, the marked-to-market values of derivative assets are net of a credit valuation adjustment attributable to derivative counterparty default risk.
The fair values are periodically reviewed by the Group’s Treasury Committees.
iii) Level 3These are valuation techniques for which any one or more significant inputs are not based on observable market data.
The following tables provide the quantitative fair value hierarchy of the Group’s financial assets and financial liabilities that are held at fair value:
As at 31 January 2019 As at 31 January 2018 (restated)
Level 1 £’m
Level 2 £’m
Level 3 £’m
Total £’m
Level 1 £’m
Level 2 £’m
Level 3 £’m
Total £’m
Financial assets measured at fair value
Foreign exchange forwards – 31.6 – 31.6 – 35.3 – 35.3
Fuel oil swaps – 1.8 – 1.8 – 3.1 – 3.1
Loan funds 6.2 – – 6.2 6.4 – – 6.4
Equities – – – – 31.4 – – 31.4
Hedge funds – – – – 7.5 – – 7.5
Debt securities 280.2 – – 280.2 159.4 – – 159.4
Money market funds 37.1 – – 37.1 153.2 – – 153.2
Unlisted equity shares – – – – – – 1.7 1.7
Financial liabilities measured at fair value
Foreign exchange forwards – 10.6 – 10.6 – 12.4 – 12.4
Fuel oil swaps – 1.5 – 1.5 – 0.3 – 0.3
Financial assets for which fair values are disclosed
Deposits with institutions – 69.3 – 69.3 – 115.5 – 115.5
Financial liabilities for which fair values are disclosed
Bond and bank loans – 439.2 – 439.2 – 443.0 – 443.0
Finance leases and hire purchase obligations – 3.0 – 3.0 – 3.4 – 3.4
Bank overdrafts – 2.7 – 2.7 – 9.4 – 9.4
Following a review of the Group’s investment portfolio during the prior year, loan funds, hedge funds and money market funds were transferred from Level 2 to Level 1 in the hierarchy. There have been no such transfers in the year to 31 January 2019. There have been no non-recurring fair value measurements of assets and liabilities during the year (2018: none).
The value of the debt securities, money market funds, loan funds and equities are based upon publicly available market prices. Hedge funds are valued based upon a market value, which is not otherwise publicly available, provided by the hedge fund manager.
Foreign exchange forwards are valued using current spot and forwards rates discounted to present value. They are also adjusted for counterparty credit risk using CDS curves. Fuel oil swaps are valued with reference to the valuations provided by third parties, which use current Platts index rates, discounted to present value.
Saga plc Annual Report and Accounts 2019164
Notes to the consolidated financial statements continued
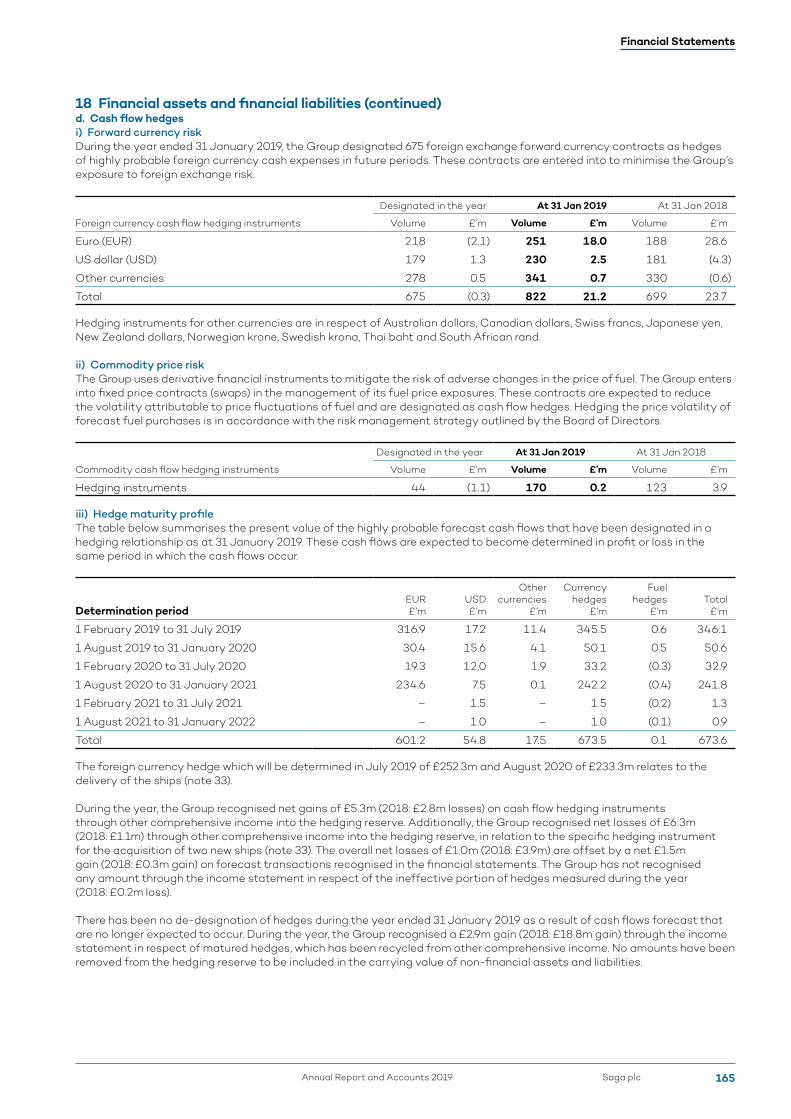
18 Financial assets and financial liabilities (continued)d. Cash flow hedgesi) Forward currency riskDuring the year ended 31 January 2019, the Group designated 675 foreign exchange forward currency contracts as hedges of highly probable foreign currency cash expenses in future periods. These contracts are entered into to minimise the Group’s exposure to foreign exchange risk.
Designated in the year At 31 Jan 2019 At 31 Jan 2018
Foreign currency cash flow hedging instruments Volume £’m Volume £’m Volume £’m
Euro (EUR) 218 (2.1) 251 18.0 188 28.6
US dollar (USD) 179 1.3 230 2.5 181 (4.3)
Other currencies 278 0.5 341 0.7 330 (0.6)
Total 675 (0.3) 822 21.2 699 23.7
Hedging instruments for other currencies are in respect of Australian dollars, Canadian dollars, Swiss francs, Japanese yen, New Zealand dollars, Norwegian krone, Swedish krona, Thai baht and South African rand.
ii) Commodity price riskThe Group uses derivative financial instruments to mitigate the risk of adverse changes in the price of fuel. The Group enters into fixed price contracts (swaps) in the management of its fuel price exposures. These contracts are expected to reduce the volatility attributable to price fluctuations of fuel and are designated as cash flow hedges. Hedging the price volatility of forecast fuel purchases is in accordance with the risk management strategy outlined by the Board of Directors.
Designated in the year At 31 Jan 2019 At 31 Jan 2018
Commodity cash flow hedging instruments Volume £’m Volume £’m Volume £’m
Hedging instruments 44 (1.1) 170 0.2 123 3.9
iii) Hedge maturity profileThe table below summarises the present value of the highly probable forecast cash flows that have been designated in a hedging relationship as at 31 January 2019. These cash flows are expected to become determined in profit or loss in the same period in which the cash flows occur.
Determination periodEUR £’m
USD £’m
Other currencies
£’m
Currency hedges
£’m
Fuel hedges
£’mTotal
£’m
1 February 2019 to 31 July 2019 316.9 17.2 11.4 345.5 0.6 346.1
1 August 2019 to 31 January 2020 30.4 15.6 4.1 50.1 0.5 50.6
1 February 2020 to 31 July 2020 19.3 12.0 1.9 33.2 (0.3) 32.9
1 August 2020 to 31 January 2021 234.6 7.5 0.1 242.2 (0.4) 241.8
1 February 2021 to 31 July 2021 – 1.5 – 1.5 (0.2) 1.3
1 August 2021 to 31 January 2022 – 1.0 – 1.0 (0.1) 0.9
Total 601.2 54.8 17.5 673.5 0.1 673.6
The foreign currency hedge which will be determined in July 2019 of £252.3m and August 2020 of £233.3m relates to the delivery of the ships (note 33).
During the year, the Group recognised net gains of £5.3m (2018: £2.8m losses) on cash flow hedging instruments through other comprehensive income into the hedging reserve. Additionally, the Group recognised net losses of £6.3m (2018: £1.1m) through other comprehensive income into the hedging reserve, in relation to the specific hedging instrument for the acquisition of two new ships (note 33). The overall net losses of £1.0m (2018: £3.9m) are offset by a net £1.5m gain (2018: £0.3m gain) on forecast transactions recognised in the financial statements. The Group has not recognised any amount through the income statement in respect of the ineffective portion of hedges measured during the year (2018: £0.2m loss).
There has been no de-designation of hedges during the year ended 31 January 2019 as a result of cash flows forecast that are no longer expected to occur. During the year, the Group recognised a £2.9m gain (2018: £18.8m gain) through the income statement in respect of matured hedges, which has been recycled from other comprehensive income. No amounts have been removed from the hedging reserve to be included in the carrying value of non-financial assets and liabilities.
Financial Statements
Saga plcAnnual Report and Accounts 2019 165

19 Financial risk management objectives and policiesThe Group’s principal financial liabilities comprise loans and borrowings and trade and other payables. The main purpose of these financial liabilities is to finance the Group’s operations and to provide guarantees to support its operations. The Group’s principal financial assets include debt securities, deposits with financial institutions, money market funds, equity funds, loan funds and hedge funds. The Group also enters into derivative transactions such as foreign exchange forward contracts, fuel and gas oil swaps and interest rate swaps to manage its exposures to various risks.
The Group is exposed to market risk, credit risk, liquidity risk, insurance risk and operational risk. The Group’s senior management oversees the management of these risks, supported by the Group Treasury function and Treasury Committees within the key areas of the Group that advise on financial risks and the appropriate financial risk governance framework for the Group. These functions and committees ensure that the Group’s financial risks are governed by appropriate policies and procedures and that financial risks are identified, measured and managed in accordance with the Group’s policies and risk objectives. All derivative activities are for risk management purposes and are carried out by the Group’s Treasury function. It is the Group’s policy that no trading in derivatives for speculative purposes may be undertaken.
The Group manages concentration risk on its financial assets through a policy of diversification that is outlined in the Group Treasury Policy and approved by the Board. The policy defines the exposure limit by asset class and to third party institutions based on the credit ratings of the individual counterparties, combined with the views of the Board. On a monthly basis, exposure to each asset class and counterparty is calculated and reported, and compliance with the policy is monitored.
The Board of Directors reviews and agrees policies for managing each of these risks, which are summarised below.
a. Market riskMarket risk is the risk that the fair value of future cash flows of a financial instrument will fluctuate because of changes in market prices. The Group is exposed to the following market risk factors:
• Foreign currency risk.• Commodity price risk.• Equity prices.• Interest rate risk.
The Group has policies and limits approved by the Board for managing the market risk exposure. These set out the principles that the business should adhere to for managing market risk and establishing the maximum limits that the Group is willing to accept considering strategy, risk appetite and capital resources.
The Group has the ability to monitor market risk exposure on a daily basis and has established limits for each component of market risk.
The Group uses derivatives for hedging its exposure to foreign currency, fuel oil prices and interest rate risks. The market risk policy explicitly prohibits the use of derivatives for speculative purposes.
Equity exposures are managed within allocation parameters agreed by the Board and with reference to agreed benchmarks.
i) Foreign currency riskForeign currency risk is the risk that the fair value of future cash flows of a financial asset or liability will fluctuate because of changes in foreign exchange rates. The Group’s exposure to the risk of changes in foreign exchange rates relates primarily to the Group’s operating activities (when revenue or expense is denominated in a different currency from the Group’s functional currency).
The Group uses foreign exchange forward contracts to manage the majority of its transaction exposures. The foreign exchange forward contracts, some of which are formally designated as hedging instruments, are entered into for periods consistent with the foreign currency exposure of the underlying transactions, generally from 1 to 24 months. The foreign exchange forward contracts vary with the level of expected foreign currency sales and purchases.
Saga plc Annual Report and Accounts 2019166
Notes to the consolidated financial statements continued

19 Financial risk management objectives and policies (continued)a. Market risk (continued)i) Foreign currency risk (continued)The following table demonstrates the sensitivity of the fair value of forward exchange contracts to a 5% change in US dollar and Euro exchange rates, with all other variables held constant. The Group’s exposure to foreign currency changes for all other currencies is not material. The impact is shown net of tax at the current rate.
Sensitivity of +/– 5% rate change in
Effect on the fair value of forward exchange
contractsEffect on profit after
tax and equity
2019 EUR – Trading +/– £5.9m +/– £0.6m
EUR – New ships +/– £23.7m +/– £0.0m
USD +/– £4.0m +/– £0.6m
2018 EUR – Trading +/– £4.2m +/– £0.7m
EUR – New ships +/– £18.1m +/– £0.0m
USD +/– £2.3m +/– £0.4m
Since all of the forward exchange contracts held are part of effective hedging relationships, any change to the fair value of the instrument will be offset by an equal and opposite change to the cost of the hedged item resulting in no effect on profit after tax and equity.
ii) Commodity price riskThe Group is affected by the price volatility of certain commodities. Its operating activities require the ongoing purchase of fuel and gas oil to sail its cruise ships and therefore require a continuous supply of fuel and gas oil. The volatility in the price of fuel and gas oil has led to the decision to enter into commodity fuel and gas oil swap contracts. These contracts are expected to reduce the volatility attributable to price fluctuations of fuel and gas oil. Managing the price volatility of forecast oil purchases is in accordance with the risk management strategy outlined by the Board of Directors.
The Group manages the purchase price using forward commodity purchase contracts based on a 24 month forecast of the required fuel oil supply.
The following table shows the sensitivity of the fair value of fuel oil swaps to changes in the US dollar exchange rate with all other variables held constant. The impact is shown net of tax at the current rate.
Sensitivity of +/– 5% rate change in
Effect on profit after tax and equity
2019 USD – Fuel oil price +/– £0.1m
2018 USD – Fuel oil price +/– £0.1m
iii) Interest rate riskInterest rate risk arises primarily from medium and long-term investments in fixed interest securities. The market value of these investments is affected by the movement in interest rates. This is managed by a policy of holding the majority of investments to maturity by closely matching asset and liability duration.
It is also ensured that the investment portfolio has a diversified range of investments such that there is a combination of fixed and floating rate securities, as well as other types of investments such as RPI linked securities.
Interest rate risk also arises in respect of the Group’s borrowings where the interest rate attaching to those borrowings is not fixed. Where the Group perceives there to be a significant interest rate risk, it manages its exposure to such risks by purchasing interest rate caps to limit the risk.
The following table shows the sensitivity of financial assets and liabilities to changes in the LIBOR rate. The impact is shown net of tax at the current rate.
Sensitivity of +/– 0.25%
rate change inEffect on profit after
tax and equity
2019 LIBOR +/– £0.3m
2018 LIBOR +/– £0.1m
Financial Statements
Saga plcAnnual Report and Accounts 2019 167

19 Financial risk management objectives and policies (continued)b. Credit riskCredit risk is the risk that a counterparty will not meet its obligations under a financial instrument or customer contract, leading to a financial loss. The Group is exposed to credit risk in relation to its financial and reinsurance assets, outstanding derivatives and trade and other receivables. The Group assesses its counterparty exposure in relation to the investment of surplus cash, fuel oil and foreign currency contracts, and undrawn credit facilities. The Group primarily uses published credit ratings to assess counterparty strength and therefore to define the credit limit for each counterparty in accordance with approved treasury policies.
The credit risk in respect of trade and other receivables is limited as payment from customers is generally required before services are provided. At 31 January 2019, the maximum exposure to credit risk for trade receivables by operating segment was as follows:
2019 £’m
2018 £’m
Insurance 51.4 136.5
Travel 2.3 4.0
Emerging Businesses and Central Costs 7.0 4.4
60.7 144.9
Amounts past due but not impaired by operating segment were as follows:
2019 £’m
2018 £’m
Insurance 15.4 11.3
Travel 1.1 0.8
Emerging Businesses and Central Costs 1.7 2.0
18.2 14.1
Management believes that the unimpaired amounts that are current and past due by more than 30 days are still collectable in full, based on historical payment behaviour.
Credit risk in relation to deposits and derivative counterparties is managed by the Group’s Treasury department in accordance with the Group’s policy. Investments of surplus funds are made only with approved counterparties and within credit limits assigned to each counterparty. Counterparty credit limits are reviewed on a regular basis, and updated throughout the year subject to approval by the Group Board. The limits are set to minimise the concentration of risks and therefore mitigate financial loss through any potential counterparty failure.
The Group is exposed to the risk of default on the reinsurance arrangements in its insurance business when amounts recoverable under those arrangements become due. Credit risk in respect of reinsurance arrangements is assessed at the time of entering into a reinsurance contract. The Group’s reinsurance programme is only placed with reinsurers which meet the Group’s financial strength criteria.
The Group’s maximum exposure to credit risk for the components of the statement of financial position at 31 January 2019 and 31 January 2018 is the carrying amount except for derivative financial instruments. The Group’s maximum exposure for financial guarantees and financial derivative instruments is noted under liquidity risk. None of the financial assets were impaired at the reporting date.
Saga plc Annual Report and Accounts 2019168
Notes to the consolidated financial statements continued

19 Financial risk management objectives and policies (continued)b. Credit risk (continued)The Group’s financial assets and reinsurance assets are analysed by Moody’s rating as follows:
Ratings analysis31 January 2019
£’m AAA AA A BBB Unrated Total
Debt securities 14.8 140.3 41.2 83.9 – 280.2
Money market funds 37.1 – – – – 37.1
Deposits with financial institutions – 50.8 – 18.5 – 69.3
Derivative assets – – 32.6 0.8 – 33.4
Loan funds – – – – 6.2 6.2
51.9 191.1 73.8 103.2 6.2 426.2
Reinsurance assets – 55.5 40.9 – 0.4 96.8
Total 51.9 246.6 114.7 103.2 6.6 523.0
31 January 2018 (restated)
£’m AAA AA A < A Unrated Total
Debt securities 28.9 119.0 11.5 – – 159.4
Money market funds 153.2 – – – – 153.2
Deposits with financial institutions – 60.8 54.7 – – 115.5
Derivative assets – – 37.8 0.6 – 38.4
Loan funds – – – – 6.4 6.4
Hedge funds – – – – 7.5 7.5
Equities – – – – 31.4 31.4
Unlisted equity shares – – – – 1.7 1.7
182.1 179.8 104.0 0.6 47.0 513.5
Reinsurance assets – 54.6 44.8 – 0.8 100.2
Total 182.1 234.4 148.8 0.6 47.8 613.7
Financial Statements
Saga plcAnnual Report and Accounts 2019 169

19 Financial risk management objectives and policies (continued)c. Liquidity riskLiquidity risk is the risk that the Group, although solvent, either does not have available sufficient financial resources to enable it to meet its obligations as they fall due or can secure them only at excessive cost. The Group’s approach to managing liquidity risk is to evaluate current and expected liquidity requirements to ensure that it maintains sufficient reserves of cash or availability on its revolving credit facility. The Group manages its obligations to pay claims to policyholders as they fall due by matching the maturity of investments to the expected maturity of claims payments.
The table below analyses the maturity of the Group’s financial liabilities and insurance contract liabilities on contractual payments. The analysis of non-derivative financial liabilities is based on the remaining period at the reporting date to the contractual maturity date. The analysis of claims outstanding is based on the expected dates on which the claims will be settled.
31 January 2019
£’mOn
demandLess than
1 year1 to 2 years
2 to 5 years
Over 5 years Total
Loans and borrowings – 50.0 20.0 120.0 250.0 440.0
Interest on loans and borrowings – 12.1 11.6 28.8 4.2 56.7
Insurance contract liabilities – 85.5 158.6 131.3 186.1 461.5
Other liabilities 144.7 – – – – 144.7
Trade and other payables 207.7 – – – – 207.7
Derivative liabilities – 2.6 8.8 0.1 – 11.5
352.4 150.2 199.0 280.2 440.3 1,422.1
31 January 2018
£’mOn
demandLess than
1 year1 to 2 years
2 to 5 years
Over 5 years Total
Loans and borrowings 5.5 35.0 20.0 140.0 250.0 450.5
Interest on loans and borrowings – 12.1 11.6 31.4 12.7 67.8
Insurance contract liabilities – 183.1 95.6 143.7 128.3 550.7
Other liabilities 142.7 – – – – 142.7
Trade and other payables 185.9 – – – – 185.9
Derivative liabilities – 3.8 4.9 4.0 – 12.7
334.1 234.0 132.1 319.1 391.0 1,410.3
The amounts included above do not include the financing arrangements for the purchase of two new cruise ships as detailed in note 33.
d. Insurance riskInsurance risk arises from the inherent uncertainties as to the occurrence, cost and timing of insured events that could lead to significant individual or aggregated claims in terms of quantity or value. This could be for a number of reasons, including weather-related events, large individual claims, changes in claimant behaviour patterns such as increased levels of fraudulent activities, the use of PPOs, prospective or retrospective legislative changes, unresponsive and inaccurate pricing or reserving methodologies and the deterioration in the Group’s ability to effectively and efficiently handle claims while delivering excellent customer service.
The Group manages insurance risk within its risk management framework as set out by the Board. The key policies and processes of mitigating these risks have been implemented, which include underwriting partnership arrangements, reinsurance and excess of loss contracts, pricing policies and claims management, and administration policies.
i) Underwriting and pricing riskThe Group primarily underwrites motor insurance for private cars in the UK. The book consists of a large number of individual risks which are widely spread geographically which helps to minimise concentration risk. The Group has controls in place to restrict access to its products to only those risks that it wishes to underwrite.
The Group has management information to allow it to monitor underwriting performance on a continuous basis and the ability to make pricing and underwriting changes quickly. The Group undertakes detailed statistical analyses of underwriting experience for each rating factor and combinations of rating factors to enable it to adjust pricing for emerging trends.
Saga plc Annual Report and Accounts 2019170
Notes to the consolidated financial statements continued

19 Financial risk management objectives and policies (continued)d. Insurance risk (continued)ii) Reserving riskReserving risk is the risk that insufficient funds have been set aside to settle claims as they fall due. The Group undertakes regular internal actuarial reviews and commissions external actuarial reviews at least once a year. These reviews estimate the future liabilities in order to consider the adequacy of the provisions.
Claims which are subject to PPOs are a significant source of uncertainty in the claim’s reserves. Cash flow projections are undertaken for PPO claims to estimate the gross and net of reinsurance provisions required. PPO provisions are discounted to reflect expectations of future investment returns and cost inflation.
iii) ReinsuranceThe Group purchases reinsurance to reduce the impact of individual large losses or accumulations from a single catastrophic event. During 2016, the Group entered into a funds-withheld quota share reinsurance contract that reinsures 75% of the Group’s motor claim risks limited by a loss ratio cap of 120%, effective for three years from 1 February 2016. A new quota share reinsurance contract has been entered into that reinsures 80% of the Group’s motor claims risks, effective from 1 February 2019. Prior to this, the Group had quota share reinsurance in place for third party branded motor business for drivers aged under 50. The Group also purchases individual excess of loss protections for the motor portfolio to limit the impact of a single large claim. Similar protections are in place for all years for which the Group has underwritten motor business.
Reinsurance recoveries on individual excess of loss protections can take many years to collect, particularly if a claim is subject to a PPO. This means that the Group has exposure to reinsurance credit risk for many years. Reinsurers are therefore required to have strong credit ratings and their financial health is regularly monitored.
iv) SensitivitiesThe following table demonstrates the impact on profit and loss and equity of a 1 percentage point variation in the recorded loss ratio at 31 January 2019 and 31 January 2018. The impact of a 1% change in claims outstanding is also shown at the same dates. The impact is shown net of reinsurance and tax at the current rate.
2019 2018
Impact of 1 percentage point change in loss ratio +/– £0.8m +/– £1.0m
Impact of 1% change in claims outstanding +/– £1.5m +/– £2.2m
Impact of a 0.25 percentage point change in discount rate for PPOs +/– £1.7m +/– £1.7m
e. Operational riskEffective operational risk management requires the Group to identify, assess, manage, monitor, report and mitigate all areas of exposure. The Group operates across a range of segments and operational risk is inherent in all of the Group’s products and services, arising from the operation of assets, from external events and dependencies, and from internal processes and systems.
The Group manages its operational risk through the risk management framework agreed by the Board, and through the use of risk management tools which together ensure that operational risks are identified, managed and mitigated to the level accepted, and that contingency processes and disaster recovery plans are in place. Regular reporting is undertaken to segment boards and includes details of new and emerging risks, as well as monitoring of existing risks. Testing of contingency processes and disaster recovery plans is undertaken to ensure the effectiveness of these processes.
All of the Group’s operations are dependent on the proper functioning of its IT and communication systems; on its properties and other infrastructure assets; on the need to adequately maintain and protect customer and employee data and other information; and on the ability of the Group to attract and retain staff. Specific areas of operational risk by segment include:
i) InsuranceThe Insurance segment is required to comply with various operational regulatory requirements primarily in the UK but also within Gibraltar for its underwriting business. To the extent that significant external events could increase the incidence of claims, these would place additional strain on the claims handling function but any financial impact of such an event is considered to be an insurance risk.
Financial Statements
Saga plcAnnual Report and Accounts 2019 171

19 Financial risk management objectives and policies (continued)e. Operational risk (continued)ii) TravelThe Travel segment operates two cruise ships which are the Group’s largest trading assets. Risk to the operation of these cruise ships arises from the impact of mechanical or other malfunction, non-compliance with regulatory requirements, and from global weather and socio-economic events. The tour holidays operated by the segment are also affected by global weather and socio-economic events which impact either the Group directly or its suppliers. The Travel segment is in operation with multiple suppliers which minimises the impact of any socio-economic events affecting its suppliers.
iii) Emerging Businesses and Central CostsThe financial services product business is required to comply with various operational regulatory requirements in the UK.
The Healthcare business provides a range of domiciliary services. Risk to the operation of this service arises mainly from the availability of appropriately skilled staff to deliver the level and standard of care required, and from the oversight of the delivery of these services.
20 Interests in unconsolidated structured entitiesA structured entity is defined as an entity that has been designed so that voting or similar rights are not the dominant factor in deciding who controls the entity, such as when any voting rights relate to the administrative tasks only and the relevant activities are directed by means of contractual agreements. The Group has interests in unconsolidated structured entities in the form of investment funds comprising:
• bank loan funds• money market funds.
In the prior year, hedge funds also formed the Group’s balance in unconsolidated structured entities. All hedge funds were divested during the year.
The nature and purpose of the bank loan funds are to diversify the investment portfolio and enhance the overall yield, whilst maintaining an acceptable level of risk for the portfolio as a whole.
Bank loan funds invest in secured loans to companies rated below investment grade.
The nature and purpose of the money market funds is to provide maximum security and liquidity for the funds invested whilst also providing an adequate return. The money market funds used by the Group are all members of the Institutional Money Market Funds Association. They are thus required to maintain specified liquidity and diversification characteristics of their underlying portfolios, which comprise investment grade investments in financial institutions.
The Group invests in unconsolidated structured entities as part of its investment activities. The Group does not sponsor any of the unconsolidated structured entities.
At 31 January 2019, the Group’s total interest in unconsolidated structured entities was £43.3m analysed as follows:
Carrying value
£’m
Interest income
£’m
Fair value gains
£’m
Loan funds 6.2 0.1 (0.2)
Hedge funds – – –
Money market funds 37.1 0.4 –
These investments are typically managed under credit risk management as described in note 18. The Group’s maximum exposure to loss on the interests presented above is the carrying amount of the Group’s investments. No further loss can be made by the Group in relation to these investments. For this reason, the total assets of the entities are not considered meaningful for the purposes of understanding the related risks and so have not been presented.
Saga plc Annual Report and Accounts 2019172
Notes to the consolidated financial statements continued

21 Trade and other receivables
2019 £’m
2018 (restated)
£’m
Trade receivables 135.2 144.9
Other receivables 18.3 15.7
Prepayments 40.5 29.9
Contract cost assets 4.5 2.8
Deferred acquisition costs 14.5 17.7
Other taxes and social security costs 3.6 4.1
216.6 215.1
The ageing of trade receivables is as follows:
Past due
Total £’m
Neither past
due nor impaired
£’m< 30 days
£’m
30-60 days
£’m
61-90 days
£’m
91-120 days
£’m> 120 days
£’m
2019 135.2 117.0 4.9 2.9 2.0 1.3 7.1
2018 144.9 130.8 4.5 1.8 1.0 3.8 3.0
As at 31 January 2019, impairment provisions totalling £15.9m (2018: £10.7m) were made against trade receivables with an initial value of £155.4m (2018: £155.6m). The movements in the provision for impairment of receivables are as follows:
Credit- impaired
£’m
Not credit- impaired
£’mTotal
£’m
At 1 February 2017 0.4 8.8 9.2
Charge for the year 2.1 9.4 11.5
Utilised in the year (1.4) (8.5) (9.9)
Unused amounts reversed – (0.1) (0.1)
At 31 January 2018 1.1 9.6 10.7
Charge for the year 1.4 14.8 16.2
Utilised in the year (1.3) (9.7) (11.0)
Unused amounts reversed – – –
At 31 January 2019 1.2 14.7 15.9
See note 19 on credit risk of trade receivables, which explains how the Group manages and measures credit quality of trade receivables that are neither past due nor impaired. We expect trade and other receivables to be normally settled within 12 months.
22 Cash and cash equivalents2019
£’m2018
£’m
Cash at bank and in hand 91.9 33.4
Short-term deposits 31.0 49.8
Cash and short-term deposits 122.9 83.2
Money market funds 37.1 153.2
Bank overdraft (2.7) (9.4)
Cash and cash equivalents in the cash flow statement 157.3 227.0
Included within cash and cash equivalents are amounts held by the Group’s travel and insurance businesses which are subject to contractual or regulatory restrictions. These amounts held are not readily available to be used for other purposes within the Group and total £108.6m (2018: £214.0m).
Cash at bank earns interest at floating rates based on daily bank deposit rates. Short-term deposits are made for varying periods of between one day and three months, depending on the immediate cash requirements of the Group, and earn interest at the respective short-term deposit rates.
Financial Statements
Saga plcAnnual Report and Accounts 2019 173

23 Trade and other payables
2019 £’m
2018 (restated)
£’m
Trade and other payables 150.8 130.4
Other taxes and social security costs 13.5 13.5
Assets in the course of construction 1.7 2.8
Accruals 41.7 39.2
207.7 185.9
All trade and other payables are current in nature.
24 Retirement benefit schemesThe Group operates retirement benefit schemes for the employees of the Group consisting of defined contribution plans and a defined benefit plan.
a. Defined contribution plansThere are a number of defined contribution schemes in the Group. The total charge for the year in respect of the defined contribution schemes was £2.2m (2018: £0.9m).
The assets of these schemes are held separately from those of the Group in funds under the control of Trustees.
b. Defined benefit planThe Group operates a funded defined benefit scheme, the Saga Pension Scheme (‘Saga scheme’), which is open to new members who accrue benefits on a career average salary basis. The assets of the scheme are held separately from those of the Group in independently administered funds.
The scheme is governed by the employment laws of the UK. The level of benefits provided depends on the member’s length of service and average salary whilst a member of the scheme. The scheme requires contributions to be made to a separately administered fund which is governed by a Board of Trustees and consists of an equal number of employer and employee representatives. The Board of Trustees is responsible for the administration of the plan assets and for the definition of the investment strategy.
The long-term investment objectives of the Trustees and the Group are to limit the risk of the assets failing to meet the liabilities of the scheme over the long term, and to maximise returns consistent with an acceptable level of risk so as to control the long-term costs of the scheme. To meet those objectives, the scheme’s assets are invested in different categories of assets, with different maturities designed to match liabilities as they fall due. The investment strategy will continue to evolve over time and is expected to match the liability profile increasingly closely. The pension liability is exposed to inflation rate risks and changes in the life expectancy of members. As the plan assets include investments in quoted equities, the Group is exposed to equity market risk. The Group has provided a super security to the Trustees of the Saga scheme, which ranks before any liabilities under the senior facilities agreement (as detailed in note 27). The value of the security is capped at £32.5m.
The fair value of the assets and present value of the obligations of the Saga defined benefit scheme are as follows:
2019 £’m
2018 £’m
Fair value of scheme assets 312.4 307.3
Present value of defined benefit obligation (315.2) (314.3)
Defined benefit scheme liability (2.8) (7.0)
The present values of the defined benefit obligation, the related current service cost and any past service costs have been measured using the projected unit credit method.
Saga plc Annual Report and Accounts 2019174
Notes to the consolidated financial statements continued
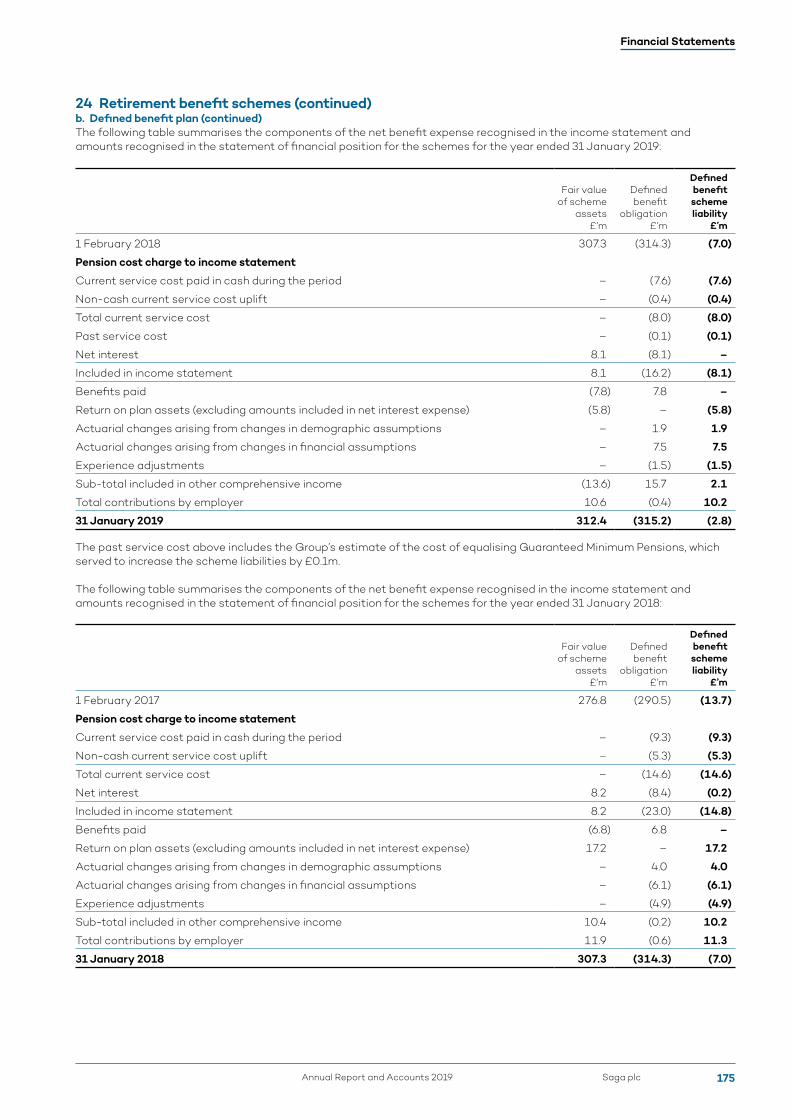
24 Retirement benefit schemes (continued)b. Defined benefit plan (continued)The following table summarises the components of the net benefit expense recognised in the income statement and amounts recognised in the statement of financial position for the schemes for the year ended 31 January 2019:
Fair value of scheme
assets £’m
Defined benefit
obligation £’m
Defined benefit scheme liability
£’m
1 February 2018 307.3 (314.3) (7.0)
Pension cost charge to income statement
Current service cost paid in cash during the period – (7.6) (7.6)
Non-cash current service cost uplift – (0.4) (0.4)
Total current service cost – (8.0) (8.0)
Past service cost – (0.1) (0.1)
Net interest 8.1 (8.1) –
Included in income statement 8.1 (16.2) (8.1)
Benefits paid (7.8) 7.8 –
Return on plan assets (excluding amounts included in net interest expense) (5.8) – (5.8)
Actuarial changes arising from changes in demographic assumptions – 1.9 1.9
Actuarial changes arising from changes in financial assumptions – 7.5 7.5
Experience adjustments – (1.5) (1.5)
Sub-total included in other comprehensive income (13.6) 15.7 2.1
Total contributions by employer 10.6 (0.4) 10.2
31 January 2019 312.4 (315.2) (2.8)
The past service cost above includes the Group’s estimate of the cost of equalising Guaranteed Minimum Pensions, which served to increase the scheme liabilities by £0.1m.
The following table summarises the components of the net benefit expense recognised in the income statement and amounts recognised in the statement of financial position for the schemes for the year ended 31 January 2018:
Fair value of scheme
assets £’m
Defined benefit
obligation £’m
Defined benefit scheme liability
£’m
1 February 2017 276.8 (290.5) (13.7)
Pension cost charge to income statement
Current service cost paid in cash during the period – (9.3) (9.3)
Non-cash current service cost uplift – (5.3) (5.3)
Total current service cost – (14.6) (14.6)
Net interest 8.2 (8.4) (0.2)
Included in income statement 8.2 (23.0) (14.8)
Benefits paid (6.8) 6.8 –
Return on plan assets (excluding amounts included in net interest expense) 17.2 – 17.2
Actuarial changes arising from changes in demographic assumptions – 4.0 4.0
Actuarial changes arising from changes in financial assumptions – (6.1) (6.1)
Experience adjustments – (4.9) (4.9)
Sub-total included in other comprehensive income 10.4 (0.2) 10.2
Total contributions by employer 11.9 (0.6) 11.3
31 January 2018 307.3 (314.3) (7.0)
Financial Statements
Saga plcAnnual Report and Accounts 2019 175

24 Retirement benefit schemes (continued)b. Defined benefit plan (continued)The major categories of assets in the Saga scheme are as follows:
2019 £’m
2018 £’m
Equities 58.1 61.4
Bonds 171.0 160.3
Property 16.8 17.9
Hedge funds 61.9 63.0
Insured annuities 3.4 3.5
Cash and other 1.2 1.2
Total 312.4 307.3
Equities and bonds are all quoted in active markets whilst property and hedge funds are not.
The principal assumptions used in determining pension benefit obligations for the Saga scheme are shown below:
2019 2018
Real rate of increase in salaries 3.00% 3.05%
Real rate of increase of pensions in payment 2.90% 2.95%
Real rate of increase of pensions in deferment 2.90% 2.90%
Discount rate – pensioner 2.60% 2.60%
Discount rate – non-pensioner 2.70% 2.60%
Inflation – pensioner 3.05% 3.10%
Inflation – non-pensioner 3.00% 3.05%
Life expectancy of a member retiring in 20 years’ time — Male 27.6 yrs 27.8 yrs
Life expectancy of a member retiring in 20 years’ time — Female 29.7 yrs 29.8 yrs
Mortality assumptions are set using standard tables based on specific experience where available and allow for future mortality improvements. The Saga scheme assumption is that a member currently aged 60 will live on average for a further 26.4 years if they are male and on average for a further 28.4 years if they are female.
A quantitative sensitivity analysis for significant assumptions as at 31 January 2019 and their impact on the net defined benefit obligation is as follows:
Assumptions Discount rate Future inflation Life expectancy Future salary
Sensitivity +/– 0.25% +/– 0.25% +/– 1 year +/– 0.5%
Increase Decrease Increase Decrease Increase Decrease
Impact £’m (15.9) 17.4 11.9 (12.5) 9.7 (9.3) 0.0
Note: a positive impact represents an increase in the net defined benefit liability.
The sensitivity analyses are based on a change in an assumption while holding all other assumptions constant. When calculating the sensitivity of the defined benefit obligation to significant actuarial assumptions, the same method has been applied as when calculating the pension liability recognised within the statement of financial position.
The expected contribution to the Saga scheme for the next year is £9.9m and average duration of the defined benefit plan obligation at the end of the reporting period is 23 years.
Formal actuarial valuations take place every three years for the scheme. The assumptions adopted for actuarial valuations are determined by the Trustees and are agreed with the Group and are normally more prudent than the assumptions adopted for IAS 19 purposes, which are best estimate. Where a funding deficit is identified, the Group and the Trustees may agree a deficit recovery plan to pay additional contributions above those needed to fund new pensions accruing in the scheme.
Saga plc Annual Report and Accounts 2019176
Notes to the consolidated financial statements continued
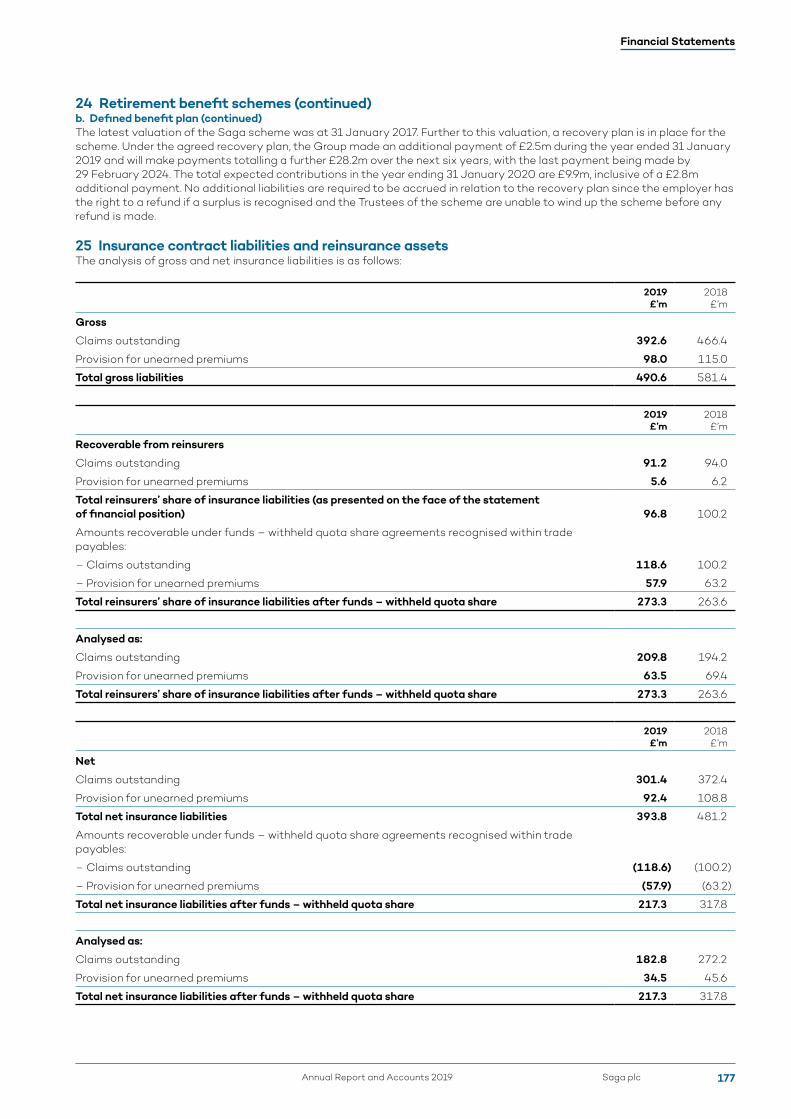
24 Retirement benefit schemes (continued)b. Defined benefit plan (continued)The latest valuation of the Saga scheme was at 31 January 2017. Further to this valuation, a recovery plan is in place for the scheme. Under the agreed recovery plan, the Group made an additional payment of £2.5m during the year ended 31 January 2019 and will make payments totalling a further £28.2m over the next six years, with the last payment being made by 29 February 2024. The total expected contributions in the year ending 31 January 2020 are £9.9m, inclusive of a £2.8m additional payment. No additional liabilities are required to be accrued in relation to the recovery plan since the employer has the right to a refund if a surplus is recognised and the Trustees of the scheme are unable to wind up the scheme before any refund is made.
25 Insurance contract liabilities and reinsurance assetsThe analysis of gross and net insurance liabilities is as follows:
2019 £’m
2018 £’m
Gross
Claims outstanding 392.6 466.4
Provision for unearned premiums 98.0 115.0
Total gross liabilities 490.6 581.4
2019 £’m
2018 £’m
Recoverable from reinsurers
Claims outstanding 91.2 94.0
Provision for unearned premiums 5.6 6.2
Total reinsurers’ share of insurance liabilities (as presented on the face of the statement of financial position) 96.8 100.2
Amounts recoverable under funds – withheld quota share agreements recognised within trade payables:
– Claims outstanding 118.6 100.2
– Provision for unearned premiums 57.9 63.2
Total reinsurers’ share of insurance liabilities after funds – withheld quota share 273.3 263.6
Analysed as:
Claims outstanding 209.8 194.2
Provision for unearned premiums 63.5 69.4
Total reinsurers’ share of insurance liabilities after funds – withheld quota share 273.3 263.6
2019 £’m
2018 £’m
Net
Claims outstanding 301.4 372.4
Provision for unearned premiums 92.4 108.8
Total net insurance liabilities 393.8 481.2
Amounts recoverable under funds – withheld quota share agreements recognised within trade payables:
– Claims outstanding (118.6) (100.2)
– Provision for unearned premiums (57.9) (63.2)
Total net insurance liabilities after funds – withheld quota share 217.3 317.8
Analysed as:
Claims outstanding 182.8 272.2
Provision for unearned premiums 34.5 45.6
Total net insurance liabilities after funds – withheld quota share 217.3 317.8
Financial Statements
Saga plcAnnual Report and Accounts 2019 177
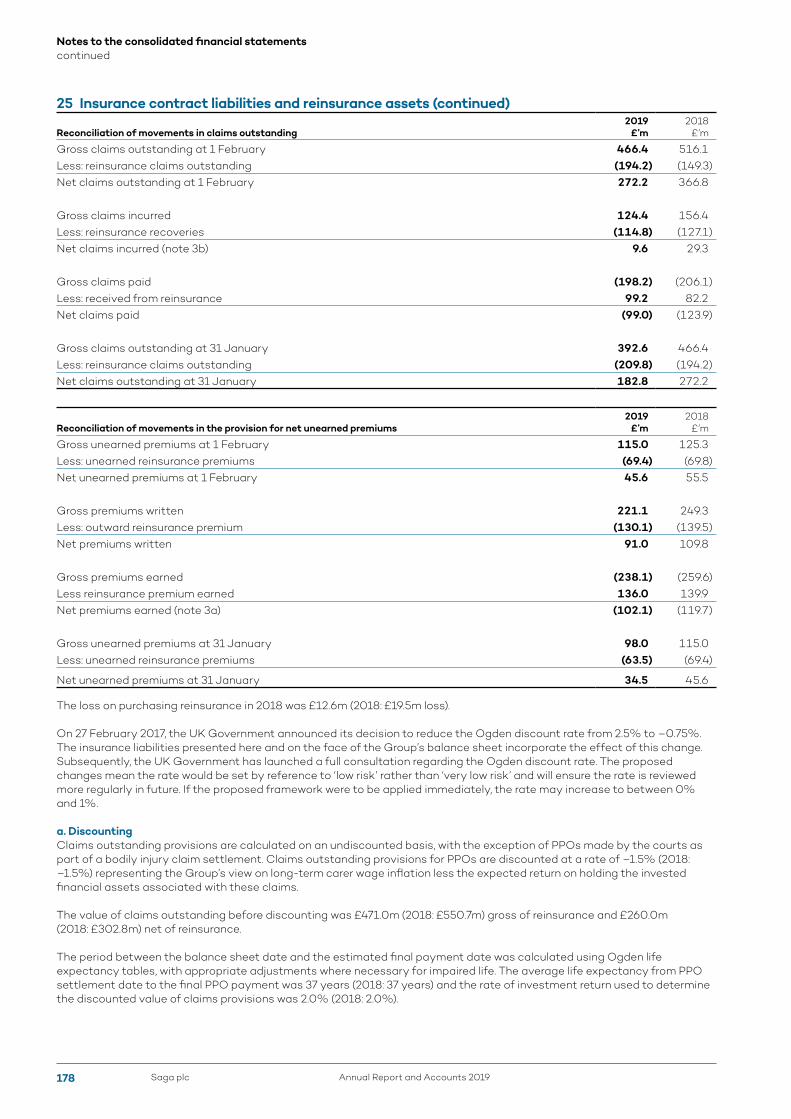
25 Insurance contract liabilities and reinsurance assets (continued)
Reconciliation of movements in claims outstanding2019
£’m2018
£’m
Gross claims outstanding at 1 February 466.4 516.1Less: reinsurance claims outstanding (194.2) (149.3)Net claims outstanding at 1 February 272.2 366.8
Gross claims incurred 124.4 156.4Less: reinsurance recoveries (114.8) (127.1)Net claims incurred (note 3b) 9.6 29.3
Gross claims paid (198.2) (206.1)Less: received from reinsurance 99.2 82.2Net claims paid (99.0) (123.9)
Gross claims outstanding at 31 January 392.6 466.4Less: reinsurance claims outstanding (209.8) (194.2)Net claims outstanding at 31 January 182.8 272.2
Reconciliation of movements in the provision for net unearned premiums2019
£’m2018
£’m
Gross unearned premiums at 1 February 115.0 125.3Less: unearned reinsurance premiums (69.4) (69.8)Net unearned premiums at 1 February 45.6 55.5
Gross premiums written 221.1 249.3Less: outward reinsurance premium (130.1) (139.5)Net premiums written 91.0 109.8
Gross premiums earned (238.1) (259.6)Less reinsurance premium earned 136.0 139.9Net premiums earned (note 3a) (102.1) (119.7)
Gross unearned premiums at 31 January 98.0 115.0Less: unearned reinsurance premiums (63.5) (69.4)
Net unearned premiums at 31 January 34.5 45.6
The loss on purchasing reinsurance in 2018 was £12.6m (2018: £19.5m loss).
On 27 February 2017, the UK Government announced its decision to reduce the Ogden discount rate from 2.5% to –0.75%. The insurance liabilities presented here and on the face of the Group’s balance sheet incorporate the effect of this change. Subsequently, the UK Government has launched a full consultation regarding the Ogden discount rate. The proposed changes mean the rate would be set by reference to ‘low risk’ rather than ‘very low risk’ and will ensure the rate is reviewed more regularly in future. If the proposed framework were to be applied immediately, the rate may increase to between 0% and 1%.
a. DiscountingClaims outstanding provisions are calculated on an undiscounted basis, with the exception of PPOs made by the courts as part of a bodily injury claim settlement. Claims outstanding provisions for PPOs are discounted at a rate of –1.5% (2018: –1.5%) representing the Group’s view on long-term carer wage inflation less the expected return on holding the invested financial assets associated with these claims.
The value of claims outstanding before discounting was £471.0m (2018: £550.7m) gross of reinsurance and £260.0m (2018: £302.8m) net of reinsurance.
The period between the balance sheet date and the estimated final payment date was calculated using Ogden life expectancy tables, with appropriate adjustments where necessary for impaired life. The average life expectancy from PPO settlement date to the final PPO payment was 37 years (2018: 37 years) and the rate of investment return used to determine the discounted value of claims provisions was 2.0% (2018: 2.0%).
Saga plc Annual Report and Accounts 2019178
Notes to the consolidated financial statements continued

25 Insurance contract liabilities and reinsurance assets (continued)b. Analysis of claims incurred: claims development tablesThe following tables detail the Group’s initial estimate of ultimate gross and net claims incurred over the past 10 years and the re-estimation at subsequent financial period ends.
The following table analyses the gross incurred claims (before deducting reinsurance recoveries) on an accident year basis:
Financial year ended 31 January
Analysis of claims incurred
2010 £’m
2011 £’m
2012 £’m
2013 £’m
2014 £’m
2015 £’m
2016 £’m
2017 £’m
2018 £’m
2019 £’m
Total £’m
Claims paid £’m
Gross claims
outstanding £’m
Accident year
2010 and earlier 277.2 (5.4) (14.5) (14.0) (3.9) (10.2) (11.5) (9.6) (3.2) (4.8) 43.4
2011 307.0 (0.7) (7.6) (4.6) (18.8) (9.0) (1.3) (4.7) (4.0) 256.3 (253.4) 2.9
2012 330.3 (25.6) (33.8) (7.3) (19.5) (10.5) (9.4) (2.6) 221.6 (219.3) 2.3
2013 321.2 (14.2) (45.2) (22.1) (13.4) (5.6) (5.9) 214.8 (203.0) 11.8
2014 281.9 (18.9) (25.7) (7.6) (11.1) (10.6) 208.0 (179.2) 28.8
2015 271.3 (6.0) (6.2) (8.2) (15.3) 235.6 (211.4) 24.2
2016 280.4 4.1 (19.3) (21.7) 243.5 (217.0) 26.5
2017 197.2 4.7 (13.1) 188.8 (139.4) 49.4
2018 194.9 194.9 (110.9) 84.0
2019 189.8 189.8 (79.7) 110.1
277.2 301.6 315.1 274.0 225.4 170.9 186.6 152.7 138.1 111.8 383.4
Claims handling costs 9.0 10.1 15.6 17.4 17.2 18.0 21.5 20.6 20.9 17.9 9.2
286.2 311.7 330.7 291.4 242.6 188.9 208.1 173.3 159.0 129.7 392.6
The development of the associated loss ratios on the same basis is as follows:
Financial year ended 31 January
2010 2011 2012 2013 2014 2015 2016 2017 2018 2019
Accident year
2010 79% 79% 77% 76% 74% 73% 73% 72% 71% 71%
2011 80% 80% 78% 77% 72% 70% 69% 68% 67%
2012 77% 71% 63% 62% 57% 55% 52% 52%
2013 76% 72% 62% 56% 53% 52% 51%
2014 75% 70% 63% 61% 58% 55%
2015 81% 80% 78% 75% 71%
2016 87% 88% 82% 75%
2017 67% 69% 65%
2018 75% 75%
2019 80%
Financial Statements
Saga plcAnnual Report and Accounts 2019 179

25 Insurance contract liabilities and reinsurance assets (continued)b. Analysis of claims incurred: claims development tables (continued)The following table analyses the net incurred claims (after deducting reinsurance recoveries) on an accident year basis:
Financial year ended 31 January
Analysis of claims incurred
2010 £’m
2011 £’m
2012 £’m
2013 £’m
2014 £’m
2015 £’m
2016 £’m
2017 £’m
2018 £’m
2019 £’m
Total £’m
Claims paid £’m
Net claims outstanding
£’m
Accident year
2010 and earlier 196.6 (13.5) (15.0) (6.7) (6.3) (5.1) (9.0) (3.3) (4.8) 18.0
2011 266.0 (2.8) (5.2) (4.6) (13.3) (7.2) (7.4) (5.6) (4.0) 215.9 (206.9) 9.0
2012 302.3 (25.6) (31.1) (0.6) (17.3) (11.9) (6.4) (2.6) 206.8 (203.0) 3.8
2013 315.4 (14.6) (22.9) (19.8) (14.6) (10.2) (5.9) 227.4 (222.6) 4.8
2014 276.8 (14.7) (23.4) (11.0) (9.8) (10.6) 207.3 (188.8) 18.5
2015 219.1 5.3 (9.2) (11.1) (15.3) 188.8 (164.4) 24.4
2016 220.9 3.2 (15.1) (21.7) 187.3 (159.7) 27.6
2017 94.0 1.5 (6.2) 89.3 (76.2) 13.1
2018 78.5 78.5 (60.3) 18.2
2019 71.8 71.8 (35.6) 36.2
196.6 266.0 286.0 269.6 219.8 161.3 153.4 34.1 18.5 0.7 173.6
Claims handling costs 9.0 10.1 15.6 17.4 17.2 18.0 21.5 11.5 10.5 8.8 9.2
205.6 276.1 301.6 287.0 237.0 179.3 174.9 45.6 29.0 9.5 182.8
The development of the associated loss ratios on the same basis is as follows:
Financial year ended 31 January
2010 2011 2012 2013 2014 2015 2016 2017 2018 2019
Accident year
2010 73% 73% 72% 70% 68% 67% 66% 64% 63% 63%
2011 78% 78% 76% 75% 71% 69% 67% 65% 64%
2012 76% 70% 62% 62% 57% 54% 53% 52%
2013 75% 72% 66% 62% 58% 56% 54%
2014 75% 71% 65% 62% 59% 56%
2015 67% 69% 66% 63% 58%
2016 70% 71% 66% 59%
2017 56% 56% 53%
2018 66% 66%
2019 70%
Favourable claims development over the year has resulted in a £71.1m (2018: £60.0m) reduction in the net claims incurred in respect of prior years.
Saga plc Annual Report and Accounts 2019180
Notes to the consolidated financial statements continued

26 Contract liabilities
2019 £’m
2018(restated)
£’m
Deferred revenue 144.7 142.7
144.7 142.7
Current 130.5 127.4
Non-current 14.2 15.3
144.7 142.7
Deferred revenue comprise amounts received within the Travel segment for holidays and cruises with departure dates after the reporting date, and insurance premiums and sales revenues received in the Insurance segment in respect of insurance policies which commence after the reporting date and represents the performance obligations not yet satisfied as at 31 January 2019.
27 Loans and borrowings2019
£’m2018
£’m
Bond 250.0 250.0
Bank loans 160.0 180.0
Revolving credit facility 30.0 15.0
Accrued interest payable 2.2 2.2
442.2 447.2
Less: deferred issue costs (3.0) (4.2)
439.2 443.0
The Group’s bank facilities consist of a £250.0m seven-year senior unsecured bond, a £200.0m five-year term loan facility and a £100.0m five-year revolving credit facility with an option to extend. In March 2019, the Group’s banks agreed to extend the term on the revolving credit facility by one year with expiry in May 2023. The bond is listed on the Irish Stock Exchange.
At 31 January 2019, the Group had drawn £30.0m of its £100.0m revolving credit facility and since the refinancing £40.0m of the term loan has been repaid.
Interest on the bond is incurred at an annual interest rate of 3.375%. Interest on the term loan and revolving credit facility is incurred at a variable rate of LIBOR plus, a bank margin which is linked to the Group’s leverage ratio.
During the period, the Group charged £11.5m (2018: £13.5m) to the income statement in respect of fees and interest associated with the bonds, term loan and revolving credit facility. In addition, finance costs recognised in the income statement includes £0.2m (2018: £0.7m) relating to interest on finance lease liabilities, net finance expense on pension schemes and other interest costs, £nil (2018: £0.6m) of net fair value losses on derivatives and £nil (2018: £4.3m) of accelerated amortisation of debt issue costs in relation to previous debt held.
Financial Statements
Saga plcAnnual Report and Accounts 2019 181
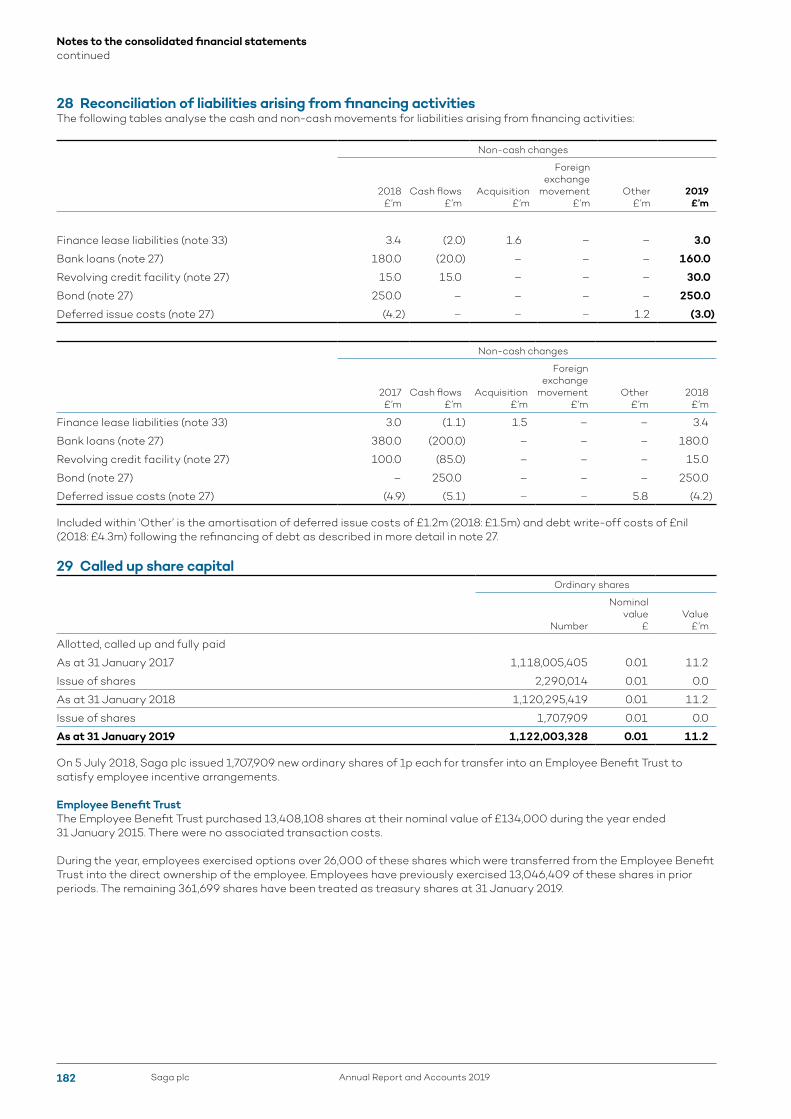
28 Reconciliation of liabilities arising from financing activitiesThe following tables analyse the cash and non-cash movements for liabilities arising from financing activities:
Non-cash changes
2018 £’m
Cash flows £’m
Acquisition £’m
Foreign exchange
movement £’m
Other £’m
2019 £’m
Finance lease liabilities (note 33) 3.4 (2.0) 1.6 – – 3.0
Bank loans (note 27) 180.0 (20.0) – – – 160.0
Revolving credit facility (note 27) 15.0 15.0 – – – 30.0
Bond (note 27) 250.0 – – – – 250.0
Deferred issue costs (note 27) (4.2) – – – 1.2 (3.0)
Non-cash changes
2017 £’m
Cash flows £’m
Acquisition £’m
Foreign exchange
movement £’m
Other £’m
2018 £’m
Finance lease liabilities (note 33) 3.0 (1.1) 1.5 – – 3.4
Bank loans (note 27) 380.0 (200.0) – – – 180.0
Revolving credit facility (note 27) 100.0 (85.0) – – – 15.0
Bond (note 27) – 250.0 – – – 250.0
Deferred issue costs (note 27) (4.9) (5.1) – – 5.8 (4.2)
Included within ‘Other’ is the amortisation of deferred issue costs of £1.2m (2018: £1.5m) and debt write-off costs of £nil (2018: £4.3m) following the refinancing of debt as described in more detail in note 27.
29 Called up share capitalOrdinary shares
Number
Nominal value
£Value
£’m
Allotted, called up and fully paid
As at 31 January 2017 1,118,005,405 0.01 11.2
Issue of shares 2,290,014 0.01 0.0
As at 31 January 2018 1,120,295,419 0.01 11.2
Issue of shares 1,707,909 0.01 0.0
As at 31 January 2019 1,122,003,328 0.01 11.2
On 5 July 2018, Saga plc issued 1,707,909 new ordinary shares of 1p each for transfer into an Employee Benefit Trust to satisfy employee incentive arrangements.
Employee Benefit TrustThe Employee Benefit Trust purchased 13,408,108 shares at their nominal value of £134,000 during the year ended 31 January 2015. There were no associated transaction costs.
During the year, employees exercised options over 26,000 of these shares which were transferred from the Employee Benefit Trust into the direct ownership of the employee. Employees have previously exercised 13,046,409 of these shares in prior periods. The remaining 361,699 shares have been treated as treasury shares at 31 January 2019.
Saga plc Annual Report and Accounts 2019182
Notes to the consolidated financial statements continued

30 ReservesShare-based payment reserveThe share-based payment reserve is used to recognise the value of equity-settled share-based payments provided to employees, including key management personnel, as part of their remuneration. More detail is provided in note 32.
Fair value reserveThe fair value reserve comprises the unrealised gains or losses of fair value financial assets pending subsequent recognition in profit or loss once the investment is derecognised.
Hedging reserveThe hedging reserve comprises the effective portion of the cumulative net change in the fair value of hedging instruments used in cash flow hedges pending subsequent recognition in profit or loss as the hedged cash flows or items affect profit or loss.
31 Capital managementThe Group’s objectives when managing capital are to safeguard the Group’s ability to continue as a going concern in order to provide returns for shareholders and benefits for other stakeholders and to maintain an optimal capital structure to reduce the cost of capital.
For the purposes of the Group’s capital management, capital comprises total equity of £964.3m (2018 restated: £1,225.5m) as shown on the consolidated statement of financial position. The Group operates in a number of regulated markets and includes subsidiaries which are required to comply with specific requirements in respect of capital or other resources.
The Group’s financial services businesses are regulated primarily by the Financial Services Commission (FSC) in Gibraltar and by the Financial Conduct Authority (FCA) in the UK; and the capital requirements of its travel businesses are regulated by the Civil Aviation Authority (CAA) in the UK. It is the Group’s policy to comply with the requirements of these regulators in respect of capital adequacy or other similar tests at all times.
No changes were made to the objectives, policies or processes for managing capital during the years ended 31 January 2019 or 31 January 2018.
The Group’s regulated underwriting business is based in Gibraltar and regulated by the FSC. The underwriting business is required to ensure that it has a sufficient level of capitalisation in accordance with Solvency II.
(The amounts set out in the following three paragraphs are estimated and unaudited)
The Group monitored its ability to comply with the requirements of Solvency II throughout the year to 31 January 2019, having previously received approval from the FSC for the Undertaking of Specific Parameters when applying the standard formula to measure capital requirements for this business under Solvency II rules. Under Solvency II, AICL remained well-capitalised, and at 31 January 2019 available capital was £89.7m against a Solvency Capital Requirement of £60.5m, giving 148% coverage. As at 31 January 2018, available capital was £137.0m against a Solvency Capital Requirement of £79.7m, giving 171% coverage.
The Group’s regulated insurance distribution business is based in the UK and regulated by the FCA. Due to the nature of the business, the capital requirements are significantly less than the underwriting business but the Group is required to comply with the Adequate Resources requirements of Threshold Condition 4 of the FCA Handbook. The Group undertakes a rigorous assessment against the requirements of this Condition on an annual basis and, as a consequence of this, calculates and holds an appropriate amount of capital in respect of the insurance distribution business. The Minimum Regulatory Capital requirement of these businesses at 31 January 2019 was £5.5m (2018: £6.4m).
The regulated travel businesses are required to comply with two main tests based on liquidity and leverage and were measured against agreed covenants on the last day of each quarter in respect of these tests. The Group monitors its compliance with these tests on a monthly basis including forward-looking compliance using budgets and forecasts and will be measured against these covenants on a monthly basis going forward. For the year ended 31 January 2019 the CAA has given the travel businesses special dispensation to comply with decreased covenants due to the investment in the new ships. At 31 January 2019 and 31 January 2018, the travel businesses had good coverage against both covenants.
Financial Statements
Saga plcAnnual Report and Accounts 2019 183
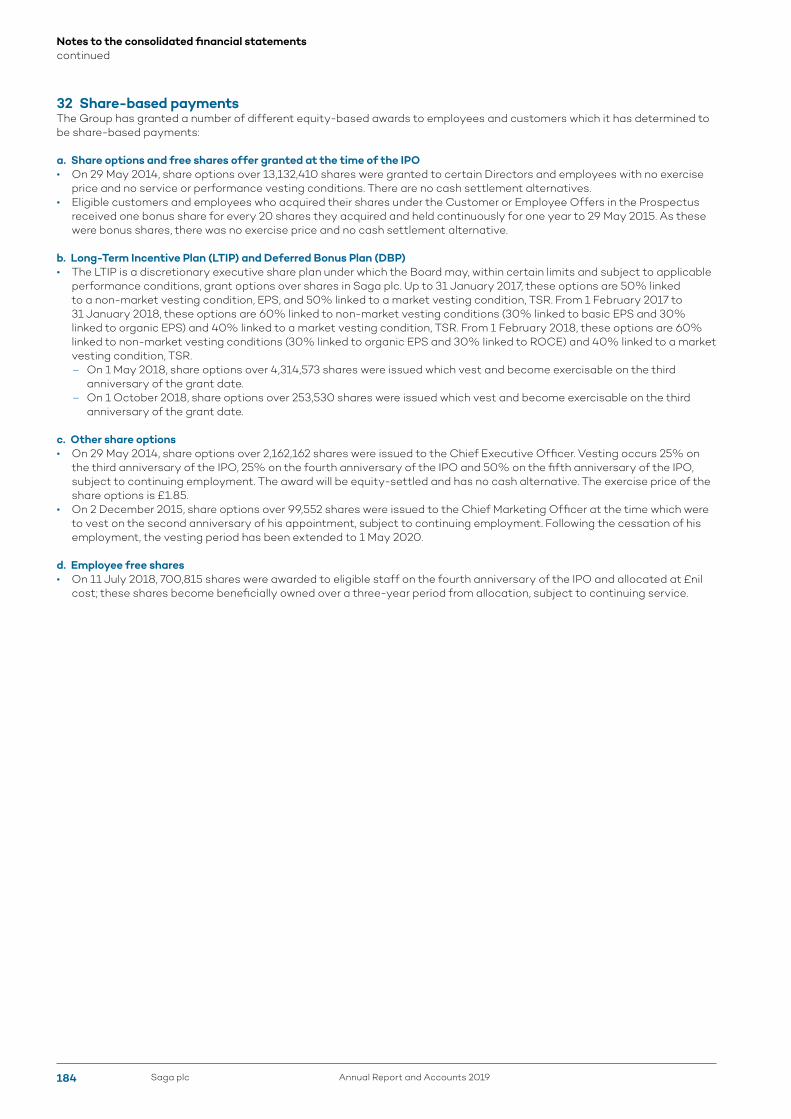
32 Share-based paymentsThe Group has granted a number of different equity-based awards to employees and customers which it has determined to be share-based payments:
a. Share options and free shares offer granted at the time of the IPO• On 29 May 2014, share options over 13,132,410 shares were granted to certain Directors and employees with no exercise
price and no service or performance vesting conditions. There are no cash settlement alternatives.• Eligible customers and employees who acquired their shares under the Customer or Employee Offers in the Prospectus
received one bonus share for every 20 shares they acquired and held continuously for one year to 29 May 2015. As these were bonus shares, there was no exercise price and no cash settlement alternative.
b. Long-Term Incentive Plan (LTIP) and Deferred Bonus Plan (DBP)• The LTIP is a discretionary executive share plan under which the Board may, within certain limits and subject to applicable
performance conditions, grant options over shares in Saga plc. Up to 31 January 2017, these options are 50% linked to a non-market vesting condition, EPS, and 50% linked to a market vesting condition, TSR. From 1 February 2017 to 31 January 2018, these options are 60% linked to non-market vesting conditions (30% linked to basic EPS and 30% linked to organic EPS) and 40% linked to a market vesting condition, TSR. From 1 February 2018, these options are 60% linked to non-market vesting conditions (30% linked to organic EPS and 30% linked to ROCE) and 40% linked to a market vesting condition, TSR.
– On 1 May 2018, share options over 4,314,573 shares were issued which vest and become exercisable on the third anniversary of the grant date.
– On 1 October 2018, share options over 253,530 shares were issued which vest and become exercisable on the third anniversary of the grant date.
c. Other share options• On 29 May 2014, share options over 2,162,162 shares were issued to the Chief Executive Officer. Vesting occurs 25% on
the third anniversary of the IPO, 25% on the fourth anniversary of the IPO and 50% on the fifth anniversary of the IPO, subject to continuing employment. The award will be equity-settled and has no cash alternative. The exercise price of the share options is £1.85.
• On 2 December 2015, share options over 99,552 shares were issued to the Chief Marketing Officer at the time which were to vest on the second anniversary of his appointment, subject to continuing employment. Following the cessation of his employment, the vesting period has been extended to 1 May 2020.
d. Employee free shares• On 11 July 2018, 700,815 shares were awarded to eligible staff on the fourth anniversary of the IPO and allocated at £nil
cost; these shares become beneficially owned over a three-year period from allocation, subject to continuing service.
Saga plc Annual Report and Accounts 2019184
Notes to the consolidated financial statements continued

32 Share-based payments (continued)The table below summarises the movements in the number of share options outstanding for the Group and their weighted average exercise price:
IPO options LTIP DBP
Other options
Employee free shares Total
At 1 February 2018 387,699 10,588,790 866,729 2,261,714 1,169,612 15,274,544
Granted – 4,568,103 – – 700,815 5,268,918
Forfeited – (1,272,830) – – (136,269) (1,409,099)
Exercised (26,000) (861,326) (150,882) – (86,015) (1,124,223)
At 31 January 2019 361,699 13,022,737 715,847 2,261,714 1,648,143 18,010,140
Exercise price £nil £nil £nil £1.77 £nil £0.21
Exercisable at 31 January 2019 361,699 3,530,882 179,142 1,081,081 288,307 5,441,111
Average remaining contractual life 0.0 years 1.0 years 0.7 years 0.2 years 1.4 years 0.9 years
Average fair value at grant £1.85 £1.83 £2.09 £1.86 £1.75 £1.85
The following information is relevant in the determination of the fair value of options granted during the year under the equity- and cash-settled share-based remuneration schemes operated by the Group.
LTIP – EPS tranche
LTIP – TSR tranche
Employee Free
Shares
Model usedBlack-
ScholesMonte-
CarloBlack-
Scholes
Dividend yield (%) n/a n/a n/a
Risk-free interest rate (%) 0.82% 0.82% n/a
Expected life of share option 3 years 3 years 3 years
Weighted average share price (£) £1.38 £1.38 £1.26
Share price volatility 25.2% 31.4% n/a
As only limited historical data for the Group’s share price is available, the Group has estimated the Company’s share price volatility as an average of the volatilities of its TSR comparator group over a historical period commensurate with the expected life of the award immediately prior to the date of the grant.
For future valuations, at a date when sufficient Saga share price data becomes available, the Group intends to estimate the Company volatility directly from this data.
The total amount charged to the income statement in the year ended 31 January 2019 is £3.8m (2018: £3.8m). This has been charged to administrative and selling expenses £3.6m (2018: £3.5m) and non-trading items £0.2m (2018: £0.3m) (note 4b).
The Group did not enter into any share-based payment transactions with parties other than employees during the current period.
Financial Statements
Saga plcAnnual Report and Accounts 2019 185

33 Commitments and contingenciesa. Operating lease commitments – Group as lesseeThe Group has entered into commercial leases on certain land and buildings and plant and machinery. There are no restrictions placed upon the Group by entering into these leases.
Future minimum rentals payable under non-cancellable operating leases as at 31 January are as follows:
Land and buildings Plant and machinery
2019 £’m
2018 £’m
2019 £’m
2018 £’m
Within one year 1.2 1.2 24.6 20.7
Between one and five years 3.3 3.5 14.6 4.9
After five years 7.0 6.7 0.9 1.0
11.5 11.4 40.1 26.6
b. Finance lease and hire purchase commitmentsThe Group has finance leases and hire purchase contracts for various items of plant and machinery. These leases have terms of renewal and no purchase options. Renewals are at the option of the specific entity that holds the lease. Future minimum lease payments under finance leases and hire purchase contracts together with the present values of the net minimum lease payments are as follows:
2019 £’m
2018 £’m
Within one year 2.5 1.5
Between one and five years 0.9 2.3
Total minimum lease payments 3.4 3.8
Less amounts representing finance charge (0.4) (0.4)
Present value of minimum lease payments 3.0 3.4
c. CommitmentsOn 21 December 2015, the Group contracted with Meyer Werft GmbH & Co. KG to purchase Spirit of Discovery for delivery in July 2019, with an option to purchase a second similar cruise ship for delivery in 2021. On 24 April 2017, the Group signed an agreement with the shipyard to bring forward the delivery date by one month to June 2019.
On 20 September 2017, the Saga plc Board approved the purchase of the second cruise ship, Spirit of Adventure, with an earlier delivery date of August 2020, and the Group exercised the option in December 2017.
Four stage payments for Spirit of Discovery were made between February 2016 and July 2018. The remaining element of the contract price is due on delivery of the ship, and the Group entered into appropriate financing for this on 21 December 2015.
The first two stage payments for Spirit of Adventure were made between December 2017 and January 2019. Two similar stage payments will be made during the construction period (18 months and 12 months prior to delivery), funded via cash resources of the Group. The remaining element of the contract price is due on delivery of the ship, and the Group entered into appropriate financing for this on 20 September 2017.
As at 31 January 2019, the capital amount contracted but not provided for in the financial statements in respect of the ships amounted to £543.5m (2018: £583.8m).
The financing for Spirit of Discovery represents a 12 year fixed rate sterling loan, backed by an export credit guarantee. The loan value of approximately £245m will be repaid in 24 broadly equal instalments, with the first payment six months after delivery. On the date the finance was entered into, the Group purchased Euro currency forwards totalling £273.2m to lock in the cost of the ship.
The financing for Spirit of Adventure represents a 12 year fixed rate sterling loan, backed by an export credit guarantee. The loan value of approximately £295m will be repaid in 24 broadly equal instalments, with the first payment due six months after delivery. On the date the finance was entered into, the Group purchased Euro currency forwards totalling £211.5m, which represents 72% of the cost of the ship.
Both hedges have been designated as cash flow hedges and remain outstanding as at 31 January 2019 (note 18d).
Saga plc Annual Report and Accounts 2019186
Notes to the consolidated financial statements continued
33 Commitments and contingencies (continued)d. Contingent liabilitiesThe Association of British Travel Agents regulates the Group’s UK tour operating business and requires the Group to put in place bonds to provide customer protection.
On 4 May 2017, the Group was notified about legal proceedings against Nestor Primecare Services Limited by the Crown Prosecution Service in relation to a breach of the Health and Safety at Work etc. Act 1974. Under an indemnity included in the sales agreement following the disposal of Nestor Primecare Services Limited, certain entities in the Group may be liable for any penalties incurred.
It is too early in the litigation process to evaluate Saga’s position on liability and quantum. As such, no amounts have been provided for this in the financial statements.
During the prior year, a former subsidiary of the Group, Saga Property (St Lucia) Limited, was served with a tax assessment from the St Lucian tax authorities to the sum of £2.0m. Due to certain indemnities granted to the purchaser on sale of the subsidiary, Saga plc is responsible for any liabilities arising prior to sale. A tax-free period was agreed with the Ministry of Tourism in St Lucia for a 10 year period commencing from 2007 and therefore the Group does not believe that the tax liability is payable.
34 Post-balance sheet eventsOn 6 February 2019, the Group signed a memorandum of agreement to sell one of its cruise ships, the Saga Pearl II, for €6.0m with an expected date of delivery of 15 April 2019.
Financial Statements
Saga plcAnnual Report and Accounts 2019 187

35 SubsidiariesThe entities listed below are subsidiaries of the Company or Group. All of the undertakings are wholly owned and included within the consolidated financial statements. The registered office address for all entities registered in England is Enbrook Park, Sandgate, Folkestone, Kent CT20 3SE. The registered office address of Acromas Insurance Company Limited is 57/63 Line Wall Road, Gibraltar. The registered office address of Saga Cruises GmbH is Industriegebiet Süd, 26871, Papenburg, Niedersachsen, Germany.
Name Country of registration Nature of business
Saga Personal Finance Limited England Delivery of regulated investment productsST&H Limited England Tour operatingAcromas Insurance Company Limited Gibraltar Insurance underwritingSaga Cruises Limited England CruisingST&H Transport Limited England Tour operatingCHMC Limited England Motor accident managementPEC Services Limited England Repairer of automotive vehiclesSaga Retirement Villages Limited England Marketing of retirement villagesDestinology Limited England Tour operatingEnbrook Cruises Limited England CruisingMetroMail Limited England Mailing houseSaga Cruises IV Limited England CruisingSaga Cruises V Limited England CruisingSaga Cruises VI Limited England CruisingSaga Cruises GmbH Germany CruisingSaga Crewing Services Limited England CruisingSaga Healthcare Limited England Provision of domiciliary careSaga Mid Co Limited England Debt service providerSaga Publishing Limited England PublishingSaga Services Limited England Insurance distributionTitan Transport Limited England Tour operatingSaga Membership Limited England Customer loyalty schemeDriveline Group Limited England Holding companyCHMC Holdings Limited England Holding companySaga 200 Limited England Holding companySaga 300 Limited England Holding companySaga 400 Limited England Holding companySaga Group Limited England Holding companySaga Holdings Limited England Holding companySaga Leisure Limited England Holding companySaga Properties Limited England Holding companyST&H Group Limited England Holding companySaga Cruises I Limited England Dormant companyConfident Services Limited England Dormant companyCountry Cousins (Horsham) Limited England Dormant companyDriveline Europe Limited England Dormant companyDriveline Travel Limited England Dormant companyPatricia White’s Personal Home Care Limited England Dormant companySaga 500 Limited England Dormant companySaga Coach Holidays Limited England Dormant companySaga Cruises BDF Limited England Dormant companySaga Cruises II Limited England Dormant companySaga Cruises III Limited England Dormant companySaga Flights.com Limited England Dormant companySaga Holidays Limited England Dormant companySaga Independent Living Limited England Dormant companySaga Funding Limited England Dormant companySaga Communications Limited England Dormant companySaga Radio (North West) Limited England Dormant companySaga Shipping Company Limited England Dormant company
Saga plc Annual Report and Accounts 2019188
Notes to the consolidated financial statements continued

35 Subsidiaries (continued)Name Country of registration Nature of business
Spirit Of Adventure Limited England Dormant companyTitan Aviation Limited England Dormant companyTitan Travel Holdings Limited England Dormant companyTitan Travel Limited England Dormant company
36 Investment in joint venturesDuring the current and prior year, the Group’s interests in joint ventures were:
Saga Investment Services LimitedThe Group holds a 50% interest in Saga Investment Services Limited, a company registered in England and Wales. This is accounted for using the equity method in the consolidated financial statements. The joint venture contributed a share of a loss of £nil after tax (2018: £2.2m loss after tax). During the prior year, the carrying value of the joint venture was impaired to £nil following the decision to replace the legal structure with a new, more cost-efficient structure.
The registered office address for Saga Investment Services Limited is Enbrook Park, Sandgate, Folkestone, Kent CT20 3SE.
37 Transition to IFRS 15 and IFRS 9As
reported 31 Jan 18 IFRS 9/15 adjustment
As restated
31 Jan 18
£’mInsurance
£’mTravel
£’mEB&CC
£’m £’m
Revenue 860.1 0.5 (0.1) (0.3) 860.2
Cost of sales (412.8) (0.3) 0.3 – (412.8)
Gross profit 447.3 0.2 0.2 (0.3) 447.4
Administrative and selling expenses (254.5) 0.2 – – (254.3)
Investment income 7.4 0.2 – – 7.6
Finance costs (20.8) – 1.7 – (19.1)
Finance income 1.5 – – – 1.5
Share of loss of joint ventures (2.2) – – – (2.2)
Profit before tax from continuing operations 178.7 0.6 1.9 (0.3) 180.9
Tax expense (33.6) (0.1) (0.3) 0.1 (33.9)
Profit for the period from continuing operations 145.1 0.5 1.6 (0.2) 147.0
Loss after tax for the year from discontinued operations (7.6) – – – (7.6)
Profit for the year 137.5 0.5 1.6 (0.2) 139.4
Attributable to:
Equity holders of the parent 137.5 0.5 1.6 (0.2) 139.4
Earnings Per Share:
Basic 12.3p 12.5p
Diluted 12.2p 12.4p
Earnings Per Share for continuing operations:
Basic 13.0p 13.1p
Diluted 12.9p 13.1p
Financial Statements
Saga plcAnnual Report and Accounts 2019 189

37 Transition to IFRS 15 and IFRS 9 (continued)As
reported 31 Jan 18 IFRS 9/15 adjustment
As restated
31 Jan 18
£’mInsurance
£’mTravel
£’mEB&CC
£’m £’m
Profit for the year 137.5 0.5 1.6 (0.2) 139.4
Other comprehensive income
Other comprehensive income to be reclassified to the income statement in subsequent periods
Net losses on hedging instruments during the year (3.6) – (1.7) – (5.3)
Recycling of previous gains to income statement on matured hedges (18.8) – – – (18.8)
Total net loss on cash flow hedges (22.4) – (1.7) – (24.1)
Associated tax effect 3.8 – 0.3 – 4.1
Net losses on fair value financial assets (0.3) – – – (0.3)
Recycling of previous gains to income statement on sale of fair value financial assets during the year (4.4) – – – (4.4)
Total net loss on fair value financial assets (4.7) – – – (4.7)
Associated tax effect 0.8 – – – 0.8
Total other comprehensive losses with recycling to income statement (22.5) – (1.4) – (23.9)
Other comprehensive income not to be reclassified to the income statement in subsequent periods
Re-measurement gains on defined benefit plans 10.2 – – – 10.2
Tax effect (1.7) – – – (1.7)
Total other comprehensive gains without recycling to income statement 8.5 – – – 8.5
Total other comprehensive losses (14.0) – (1.4) – (15.4)
Total comprehensive income for the year 123.5 0.5 0.2 (0.2) 124.0
Saga plc Annual Report and Accounts 2019190
Notes to the consolidated financial statements continued

37 Transition to IFRS 15 and IFRS 9 (continued)
Assets
As reported 31 Jan 17
£’m
IFRS 9/15 adjustment
£’m
As restated 31 Jan 17
£’m
As reported
31 Jan 18 £’m
IFRS 9/15 adjustment
£’m
As restated
31 Jan 18 £’m
Goodwill 1,485.0 – 1,485.0 1,485.0 – 1,485.0
Intangible assets 53.8 – 53.8 61.2 – 61.2
Investment in joint ventures 1.4 – 1.4 – – –
Property, plant and equipment 131.5 – 131.5 163.4 – 163.4
Financial assets 600.3 (0.9) 599.4 514.5 (1.0) 513.5
Deferred tax assets 16.3 – 16.3 13.7 – 13.7
Reinsurance assets 97.5 – 97.5 100.2 – 100.2
Inventories 5.6 – 5.6 5.8 – 5.8
Trade and other receivables 198.7 5.3 204.0 210.0 5.1 215.1
Assets held for sale – – – 6.8 – 6.8
Cash and short-term deposits 108.7 – 108.7 83.2 – 83.2
Total assets 2,698.8 4.4 2,703.2 2,643.8 4.1 2,647.9
Liabilities
Retirement benefit scheme obligations 13.7 – 13.7 7.0 – 7.0
Gross insurance contract liabilities 642.3 (0.9) 641.4 582.0 (0.6) 581.4
Provisions 4.0 – 4.0 4.7 – 4.7
Financial liabilities 489.8 (0.4) 489.4 469.2 (0.7) 468.5
Current tax liabilities 14.9 – 14.9 15.2 – 15.2
Deferred tax liabilities 21.5 0.7 22.2 16.3 0.7 17.0
Other liabilities 134.9 2.5 137.4 140.9 1.8 142.7
Trade and other payables 182.5 1.0 183.5 185.0 0.9 185.9
Total liabilities 1,503.6 2.9 1,506.5 1,420.3 2.1 1,422.4
Equity
Issued capital 11.2 – 11.2 11.2 – 11.2
Share premium 519.3 – 519.3 519.3 – 519.3
Retained earnings 607.8 0.1 607.9 662.8 2.0 664.8
Share-based payment reserve 15.6 – 15.6 11.4 – 11.4
Fair value reserve 3.3 (0.1) 3.2 (0.6) (0.1) (0.7)
Hedging reserve 38.0 1.5 39.5 19.4 0.1 19.5
Total equity 1,195.2 1.5 1,196.7 1,223.5 2.0 1,225.5
Total liabilities and equity 2,698.8 4.4 2,703.2 2,643.8 4.1 2,647.9
Financial Statements
Saga plcAnnual Report and Accounts 2019 191
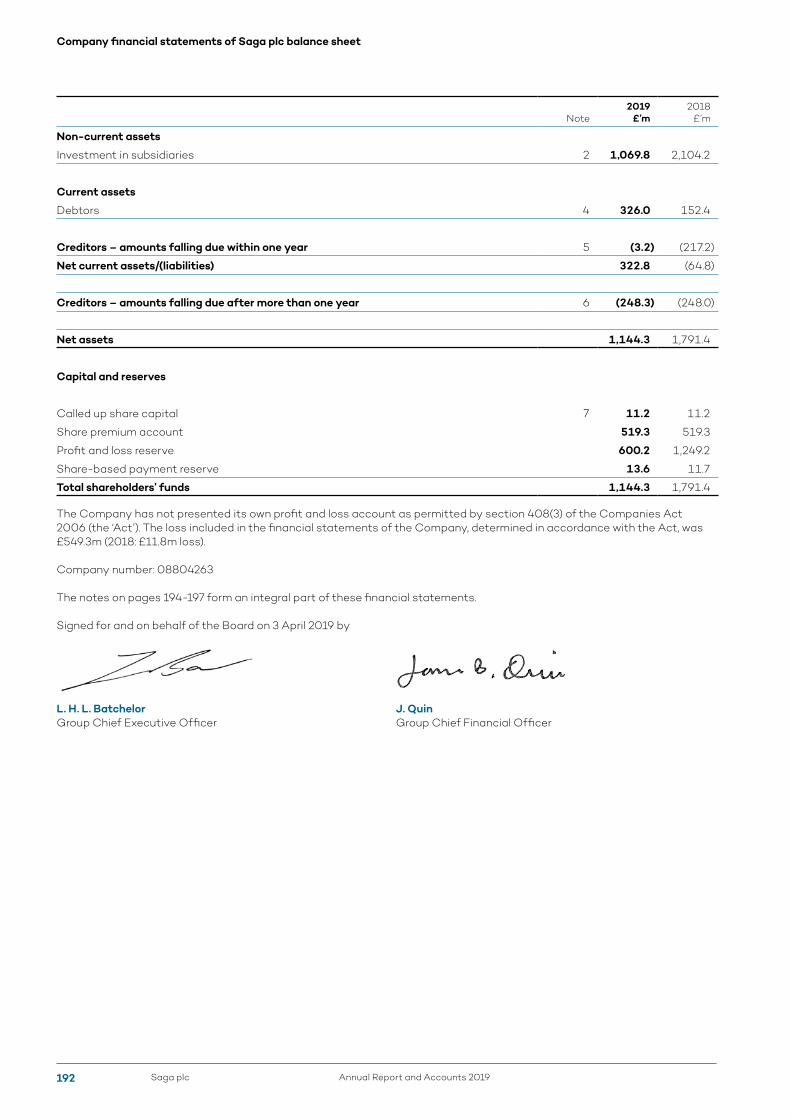
Note2019
£’m2018
£’m
Non-current assets
Investment in subsidiaries 2 1,069.8 2,104.2
Current assets
Debtors 4 326.0 152.4
Creditors – amounts falling due within one year 5 (3.2) (217.2)
Net current assets/(liabilities) 322.8 (64.8)
Creditors – amounts falling due after more than one year 6 (248.3) (248.0)
Net assets 1,144.3 1,791.4
Capital and reserves
Called up share capital 7 11.2 11.2
Share premium account 519.3 519.3
Profit and loss reserve 600.2 1,249.2
Share-based payment reserve 13.6 11.7
Total shareholders’ funds 1,144.3 1,791.4
The Company has not presented its own profit and loss account as permitted by section 408(3) of the Companies Act 2006 (the ‘Act’). The loss included in the financial statements of the Company, determined in accordance with the Act, was £549.3m (2018: £11.8m loss).
Company number: 08804263
The notes on pages 194-197 form an integral part of these financial statements.
Signed for and on behalf of the Board on 3 April 2019 by
L. H. L. BatchelorGroup Chief Executive Officer
J. QuinGroup Chief Financial Officer
Saga plc Annual Report and Accounts 2019192
Company financial statements of Saga plc balance sheet
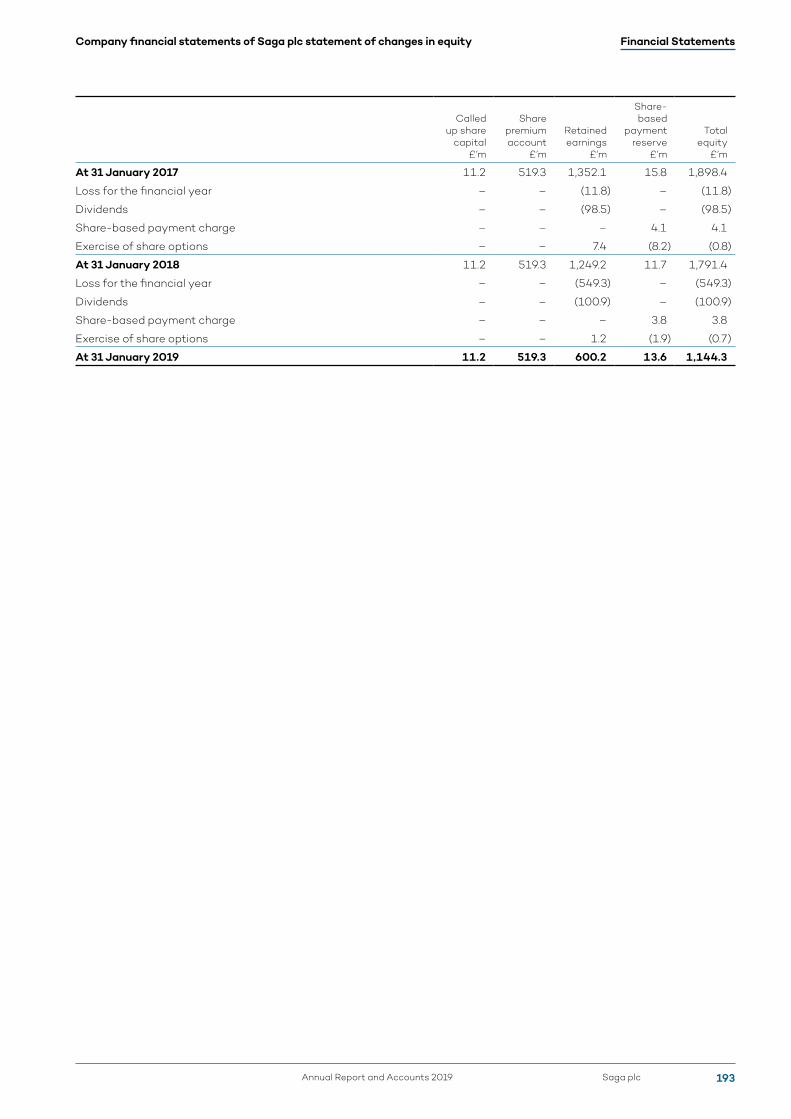
Called up share
capital £’m
Share premium account
£’m
Retained earnings
£’m
Share-based
payment reserve
£’m
Total equity
£’m
At 31 January 2017 11.2 519.3 1,352.1 15.8 1,898.4
Loss for the financial year – – (11.8) – (11.8)
Dividends – – (98.5) – (98.5)
Share-based payment charge – – – 4.1 4.1
Exercise of share options – – 7.4 (8.2) (0.8)
At 31 January 2018 11.2 519.3 1,249.2 11.7 1,791.4
Loss for the financial year – – (549.3) – (549.3)
Dividends – – (100.9) – (100.9)
Share-based payment charge – – – 3.8 3.8
Exercise of share options – – 1.2 (1.9) (0.7)
At 31 January 2019 11.2 519.3 600.2 13.6 1,144.3
Financial Statements
Saga plcAnnual Report and Accounts 2019 193
Company financial statements of Saga plc statement of changes in equity

1 Accounting policiesa. Accounting conventionThese financial statements were prepared in accordance with Financial Reporting Standard 101 ‘Reduced Disclosure Framework’ (FRS 101) and in accordance with applicable accounting standards. The financial statements are prepared under the historical cost convention, as modified by derivative financial assets and financial liabilities measured at fair value through profit or loss, and in accordance with the Companies Act 2006.
The Company’s financial statements are presented in sterling and all values are rounded to the nearest hundred thousand (£’m) except when otherwise indicated.
The accounting policies which follow set out those policies which apply in preparing the financial statements for the year ended 31 January 2019.
The Company has taken advantage of the following disclosure exemptions under FRS 101:
• The requirements of IFRS 7 ‘Financial Instruments: Disclosures’.• The requirement in paragraph 38 of IAS 1 ‘Presentation of Financial Statements’ to present comparative information in
respect of paragraph 79(a)(iv) of IAS 1.• The requirements of paragraphs 10(d), 10(f), 16, 38A, 38B-D, 40A-D, 111 and 134-136 of IAS 1 ‘Presentation of
Financial Statements’.• The requirements of IAS 7 ‘Statement of Cash Flows’.• The requirements of paragraphs 30 and 31 of IAS 8 ‘Accounting Policies, Changes in Accounting Estimates and Errors’.• The requirements of paragraph 17 of IAS 24 ‘Related Party Disclosures’.• The requirements in IAS 24 ‘Related Party Disclosures’ to disclose related party transactions entered into between two
or more members of a group, provided that any subsidiary which is a party to the transaction is wholly owned by such a member.
• The requirements of paragraphs 45(b) and 46-52 of IFRS 2 ‘Share-based Payment’.
b. InvestmentsInvestments in subsidiaries are accounted for at the lower of cost less impairment and net realisable value and reviewed for impairment when events or changes in circumstances indicate the carrying value may not be recoverable.
c. Deferred taxDeferred tax is provided on temporary differences between the tax bases of assets and liabilities and their carrying amounts for financial reporting purposes at the reporting date.
Deferred tax liabilities are recognised for all taxable temporary differences and deferred tax assets are recognised to the extent that it is probable that taxable profit will be available against which the deductible temporary differences, and the carry forward of unused tax credits and unused tax losses, can be utilised.
The carrying amount of deferred tax assets is reviewed at each reporting date and reduced to the extent that it is no longer probable that sufficient taxable profit will be available to allow all or part of the deferred tax asset to be utilised. Unrecognised deferred tax assets are reassessed at each reporting date and are recognised to the extent that it has become probable that future taxable profits will allow the deferred tax asset to be recovered.
Deferred tax assets and liabilities are measured at the tax rates that are expected to apply in the year when the asset is realised or the liability is settled, based on tax rates (and tax laws) that have been enacted or substantively enacted at the reporting date. Deferred tax is charged or credited in the income statement, except when it relates to items charged or credited in other comprehensive income, in which case the deferred tax is dealt with in other comprehensive income.
Deferred tax assets and deferred tax liabilities are offset if a legally enforceable right exists to set off current tax assets against current tax liabilities and the deferred taxes relate to the same taxable entity and the same taxation authority.
Saga plc Annual Report and Accounts 2019194
Notes to the Company financial statements

1 Accounting policies (continued)d. Share-based paymentsThe Company provides benefits to employees (including Directors) of Saga plc and its subsidiary undertakings, in the form of share-based payment transactions, whereby employees render services as consideration for equity instruments (equity-settled transactions). The cost of equity-settled transactions is measured by reference to the fair value on the grant date and is recognised as an expense over the relevant vesting period, ending on the date on which the employee becomes fully entitled to the award.
Fair values of share-based payment transactions are calculated using Black-Scholes modelling techniques.
In valuing equity-settled transactions, assessment is made of any vesting conditions to categorise these into market performance conditions, non-market performance conditions and service conditions.
Where the equity-settled transactions have market performance conditions (that is, performance which is directly or indirectly linked to the share price), the fair value of the award is assessed at the time of grant and is not changed, regardless of the actual level of vesting achieved, except where the employee ceases to be employed prior to the vesting date.
For service conditions and non-market performance conditions, the fair value of the award is assessed at the time of grant and is reassessed at each reporting date to reflect updated expectations for the level of vesting. No expense is recognised for awards that ultimately do not vest.
At each reporting date prior to vesting, the cumulative expense is calculated, representing the extent to which the vesting period has expired and, in the case of non-market conditions, the best estimate of the number of equity instruments that will ultimately vest or, in the case of instruments subject to market conditions, the fair value on grant adjusted only for leavers. The movement in the cumulative expense since the previous reporting date is recognised in the income statement, with the corresponding increase in share-based payments reserve.
Upon vesting of an equity instrument, the cumulative cost in the share-based payments reserve is reclassified to reserves.
e. Financial liabilitiesi) Initial recognition and measurementAll financial liabilities are classified as financial liabilities at amortised cost.
All financial liabilities are recognised initially at fair value and, in the case of loans and borrowings, net of directly attributable transaction costs.
The Company’s financial liabilities comprise loans and borrowings.
ii) Subsequent measurementAfter initial recognition, interest bearing loans and borrowings and other payables are subsequently measured at amortised cost using the EIR method. Gains and losses are recognised in the income statement when the liabilities are derecognised as well as through the EIR amortisation process.
Amortised cost is calculated by taking into account any discount or premium on acquisition and fees or costs that are an integral part of the EIR. The EIR amortisation is included in finance costs in the income statement.
iii) DerecognitionA financial liability is derecognised when the obligation under the liability is discharged or cancelled or expires.
When an existing financial liability is replaced by another from the same lender on substantially different terms, or the terms of an existing liability are substantially modified, such an exchange or modification is treated as a derecognition of the original liability and the recognition of a new liability. The difference in the respective carrying amounts is recognised in the income statement.
Financial Statements
Saga plcAnnual Report and Accounts 2019 195
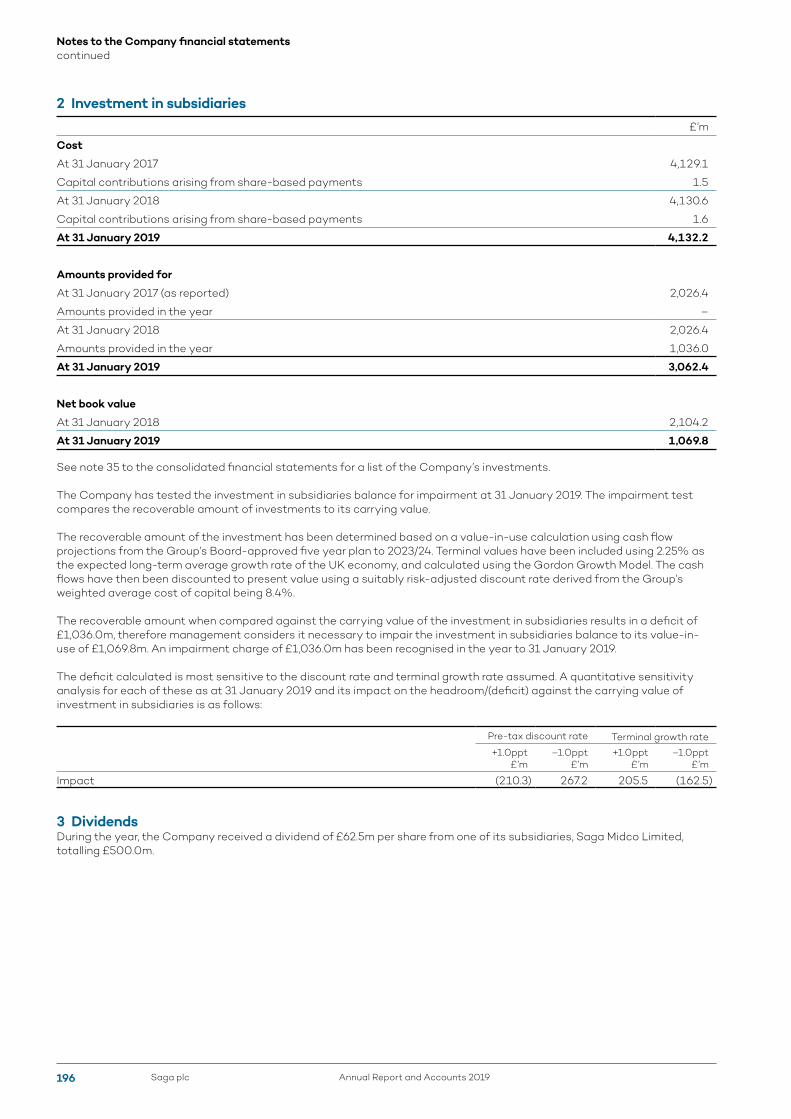
2 Investment in subsidiaries£’m
Cost
At 31 January 2017 4,129.1
Capital contributions arising from share-based payments 1.5
At 31 January 2018 4,130.6
Capital contributions arising from share-based payments 1.6
At 31 January 2019 4,132.2
Amounts provided for
At 31 January 2017 (as reported) 2,026.4
Amounts provided in the year –
At 31 January 2018 2,026.4
Amounts provided in the year 1,036.0
At 31 January 2019 3,062.4
Net book value
At 31 January 2018 2,104.2
At 31 January 2019 1,069.8
See note 35 to the consolidated financial statements for a list of the Company’s investments.
The Company has tested the investment in subsidiaries balance for impairment at 31 January 2019. The impairment test compares the recoverable amount of investments to its carrying value.
The recoverable amount of the investment has been determined based on a value-in-use calculation using cash flow projections from the Group’s Board-approved five year plan to 2023/24. Terminal values have been included using 2.25% as the expected long-term average growth rate of the UK economy, and calculated using the Gordon Growth Model. The cash flows have then been discounted to present value using a suitably risk-adjusted discount rate derived from the Group’s weighted average cost of capital being 8.4%.
The recoverable amount when compared against the carrying value of the investment in subsidiaries results in a deficit of £1,036.0m, therefore management considers it necessary to impair the investment in subsidiaries balance to its value-in-use of £1,069.8m. An impairment charge of £1,036.0m has been recognised in the year to 31 January 2019.
The deficit calculated is most sensitive to the discount rate and terminal growth rate assumed. A quantitative sensitivity analysis for each of these as at 31 January 2019 and its impact on the headroom/(deficit) against the carrying value of investment in subsidiaries is as follows:
Pre-tax discount rate Terminal growth rate
+1.0ppt £’m
–1.0ppt £’m
+1.0ppt £’m
–1.0ppt £’m
Impact (210.3) 267.2 205.5 (162.5)
3 DividendsDuring the year, the Company received a dividend of £62.5m per share from one of its subsidiaries, Saga Midco Limited, totalling £500.0m.
Saga plc Annual Report and Accounts 2019196
Notes to the Company financial statements continued

4 Debtors2019
£’m2018
£’m
Deferred tax asset 1.4 1.0
Other debtors 1.4 1.8
Amounts due to Group undertakings 323.2 149.6
326.0 152.4
All amounts above are due in less than one year.
5 Creditors – amounts falling due in less than one year2019
£’m2018
£’m
Amounts owed to Group undertakings – 214.3
Other creditors 1.4 1.1
Accrued interest payable 1.8 1.8
3.2 217.2
6 Creditors – amounts falling due in more than one year2019
£’m2018
£’m
Bond 250.0 250.0
Unamortised issue costs (1.7) (2.0)
248.3 248.0
7 Called up share capitalOrdinary shares
Number
Nominal value
£Value
£’m
Allotted, called up and fully paid
At 31 January 2017 1,118,005,405 0.01 11.2
Issue of shares 2,290,014 0.01 0.0
As at 31 January 2018 1,120,295,419 0.01 11.2
Issue of shares 1,707,909 0.01 0.0
As at 31 January 2019 1,122,003,328 0.01 11.2
Financial Statements
Saga plcAnnual Report and Accounts 2019 197
Financial calendar2019 Annual General Meeting – 19 June 2019
Final dividend dates Announcement date – 4 April 2019 Ex-dividend date – 16 May 2019 Record date – 17 May 2019 Last day for DRIP elections – 3 June 2019 Payment date – 28 June 2019
Shareholder information on-line The Company will publish annual reports, notices of shareholder meetings and other documents which we are required to send to shareholders (shareholder information) on a website. Consenting shareholders will be notified either by post or email, if preferred, each time the Company publishes shareholder information. This allows us to increase speed of communication, reduce our impact on the environment and keep costs to a minimum.
You can change your communication preference via the Saga Shareholder Services Portal www.sagashareholder.co.uk or by contacting Saga Shareholder Services. In order to register on the portal, you require your 11-digit investor code (IVC). You can find your IVC on communications such as your share certificate. The Saga Shareholder Services Portal allows you to manage your shareholding easily and securely on-line. You can also change your personal details; view your holding and get an indicative valuation; view dividend information; register proxy voting instructions; reinvest your dividends to buy additional Saga plc shares; buy and sell shares; and register bank details so that dividends can be paid directly to your account.
Shareholder fraud Shareholders are advised to be wary of any unsolicited advice or offers, whether over the telephone, through the post or by email. If any such unsolicited communication is received; please check the company or person contacting you is properly authorised by the FCA before getting involved. Fraudsters use persuasive and high-pressure tactics to lure investors into scams. They may offer to sell shares that turn out to be worthless or non-existent, or to buy shares at an inflated price in return for an upfront payment. While high profits are promised, if you buy or sell shares in this way; you may lose your money. For more information, or if you are approached by fraudsters, please visit the FCA website www.fca.org.uk/consumers/scams, where you can report and find out more about investment scams. You can also call the FCA Consumer Helpline on 0800 111 6768. If you have already paid money to share fraudsters; you should contact Action Fraud on 0300 123 2040.
Advisers Joint corporate broker and financial adviserJ.P. Morgan Cazenove 25 Bank St Canary Wharf London E14 5JP
Joint corporate brokerNumis Securities Ltd. The London Stock Exchange Building 10 Paternoster Square London EC4M 7LT
Joint financial adviserGoldman Sachs Intl. Peterborough Court 133 Fleet Street London EC4A 2BB
Media relations advisersMHP Communications 6 Agar Street London WC2N 4HN
Independent auditorsKPMG LLP 15 Canada Square London E14 5GL
Legal advisersFreshfields Bruckhaus Deringer LLP 65 Fleet Street London EC4Y 1HT
Information for investors Information for investors is provided on the internet as part of the Group’s corporate website which can be found at www.corporate.saga.co.uk
Registrars Link Asset Services
For shareholder enquiries contact: Saga Shareholder Services The Registry 34 Beckenham Road Beckenham Kent BR3 4TU
Shareholder Helpline: 0800 015 5429 – calls to Freephone numbers will vary by provider. If you are outside the UK, call +44 (0)333 300 1581 – calls outside the UK will be charged at the applicable international rate. Lines are open 9am to 5.30pm, Monday to Friday, excluding public holidays in England and Wales.
Registered officeSaga plc Enbrook Park Sandgate Folkestone Kent CT20 3SE
Corporate websites Information made available on the Group’s websites does not, and is not intended to, form part of these Results.
Saga plc Annual Report and Accounts 2019198
Shareholder information

Alternate Performance Measures (APM) The Group uses a number of Alternative Performance Measures (APMs), which are not required or commonly reported under International Financial Reporting Standards, the Generally Accepted Accounting Principles (GAAP) under which the Group prepares its financial statements, but which are used by the Group to help the user of the accounts better understand the financial performance and position of the business.
Definitions for the primary APMs used in this report and set out below. APMs are usually derived from financial statement line items and are calculated using consistent accounting policies to those applied in the financial statements, unless otherwise stated.
APMs may not necessarily be defined in a consistent manner to similar APMs used by the Group’s competitors. They should be considered as a supplement rather than a substitute for GAAP measures.
Underlying Profit Before TaxUnderlying Profit Before Tax represents profit before tax from continuing operations excluding unrealised fair value gains and losses on derivatives and the impairment of the carrying value of cruise ships and goodwill. In the prior year it also excludes the one-off costs associated with the unamortised facility fees of the previous banking facilities and one-off restructuring costs. It is reconciled to statutory profit before tax within the Operating and Financial Review on page 39.
This measure is the Group’s key performance indicator and is useful for presenting the Group’s underlying trading performance, as it excludes non-cash derivative adjustments and one-off financial impacts that are not expected to recur.
Trading EBITDATrading EBITDA is defined as earnings before interest payable, tax, depreciation and amortisation, and excludes the amortisation of acquired intangibles, non-trading costs and impairments. It also excludes the non-cash impact of IAS19R current service costs in line with the Group’s debt covenants. It is reconciled to profit before tax within the Operating and Financial Review on page 46.
This measure has been presented by the Group in every annual report since it became a listed Group in 2014 and is linked to the Group’s debt covenants, being the denominator in the Group’s leverage ratio calculation.
Underlying basic earnings per share from continuing operationsUnderlying basic earnings per share from continuing operation represents basic earnings per share from continuing operations excluding the post-tax effect of unrealised fair value gains and losses on derivatives and the impairment of the carrying value of cruise ships and goodwill. In the prior year it also excludes the post-tax effect of the one-off non-cash costs associated with the unamortised facility fees of the previous banking facilities and the post-tax effect of one-off restructuring costs. This measure is reconciled to the statutory basic earnings per share from continuing operations in note 12 to the accounts on page 158.
This measure is linked to the Group’s key performance indicator Underlying Profit Before Tax and represents what management consider to be the underlying shareholder value generated in the period.
Customer spendCustomer spend represents the total amount that customers spent on products provided by the Saga Group of companies, including gross written premiums, ancillary income and Insurance Premium Tax for all of the core policies and add-ons sold in the period. It is reconciled to statutory revenue within the Operating and Financial Review on page 39.
Available operating cash flowAvailable operating cash flow is net cashflow from operating activities after capital expenditure but before tax, interest paid and non-trading items, which is available to be used by the Group as it chooses and is not subject to regulatory restriction. It is reconciled to statutory net cash flow from operating activities within the Operating and Financial Review on page 46.
Net debtNet debt is the sum of the carrying values of the Group’s debt facilities less the amount of available cash it holds. It is linked to the Group’s debt covenants, being the numerator in the Group’s leverage ratio calculation, and is analysed further within the Operating and Financial Review on page 48.
Additional Information
Saga plcAnnual Report and Accounts 2019 199
Glossary Alternate Performance Measures (APM)

ABC1 households social grading based on a system of demographic classification used in the UK, as defined by Experian Mosaic data
Accident year the financial year in which an insurance loss occurs
Add-on an insurance policy that is actively marketed and sold as an addition to a core policy
AGM Annual General Meeting
AICL Acromas Insurance Company Limited
Available cash cash held by subsidiaries within the Group that is not subject to regulatory restrictions, net of any overdrafts held by those subsidiaries
Board Saga plc Board of Directors
Claims frequency the number of claims incurred divided by the number of policies earned in a given period
Claims reserves accounting provisions that have been set to meet outstanding insurance claims, IBNR and associated claims handling costs
Code the UK Corporate Governance Code published by the UK Financial Reporting Council setting out guidance in the form of principles and provisions to address the principal aspects of corporate governance
Combined operating ratio the ratio of the claims costs and expenses incurred to underwrite insurance (numerator) to the revenue earned by AICL (denominator) in a given period. Can otherwise be calculated as the sum of the loss ratio and expense ratio
Companies Act the UK Companies Act 2006, as amended from time to time
Company Saga plc
Continuing operations operations that are not classified as discontinued
Core policy an insurance policy that is actively marketed and sold on its own
Cruise passenger days the total number of days passengers have travelled on a ship, or ships, in a given period
Cruise passengers the number of passengers that have travelled on a Saga cruise in a given period
DBP Deferred Bonus Plan
Diems the total amount of cruise revenue earned per cruise passenger per day
Discontinued operations operations divested or those that have been classified as held for sale whose trading activities relate to a separate line of business or geographical area
Debt ratio (Leverage) the ratio of net debt to Trading EBITDA
DTRs (Disclosure and Transparency Rules) rules published by the UK Financial Conduct Authority relating to the disclosure of information by a company listed in the UK
Earned premium insurance premiums that are recognised in the income statement over the period of cover to which the premiums relate, deferred on a 365ths basis
Earnings per share from continuing operations (basic) profit after tax from continuing operations attributable to ordinary shareholders divided by the weighted average number of ordinary shares outstanding during the period
Executive Director executive director of Saga plc (unless otherwise stated)
Expense ratio the ratio of expenses incurred to underwrite insurance (numerator) to the revenue earned by AICL (denominator) in a given period
Financial Conduct Authority (FCA) the independent UK body that regulates the financial services industry, which includes general insurance
GHG Protocol a global standard for how to measure, manage, and report greenhouse gas emissions
GWP (Gross written premiums) the total premium charged to customers for a core insurance product, excluding Insurance Premium Tax but before the deduction of any outward reinsurance premiums, measured with reference to the cover start date of the policy
Group the Saga plc group
Holidays passengers the number of passengers that have travelled on a Saga, Titan or Destinology holiday in a given period
IASB International Accounting Standards Board
IBNR (incurred but not reported) a claims reserve provided to meet the estimated cost of claims that have occurred, but have not yet been reported to the insurer
IFRS International Financial Reporting Standards
IPO (Initial Public Offering) the first sale of shares by a previously unlisted company to investors on a securities exchange
Leverage ratio the ratio of net debt to Trading EBITDA
LIBOR London inter-bank offered rate
Load factor the total number of cruise passengers booked in proportion to the total cruise ship capacity
Saga plc Annual Report and Accounts 2019200
Glossary
Consultancy, design and productionwww.luminous.co.uk
Design and productionwww.luminous.co.uk
Loss ratio a ratio of the claims costs (numerator) to the net earned premium (denominator) in a given period
LR (Listing Rules) a set of mandatory regulations of the UK Financial Conduct Authority and applicable to a company listed in the UK
LTIP Long Term Incentive Plan
Malus an arrangement that permits the forfeiture of unvested remuneration awards in circumstances the Company considers appropriate
Mosaic classifications Mosaic is a consumer classification system, owned by Experian, that classifies UK households into 15 main social-economic groups, each of which have specific consumer and societal trends
Net claims the cost of claims incurred in the period less any claims costs recovered under reinsurance contracts and after the release of any claims reserves
Net earned premium earned premium net of any outward earned reinsurance premium paid
Net interest expense finance costs less finance income
Non-Executive Director (NED) non-executive director of Saga plc
Ogden discount rate the discount rate set by the relevant government bodies, the Lord Chancellor and Scottish Ministers, and used to calculate lump sum awards in bodily injury cases
Operating margin is a measurement of the proportion of revenue which is left over after paying for all business costs
PBT profit before tax
PMI private medical insurance
Policies sold the number of core and add-on insurance policies sold to customers in a given period, measured by reference to the cover start date of the policy
Reinsurance contractual arrangements where an insurer transfers part or all of the insurance risk written to another insurer, in exchange for a share of the customer premium
RMM (required minimum margin) a measure used to assess the minimum level of solvency capital an insurance underwriter must retain under Solvency I
RPI Retail Price Index
Saga Way the internal framework that guides the behaviours of our employees
SCR Solvency capital requirement as calculated under Solvency II rules
SIP Share Incentive Plan
Solvency capital/Solvency II insurance regulations designed to harmonise European Union insurance regulation. Primarily this concerns the amount of capital that European insurance companies must hold under a measure of capital and risk
tCO2e tonnes of carbon dioxide equivalent, which is a measure that allows comparison of the emissions of other greenhouse gases relative to one unit of CO2
TSR (total shareholder return) the theoretical growth in value of a shareholding over a period, by reference to the beginning and ending share price, and assuming that dividends, including special dividends, are reinvested to purchase additional units of the equity
Unearned premium an amount of insurance premium that has been written but not yet earned
See IBC artwork
Additional Information