Embed Size (px)
Citation preview

1
Oregon Reading FirstInstitute on Beginning Reading I
Cohort B
Day 3:
The Foundations of DIBELS and IDEL
The 90 Minute BlockAugust 25, 2005

2
Oregon Reading FirstInstitutes on Beginning Reading
Content developed by: Roland H. Good, Ph.D. Beth Harn, Ph.D. College of Education College of Education University of Oregon University of Oregon
Edward J. Kame’enui, Ph.D. Deborah C. Simmons, Ph.D. Professor, College of Education Professor, College of Education University of Oregon University of Oregon Michael D. Coyne, Ph.D. University of Connecticut
Prepared by: Patrick Kennedy-Paine Katie Tate University of Oregon University of Oregon

3
Cohort B, IBR 1, Day 3Content Development
Content developed by:
Rachell Katz Jeanie Mercier SmithDoris BakerTrish Travers
Dynamic Measurement Group
Additional support:
Deni BasarabaJulia KeplerKatie Tate
Janet Otterstedt

4
Copyright
• All materials are copy written and should not be reproduced or used without expressed permission of Dr. Carrie Thomas Beck, Oregon Reading First Center. Selected slides were reproduced from other sources and original references cited.

5
Dynamic Indicators of Basic Early Literacy Skills
(DIBELS™)http://dibels.uoregon.edu

6
Indicadores Dinámicos del Exito en la Lectura (IDEL™)
http://dibels.uoregon.edu

© 2003 Kameenui, Simmons, Coyne, & Harn 7
Activity: Discussing a Plan to Collect and Use Benchmark Data
Topics to Consider:• What data collection approach will we use? • Who will collect the data?• How long will it take?• Who will enter the data?• How will we share the results?
• Do we already have a plan? If so, how is it working?

© 2003 Kameenui, Simmons, Coyne, & Harn 8
Objectives
1. Become familiar with the conceptual and research
foundations of DIBELS and IDEL
2. Understand how the big ideas of early literacy map onto
DIBELS and IDEL
3. Understand how to interpret DIBELS class list results
4. Become familiar with how to use DIBELS in an
Outcomes-Driven Model
5. Become familiar with methods of collecting DIBELS data

(c) 2005 Dynamic Measurement Group9
Components of an Effective School-wide Literacy Model
Adapted from Logan City School District, 2002
Curriculum and
InstructionAssessment
Literacy Environment
and Resources
Student Success
100% of Students will Read

(c) 2005 Dynamic Measurement Group10
Research on Early Literacy: What Do We Know?
Wo
rds
Pe
r M
inu
te Reading Trajectory for Second-Grade Reader

(c) 2005 Dynamic Measurement Group11
Middle and Low Trajectories for Second Graders
Wo
rds
Pe
r M
inu
te

(c) 2005 Dynamic Measurement Group12
Nonreader at End of First Grade
My uncle, my dad, and my brother and I
built a giant sand castle. Then we got
out buckets and shovels. We drew a line to show where it
would be.

(c) 2005 Dynamic Measurement Group13
Reader at End of First Grade
My uncle, my dad, and my brother and I built a giant sand castle at the beach. First we picked a spot far from the waves. Then we
got out buckets and shovels. We drew a line to show where it would be. It was going to be big! We
all brought buckets of wet sand to make the walls.
QuickTime™ and aYUV420 codec decompressor
are needed to see this picture.

(c) 2005 Dynamic Measurement Group14
40 Words per Minute at the End of First Grade Puts Children on Trajectory to Reading
Wo
rds
Pe
r M
inu
te

(c) 2005 Dynamic Measurement Group15
Third Grade Oral Reading Fluency and Oregon Statewide Assessment Test scores
• Odds of “meets expectation” on OSAT given 3rd grade TORF of 110 : 90 of 91 or 99%.
• Odds of “meets expectation” on OSAT given 3rd grade TORF below 70: 4 of 23 or 17%.
160
170
180
190
200
210
220
230
240
250
0 20 40 60 80 100 120 140 160 180 200 220 240TORF May Grade 3
OSAT Total Score
r = .7353% of Variance
Meets
Does not meetExpectations
Exceeds
Good, 2003

© 2003 Kameenui, Simmons, Coyne, & Harn 16
Year 2: Reading First & English Language Learners The Relation Between DIBELS and the SAT-10
3 9 1223
84
68
0
20
40
60
80
100
Percent of Students
At Risk Some Risk Grade Level
SAT-10 Performance in Spring
Kindergarten Students at Low Risk in Spring on NWF
Non-ELLs
ELLs

© 2003 Kameenui, Simmons, Coyne, & Harn 17
Year 2: Cohort A Reading First & English Language Learners The Relation Between DIBELS and the SAT-10
1 2 622
94
76
0
20
40
60
80
100
Percent of Students
At Risk Some Risk Grade Level
Sat-10 Performance in Spring
Grade 1 Students at Low Risk in Spring on ORF
Non-ELLs
ELLs

© 2003 Kameenui, Simmons, Coyne, & Harn 18
Year 2: Reading First & English Language Learners The Relation Between DIBELS and the SAT-10
5767
28 2515
8
0
20
40
60
80
100
Percent of Students
At Risk Some Risk Grade Level
SAT-10 Performance in Spring
Kindergarten Students at High Risk in Spring on NWF
Non-ELLs
ELLs

© 2003 Kameenui, Simmons, Coyne, & Harn 19
Year 2: Reading First & English Language Learners The Relation Between DIBELS and the SAT-10
7787
2212
2 10
20
40
60
80
100
Percent of Students
At Risk Some Risk Grade LevelSAT-10 Performance in Spring
Grade 1 Students at High Risk in Spring on ORF
Non-ELLs
ELLs

(c) 2005 Dynamic Measurement Group20
Summary: What Do We Know?
• Reading trajectories are established early. • Readers on a low trajectory tend to stay on that
trajectory.• Students on a low trajectory tend to fall further
and further behind.• The later children are identified as needing
support, the more difficult it is to catch up!

(c) 2005 Dynamic Measurement Group21
We CAN Change Trajectories
How?• Identify students early.• Focus instruction on Big Ideas of literacy.• Focus assessment on indicators of important
outcomes.
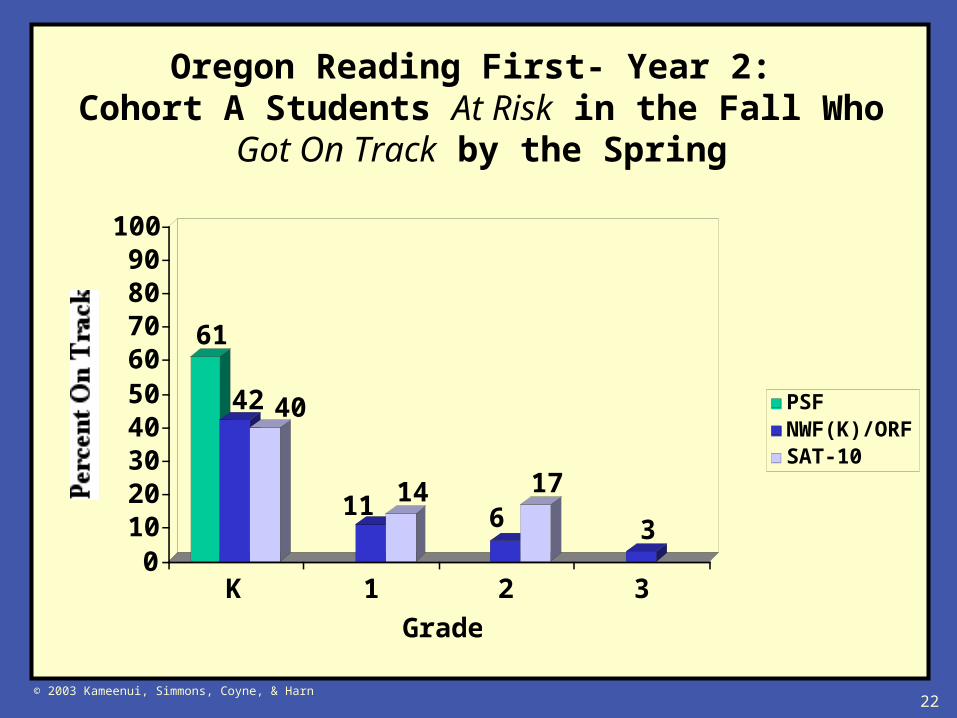
© 2003 Kameenui, Simmons, Coyne, & Harn 22
Oregon Reading First- Year 2: Cohort A Students At Risk in the Fall Who Got On
Track by the Spring
61
42 40
11 146
17
30
102030405060708090
100
Percent On Track
K 1 2 3
Grade
PSFNWF(K)/ORFSAT-10

(c) 2005 Dynamic Measurement Group23
Identify Students Early
Reading trajectories cannot be identified by reading measures until the end of first grade.
Wo
rds
Pe
r M
inu
te

(c) 2005 Dynamic Measurement Group24
Identify Students Early-Need for DIBELS™
Wo
rds
Pe
r M
inu
te

(c) 2005 Dynamic Measurement Group25
Relevant Features of DIBELS™
• Measure Basic Early Literacy Skills: Big Ideas of early literacy
• Efficient and economical• Standardized• Replicable• Familiar/routine contexts• Technically adequate• Sensitive to growth and change over time
and to effects of intervention

(c) 2005 Dynamic Measurement Group26
What Are DIBELS™?
Dynamic
98.6
Indicators
ofBasic Early Literacy Skills

(c) 2005 Dynamic Measurement Group27
Height and Weight are Indicators of Physical Development

(c) 2005 Dynamic Measurement Group28
How Can We Use DIBELS™ and IDEL toChange Reading Outcomes?
• Begin early.• Focus instruction on the Big Ideas of
early literacy.• Focus assessment on outcomes for
students.

(c) 2005 Dynamic Measurement Group29
The Bottom Line
• Children enter school with widely discrepant language/literacy experiences.
– Literacy: 1,000 hours of exposure to print versus 0-10 (Adams, 1990)
– Language: 2,153 words versus 616 words heard per hour (Hart & Risley, 1995)
– Confidence Building: 32 Affirmations/5 prohibitions per hour versus 5 affirmations and 11 prohibitions per hour (Hart & Risley, 1995)
• Need to know where children are as they enter school

Tale of Two Schools
School A• 52% low risk• 33% some risk• 14% at risk
School B• 87% low risk• 6% some risk• 6% at risk
30

(c) 2005 Dynamic Measurement Group31
Tale of Two Classrooms
Classroom 119/24 children (79%) are on track
5/24 children (21%) have some risk
0 children (0%) are at risk
Classroom 28/23 children (35%) are on track
11/23 children (48%) have some risk
3/23 children (13%) are at risk
Kindergarten Class List Report
School:Date:
District: Hope County School DistrictMelody Mountain SchoolFall
Class: MrFrizzleAM
Student
Initial Sound FluencyGoal: 8 initial sounds
Status
Letter Naming FluencyGoal: 8 letter names
Status Instructional Recommendations
Amanda 8 N/A Low Risk 13 N/A Low risk Benchmark - At Grade LevelBo 9 N/A Low Risk 2 N/A Some risk Strategic - Additional InterventionCassius 11 N/A Low Risk 20 N/A Low risk Benchmark - At Grade LevelDario 12 N/A Low Risk 17 N/A Low risk Benchmark - At Grade LevelEstelle 15 N/A Low Risk 1 N/A At risk Strategic - Additional InterventionFilene 15 N/A Low Risk 11 N/A Low risk Benchmark - At Grade LevelGeorgie 17 N/A Low Risk 20 N/A Low risk Benchmark - At Grade LevelHall 20 N/A Low Risk 32 N/A Low risk Benchmark - At Grade LevelIyla 21 N/A Low Risk 22 N/A Low risk Benchmark - At Grade LevelJake 22 N/A Low Risk 23 N/A Low risk Benchmark - At Grade LevelKaylie 24 N/A Low Risk 36 N/A Low risk Benchmark - At Grade LevelLuke 24 N/A Low Risk 43 N/A Low risk Benchmark - At Grade LevelMcKenna 25 N/A Low Risk 4 N/A Some risk Strategic - Additional InterventionNeela 25 N/A Low Risk 18 N/A Low risk Benchmark - At Grade LevelOwen 25 N/A Low Risk 20 N/A Low risk Benchmark - At Grade LevelParsons 25 N/A Low Risk 38 N/A Low risk Benchmark - At Grade LevelQuinn 26 N/A Low Risk 30 N/A Low risk Benchmark - At Grade LevelRowen 27 N/A Low Risk 33 N/A Low risk Benchmark - At Grade LevelTyson 29 N/A Low Risk 23 N/A Low risk Benchmark - At Grade LevelUsher 29 N/A Low Risk 32 N/A Low risk Benchmark - At Grade LevelVince 31 N/A Low Risk 18 N/A Low risk Benchmark - At Grade LevelWindy 33 N/A Low Risk 6 N/A Some risk Strategic - Additional InterventionYancy 38 N/A Low Risk 15 N/A Low risk Benchmark - At Grade LevelZane 42 N/A Low Risk 2 N/A Some risk Strategic - Additional Intervention
23 Mean 20 Mean
Kindergarten Class List Report, 08/24/2004, 15

(c) 2005 Dynamic Measurement Group32
• As a teacher, administrator, specialist,
will you do anything differently with regard to: – Curriculum?– Instruction?– Professional development?– Service delivery?– Resource allocation?
Important to Know Where Children Start…
© 2003 Kameenui, Simmons, Coyne, & Harn 33
DIBELS/ IDEL and the
Big Ideas of Early Literacy

(c) 2005 Dynamic Measurement Group34
Focus Instruction on Big IdeasWhat are the Big Ideas of early reading?
• Phonemic awareness• Alphabetic principle• Accuracy and fluency with connected
text• Vocabulary• Comprehension
(c) 2005 Dynamic Measurement Group35
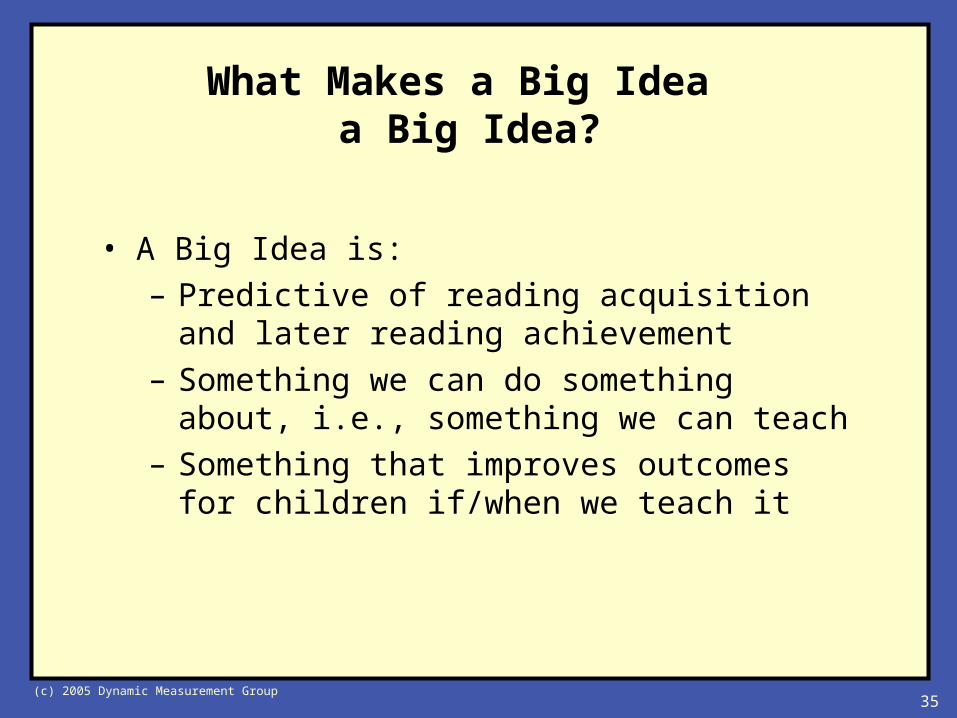
What Makes a Big Idea a Big Idea?
• A Big Idea is:– Predictive of reading acquisition and later
reading achievement– Something we can do something about, i.e.,
something we can teach– Something that improves outcomes for children
if/when we teach it
(c) 2005 Dynamic Measurement Group36
Why focus on BIG IDEAS?
• Intensive instruction means teach less more thoroughly– If you don’t know what is important,
everything is.– If everything is important, you will try to
do everything.– If you try to do everything you will be
asked to do more.– If you do everything you won’t have time
to figure out what is important.

(c) 2005 Dynamic Measurement Group37
– With a partner, match the example on the left with the big idea on the right.
Breakout Activity

(c) 2005 Dynamic Measurement Group39
Which Big Idea?
Child accurately and fluency reads a passage from a basal reader.
Child uses a word in a sentence.
Child looks at the letter “b” and says, /b/.
Child says that the first sound in the word “ball” is /b/.
Child answers questions about a passage he/she has read.
Child looks at the word, “hat” and says, /h/…/a/…/t/…/hat/.
Child completes a phrase with a rhyming word, e.g., the kitten has lost it’s mitten.
Phonemic awareness
Alphabetic principle
Accuracy and fluency reading connected text
Vocabulary
Comprehension

Steppingstones to Literacy
Phonemic Awareness
Vocabulary and Comprehension
AlphabeticPrinciple
Vocabulary and Comprehension
Oral ReadingFluency
Vocabulary and Comprehension
NonReading
Reading to Learn

(c) 2005 Dynamic Measurement Group41
ReferencesAdams, M.J. (1990). Beginning to read: Thinking and learning about print.
McCardle, P. (2004). The voice of evidence in reading research. Baltimore, MD: Brookes.
National Reading Panel (2000). Teaching children to read: An evidence-based assessment of the scientific research literature on reading and its implications for reading instruction. Washington, DC: National Institute of Child Health and Human Development.
National Research Council (1998). Preventing reading difficulties in young children, (Committee on the Prevention of Reading Difficulties in Young Children; C.E. Snow, M.S. Burns, and P. Griffin, Eds.) Washington, DC: National Academy Press.
Shaywitz, S. (2003). Overcoming dyslexia: A new and complete science-based program for reading problems at any level. New York, NY: Alfred A. Knopf.

(c) 2005 Dynamic Measurement Group42
DIBELS™ Assess the Big Ideas
Big Idea of Literacy DIBELS™ Measure
Phonemic Awareness Initial Sound Fluency
Phoneme Segmentation Fluency
Alphabetic Principle Nonsense Word Fluency
Accuracy and Fluency with Connected Text
Oral Reading Fluency
Comprehension At least through grade 3: A combination of Oral Reading Fluency & Retell Fluency
Vocabulary – Oral Language Word Use Fluency
Retell Fluency and Word Use Fluency are optional for Reading First

43
IDEL™ Measurement System
Phonological Awareness
Fluidez en la Segmentación de Fonemas (FSF)
Alphabetic Principle Fluidez en las Palabras sin Sentido (FPS)
Fluency and Accuracy
Fluidez en la Lectura Oral (FLO)
Comprehension Fluidez en la Lectura Oral (FLO) Recuento Oral (FRO)
Vocabulary Fluidez en el Uso de las Palabras (FUP)

44
Letter Naming Fluency is an Added Indicator of Risk*
Note: Letter Naming is not a Big Idea of early literacy; it is not the most powerful instructional target thus there are no benchmark goals nor progress monitoring materials for LNF.
Indicator of Risk
DIBELS™ Measure Letter Naming Fluency (LNF)
IDEL MeasureFluidez en el Nombramiento de las Letras
(FNL)

© 2003 Kameenui, Simmons, Coyne, & Harn 45
Interpreting DIBELS and IDEL Results

(c) 2005 Dynamic Measurement Group46
Outcomes DIBELS Benchmark Goals
• Initial Sound Fluency:
• Phoneme Segmentation Fluency:
• Nonsense Word Fluency:
• DIBELS™ Oral Reading Fluency:
(goals are minimum scores for lowest reader)
–35 sounds per minute by Spring Kindergarten
–25 sounds per minute by Winter Kindergarten
–40 words correct per minute by Spring First Grade
–50 sounds per minute by Winter First Grade with at least 15 words recoded
–90 words correct per minute by Spring Second Grade
–110 words correct per minute by Spring Third Grade

47
48

49

(c) Dynamic Measurement Group50
Model of Big Ideas, Indicators, and Timeline
Adapted from Good, R. H., Simmons, D. C., & Kame'enui, E. J. (2001). The importance and decision-making utility of a continuum of fluency-based indicators of foundational reading skills for third-grade high-stakes outcomes. Scientific Studies of Reading, 5, 257-288.

51
Preliminary IDEL Benchmarks
• Benchmarks for IDEL Fluidez en el Nombramiento de las Letras (FNL) are based on percentiles. Data were taken from the IDEL database (N=3,869)
• Benchmark for IDEL Fluidez en las Palabras sin Sentido (FPS) are based on research conducted on the predictive validity of FPS and the analysis of Spanish orthography.
• Benchmark for IDEL Fluidez en la Lectura Oral (FLO) is the same as for DIBELS

52
Preliminary IDEL Benchmark Goals and Indicators of RiskThree Assessment Periods Per Year
KindergartenBeginning of Year
Month 1-3IDEL Measure
Scores Status
IDEL Fluidez en elNombramiento de las Letras
LNF < 33 < LNF < 8
LNF > 8
At riskSome riskLow risk
*FNL is a Risk Indicator; Status is based on Percentiles (N= 3,869)

53
Preliminary IDEL Benchmark Goals and Indicators of RiskThree Assessment Periods Per Year
First GradeBeginning of Year
Month 1-3Middle of Year
Month 4-6End of YearMonth 7-10IDEL Measure
Scores Status Scores Status Scores Status
IDEL Fluidez enlas Palabras sin
Sentido
FPS < 1818 < FPS < 35
FPS > 35
At riskSome riskLow risk
FPS < 3535 < FPS < 70
FPS > 70
At riskSome riskLow risk
FPS < 7070 < FPS < 90
FPS > 90
At riskSome riskLow risk
IDEL Fluidez en laLectura Oral
FLO < 88 < FLO < 20
FLO > 20
At riskSome riskLow risk
FLO < 2020 < FLO < 40
FLO > 40
At riskSome riskLow risk

54
Preliminary IDEL Benchmark Goals and Indicators of RiskThree Assessment Periods Per Year
Second GradeBeginning of Year
Month 1-3Middle of Year
Month 4-6End of YearMonth 7-10IDEL Measure
Scores Status Scores Status Scores Status
IDEL Fluidez enlas Palabras sin
Sentido
FPS < 7070 < FPS < 90
FPS > 90
At riskSome riskLow risk
IDEL Fluidez en laLectura Oral
FLO < 2626 < FLO < 44
FLO > 44
At riskSome riskLow risk
FLO < 5252 < FLO < 68
FLO > 68
At riskSome riskLow risk
FLO < 7070 < FLO < 90
FLO > 90
At riskSome riskLow risk

55
Preliminary IDEL Benchmark Goals and Indicators of RiskThree Assessment Periods Per Year
Third GradeBeginning of Year
Month 1-3Middle of Year
Month 4-6End of YearMonth 7-10IDEL Measure
Scores Status Scores Status Scores Status
IDEL Fluidez en laLectura Oral
FLO < 5353 < FLO < 77
FLO > 77
At riskSome riskLow risk
FLO < 7777 < FLO < 92
FLO > 92
At riskSome riskLow risk
FLO < 8080 < FLO <
110FLO > 110
At riskSome riskLow risk

(c) Dynamic Measurement Group56
Using DIBELS™and IDEL™ : Three Levels of Assessment
• Benchmarking• Strategic Monitoring• Continuous or Intensive Care Monitoring

(c) Dynamic Measurement Group57
DIBELS Three Status Categories:Used at or after benchmark goal time
• Established -- Child has achieved the benchmark goal• Emerging -- Child has not achieved the benchmark goal; has
emerging skills but may need to increase consistency, accuracy and/or fluency to achieve benchmark goal
• Deficit -- Child has low skills and is at risk for not achieving benchmark goal

(c) Dynamic Measurement Group58
DIBELS and IDEL:Three Risk CategoriesUsed prior to benchmark time
• Low risk -- On track to achieve benchmark goal• Some risk -- Low emerging skills/ 50-50 chance of achieving
benchmark goal• At risk -- Very low skills; at risk for difficulty in achieving
benchmark goal

(c) Dynamic Measurement Group59
Three levels of Instruction
– Benchmark Instruction - At Grade Level: Core Curriculum focused on big ideas
– Strategic Instructional Support - Additional Intervention• Extra practice• Adaptations of core curriculum
– Intensive Instructional Support - Substantial Intervention• Focused, explicit instruction with supplementary
curriculum• Individual instruction

(c) Dynamic Measurement Group60
What do we Need to Know from Benchmark Data?
• In general, what skills do the children in my class/school/district have?
• Are there children who may need additional support?• How many children may need additional support?• Which children may need additional support to
achieve outcomes?• What supports do I need to address the needs of my
students?

(c) Dynamic Measurement Group61
Three Levels of Instructional Support
Instructional Recommendations Are Based on Performance Across All Measures
• Benchmark: Established skill performance across all administered measures
• Strategic: One or more skill areas are not within the expected performance range
• Intensive: One or many skill areas are within the significantly at-risk range for later reading difficulty

© 2003 Kameenui, Simmons, Coyne, & Harn 62
Levels of Support:Reality?
Intensive
Strategic
Benchmark5%
15%
80%

© 2003 Kameenui, Simmons, Coyne, & Harn 63
Levels of Support:Goal!
Intensive
Strategic
Benchmark
5%
15%
80%
(c) 2005 Dynamic Measurement Group64
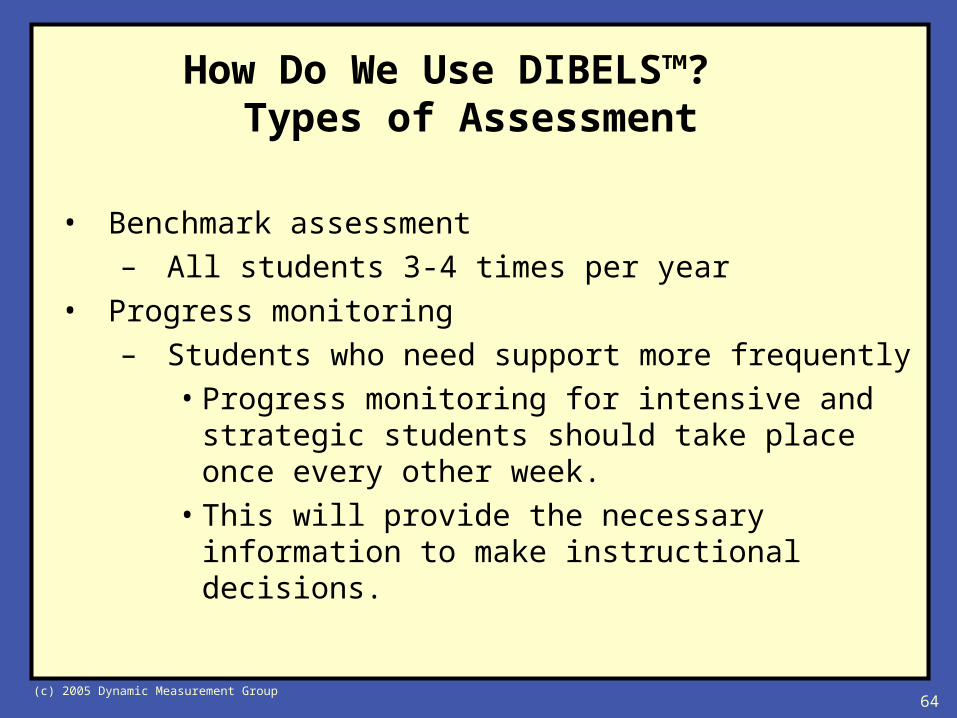
How Do We Use DIBELS™? Types of Assessment
• Benchmark assessment– All students 3-4 times per year
• Progress monitoring– Students who need support more frequently
• Progress monitoring for intensive and strategic students should take place once every other week.
• This will provide the necessary information to make instructional decisions.

© 2003 Kameenui, Simmons, Coyne, & Harn 65
Using DIBELS in an
Outcomes-Driven Model

(c) 2005 Dynamic Measurement Group66
How do we Make Educational Decisions with DIBELS™?
An Outcomes-Driven model: Decision making steps designed to answer specific questions for specific purposes
Identify long term outcomes and benchmarks to achieve1. Identify Need for Support2. Validate Need for Support3. Plan Support Strategies4. Implement Support strategies5. Evaluate Support6. Outcome Evaluation

(c) 2005 Dynamic Measurement Group67
Outcomes-Driven Model
Identify Need for Support
Validate Need for Support
Plan Support
Evaluate Effectiveness of Support
Implement Support
Review Outcomes
Progress Monitoring
Benchmark Assessment
Benchmark Assessment
(c) 2005 Dynamic Measurement Group68
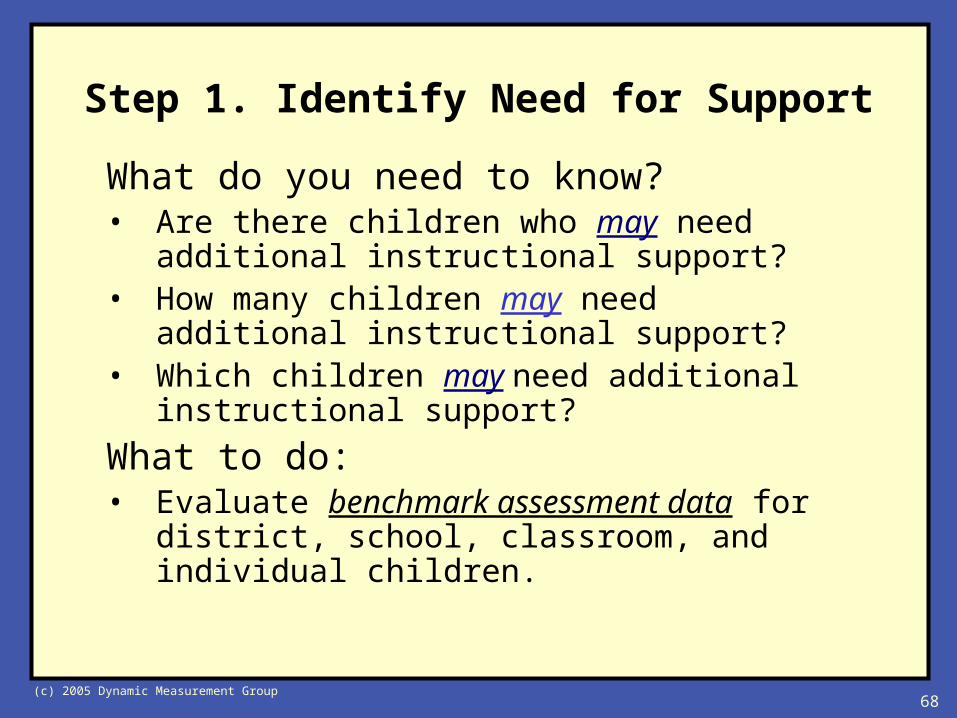
Step 1. Identify Need for Support
What do you need to know? • Are there children who may need additional
instructional support?• How many children may need additional
instructional support?• Which children may need additional instructional
support?
What to do:• Evaluate benchmark assessment data for district,
school, classroom, and individual children.

(c) 2005 Dynamic Measurement Group69
Are There Children Who May Need Additional Instructional Support?
• Winter of Kindergarten• Approximately 1/5 of students are at risk for poor reading outcomes.
Phoneme Segmentation Fluency
0
2
4
6
8
10
12
14
16
0 - 4 5 - 910 - 1415 - 1920 - 2425 - 2930 - 3435 - 3940 - 4445 - 4950 - 5455 - 5960 - 6465 - 6970 - 74
75 +
Correct Phonemes
Frequency
25%
54%
21%
Low risk
Some risk
At risk

(c) 2005 Dynamic Measurement Group70
DIBELS: Class List Report
• For each child and each Measure administered at that benchmark:
– Score
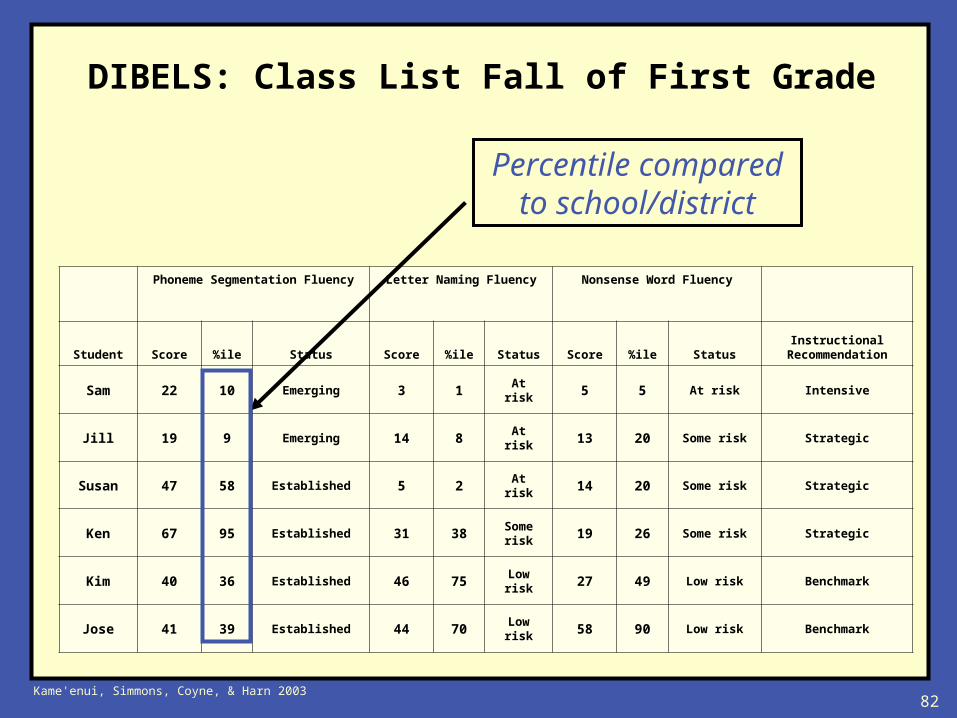
– Percentile: (based on school/district norms)
– Skill status: Established, Emerging, Deficit or Low Risk, Some Risk, At-Risk
– Instructional Recommendation: Benchmark, Strategic, Intensive
(c) 2005 Dynamic Measurement Group71
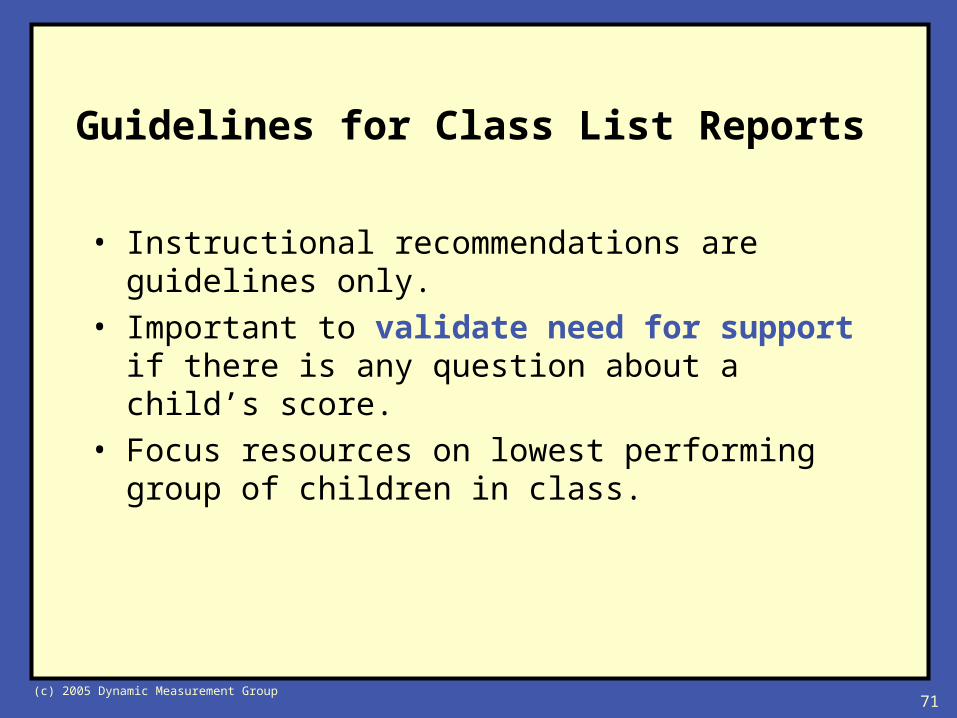
Guidelines for Class List Reports
• Instructional recommendations are guidelines only. • Important to validate need for support if there is
any question about a child’s score. • Focus resources on lowest performing group of
children in class.

(c) 2005 Dynamic Measurement Group72
Interpreting Class List ReportsTips and Notes
• ISF and PSF both measure the same Big Idea: phonemic awareness. PSF is more reliable measure; use it in winter of K as primary measure of phonemic awareness. – If child is doing well on PSF can assume skills on
ISF – Use ISF if PSF is too difficult and child achieves
score of 0.

(c) 2005 Dynamic Measurement Group73
Interpreting Class List ReportsTips and Notes
• PSF and NWF measure different Big Ideas, both of which are necessary (but not sufficient in and of themselves) for acquisition of reading. We teach and measure both. – Skills in PA facilitate development of AP; however
children can begin to acquire AP and not be strong in PA.
• If a child seems to be doing well in AP, do not assume PA skills if a child is at risk.
• Continue to provide support on PA and monitor progress. These children may have difficulty with fluent phonological recoding and with oral reading fluency.

(c) 2005 Dynamic Measurement Group74
Interpreting Class List ReportsTips and Notes
• PSF has a “threshold effect”, i.e., children reach benchmark goal and then scores slightly decrease on that measure as they focus on acquiring new skills (alphabetic principle, fluency in reading connected text)

(c) 2005 Dynamic Measurement Group75
Interpreting Class List ReportsTips and Notes
• Letter Naming Fluency is an added indicator of risk. Use it in conjunction with scores on other DIBELS measures.– Example: In a group of children with low
scores on ISF at the beginning of K, those with low scores also on LNF are at higher risk
• LNF is not our most powerful instructional target

(c) 2005 Dynamic Measurement Group76
Interpreting Class List ReportsTips and Notes
• Have list of scores for Benchmark Goals and Indicators of Risk available to refer to as you review the Class List Reports. Pay special attention to children whose scores are near the “cut-offs”– E.g., in the middle of K,a child with a score of 6 on
PSF is “at risk”, a score of 7 is “some risk”.

(c) 2005 Dynamic Measurement Group77
Interpreting Class List ReportsTips and Notes
• When interpreting NWF scores it is important to take note of the level of blending by the student.
• Note if the student is reading the words sound-by-sound or if the student is recoding the words. A minimum score of 15 words recoded has been added to the benchmark score of 50 sounds per minute by the winter of first grade.

Kame'enui, Simmons, Coyne & Harn 200378
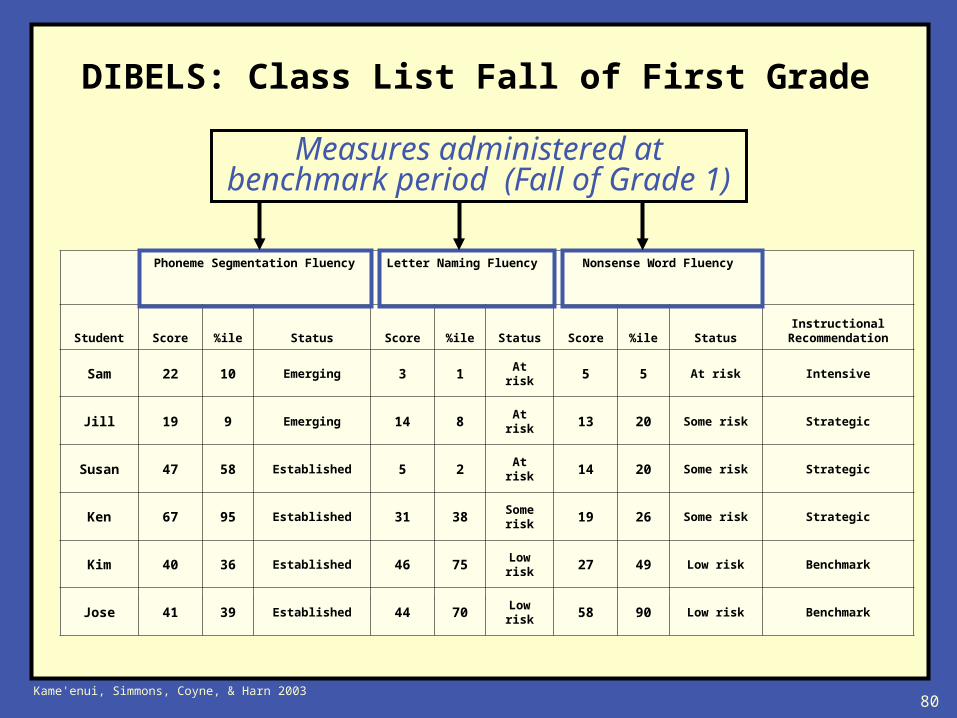
A class list provides a report of children’s performance on all measures administered at a given benchmark period in relation to established goals.
DIBELS: Class List
Phoneme Segmentation Fluency Letter Naming Fluency Nonsense Word Fluency
Student Score %ile Status Score %ile Status Score %ile StatusInstructional
Recommendation
Sam 22 10 Emerging 3 1 At risk 5 5 At risk Intensive
Jill 19 9 Emerging 14 8 At risk 13 20 Some risk Strategic
Susan 47 58 Established 5 2 At risk 14 20 Some risk Strategic
Ken 67 95 Established 31 38Some risk 19 26 Some risk Strategic
Kim 40 36 Established 46 75 Low risk 27 49 Low risk Benchmark
Jose 41 39 Established 44 70 Low risk 58 90 Low risk Benchmark
Fall of First Grade

Kame'enui, Simmons, Coyne & Harn 200379
Each student in the class
DIBELS: Class List Fall of First Grade
Phoneme Segmentation Fluency Letter Naming Fluency Nonsense Word Fluency
Student Score %ile Status Score %ile Status Score %ile StatusInstructional
Recommendation
Sam 22 10 Emerging 3 1 At risk 5 5 At risk Intensive
Jill 19 9 Emerging 14 8 At risk 13 20 Some risk Strategic
Susan 47 58 Established 5 2 At risk 14 20 Some risk Strategic
Ken 67 95 Established 31 38Some risk 19 26 Some risk Strategic
Kim 40 36 Established 46 75 Low risk 27 49 Low risk Benchmark
Jose 41 39 Established 44 70 Low risk 58 90 Low risk Benchmark
Kame'enui, Simmons, Coyne, & Harn 200380
DIBELS: Class List Fall of First Grade
Phoneme Segmentation Fluency Letter Naming Fluency Nonsense Word Fluency
Student Score %ile Status Score %ile Status Score %ile StatusInstructional
Recommendation
Sam 22 10 Emerging 3 1 At risk 5 5 At risk Intensive
Jill 19 9 Emerging 14 8 At risk 13 20 Some risk Strategic
Susan 47 58 Established 5 2 At risk 14 20 Some risk Strategic
Ken 67 95 Established 31 38Some risk 19 26 Some risk Strategic
Kim 40 36 Established 46 75 Low risk 27 49 Low risk Benchmark
Jose 41 39 Established 44 70 Low risk 58 90 Low risk Benchmark
Measures administered at benchmark period (Fall of Grade 1)

Kame'enui, Simmons, Coyne, & Harn 200381
Raw score for each measure
DIBELS: Class List Fall of First Grade
Phoneme Segmentation Fluency Letter Naming Fluency Nonsense Word Fluency
Student Score %ile Status Score %ile Status Score %ile StatusInstructional
Recommendation
Sam 22 10 Emerging 3 1 At risk 5 5 At risk Intensive
Jill 19 9 Emerging 14 8 At risk 13 20 Some risk Strategic
Susan 47 58 Established 5 2 At risk 14 20 Some risk Strategic
Ken 67 95 Established 31 38Some risk 19 26 Some risk Strategic
Kim 40 36 Established 46 75 Low risk 27 49 Low risk Benchmark
Jose 41 39 Established 44 70 Low risk 58 90 Low risk Benchmark
Kame'enui, Simmons, Coyne, & Harn 200382
Percentile compared to school/district
DIBELS: Class List Fall of First Grade
Phoneme Segmentation Fluency Letter Naming Fluency Nonsense Word Fluency
Student Score %ile Status Score %ile Status Score %ile StatusInstructional
Recommendation
Sam 22 10 Emerging 3 1 At risk 5 5 At risk Intensive
Jill 19 9 Emerging 14 8 At risk 13 20 Some risk Strategic
Susan 47 58 Established 5 2 At risk 14 20 Some risk Strategic
Ken 67 95 Established 31 38Some risk 19 26 Some risk Strategic
Kim 40 36 Established 46 75 Low risk 27 49 Low risk Benchmark
Jose 41 39 Established 44 70 Low risk 58 90 Low risk Benchmark

Kame'enui, Simmons, Coyne, & Harn 200383
Status on each skill (established, emerging, deficit)
DIBELS: Class List Fall of First Grade
Phoneme Segmentation Fluency Letter Naming Fluency Nonsense Word Fluency
Student Score %ile Status Score %ile Status Score %ile StatusInstructional
Recommendation
Sam 22 10 Emerging 3 1 At risk 5 5 At risk Intensive
Jill 19 9 Emerging 14 8 At risk 13 20 Some risk Strategic
Susan 47 58 Established 5 2 At risk 14 20 Some risk Strategic
Ken 67 95 Established 31 38Some risk 19 26 Some risk Strategic
Kim 40 36 Established 46 75 Low risk 27 49 Low risk Benchmark
Jose 41 39 Established 44 70 Low risk 58 90 Low risk Benchmark

Kame'enui, Simmons, Coyne, & Harn 200384
Overall Instructional Recommendation Across Measures(Benchmark, Strategic, or Intensive Support)
DIBELS: Class List Fall of First Grade
Phoneme Segmentation Fluency Letter Naming Fluency Nonsense Word Fluency
Student Score %ile Status Score %ile Status Score %ile StatusInstructional
Recommendation
Sam 22 10 Emerging 3 1 At risk 5 5 At risk Intensive
Jill 19 9 Emerging 14 8 At risk 13 20 Some risk Strategic
Susan 47 58 Established 5 2 At risk 14 20 Some risk Strategic
Ken 67 95 Established 31 38Some risk 19 26 Some risk Strategic
Kim 40 36 Established 46 75 Low risk 27 49 Low risk Benchmark
Jose 41 39 Established 44 70 Low risk 58 90 Low risk Benchmark

Kame'enui, Simmons, Coyne & Harn 200385
DIBELS: Class List
Instructional Recommendations Are Based on Performance Across All Measures
• Benchmark: Established skill performance across all administered measures
• Strategic: One or more skill areas are not within the expected performance range
• Intensive: One or many skill areas are within the significantly at-risk range for later reading difficulty

© 2003 Kameenui, Simmons, Coyne, & Harn 86
What are the established goals for these measures?
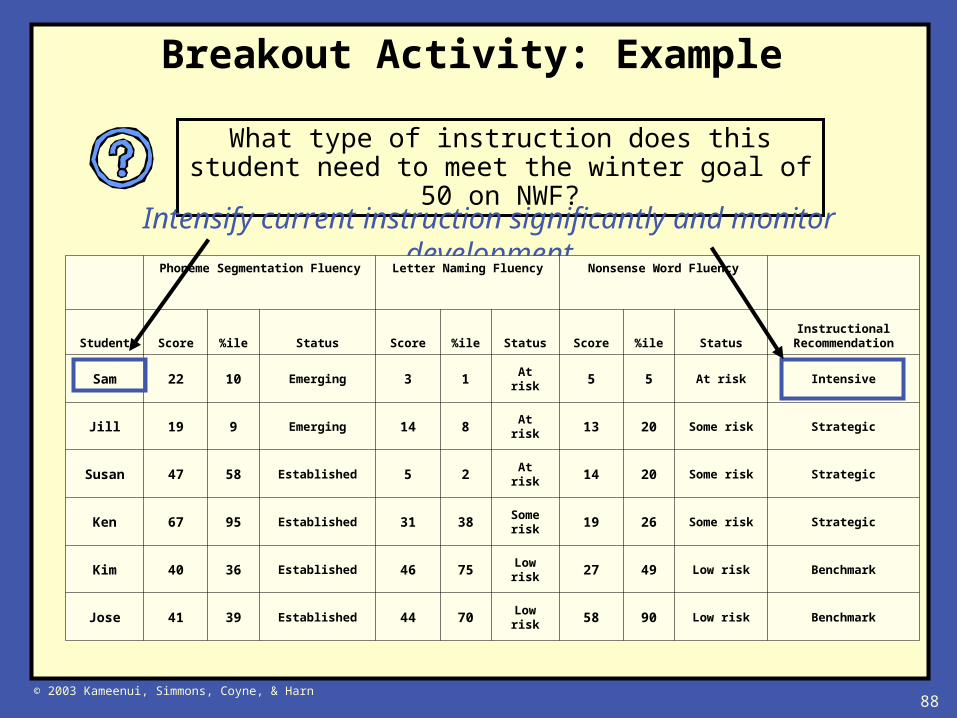
NWF – 50 by the middle of Grade 1
PSF – 35 by the end of Kindergarten
Breakout Activity: Example
Phoneme Segmentation Fluency Letter Naming Fluency Nonsense Word Fluency
Student Score %ile Status Score %ile Status Score %ile StatusInstructional
Recommendation
Sam 22 10 Emerging 3 1 At risk 5 5 At risk Intensive
Jill 19 9 Emerging 14 8 At risk 13 20 Some risk Strategic
Susan 47 58 Established 5 2 At risk 14 20 Some risk Strategic
Ken 67 95 Established 31 38Some risk 19 26 Some risk Strategic
Kim 40 36 Established 46 75 Low risk 27 49 Low risk Benchmark
Jose 41 39 Established 44 70 Low risk 58 90 Low risk Benchmark

© 2003 Kameenui, Simmons, Coyne, & Harn 87
What type of instruction does this student need to meet the winter goal of 50 on NWF?
Continue current instructional approach
Breakout Activity: Example
Phoneme Segmentation Fluency Letter Naming Fluency Nonsense Word Fluency
Student Score %ile Status Score %ile Status Score %ile StatusInstructional
Recommendation
Sam 22 10 Emerging 3 1 At risk 5 5 At risk Intensive
Jill 19 9 Emerging 14 8 At risk 13 20 Some risk Strategic
Susan 47 58 Established 5 2 At risk 14 20 Some risk Strategic
Ken 67 95 Established 31 38Some risk 19 26 Some risk Strategic
Kim 40 36 Established 46 75 Low risk 27 49 Low risk Benchmark
Jose 41 39 Established 44 70 Low risk 58 90 Low risk Benchmark
© 2003 Kameenui, Simmons, Coyne, & Harn 88
What type of instruction does this student need to meet the winter goal of 50 on NWF?
Intensify current instruction significantly and monitor development
Breakout Activity: Example
Phoneme Segmentation Fluency Letter Naming Fluency Nonsense Word Fluency
Student Score %ile Status Score %ile Status Score %ile StatusInstructional
Recommendation
Sam 22 10 Emerging 3 1 At risk 5 5 At risk Intensive
Jill 19 9 Emerging 14 8 At risk 13 20 Some risk Strategic
Susan 47 58 Established 5 2 At risk 14 20 Some risk Strategic
Ken 67 95 Established 31 38Some risk 19 26 Some risk Strategic
Kim 40 36 Established 46 75 Low risk 27 49 Low risk Benchmark
Jose 41 39 Established 44 70 Low risk 58 90 Low risk Benchmark

© 2003 Kameenui, Simmons, Coyne, & Harn 89
What type of instruction does this student need to meet the winter goal of 50 on NWF?
Intensify current instruction strategically and monitor progress
Breakout Activity: Example
Phoneme Segmentation Fluency Letter Naming Fluency Nonsense Word Fluency
Student Score %ile Status Score %ile Status Score %ile StatusInstructional
Recommendation
Sam 22 10 Emerging 3 1 At risk 5 5 At risk Intensive
Jill 19 9 Emerging 14 8 At risk 13 20 Some risk Strategic
Susan 47 58 Established 5 2 At risk 14 20 Some risk Strategic
Ken 67 95 Established 31 38Some risk 19 26 Some risk Strategic
Kim 40 36 Established 46 75 Low risk 27 49 Low risk Benchmark
Jose 41 39 Established 44 70 Low risk 58 90 Low risk Benchmark

© 2003 Kameenui, Simmons, Coyne, & Harn 90
In school teams, complete the breakout activity on reading and interpreting DIBELS class reports
Breakout Activity

In January of Kindergarten: Sandra, Max, Brandon, and Danielle have a deficit on Initial Sound Fluency. They may need additional instructional support to attain kindergarten benchmarks. Joseph and Tiffany are on track with established skills on ISF. Halley and Latisha have emerging skills and should be monitored strategically
T.,Sandra 9 4 Deficit 1 7 At risk 8 13 At risk Intensive support indicated.
R., Max 7 2 Deficit 1 7 At risk 10 18 At risk Intensive support indicated.
W., Halley 14 12 Emerging 2 9 Some risk 29 46 Low risk Strategic support.
M., Latisha 19 22 Emerging 3 11 Some risk 35 59 Low risk Strategic support.
A., Brandon 9 4 Deficit 3 11 Some risk 8 13 Some risk Intensive support indicated.
R., Tiffany 42 86 Established 13 31 Low risk 48 85 Low risk Benchmark.
M., Danielle 5 1 Deficit 14 33 Low risk 8 13 Some risk Strategic support.
M., Joseph 38 75 Established 15 35 Low risk 37 66 Low risk Benchmark.
Identify Need: Which Children May Need Support?
© 2005 Dynamic Measurement Group 91

© 2005 Dynamic Measurement Group92
Focus on Four Children
M., Danielle 5 1 Deficit
R., Max 7 2 Deficit
T., Sandra 9 4 Deficit
A., Brandon 9 4 Deficit

© 2005 Dynamic Measurement Group93
Step 2. Validate Need for Support
This step would be used for children whose scores are surprising or unexpected.
• Are we reasonably confident the student needs instructional support?– Rule out easy reasons for poor performance:– Bad day, confused on directions or task, ill, shy, or
similar.
What to do:• Use additional information, e.g., other assessment data,
knowledge about child.• Repeat assessments.

© 2005 Dynamic Measurement Group94
Validate Need for Support
Verify Need for Instructional Support by Retesting with Different Forms Until We Are Reasonably Confident.
10
20
30
40
Dec.Scores
Feb.Scores
Jan.Scores
MarchScores
AprilScores
MayScores
JuneScores
60
50
Cor
rect
Pho
nem
es
January cutoffBrandon

© 2005 Dynamic Measurement Group95
Validate Need for Support Verify Need for Instructional Support by Retesting with Different Forms Until We Are
Reasonably Confident.
10
20
30
40
Dec.Scores
Feb.Scores
Jan.Scores
MarchScores
AprilScores
MayScores
JuneScores
60
50
Cor
rect
Pho
nem
es
January cutoffSandra
© 2005 Dynamic Measurement Group96
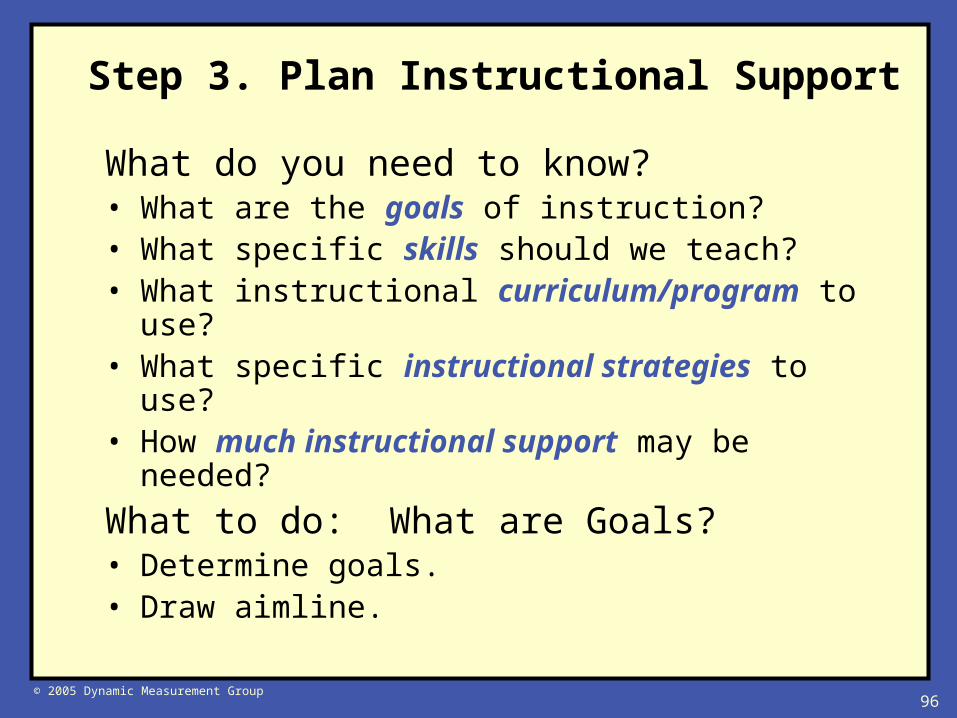
Step 3. Plan Instructional Support
What do you need to know?• What are the goals of instruction?• What specific skills should we teach?• What instructional curriculum/program to use?• What specific instructional strategies to use?• How much instructional support may be
needed?
What to do: What are Goals?• Determine goals.• Draw aimline.
© 2005 Dynamic Measurement Group97
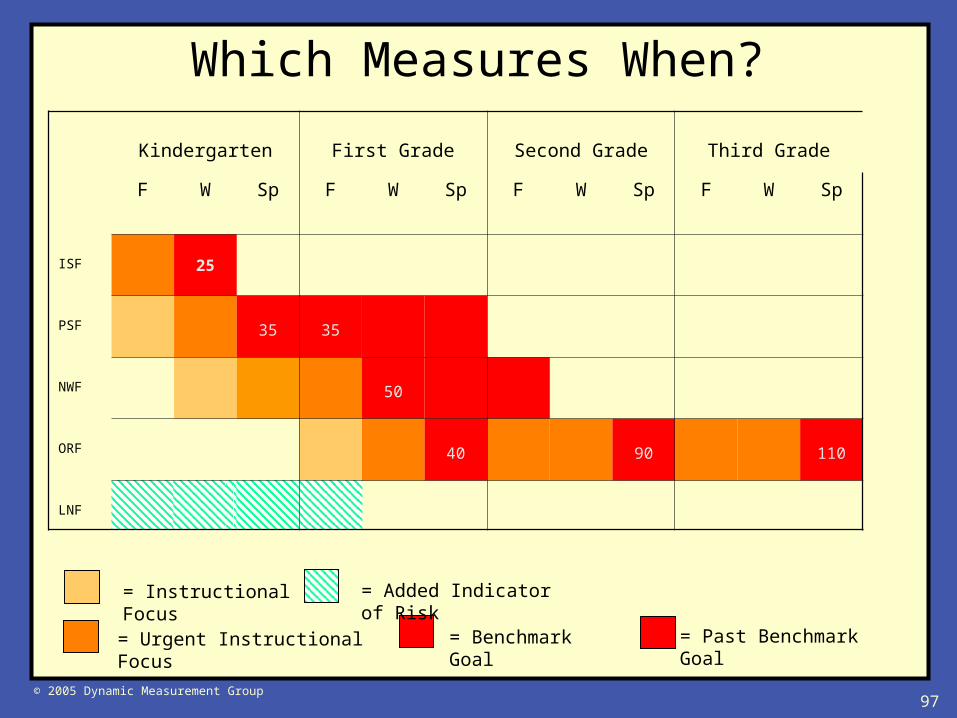
Kindergarten First Grade Second Grade Third Grade
F W Sp F W Sp F W Sp F W Sp
ISF 25
PSF 35 35
NWF 50
ORF 40 90 110
LNF
= Urgent Instructional Focus = Benchmark Goal = Past Benchmark Goal
= Instructional Focus = Added Indicator of Risk
Which Measures When?

© 2005 Dynamic Measurement Group98
Plan Support: Aimline for Brandon
The aimline connects where you are to where you want to get to, and shows the course to follow to get there.
10
20
30
40
Dec.Scores
Feb.Scores
Jan.Scores
MarchScores
AprilScores
MayScores
JuneScores
60
50
Aimline

© 2005 Dynamic Measurement Group99
Plan Support: Aimline for Sandra
10
20
30
40
Dec.Scores
Feb.Scores
Jan.Scores
MarchScores
AprilScores
MayScores
JuneScores
60
50
Cor
rect
Pho
nem
es
Aimline

© 2005 Dynamic Measurement Group100
Plan Support:
• What specific skills, program/curriculum, strategies? – Three-tiered model of support in place:
Core, Supplemental, Intervention– Use additional assessment if needed (e.g.,
diagnostic assessment, curriculum/program placement tests, knowledge of child)
– Do whatever it takes to get the child back on track!

© 2005 Dynamic Measurement Group101
Step 4. Evaluate and Modify Support
Key decision:• Is the support effective in improving the child’s early literacy
skills?
• Is the child progressing at a sufficient rate to achieve the next benchmark goal?
What to do:• Monitor child’s progress and use decision rules to evaluate data .
– Three consecutive data points below the aimline indicates a need to modify instructional support.

© 2003 Kameenui, Simmons, Coyne, & Harn 102
Progress Monitoring
Performance monitored frequently for all students who are at risk of reading difficulty
Data used to make instructional decisions
Example of a progress monitoring schedule
Students at low risk: Monitor progress three times a year
Students at some risk: Monitor progress every other week
Students at high risk: Monitor progress every other week
Early identification and frequent monitoring of students experiencing reading difficulties

© 2005 Dynamic Measurement Group103
Evaluate Support: Modify Instruction for Sandra?
10
20
30
40
Dec.Scores
Feb.Scores
Jan.Scores
MarchScores
AprilScores
MayScores
JuneScores
60
50
Cor
rect
Pho
nem
es
Aimline

© 2005 Dynamic Measurement Group104
Evaluate Support: Modify Instruction for Brandon?
Brandon: Whoops! Time to make a change!
10
20
30
40
Dec.Scores
Feb.Scores
Jan.Scores
MarchScores
AprilScores
MayScores
JuneScores
60
50
Cor
rect
Pho
nem
es
Aimline

© 2005 Dynamic Measurement Group105
Evaluating Support Modify Instruction for Brandon Now?
10
20
30
40
Dec.Scores
Feb.Scores
Jan.Scores
MarchScores
AprilScores
MayScores
JuneScores
60
50
Cor
rect
Pho
nem
es
Aimline

© 2005 Dynamic Measurement Group106
Outcomes Driven Model
Identify Need for Support
Validate Need for Support
Plan Support
Evaluate Effectiveness of Support
Implement Support
Review Outcomes
Progress Monitoring
Benchmark Assessment
Benchmark Assessment

© 2005 Dynamic Measurement Group107
Step 5. Review Outcomes Systems Level
• What is a system?– Classroom, class, school, district, educational
agency, region, state• Key questions
– How is the curriculum/program working?– Who is the curriculum/program working for?– Are we doing better this year than last year?

108
Collecting Schoolwide Data

© 2003 Kameenui, Simmons, Coyne, & Harn 109
Developing a Plan To Collect Schoolwide Data
Areas Needing to be Considered When Developing A Plan:
1. Who will collect the data?
2. How long will it take?
3. How do we want to collect the data?
4. What materials does the school need?
5. How do I use the DIBELS Website?
6. How will the results be shared with the school?
More details are available in the document entitled “Approaches and Considerations of Collecting Schoolwide Early Literacy and
Reading Performance Data” in your supplemental materials

© 2003 Good, Harn, Kame'enui, Simmons & Coyne110
Who Will Collect the Data?
• At the school-level, determine who will assist in collecting the data– Each school is unique in terms of the resources
available for this purpose, but consider the following:• Teachers, Principals, educational assistants, Title 1 staff,
Special Education staff, parent volunteers, practicum
students, PE/Music Specialist Teachers
– The role of teachers in data collection:
• If they collect all the data, less time spent in teaching
• If they collect no data, the results have little meaning

© 2003 Kameenui, Simmons, Coyne, & Harn 111
How Do We Want to Collect Data?
• Common Approaches to Data Collection:
– Team Approach
– Class Approach
– Combination of the Class and Team
• Determining who will collect the data will impact the
approach to the collection

© 2003 Kameenui, Simmons, Coyne, & Harn 112
Team Approach
Who? A core group of people will collect all the data
– One or multiple day (e.g., afternoons)
Where Does it Take Place?
– Team goes to the classroom
– Classrooms go to the team (e.g., cafeteria, library)
Pros: Efficient way to collect and distribute results, limited instructional disruption
Cons: Need a team of people, place, materials, limited teacher involvement, scheduling of classrooms

© 2003 Kameenui, Simmons, Coyne, & Harn 113
Class Approach
Who? Teachers collect the data
Where Does it Take Place?
– The classroom
Pros: Teachers receive immediate feedback on student performance
Cons: Data collection will occur over multiple days, time taken away from instruction, organization of materials
© 2003 Kameenui, Simmons, Coyne, & Harn 114
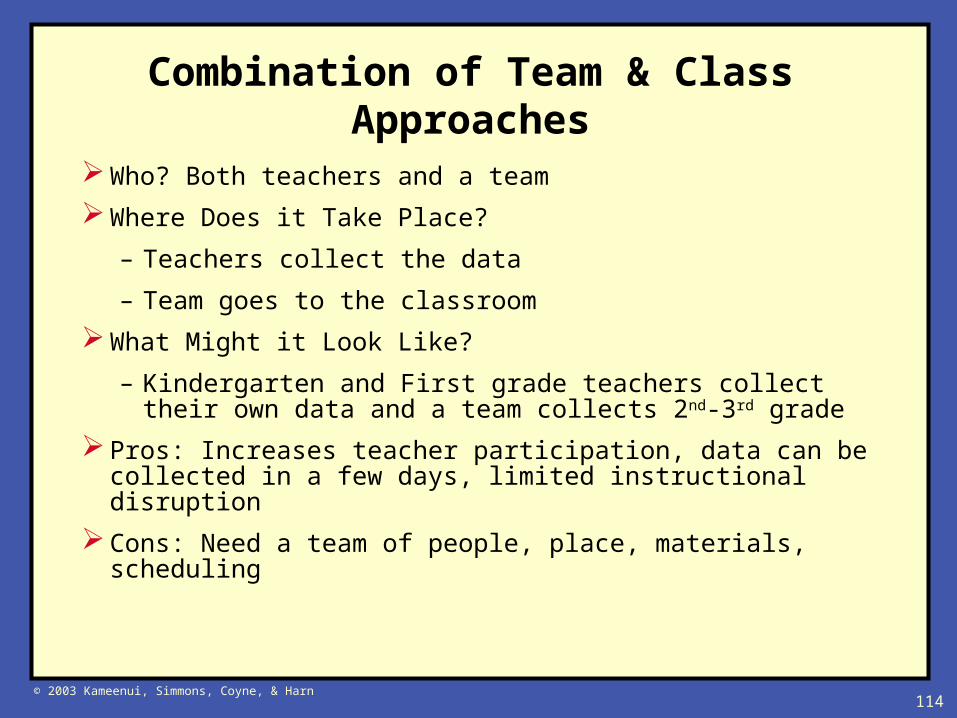
Combination of Team & Class Approaches
Who? Both teachers and a team
Where Does it Take Place?
– Teachers collect the data
– Team goes to the classroom
What Might it Look Like?
– Kindergarten and First grade teachers collect their own data and a team collects 2nd-3rd grade
Pros: Increases teacher participation, data can be collected in a few days, limited instructional disruption
Cons: Need a team of people, place, materials, scheduling

© 2003 Kameenui, Simmons, Coyne, & Harn 115
How Long Will It Take?Kindergarten
Time of Year /Measure(s)
ApproximateTime per Pupil
Number of Data Collectors
PupilsAssessed per
30 Minute Period
BeginningISF & LNF
4 min.
1 6-8
2 12-16
3 18-24
4-5 24-40
6-8 36-48
MiddleISF, LNF, PSF
6-7 min.
1 4-5
2 8-10
4-5 16-25
6-8 24-40
EndISF, LNF, PSF, & NWF
9 min.
1 3-4
2 6-8
4-5 12-20
6-8 18-32

© 2003 Kameenui, Simmons, Coyne, & Harn 116
How Long Will It Take?First Grade
Time of Year /Measure(s) Time per Pupil
Number of Data Collectors
PupilsAssessed per
30 Minute Period
BeginningLNF, PSF, & NWF
6-7 min.
1 4-5
2 8-10
4-5 16-25
6-8 24-40
MiddlePSF, NWF, &
ORF8-9 min.
1 3-4
2 6-8
4-5 12-20
6-8 18-32
End of YearNWF & ORF
7 min.
1 4-5
2 8-10
3 12-15
4-5 16-25
6-8 24-40

© 2003 Kameenui, Simmons, Coyne, & Harn 117
How Long Will it Take? Second & Third Grade
Measure Time per PupilNumber of Collectors
Pupils Assessed per 30 Minute
Period
ORF 5 min.
1 6-7
2 12-14
3 18-21
4-5 24-35
6-8 36-56

© 2003 Kameenui, Simmons, Coyne, & Harn 118
What Materials Does the School Need?
• DIBELS Materials– Benchmark booklets
• Color coding• Labeling
– Student stimulus materials • Binding, laminating, etc.
• Other Materials– Stopwatches– Pencils, clipboards– Class rosters
See document entitled “Approaches and Considerations of Collecting Schoolwide Early Literacy and Reading Performance Data” at
website: http://dibels.uoregon.edu/logistics/data_collection.pdf

© 2003 Kameenui, Simmons, Coyne, & Harn 119
How Do I Use the DIBELS Website?
Introduction
Data System
MeasuresDownloadBenchmarksGrade Level
Logistics
Sponsors
TrainersFAQContact
Information
http://dibels.uoregon.edu

© 2003 Kameenui, Simmons, Coyne, & Harn 120
Generating Reports• Two main types of
reports generated from DIBELS Website:– PDF Reports:
Downloadable reports designed for printing. The school and district PDF reports combine the most common reports into a single file.
– Web Reports: Individual reports designed for quick online viewing. Select the specific report you would like.
Enter/Edit Data
View/Create Reports
InterpretReports
Administrative Menu
MigrateStudents
System Status
FAQ
ManualContact
Information

© 2003 Kameenui, Simmons, Coyne, & Harn 121
Web Resources
Materials
– Administration and scoring manual
– All grade-level benchmark materials
– Progress monitoring materials for each measure (PSF, NWF, ORF, etc.)
Website
– Tutorial for training on each measure with video examples
– Manual for using the DIBELS Web Data Entry website
– Sample schoolwide reports and technical reports on the measures
Logistics
– Tips and suggestions for collecting schoolwide data (see website)

© 2003 Kameenui, Simmons, Coyne, & Harn 122
Objectives
1. Become familiar with the conceptual and research foundations
of DIBELS and IDEL
2. Understand how the big ideas of early literacy map onto DIBELS
and IDEL
3. Understand how to interpret DIBELS class list results
4. Become familiar with how to use DIBELS in an Outcomes-Driven
Model
5. Become familiar with methods of collecting DIBELS data