Embed Size (px)
Citation preview

1
Office of the DirectorDefense Research and Engineering
National Security Workforce Challenges: National Security Workforce Challenges: Current InitiativesCurrent Initiatives
National Security Workforce Challenges: National Security Workforce Challenges: Current InitiativesCurrent Initiatives
Presented by
Dr. Bill BerryDr. Bill BerryActing Deputy Under Secretary of Defense
(Laboratories and Basic Sciences)
15 January 2005

2
A National Issue
• “An Emerging and Critical Problem of the Science and Engineering Workforce”1
– 12 Major studies (1999-2004) make essentially the same point – A few studies did not consider security clearance needs and rely on
relaxation of immigration rules
• Growing need for U.S. citizens in national security activities
1. National Science Board Companion Paper to “National Science and Engineering Indicators 2004”, National Science Foundation, April 2004

3
U.S. College and University Graduates, 1966-2001
Degrees, all fields
S&E Degrees (excluding Engr Tech and Health/Med Sci)
U.S. Production of S&E Graduates*
0.0
0.5
1.0
1.5
1966 1971 1976 1981 1986 1991 1996 2001
Bac
cala
ure
ates
(M
illio
ns)
1994 2001
*Source: Data provided by the NSF, September 2003
Academic year ending in . . .
4
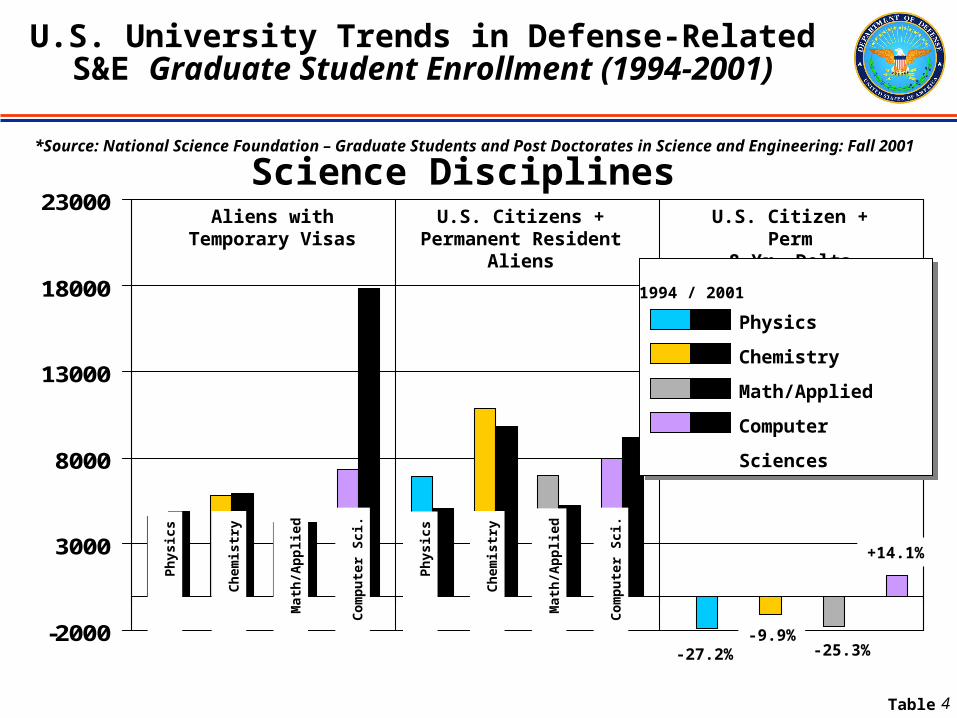
U.S. University Trends in Defense-Related S&E Graduate Student Enrollment (1994-2001)
-2000
3000
8000
13000
18000
23000Science Disciplines
Aliens with Temporary Visas
U.S. Citizens + Permanent Resident Aliens
U.S. Citizen + Perm8 Yr. Delta
-27.2%-9.9%
-25.3%
+14.1%
Ph
ysic
s
Ch
emis
try
Mat
h/A
pp
lied
Co
mp
ute
r S
ci.
Physics
Chemistry
Math/Applied
Computer Sciences
Physics
Chemistry
Math/Applied
Computer Sciences
1994 / 2001
Ph
ysic
s
Ch
emis
try
Mat
h/A
pp
lied
Co
mp
ute
r S
ci.
Table I-2
*Source: National Science Foundation – Graduate Students and Post Doctorates in Science and Engineering: Fall 2001

5
U.S. University Trends in Defense-Related S&E Graduate Student Enrollment (1994-2001)
-5000
0
5000
10000
15000
20000Engineering Disciplines
U.S. Citizens + Perm.Resident Aliens
U.S. Citizen + Perm8 Yr. Delta
Aliens with Temporary Visas
-26.2%
-18.9%
-21.7%
-33.0%
-32.1%
-29.7%
-24.7%
-49.1%Aer
osp
ace
Ch
emic
al
Ele
ctri
cal
En
gin
eeri
ng
Sci
ence
s
Ind
ust
rial
/M
fg.
Mec
han
ical
Met
allu
rgy/
Mat
eria
ls
Nu
clea
r
Aer
osp
ace
Ch
emic
al
Ele
ctri
cal
En
gin
eeri
ng
Sci
ence
sIn
du
stri
al/
Mfg
.
Mec
han
ical
Met
allu
rgy/
Mat
eria
ls
Nu
clea
r
Aerospace
Chemical
Electrical
Engineering Science
Industrial/Manufacturing
Mechanical
Metallurgical/Materials
Nuclear
Aerospace
Chemical
Electrical
Engineering Science
Industrial/Manufacturing
Mechanical
Metallurgical/Materials
Nuclear
1994 / 2001
Table III
*Source: National Science Foundation – Graduate Students and Post Doctorates in Science and Engineering: Fall 2001

6
DoD Scientists & Engineers (S&E)
• “Attrition” in DoD labs: ~13,000 Science, Math, Engineering and Technology (SMET) departures projected within 10 years
• The number of clearable students pursuing defense-related critical skills degrees is small and declining
• Projected U.S. demand for S&E’s will be up 10% by 2010 (Bureau of Labor Statistics 2001)– DoD will have tough competition for best S&Es– Linguist needs in Science & Technology (S&T) also beneficial

7
Source: Pre-release - OPM data for NSF pub, Table B-14. Federal scientists and engineers, by agency and major occupational group: 1999-2002
1999 2000 2001 2002 Total S&Es 44.2% 43.5% 43.1% 43.4% All sci 26.1% 25.4% 25.6% 26.9% Comp/Math sci 45.5% 43.9% 44.0% 45.3% Life sci 11.4% 11.2% 11.0% 10.9% Physical sci 26.7% 26.2% 26.1% 26.2% Social sci 20.4% 20.4% 19.7% 19.6% All eng 66.7% 66.4% 66.2% 66.7% Aerospace 44.7% 43.6% 43.0% 42.8% Chemical 62.3% 63.6% 65.7% 67.6% Civil 61.8% 61.3% 60.6% 60.1% EE&Comp 79.3% 79.1% 78.5% 79.1% Industrial 81.1% 80.2% 79.4% 79.4% Mechanical 88.2% 88.2% 88.4% 89.2% Other eng 54.6% 55.1% 55.5% 55.9%
DoD S&Es as % of Total Fed S&Es

8
DoD Civilian S&E’s
Current 50+ % ≥ 50
< BS 7586 2449 32.3%
BS 54673 15390 28.1%
MS 22515 9701 43.1%
Ph.D. 5777 3262 56.5%
Total 90551 30802 34.0%
All DoD Civilians in S&E Occupational Series
Source: DMDC Data for April, 2004

9
S&E Workforce Current Efforts Across DoD
Pre-college (K-12)
• Materials World Modules (Ray Pawlicki – Army)
• STARBASE – (Ernie Gonzales – OSD-RA)
• eCybermission – ( Kelly Stratchko – Army)
Undergraduate
─ Awards to Stimulate & Support Undergraduate Research Education (ASSURE) (with NSF; Koto White – AFOSR)
─ Research Assistantships in microelectronics (with Semiconductor Industries Association) (Dan Radack – DARPA)
─ Science, Mathematics and Research for Transformation (SMART)
(K. Thompson – DoD/Koto White - AFOSR)

10
Current S&E Workforce Efforts Across DoD
Graduate
• National Defense Science & Engineering Graduate Fellowships (NDSEG)
• Naval Research – Science and Technology for Americas Readiness (N-STAR – with NSF, Bob Kavetsky – Navy)
• SMART (Keith Thompson/Koto White – AFOSR)

11
SMART Program Components
Science, Mathematics and Research for Transformation
Congress Appropriated -- $2.5M FY 05• Undergraduate/Graduate – US Citizens• Critical Skills areas• Institution independent• 2 years support – to achieve degree
– Tuition, fees, books, lab expenses, room & board
• Satisfactory academic performance• Work payback required

12
DoD Outreach Initiatives
•‘Taking the Pentagon to the People’ Outreach Initiative•Technical Assistance Workshops•Leadership Symposiums•Student Expositions & Luncheons•Exhibitions
•Other DoD Sponsored events at Science & Engineer related conferences (WoC, Black Engineer, MAES, LULAC)
•Partnerships & Task Forces •Student Luncheons & Orientations•Symposiums•H.S. & College Student Information & Recruitment Booths
•DoD Laboratories & Centers of Excellence in Research

13
DoD Outreach Initiatives
•Student & Faculty Employment Programs•Student & Faculty Internships & Fellowships
•Paid & Volunteer •External Appointing Authorities/Programs (i.e. Outstanding Scholar, PMF)•Student Temporary Experience Program (STEP)•Student Career Experience Program (SCEP)•Summer Employment Programs•Workforce Recruitment Program for Students with Disabilities (WRP)•Disabled Veteran Employment Program•On-Site Campus Visits

14
Diversity in Context
US employment population in 2003
• Total Workforce 137,736 (K)
• 10.1% of total are SME Workforce (approx)
• 46.8% of total are Women• 17.1% of total are Minority
Source: Bureau of Labor Statistics
http://www.bls.gov/cps/cpsaat9.pdf
http://www.bls.gov/cps/cpsaat10.pdf

Information and Technology for Better Decision MakingMD DC
15 January 2005
Army34%
Navy45%
AirForce17%
Other DoD4%
What Were Sep 2004 Civilian S&T End Strengths?
Distribution* by DoD Component
Army 25,745 33.4%
Navy 34,868 45.2%
Air Force 13,420 17.4%
Other DoD 3,033 3.9%
77,066 S&T CIVILIANS ASSIGNED TO DoD
* May not add to 100.0% due to rounding
S&T WORKFORCE REPRESENTS 12% OF ALL DoD CIVILIANS

Information and Technology for Better Decision MakingMD DC
16 January 2005
39.734.1 34.2
54.8
39.5 36.5
53.6
32.330.236.9
0%
20%
40%
60%
80%
100%
Army Navy Air Force Other DoD Total
Females Make Up Two-Fifths of S&T Workforce
S&T Civilians
Total DoD Civilians
PERCENT FEMALE
Sep 2004 Distributionof DoD Civilian S&T Workforce

Information and Technology for Better Decision MakingMD DC
17 January 2005
19.5 20.3 18.123.8
19.827.3
31.7
23.328.127.4
0%
20%
40%
60%
80%
100%
Army Navy Air Force Other DoD Total
One-Fifth of S&T Workforce is Non-White
PERCENT NON-WHITE
Sep 2004 Distributionof DoD Civilian S&T Workforce
S&T Civilians
Total DoD Civilians

18
Critical Issues Remain
Keeping students on the Path
Capture them in the DoD and National Security Workforce
Attracting the “Underrepresented Majority” (women, minorities) to S&E careers

19
Backup

20
Awards to Stimulate & Support Undergraduate Research Education (ASSURE)
• Joint DoD/NSF undergraduate research program based on National Science Foundation Research Experiences for Undergraduates (REU) site program
• Support ~20 summer research sites in DoD relevant science and engineering (~10 students/site; avg. award 3 years; 8-10 weeks)
• Army, Air Force, & Navy representatives select sites for DoD funding
• Participants must be US citizens or permanent residents
• Encourages participation of women, underrepresented minorities, & students from institutions where research opportunities are limited
• Air Force is lead service for administering this program
• FY04 ASSURE budget: $4.5M

21
• Supports Army’s intent “to give back to the Nation”• Attracts an audience of children beyond math/science “stars”• Web-based adventure: team competition activities, games, puzzles with
solid learning points • Overview
• Web Based Competition – Team Effort• 6-9th Grade, 3-4 Student Teams + 1 Advisor• $500K in Prizes, ($2K-$5K/Team Member) Regional and National
eCYBERMISSIONShows Students that Math, Science and Technology can be
interesting and exciting

22
STARBASE
• Primarily At-Risk kids• 20 Classroom Hour experience
at DoD bases • 45+ sites in
28 states• Engaging
Scienceand Mathematics
• Grades 5-8

23
Secondary School Curriculum
Students complete a series of hands-on, inquiry-based activities in each module
Each module culminates in design challenges
Students simulate the work of scientists (through activities that foster inquiry) and engineers (through activities that emphasize design)
• Identify problem.• Propose design. • Build and test
prototype • Based on results,
redesignproduct.
• Identify question.• Propose explanation. • Create and perform
experiment • Based on results,
refine explanation
Goal: Functional productGoal: Working explanation
Design cycleInquiry cycle
EngineeringScience
MS&E: National Security and the MS&E: National Security and the WorkforceWorkforce
Northwestern University Materials World Modules (MWM)
Pedagogy integrates Inquiry and Design

24
Troops to TeachersBackground
Began in 1994 as transition assistance program Financial aid for 2 years (FY 94 & 95) Provided placement assistance from FY 96 - 01 Defense Authorization Bill of 2000 moved
responsibility to Dept of Education “No Child Left Behind Act of 2001” provides financial assistance, extends program thru FY 06

25
• Recruit quality teachers for schools serving low-income families
• Help relieve teacher shortages, primarily in Math, Science, & Special Ed
• Assist military personnel in moving to second careers in K-12, public school teaching
Troops to Teachers
Program Purpose
"America’s school "America’s school children need children need you’’you’’Laura Bush, First Lady of the United States

26
Where “Troops” Teach
401+ (4)201 - 400 (5)101 - 200 (9)51 - 100 (9)26 - 50 (9)0 - 25 (15)

27
Minority Hires Compared to All Teachers
0
20
40
60
80
100
Public SchoolTeachers
Troops toTeachers
Minority
Majority
10%
90%
58%
42%
*NEA Report - Status of the American Public School Teacher 2000-2001
28
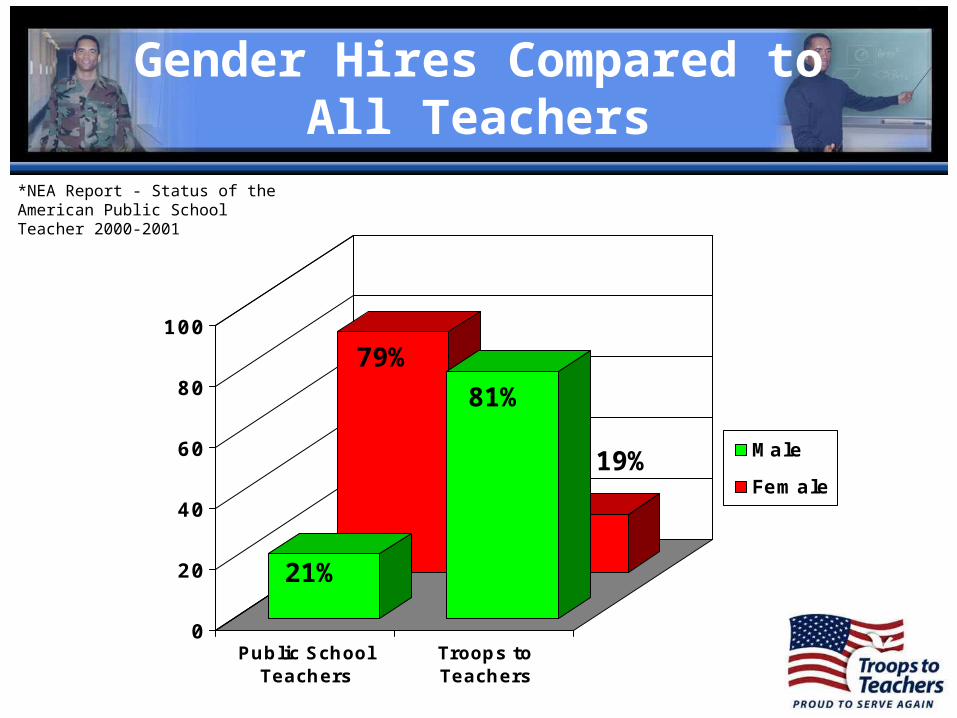
Gender Hires Compared to All Teachers
0
20
40
60
80
100
Public SchoolTeachers
Troops toTeachers
Male
Female
21%
79%
81%
19%
*NEA Report - Status of the American Public School Teacher 2000-2001

29
“Troops” TeachingMath & Science
Incomplete data (~7500 “Troops” Teaching)
• ~25% (1750) of the “Troops” are teaching Math & Science (all levels)
• ~50% M&S “Troop” Teachers are Minority
• Most of them are Male