Embed Size (px)
Citation preview

1
Office of the City ManagerJanuary 28, 2011
Fiscal Outlook PresentationFiscal Outlook Presentation

2
AgendaAgenda
Economic EnvironmentEconomic Environment
State Budget UpdateState Budget Update
City RevenuesCity Revenues
General Fund Operating ExpendituresGeneral Fund Operating Expenditures
Expenditure PressuresExpenditure Pressures
Solutions for Restoring FundingSolutions for Restoring Funding

3
Economic EnvironmentEconomic Environment
Economy improving, but Economy improving, but slow recovery to lower slow recovery to lower basebase
Unemployment remains Unemployment remains highhigh
Housing market Housing market stabilizing but vulnerablestabilizing but vulnerable

4
State Budget UpdateState Budget Update
Governor’s Proposed Budget Governor’s Proposed Budget $14 billion in revenue solutions $14 billion in revenue solutions $12.5 billion in cuts$12.5 billion in cuts
Potential elimination of RDAsPotential elimination of RDAs
Staff continuously monitoring for changesStaff continuously monitoring for changes

5
City RevenuesCity Revenues
Property TaxProperty Tax
Sales tax Sales tax
Development-related revenues Development-related revenues
Transient Occupancy Tax Transient Occupancy Tax
Recovery Recovery already plannedalready planned into the budget into the budget

6
General Fund General Fund Operating ExpendituresOperating Expenditures
FY 2010/2011Current Budget
FY 2010/2011Actuals thru
AP7% of
Budget
Public SafetyPublic Safety $70,431,620 $36,939,760 52.45%
Public WorksPublic Works $12,045,397 $5,448,554 45.23%
FinanceFinance $7,803,601 $3,849,902 49.33%
Community ServicesCommunity Services $8,536,314 $4,491,298 52.61%
LibraryLibrary $7,394,377 $3,632,199 49.12%
Community Community
DevelopmentDevelopment$5,122,945 $2,630,367 51.34%
Office of City ManagerOffice of City Manager $3,914,222 $1,903,307 48.63%
Human ResourcesHuman Resources $3,459,362 $1,610,467 46.55%
Office of City AttorneyOffice of City Attorney $1,632,720 $679,548 41.62%
TOTAL:TOTAL: $120,340,558 $61,185,402 50.84%
*
* Includes $560K for Salary Increase Budget Mod

7
Expenditure PressuresExpenditure PressuresRising Employee CompensationRising Employee Compensation
$0.0
$20.0
$40.0
$60.0
$80.0
$100.0
$120.0
$ M
illi
on
s
Non-Personnel Costs
General FundSalaries & Benefits

Pension Costs vs. Sales Tax Pension Costs vs. Sales Tax RevenueRevenue
FY 02/03 FY 06/07 FY 10/11 (Est)Pension % of GF Revenues 8% 14% 19%
$30.9
$22.8
$25.4
$17.6
$7.0
$21.6
$0.0
$5.0
$10.0
$15.0
$20.0
$25.0
$30.0
$35.0
$40.0
99/0
001
/02
03/0
405
/06
07/0
809
/10
11/1
2 (E
st)
13/1
4 (E
st)
$ M
illi
on
s
Sales Tax Revenue
GF Pension Costs

9
Expenditure PressuresExpenditure Pressures Future CalPERS RatesFuture CalPERS Rates
Potential interest rate changePotential interest rate change• 7.75% to 7.5%7.75% to 7.5%
Significant cost increaseSignificant cost increase• 3.8% for Safety - $1.3M3.8% for Safety - $1.3M• 2.3% for Miscellaneous - $1.4M2.3% for Miscellaneous - $1.4M
Board to decide in February or MarchBoard to decide in February or March
Staff evaluating long-term rates and impactStaff evaluating long-term rates and impact

10
Expenditure PressuresExpenditure Pressures
Unfunded Building/Infrastructure NeedsUnfunded Building/Infrastructure Needs $2M annual funding set-aside removed from $2M annual funding set-aside removed from
FY 2004/05 budgetFY 2004/05 budget Without that cut, there would be $14M more Without that cut, there would be $14M more
available nowavailable now
No funds set aside for existing building No funds set aside for existing building infrastructureinfrastructure

11
Expenditure PressuresExpenditure Pressures
Deteriorating street/roadway conditionsDeteriorating street/roadway conditions Pavement Condition Index (PCI) decrease Pavement Condition Index (PCI) decrease
from 85 (2006) to 75 (2010)from 85 (2006) to 75 (2010) Current annual funding = $3.1MCurrent annual funding = $3.1M
PCI of 80 -> optimal cost/benefit for PCI of 80 -> optimal cost/benefit for maintenance maintenance To get back to 80: extra $2.5M / yr (5 yrs)To get back to 80: extra $2.5M / yr (5 yrs) To maintain: extra $750K / yr (ongoing)To maintain: extra $750K / yr (ongoing)

12
Expenditure PressuresExpenditure Pressures
High Cost of Deferred MaintenanceHigh Cost of Deferred Maintenance Could have spent an additional $3.8M in last 5 Could have spent an additional $3.8M in last 5
years to maintain PCI at 80years to maintain PCI at 80 Restoring PCI to 80 will now cost $12.5MRestoring PCI to 80 will now cost $12.5M Cost of 5 year delay = $8.7MCost of 5 year delay = $8.7M
Continued PCI drops will result in major costsContinued PCI drops will result in major costs Costs increase exponentiallyCosts increase exponentially $19.5M for major overlay and restoration in $19.5M for major overlay and restoration in
5 years if no additional funding added 5 years if no additional funding added

13
Addressing Street & Addressing Street & Infrastructure DeficienciesInfrastructure Deficiencies
Pay Me Now or Pay Me Later Every year of delay increases total cost to fix
Funding Needed = $100M over 20 years $42M short-term (first 10 yrs)
Infrastructure $25M, Streets $17M $58M long-term (second 10 yrs)
Infrastructure $47.5M, Streets $10.5MInfrastructure $47.5M, Streets $10.5M

14
A Solution for Restoring A Solution for Restoring FundingFunding
Two-tier pension + 2% PERS contribution = Two-tier pension + 2% PERS contribution = $47M over 20 years$47M over 20 years Safety: 3% @ 55Safety: 3% @ 55 Misc: 2% @ 55Misc: 2% @ 55
Salary Increases =$56M over 20 yearsSalary Increases =$56M over 20 years : 0% in FYs 2012/13 and 2013/14: 0% in FYs 2012/13 and 2013/14
Holding BSF to $8M balanceHolding BSF to $8M balance
= $103M total
15
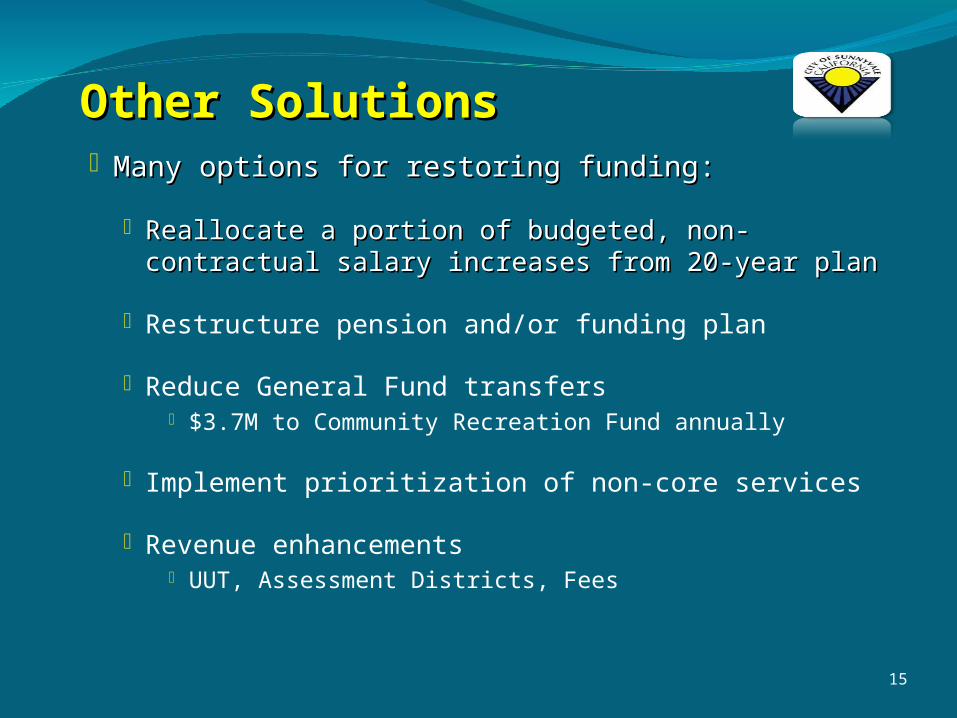
Many options for restoring funding:Many options for restoring funding:
Reallocate a portion of budgeted, non-contractual Reallocate a portion of budgeted, non-contractual salary increases from 20-year plansalary increases from 20-year plan
Restructure pension and/or funding plan
Reduce General Fund transfers $3.7M to Community Recreation Fund annually
Implement prioritization of non-core services
Revenue enhancements UUT, Assessment Districts, Fees
Other SolutionsOther Solutions