Embed Size (px)
Citation preview
1 of 8 © Boardworks Ltd 2014
2 of 8 © Boardworks Ltd 2014
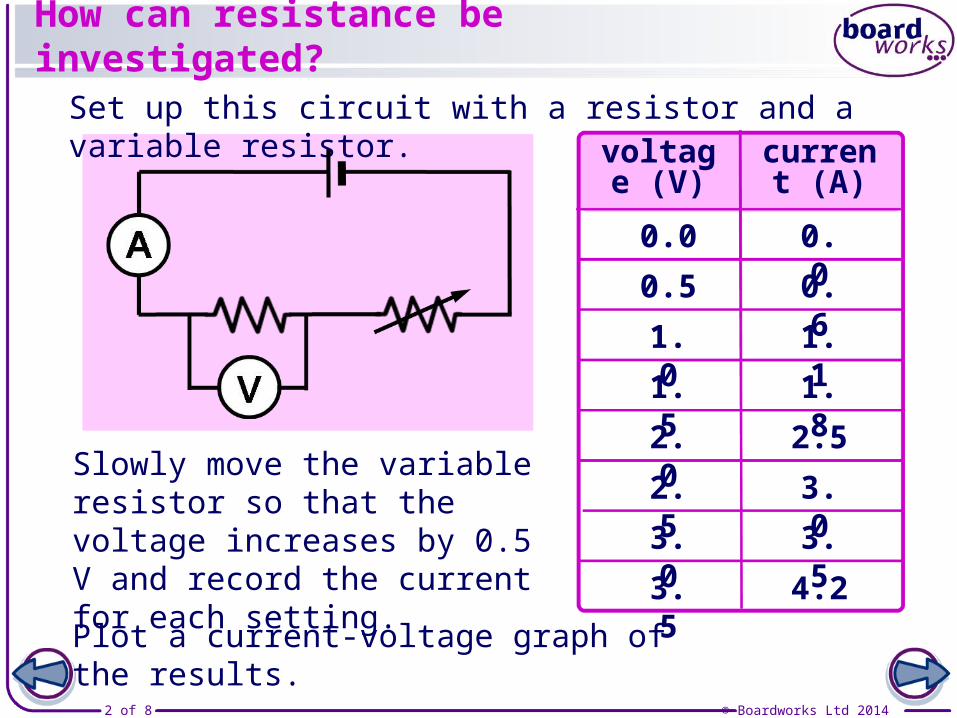
Set up this circuit with a resistor and a variable resistor.
Slowly move the variable resistor so that the voltage increases by 0.5 V and record the current for each setting.
Plot a current-voltage graph of the results.
How can resistance be investigated?
voltage (V)
0.0
0.6
1.1
1.8
2.5
3.0
3.5
4.2
0.0
0.5
1.0
1.5
2.5
2.0
3.0
3.5
current (A)
3 of 8 © Boardworks Ltd 2014
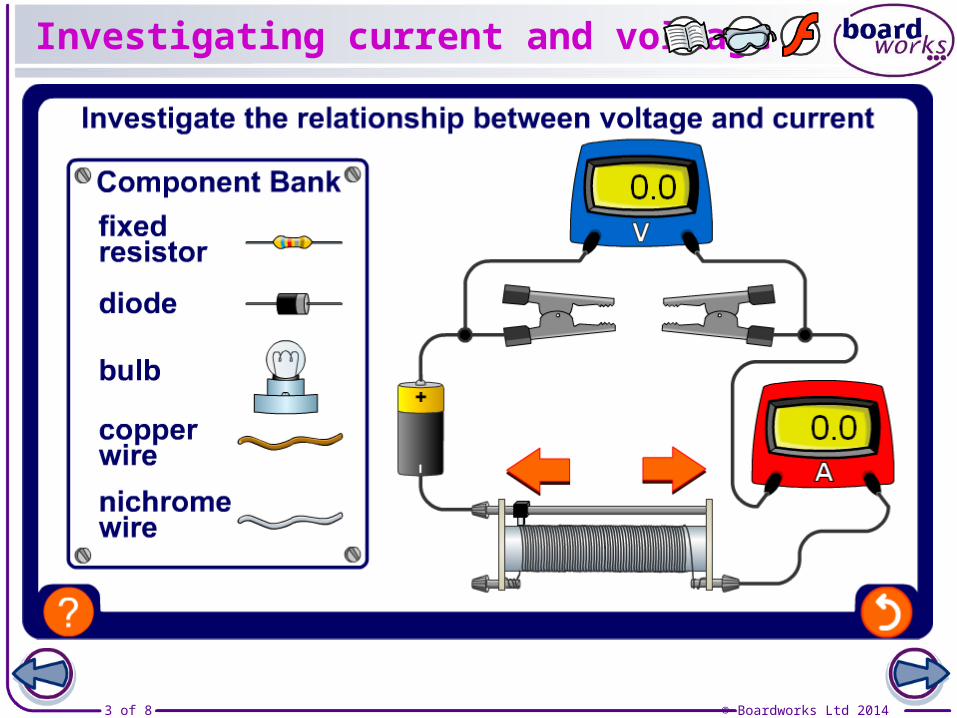
Investigating current and voltage
4 of 8 © Boardworks Ltd 2014
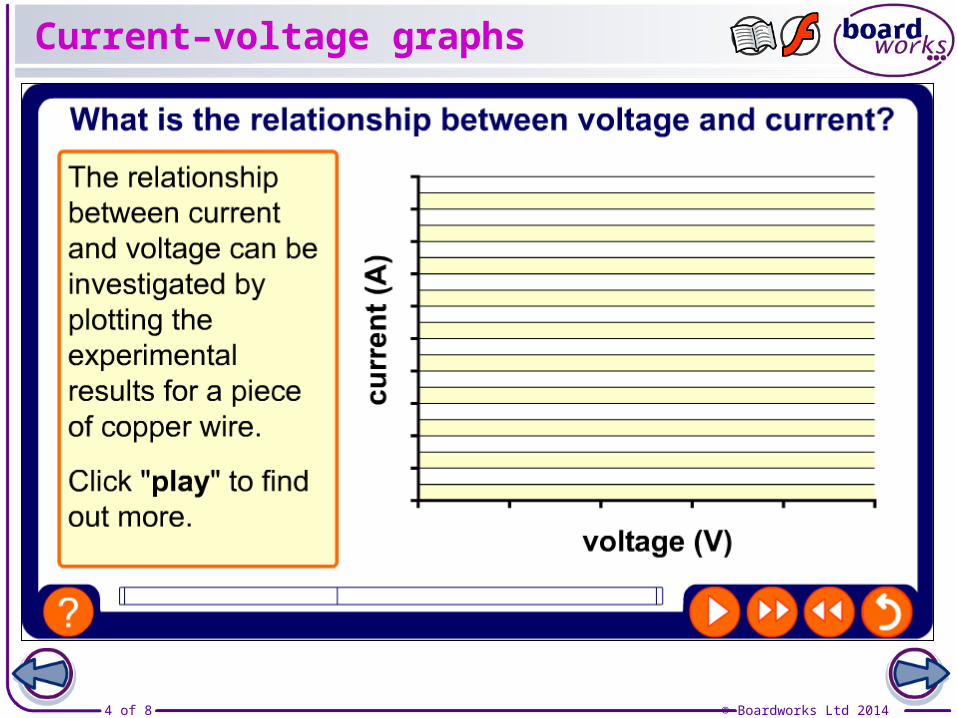
Current–voltage graphs
5 of 8 © Boardworks Ltd 2014
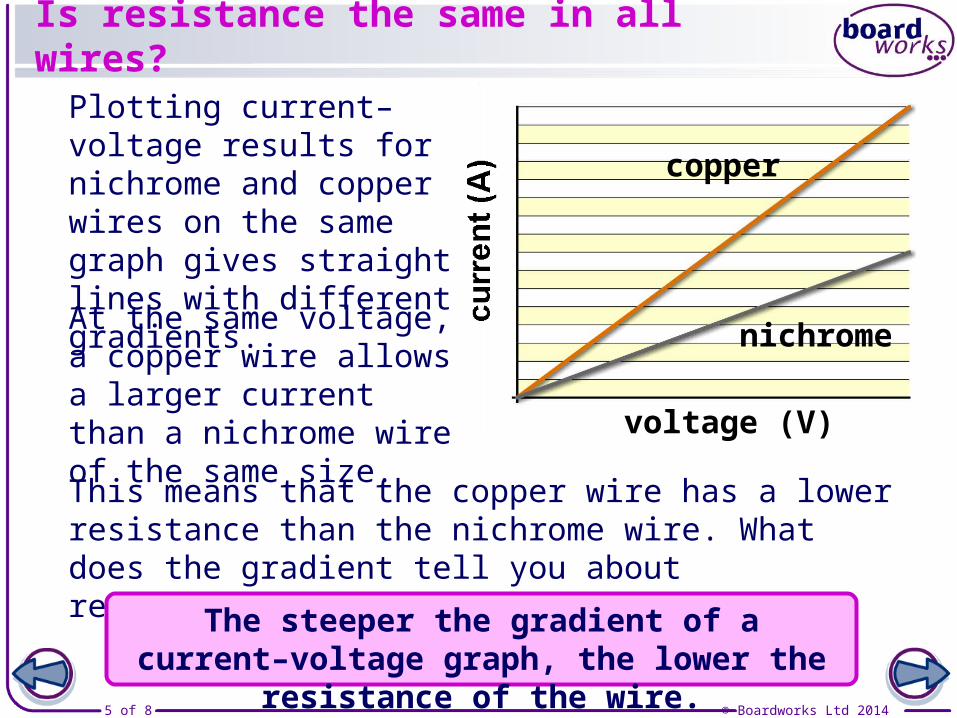
Plotting current–voltage results for nichrome and copper wires on the same graph gives straight lines with different gradients.
At the same voltage, a copper wire allows a larger current than a nichrome wire of the same size.
nichrome
copper
This means that the copper wire has a lower resistance than the nichrome wire. What does the gradient tell you about resistance?
voltage (V)
The steeper the gradient of a current–voltage graph, the lower the resistance of the wire.
Is resistance the same in all wires?
6 of 8 © Boardworks Ltd 2014
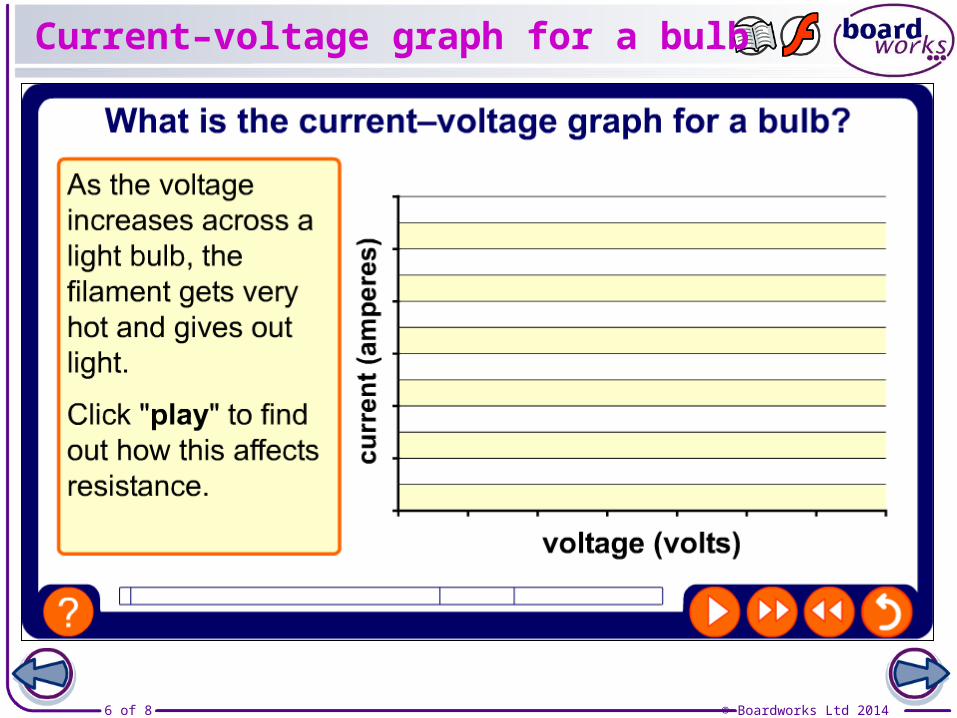
Current–voltage graph for a bulb
7 of 8 © Boardworks Ltd 2014
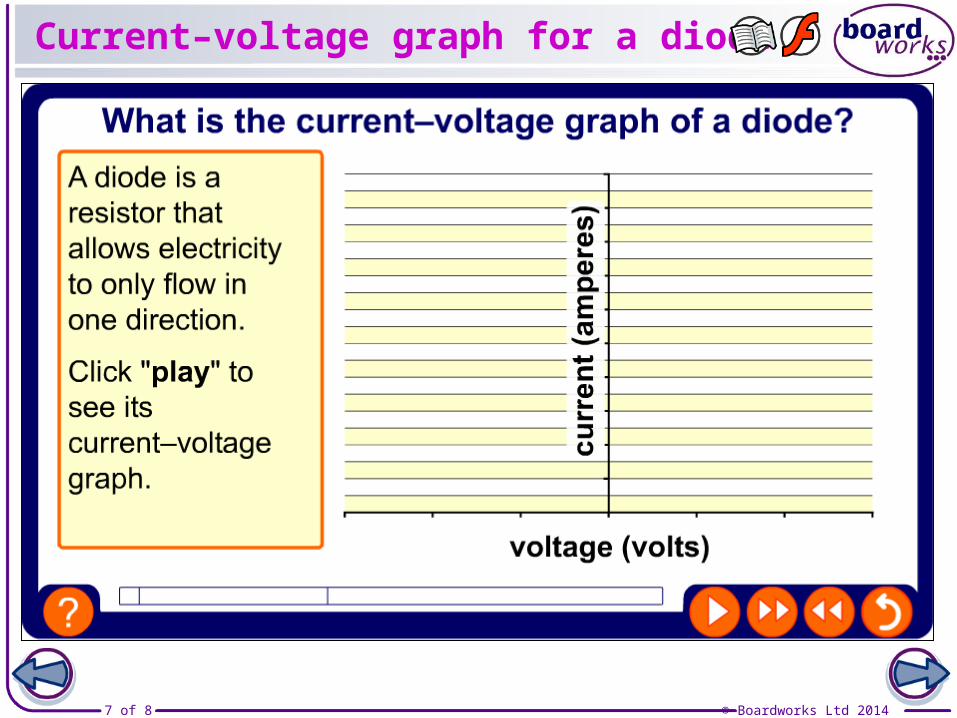
Current–voltage graph for a diode
8 of 8 © Boardworks Ltd 2014
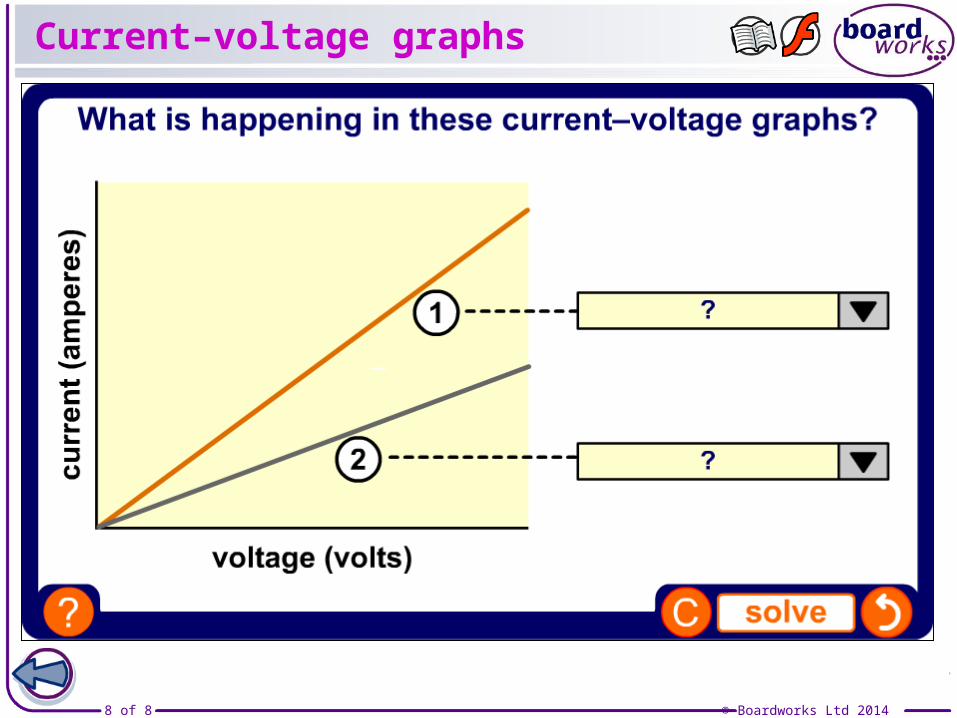
Current–voltage graphs