Embed Size (px)
Citation preview
1
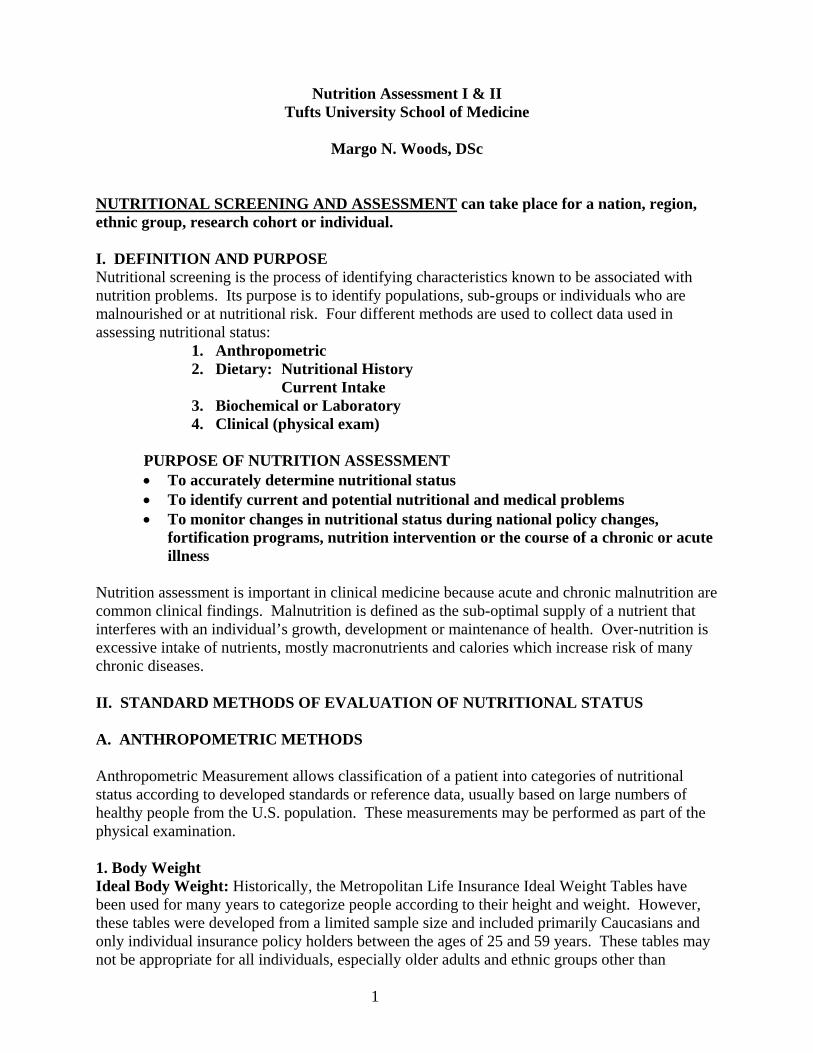
Nutrition Assessment I & II Tufts University School of Medicine
Margo N. Woods, DSc
NUTRITIONAL SCREENING AND ASSESSMENT can take place for a nation, region, ethnic group, research cohort or individual. I. DEFINITION AND PURPOSE Nutritional screening is the process of identifying characteristics known to be associated with nutrition problems. Its purpose is to identify populations, sub-groups or individuals who are malnourished or at nutritional risk. Four different methods are used to collect data used in assessing nutritional status:
1. Anthropometric 2. Dietary: Nutritional History
Current Intake 3. Biochemical or Laboratory 4. Clinical (physical exam)
PURPOSE OF NUTRITION ASSESSMENT • To accurately determine nutritional status • To identify current and potential nutritional and medical problems • To monitor changes in nutritional status during national policy changes,
fortification programs, nutrition intervention or the course of a chronic or acute illness
Nutrition assessment is important in clinical medicine because acute and chronic malnutrition are common clinical findings. Malnutrition is defined as the sub-optimal supply of a nutrient that interferes with an individual’s growth, development or maintenance of health. Over-nutrition is excessive intake of nutrients, mostly macronutrients and calories which increase risk of many chronic diseases. II. STANDARD METHODS OF EVALUATION OF NUTRITIONAL STATUS A. ANTHROPOMETRIC METHODS
Anthropometric Measurement allows classification of a patient into categories of nutritional status according to developed standards or reference data, usually based on large numbers of healthy people from the U.S. population. These measurements may be performed as part of the physical examination. 1. Body Weight Ideal Body Weight: Historically, the Metropolitan Life Insurance Ideal Weight Tables have been used for many years to categorize people according to their height and weight. However, these tables were developed from a limited sample size and included primarily Caucasians and only individual insurance policy holders between the ages of 25 and 59 years. These tables may not be appropriate for all individuals, especially older adults and ethnic groups other than

2
Caucasians. They also made age-specific allowances and suggested it was desirable to gain weight with aging. Body composition measures indicated that an increase in weight was usually due to an increase in fat mass (FM) and a decrease in lean mass (LM). Recently, the United States Department of Agriculture and the Department of Health and Human Services established an expert committee to develop the new comprehensive Desirable Weight Tables. Their recommendation reports a wider range of acceptable body weight and does not differentiate by sex. See below.
Table 1: Desirable Body Weight Table
HEIGHTa WEIGHT IN POUNDSb
4’10” 91-119 4’11” 94-124 5’0” 97-128 5’1” 101-132 5’2” 104-137 5’3” 107-141 5’4” 111-146 5’5” 114-150 5’6” 118-155 5’7” 121-160 5’8” 125-164 5’9” 129-169 5’10” 132-174 5’11” 136-179 6’0” 140-184 6’1” 144-189 6’2” 148-195 6’3” 152-200 6’4” 156-205 6’5” 160-211 6’6” 164-216
______________________________________________________________________________ *Higher weights in the range generally apply to men, who tend to have more muscle mass and bone weight. aHeight without shoes bWeight without clothes Source: 1995 Dietary Guidelines for Americans. U.S. Department of Agriculture and the Department of Health and Human Services. There is a general “rule of thumb” for estimation of Ideal Body Weight (IBM) for males and females. Males: 106 lbs. for first 5 feet in height plus 6 lbs. for each additional inch Females: 100 lbs. for first 5 feet in height plus 5 lbs. for each additional inch
3
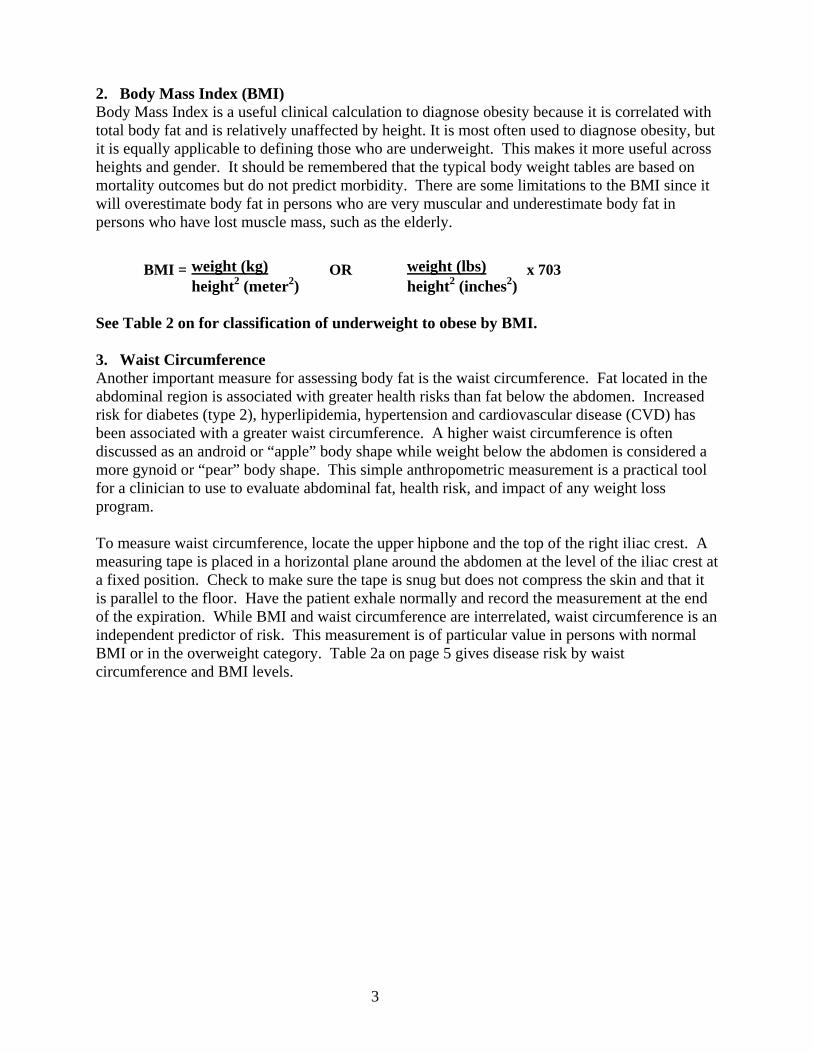
2. Body Mass Index (BMI) Body Mass Index is a useful clinical calculation to diagnose obesity because it is correlated with total body fat and is relatively unaffected by height. It is most often used to diagnose obesity, but it is equally applicable to defining those who are underweight. This makes it more useful across heights and gender. It should be remembered that the typical body weight tables are based on mortality outcomes but do not predict morbidity. There are some limitations to the BMI since it will overestimate body fat in persons who are very muscular and underestimate body fat in persons who have lost muscle mass, such as the elderly.
BMI = weight (kg) OR weight (lbs) x 703 height2 (meter2) height2 (inches2)
See Table 2 on for classification of underweight to obese by BMI. 3. Waist Circumference Another important measure for assessing body fat is the waist circumference. Fat located in the abdominal region is associated with greater health risks than fat below the abdomen. Increased risk for diabetes (type 2), hyperlipidemia, hypertension and cardiovascular disease (CVD) has been associated with a greater waist circumference. A higher waist circumference is often discussed as an android or “apple” body shape while weight below the abdomen is considered a more gynoid or “pear” body shape. This simple anthropometric measurement is a practical tool for a clinician to use to evaluate abdominal fat, health risk, and impact of any weight loss program. To measure waist circumference, locate the upper hipbone and the top of the right iliac crest. A measuring tape is placed in a horizontal plane around the abdomen at the level of the iliac crest at a fixed position. Check to make sure the tape is snug but does not compress the skin and that it is parallel to the floor. Have the patient exhale normally and record the measurement at the end of the expiration. While BMI and waist circumference are interrelated, waist circumference is an independent predictor of risk. This measurement is of particular value in persons with normal BMI or in the overweight category. Table 2a on page 5 gives disease risk by waist circumference and BMI levels.

4
Table 2: Body Mass Index Table - National Heart Lung and Blood Institute; http://www.nhlbi.nih.gov
5
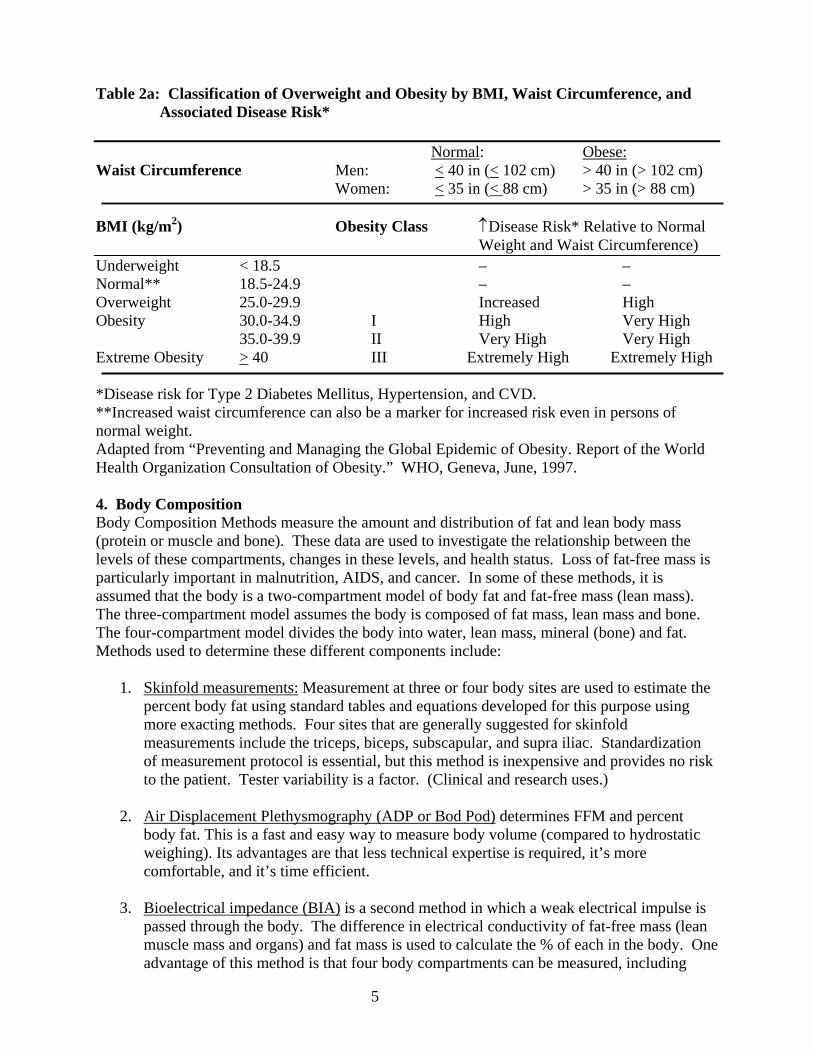
Table 2a: Classification of Overweight and Obesity by BMI, Waist Circumference, and Associated Disease Risk* Normal: Obese: Waist Circumference Men: < 40 in (< 102 cm) > 40 in (> 102 cm) Women: < 35 in (< 88 cm) > 35 in (> 88 cm) BMI (kg/m2) Obesity Class ↑Disease Risk* Relative to Normal Weight and Waist Circumference) Underweight < 18.5 – – Normal** 18.5-24.9 – – Overweight 25.0-29.9 Increased High Obesity 30.0-34.9 I High Very High 35.0-39.9 II Very High Very High Extreme Obesity > 40 III Extremely High Extremely High *Disease risk for Type 2 Diabetes Mellitus, Hypertension, and CVD. **Increased waist circumference can also be a marker for increased risk even in persons of normal weight. Adapted from “Preventing and Managing the Global Epidemic of Obesity. Report of the World Health Organization Consultation of Obesity.” WHO, Geneva, June, 1997.
4. Body Composition Body Composition Methods measure the amount and distribution of fat and lean body mass (protein or muscle and bone). These data are used to investigate the relationship between the levels of these compartments, changes in these levels, and health status. Loss of fat-free mass is particularly important in malnutrition, AIDS, and cancer. In some of these methods, it is assumed that the body is a two-compartment model of body fat and fat-free mass (lean mass). The three-compartment model assumes the body is composed of fat mass, lean mass and bone. The four-compartment model divides the body into water, lean mass, mineral (bone) and fat. Methods used to determine these different components include:
1. Skinfold measurements: Measurement at three or four body sites are used to estimate the percent body fat using standard tables and equations developed for this purpose using more exacting methods. Four sites that are generally suggested for skinfold measurements include the triceps, biceps, subscapular, and supra iliac. Standardization of measurement protocol is essential, but this method is inexpensive and provides no risk to the patient. Tester variability is a factor. (Clinical and research uses.)
2. Air Displacement Plethysmography (ADP or Bod Pod) determines FFM and percent
body fat. This is a fast and easy way to measure body volume (compared to hydrostatic weighing). Its advantages are that less technical expertise is required, it’s more comfortable, and it’s time efficient.
3. Bioelectrical impedance (BIA) is a second method in which a weak electrical impulse is
passed through the body. The difference in electrical conductivity of fat-free mass (lean muscle mass and organs) and fat mass is used to calculate the % of each in the body. One advantage of this method is that four body compartments can be measured, including
6
body cell mass (BCM), fat mass (FM), extracellular tissue (ECT), and fat-free mass (FFM). The analyzer is inexpensive, portable and convenient for use in a clinical setting. This method may be useful in the elderly who usually lose lean body mass and in patients with HIV/AIDS. Results may be affected by a patient’s hydration status, so it is important that the patient is well hydrated, fasted for > 4 hr, and has had no exercise in previous 12 hours. (Clinical and research uses)
4. Dual-energy x-ray absorptiometry (DEXA) is a more recent method based on the
different densities of fat mass, lean mass and bone. It is more exact than BIA and can determine % bone, lean and fat mass plus its regional distribution. It has the advantage of being safe (low radiation dose) and being relatively fast (20-35 minutes) but is used mainly in research or to diagnose osteoporosis. It is more expensive than the other methods. It is limited by the patient’s size (must fit length and width into the scanning field) (Clinical and research uses)
5. Total Body Water: Water is normally the largest component of the human body. It
composes approximately 50%-60% of the weight of the adult body. As much as 80%-90% of the weight of neonates is water. Because all the water in the body is in the fat-free mass, a measure of the total body water (TBW) should allow calculation of total body fat using some derived equations. (Used in research)
6. Total Body Potassium: More than 90% of all the body’s potassium is located within fat-
free tissues (as an intracellular cation) and 0.012% of all potassium is the naturally occurring potassium-40 isotope, which emits a very small yet detectable amount of high-energy gamma radiation. Using a very sensitive detector, the level of gamma radiation emitted from subject can be determined. The process takes approximately 30 minutes and requires expensive equipment. Computers aid in providing rapid data processing. (Used in research)
Population Values on Body Composition of % Body Fat: Tables below provide percentile values for percent body fat in men and women and appear in the American College of Sports Medicine “Guidelines for Exercise Testing and Prescription,” Sixth Edition (or see URL: http://www.acsm-msse.org). The values reflect a selected population. The exact percent body fat value associated with an increased health risk has yet to be determined. It is now recognized that an increase in body fat with age is not an inevitable aspect of aging. Rather, this reflects a decrease in exercise often without a decrease in caloric intake. (The 90th percentile means that 90% of the study population had body fat values above this percentage.) Table 3-A: Body Composition (% Body Fat) for Men* (US Population) *Data provided by the Institute of Aerobics Research, Dallas, TX (1994). Study population for the data set was predominately white and college educated. The following may be used as descriptors for the percentile rankings: much better than average (90th), average (50th), and much worse than average (10th). Table 3-B: Body Composition (% Body Fat) for Women* *Data provided by the Institute of Aerobics Research, Dallas, TX (1994). Study population for the data set was predominately white and college educated. The following may be used as

7
descriptors for the percentile rankings: much better than average (90), average (50), and much worse than average (10). 5. Growth Charts For Children - Height and Weight Tables by Age (US reference population)
The National Center for Health Statistics (NCHS) has developed growth charts for comparing the size of an infant or child with other infants or children in the United States of comparable age and sex. The charts allow comparisons based on weight for age, length or stature for age, weight for length or stature, and head circumference for age. Charts have been developed for both males and females for two age intervals: birth to 36 months and 2 to 18 years. The values displayed in the charts are called “reference data” rather than “standards.” Reference data represent a cross-sectional description of a population and describe “what is.” Standards on the other hand, describe “what should be” and imply that the values are “ideals” or “goals” associated with maximum health and longevity. Growth charts are discussed in the lecture on Infant and Child Nutrition. SUMMARY In summary, there are many different types of anthropometric measurements that may be useful in medicine but the basic measurements that should always be carried out are:
• WEIGHT OR CHANGE IN WEIGHT • BMI (USING HEIGHT AND WEIGHT) • WAIST CIRCUMFERENCE
In INFANTS AND CHILDREN, length or height, weight and head circumference should be plotted on:
• GROWTH CHARTS The National Center for Health Statistics released new, revised growth charts in the spring of 2000. See Infant and Child Nutrition Lecture
B. DIETARY ASSESSMENT: COLLECTION AND EVALUATION
Nutritional history and current dietary intake data provide information on a population’s, group’s, or individual’s nutritional status and identify potential nutritional problems.
The purpose of collecting dietary intake data: a. National Health Monitoring
1.) Provide data on the nutritional intake of a population over time and to compare sub-population groups. Used to determine national policy for nutritional interventions or programs and monitor progress of nutritional programs.
b. Research
1.) Carry out epidemiological studies to investigate the relationship between dietary intake and development of disease.

8
2.) Track nutrition intervention programs in research populations to determine effectiveness of intervention protocols.
c. Patient Care (Clinical Setting)
1.) Identify patients at risk for nutritional problems. 2.) Identify patients who would benefit from changes in dietary habits to prevent
chronic disease. 3.) Track effectiveness of a therapeutic nutrition intervention.
Five Main Methods to Collect Data on Dietary Intake: • Nutritional History • 1-7 Day Food Record • 24-Hour Recall • “Usual” Daily Intake • Food Frequency Questionnaire (FFQ)
Nutritional History The first step in collecting data on the nutritional status of a patient is to obtain information on past diet and nutritional habits. This is generally collected during the taking of a Medical History. Questions on nutritional history are typically collected during the medical history phase or social history phase of the medical interview. Most texts list 10-20 typical questions that might be asked to obtain a complete Nutritional History, however, the questions will vary by the information and clues you obtain in the general interview and on the patient’s medical problems. Below are 5 generic questions that are most pertinent to every adult patient you will see. Nutritional History Questions:
1. Have you gained or lost more than 5 pounds over the last year? (Intentional or unintentional?)
2. How many meals do you eat a day? How many snacks? 3. Have you in the past or are you currently following any “special” diet? (If yes, which
ones and why?) 4. Are there any foods or groups of foods that you dislike, avoid or are allergic to? 5. Are you taking any vitamin/mineral supplements or dietary supplements
(herbals/food replacement products)? (If yes, which ones and why?) In addition: If CHRONIC DISEASE appears in the patient’s own or their family’s medical history, expand your inquiries to explore food intake for nutritional risk factors for these diseases. These nutritional risk factors will be covered under the individual topics of obesity, cardiovascular disease, hypertension, diabetes and cancer. Develop an awareness of factors of concern for specific populations to focus on in the interview. NUTRITIONAL ISSUES BY AGE GROUP
9
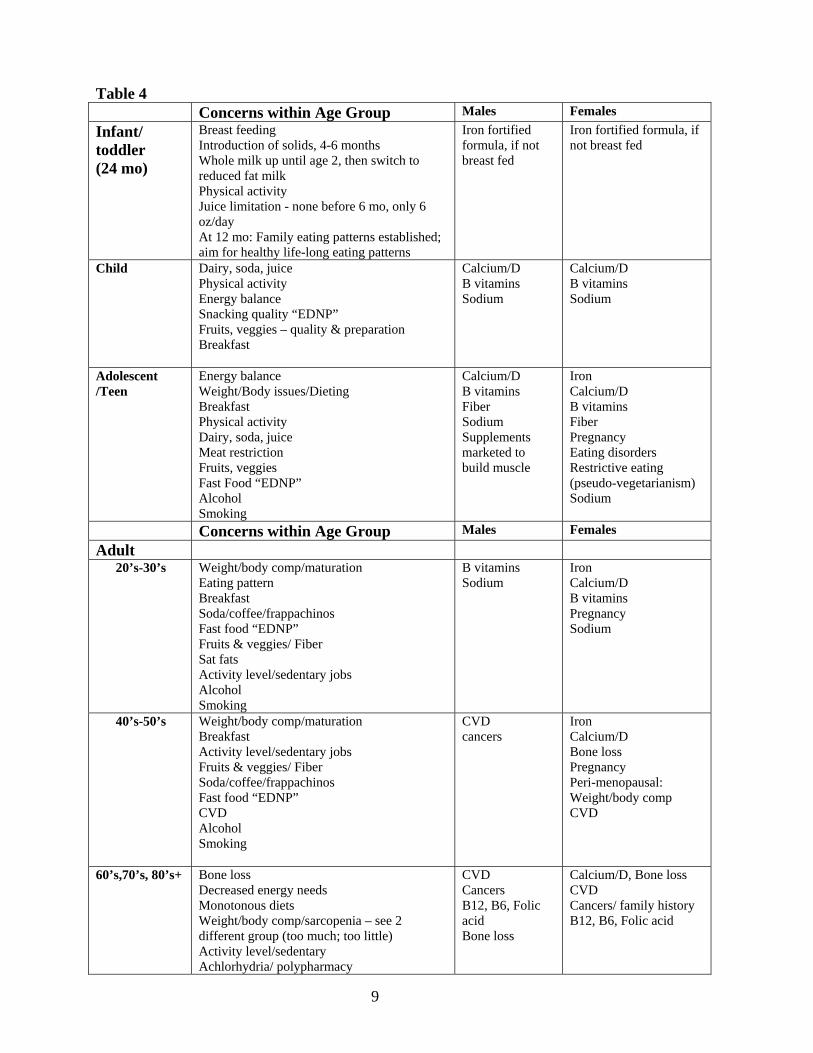
Table 4 Concerns within Age Group Males Females Infant/ toddler (24 mo)
Breast feeding Introduction of solids, 4-6 months Whole milk up until age 2, then switch to reduced fat milk Physical activity Juice limitation - none before 6 mo, only 6 oz/day At 12 mo: Family eating patterns established; aim for healthy life-long eating patterns
Iron fortified formula, if not breast fed
Iron fortified formula, if not breast fed
Child Dairy, soda, juice Physical activity Energy balance Snacking quality “EDNP” Fruits, veggies – quality & preparation Breakfast
Calcium/D B vitamins Sodium
Calcium/D B vitamins Sodium
Adolescent /Teen
Energy balance Weight/Body issues/Dieting Breakfast Physical activity Dairy, soda, juice Meat restriction Fruits, veggies Fast Food “EDNP” Alcohol Smoking
Calcium/D B vitamins Fiber Sodium Supplements marketed to build muscle
Iron Calcium/D B vitamins Fiber Pregnancy Eating disorders Restrictive eating (pseudo-vegetarianism) Sodium
Concerns within Age Group Males Females Adult 20’s-30’s Weight/body comp/maturation
Eating pattern Breakfast Soda/coffee/frappachinos Fast food “EDNP” Fruits & veggies/ Fiber Sat fats Activity level/sedentary jobs Alcohol Smoking
B vitamins Sodium
Iron Calcium/D B vitamins Pregnancy Sodium
40’s-50’s Weight/body comp/maturation Breakfast Activity level/sedentary jobs Fruits & veggies/ Fiber Soda/coffee/frappachinos Fast food “EDNP” CVD Alcohol Smoking
CVD cancers
Iron Calcium/D Bone loss Pregnancy Peri-menopausal: Weight/body comp CVD
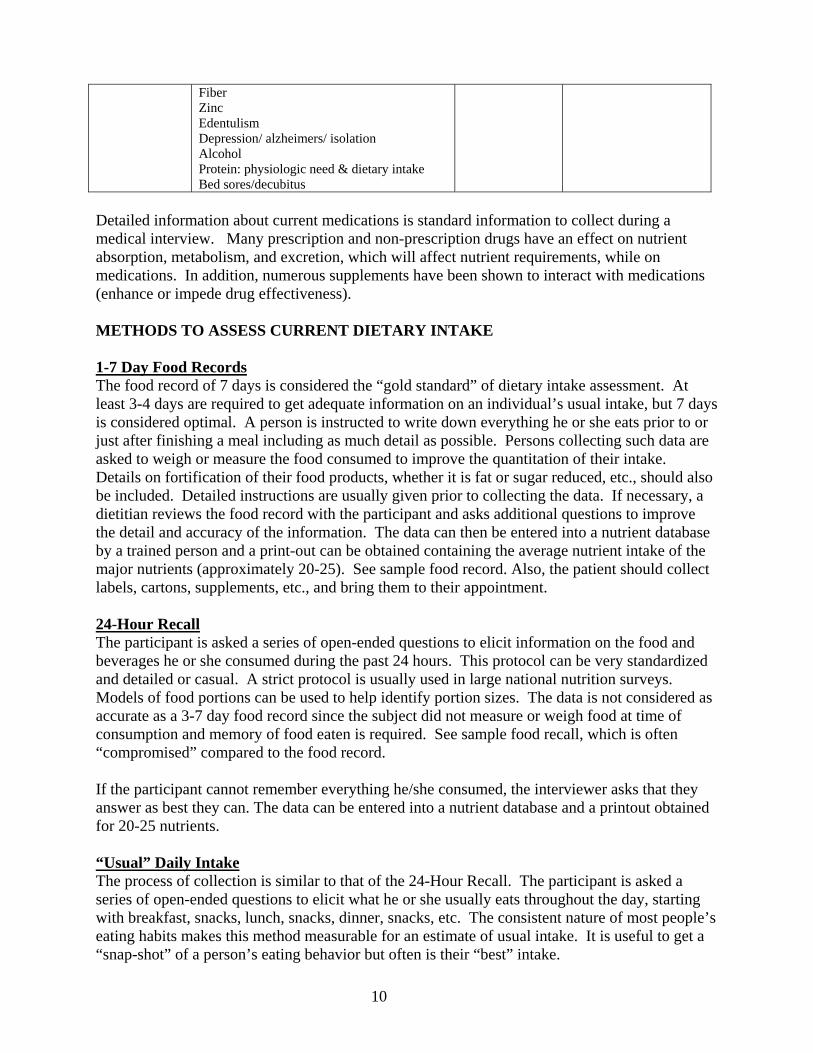
60’s,70’s, 80’s+ Bone loss Decreased energy needs Monotonous diets Weight/body comp/sarcopenia – see 2 different group (too much; too little) Activity level/sedentary Achlorhydria/ polypharmacy
CVD Cancers B12, B6, Folic acid Bone loss
Calcium/D, Bone loss CVD Cancers/ family history B12, B6, Folic acid
10
Fiber Zinc Edentulism Depression/ alzheimers/ isolation Alcohol Protein: physiologic need & dietary intake Bed sores/decubitus
Detailed information about current medications is standard information to collect during a medical interview. Many prescription and non-prescription drugs have an effect on nutrient absorption, metabolism, and excretion, which will affect nutrient requirements, while on medications. In addition, numerous supplements have been shown to interact with medications (enhance or impede drug effectiveness). METHODS TO ASSESS CURRENT DIETARY INTAKE 1-7 Day Food Records The food record of 7 days is considered the “gold standard” of dietary intake assessment. At least 3-4 days are required to get adequate information on an individual’s usual intake, but 7 days is considered optimal. A person is instructed to write down everything he or she eats prior to or just after finishing a meal including as much detail as possible. Persons collecting such data are asked to weigh or measure the food consumed to improve the quantitation of their intake. Details on fortification of their food products, whether it is fat or sugar reduced, etc., should also be included. Detailed instructions are usually given prior to collecting the data. If necessary, a dietitian reviews the food record with the participant and asks additional questions to improve the detail and accuracy of the information. The data can then be entered into a nutrient database by a trained person and a print-out can be obtained containing the average nutrient intake of the major nutrients (approximately 20-25). See sample food record. Also, the patient should collect labels, cartons, supplements, etc., and bring them to their appointment. 24-Hour Recall The participant is asked a series of open-ended questions to elicit information on the food and beverages he or she consumed during the past 24 hours. This protocol can be very standardized and detailed or casual. A strict protocol is usually used in large national nutrition surveys. Models of food portions can be used to help identify portion sizes. The data is not considered as accurate as a 3-7 day food record since the subject did not measure or weigh food at time of consumption and memory of food eaten is required. See sample food recall, which is often “compromised” compared to the food record. If the participant cannot remember everything he/she consumed, the interviewer asks that they answer as best they can. The data can be entered into a nutrient database and a printout obtained for 20-25 nutrients. “Usual” Daily Intake The process of collection is similar to that of the 24-Hour Recall. The participant is asked a series of open-ended questions to elicit what he or she usually eats throughout the day, starting with breakfast, snacks, lunch, snacks, dinner, snacks, etc. The consistent nature of most people’s eating habits makes this method measurable for an estimate of usual intake. It is useful to get a “snap-shot” of a person’s eating behavior but often is their “best” intake.
11
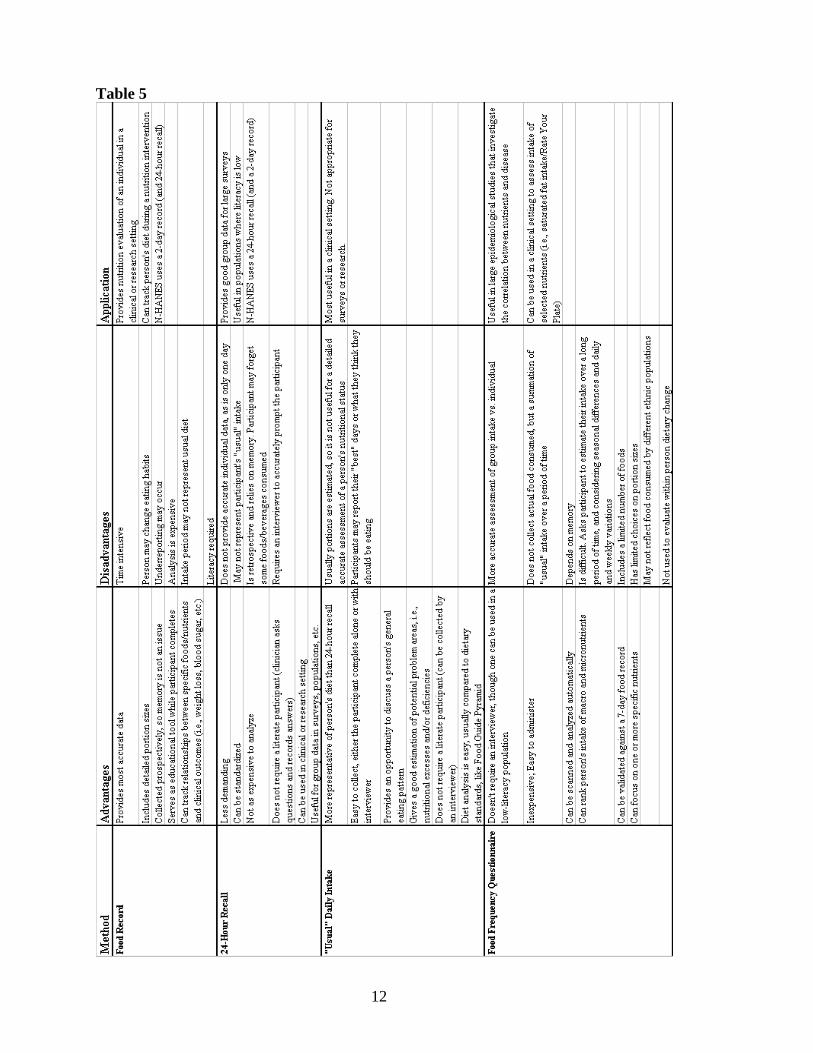
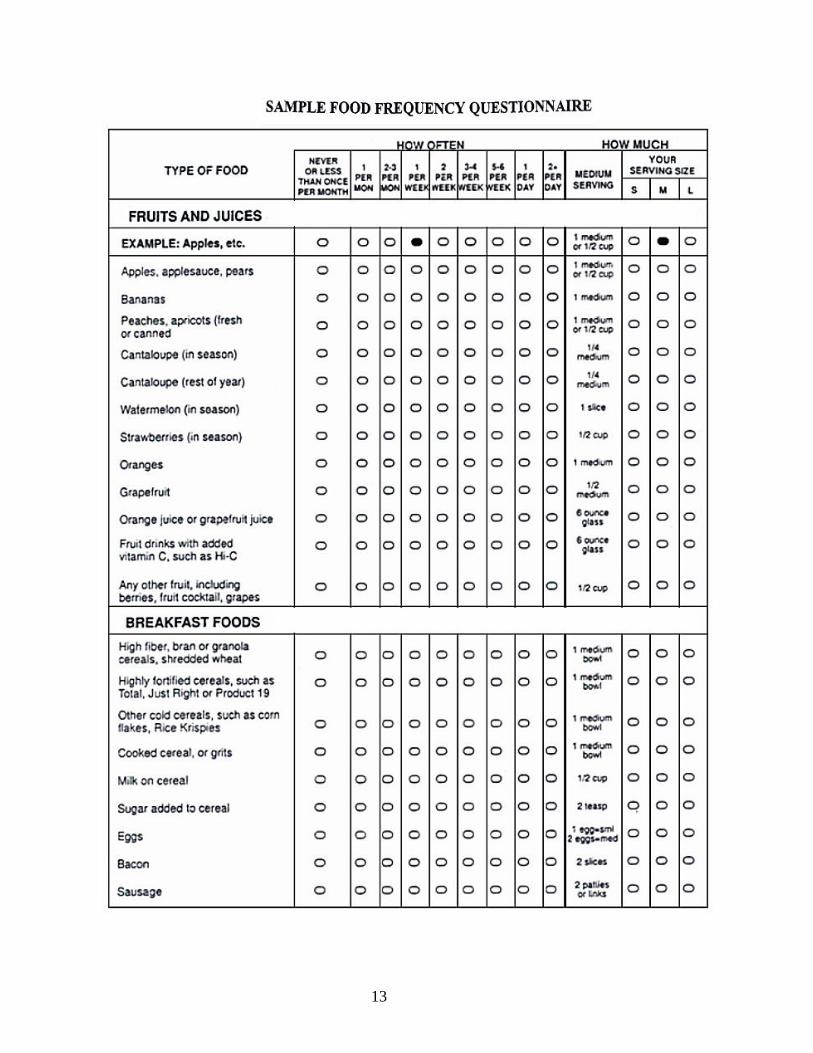
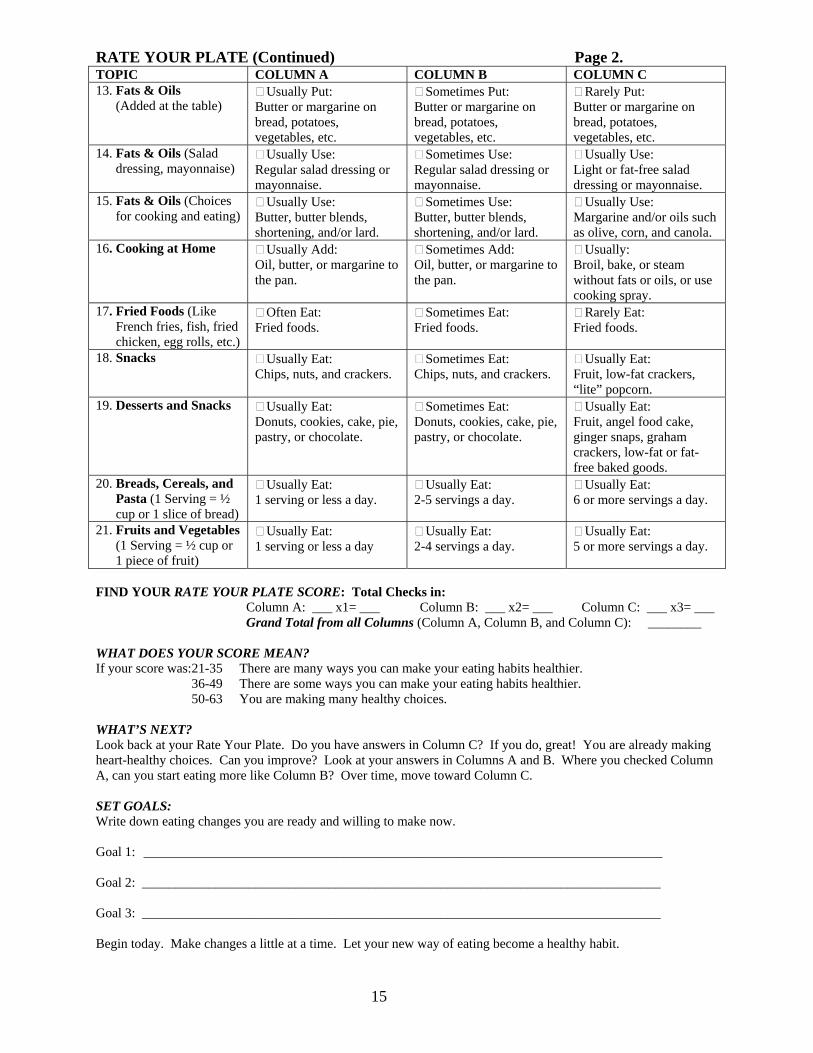
Food Frequency Questionnaire (FFQ) This instrument was designed for research purposes to standardize the collection of dietary intake data for large epidemiological studies. It can have from 60-120 food/beverage items that it queries a person on regarding type of foods eaten. If a full nutrient analysis is sought, foods are grouped by categories. The participant has a limited number of options that involve the frequency of consumption of this food or group of foods. Choices are given in frequency per day, week or month, or never. Foods included in the questionnaire represent the foods that contribute significantly to nutrient intake in our “standard” population. It is not as appropriate for ethnic populations. A category on portion size (small, medium, large) is often asked along with the food item with the measurement that is considered medium. See “Sample Food Frequency Questionnaire.” (p. 13) Short Food Frequency Questionnaire Abbreviated food frequency questionnaires have been developed for special purposes such as estimating usual calcium intake to determine risk of osteoporosis or to estimate fat intake for determining risk of CVD. See “Rate Your Plate” (RYP) food frequency questionnaire as an example to estimate intake of saturated fat and levels of risk for CVD. The RYP is used in many clinics to help patients make changes in their diet. Table 5. The Advantages and Disadvantages of each dietary collection method. (p.12)
12
Table 5
13

14
RATE YOUR PLATE (Specialized Clinical FFQ) HOW TO FILL OUT THIS FORM: 1. Start with Topic 1 – Meat. Read across columns A, B, & C. Find the best description of the way you usually eat. 2. Put a checkmark in the box next to that answer. 3. Put a checkmark in column A, B, or C for each topic on the form. TOPIC COLUMN A COLUMN B COLUMN C 1. Meat* *If vegetarian, check Column C
Usually Eat: High-fat cuts, such as ribs, regular hamburger, T-bone steak, prime rib, sausage.
Usually Eat: Lean beef cuts, such as round, loin, and extra-lean hamburger, lean lamb and pork cuts, such as loin, leg, and veal.
Always Eat: Lean cuts. Or, I rarely eat meat.
2. Poultry: Chicken, Turkey, etc.* *If vegetarian, check Column C
Usually Eat: Chicken, turkey, and other poultry with skin.
Sometimes Eat: Chicken, turkey, and other poultry with skin.
Usually Eat: Chicken, turkey, and other poultry without skin.
3. Fish and Shellfish* *If vegetarian, check Column C
Usually Eat: Fish or shellfish less than once a week.
Usually Eat: Fish or shellfish once a week.
Usually Eat: Fish or shellfish twice a week or more.
4. Cold Cuts, Hot Dogs, etc.* *If vegetarian, check Column C
Usually Eat: Bacon, sausage, salami, bologna, other cold cuts, or hot dogs.
Sometimes Eat: Bacon, sausage, salami, bologna, other cold cuts, or hot dogs.
Usually Eat: Roast beef, turkey breast, ham, or 90% fat-free cold cuts. Or, I rarely eat processed meats.
5. Serving Sizes Usually Eat: Large portions (7 oz or more) of cooked meat, chicken, seafood, and cold cuts.
Usually Eat: Medium portions (4-6 oz) of cooked meat, chicken, seafood, and cold cuts.
Usually Eat: Small portions (3 oz or less) of cooked meat, chicken, seafood, and cold cuts.
6. Meatless Meals (Like all-bean chili, meatless spaghetti sauce, vegetable pizza)
Rarely Eat: Meatless meals.
Usually Eat: Meatless meals less than twice a week.
Usually Eat: Meatless meals twice a week or more.
7. Frozen and Packaged Meals (Like TV dinners, frozen pizza, meal helpers)
Usually Eat: Regular frozen dinners and/or packaged meals.
Sometimes Eat: Regular frozen dinners and/or packaged meals.
Usually Eat: Lower fat frozen and/or packaged meals. Or, I rarely eat frozen or packaged meals.
8. Eggs Usually Eat: 7 or more eggs a week.
Usually Eat: 5-6 eggs a week.
Usually Eat: 4 eggs or less a week. Or, I usually eat choleste-rol-free egg substitute.
9. Milk Usually Use: Whole milk or cream.
Usually Use: 2% low-fat milk.
Usually Use: 1% low-fat or skim milk.
10. Cheese (Choices) Usually Eat: Regular cheese, such as cheddar, Swiss, and American.
Sometimes Eat: Regular cheese, such as cheddar, Swiss, and American.
Usually Eat: Reduced-fat or part-skim cheese. Or, I rarely eat cheese.
11. Cheese (Serving Size) Usually Eat: 3 oz. or more when I eat cheese.
Usually Eat: 2 oz. when I eat cheese.
Usually Eat: 1 oz. or less of cheese. Or, I rarely eat cheese.
12. Frozen Desserts Usually Eat: Regular ice cream, ice cream bars, or ice cream sandwiches.
Sometimes Eat: Regular ice cream, ice cream bars, or ice cream sandwiches.
Usually Eat: Sherbet, Low-fat frozen yogurt, ice milk, or sorbet. Or, I rarely eat frozen desserts.
15
RATE YOUR PLATE (Continued) Page 2. TOPIC COLUMN A COLUMN B COLUMN C 13. Fats & Oils (Added at the table)
Usually Put: Butter or margarine on bread, potatoes, vegetables, etc.
Sometimes Put: Butter or margarine on bread, potatoes, vegetables, etc.
Rarely Put: Butter or margarine on bread, potatoes, vegetables, etc.
14. Fats & Oils (Salad dressing, mayonnaise)
Usually Use: Regular salad dressing or mayonnaise.
Sometimes Use: Regular salad dressing or mayonnaise.
Usually Use: Light or fat-free salad dressing or mayonnaise.
15. Fats & Oils (Choices for cooking and eating)
Usually Use: Butter, butter blends, shortening, and/or lard.
Sometimes Use: Butter, butter blends, shortening, and/or lard.
Usually Use: Margarine and/or oils such as olive, corn, and canola.
16. Cooking at Home Usually Add: Oil, butter, or margarine to the pan.
Sometimes Add: Oil, butter, or margarine to the pan.
Usually: Broil, bake, or steam without fats or oils, or use cooking spray.
17. Fried Foods (Like French fries, fish, fried chicken, egg rolls, etc.)
Often Eat: Fried foods.
Sometimes Eat: Fried foods.
Rarely Eat: Fried foods.
18. Snacks Usually Eat: Chips, nuts, and crackers.
Sometimes Eat: Chips, nuts, and crackers.
Usually Eat: Fruit, low-fat crackers, “lite” popcorn.
19. Desserts and Snacks Usually Eat: Donuts, cookies, cake, pie, pastry, or chocolate.
Sometimes Eat: Donuts, cookies, cake, pie, pastry, or chocolate.
Usually Eat: Fruit, angel food cake, ginger snaps, graham crackers, low-fat or fat-free baked goods.
20. Breads, Cereals, and Pasta (1 Serving = ½ cup or 1 slice of bread)
Usually Eat: 1 serving or less a day.
Usually Eat: 2-5 servings a day.
Usually Eat: 6 or more servings a day.
21. Fruits and Vegetables (1 Serving = ½ cup or 1 piece of fruit)
Usually Eat: 1 serving or less a day
Usually Eat: 2-4 servings a day.
Usually Eat: 5 or more servings a day.
FIND YOUR RATE YOUR PLATE SCORE: Total Checks in:
Column A: ___ x1= ___ Column B: ___ x2= ___ Column C: ___ x3= ___ Grand Total from all Columns (Column A, Column B, and Column C): ________ WHAT DOES YOUR SCORE MEAN? If your score was: 21-35 There are many ways you can make your eating habits healthier.
36-49 There are some ways you can make your eating habits healthier. 50-63 You are making many healthy choices.
WHAT’S NEXT? Look back at your Rate Your Plate. Do you have answers in Column C? If you do, great! You are already making heart-healthy choices. Can you improve? Look at your answers in Columns A and B. Where you checked Column A, can you start eating more like Column B? Over time, move toward Column C. SET GOALS: Write down eating changes you are ready and willing to make now. Goal 1: ______________________________________________________________________________ Goal 2: ______________________________________________________________________________ Goal 3: ______________________________________________________________________________ Begin today. Make changes a little at a time. Let your new way of eating become a healthy habit.

16
Below find a comparison of Quality of Data from Food Record versus Recall Method FOOD RECORD
Level of Detail Provided by a 1-Day Food Diary Recorded Throughout the Day (note: brand names removed) Sample Day for Bob: Food Record 5’7” 195 lbs BMI: 30.6 (Class I obese) Age: 30 Breakfast: Snack: Puffed Rice cereal, 2 cups Cranberry Juice, 12 oz. (1 ½ cups) Whole Milk, vitamin A and D fortified, 1 cup Cheese Melt: White Toast, 2 Slices Cheddar cheese, 1 ½ oz. Soft Tub Margarine, 2 tsp. Pita, 1 small Cranberry Juice, 12 oz. (1 ½ cups) Snack: Dinner: Strawberry fruit and nut snack bar, 1 bar Baked pork chop, 4 oz. trimmed of fat Steak fries, 1 ½ cups (about 10 fries) Lunch: Summer squash, 1 cup Turkey bologna sandwich: 1 12-ounce beer, light
White Bread, 2 slices Turkey bologna, 3 ½ oz Evening snack: Mustard, 2 tsp Light vanilla ice cream, 1 cup Mayonnaise, light Kraft, 2 Tbs. Iceberg Lettuce, 1 leaf Sliced Tomato, 1 slice
Dill Pickle Potato chips, large bag, 5 inches, 1 oz. Whole Milk, vitamin A&E fortified, 1 cup Example of Data Lost (Specificity and Quantification) Through Recall Method Bob’s Recall (collected by a dietitian) Breakfast: Lunch Cont.: Puffed Rice, medium bowl (~1 ½ cups) Mayonnaise, average amount (1-2 tsp) Whole Milk, 1 glass (~6-8 oz.), type unknown Lettuce, 1-2 leaves White bread toast, 2 slices, brand unknown Sliced Tomato, medium etc… Mayonnaise, (1-2 tsp. on each slice), type unknown
Cranberry juice, large glass (10-12 oz.) Lunch: Turkey bologna sandwich:
White Bread, 2 slices medium size Turkey bologna, (~1” high on sandwich Mustard, small amount (1-2 tsp)

17

18
Analysis of Dietary Intake Data from a Food Record or 24-hour Recall Using Nutrient Levels of Common Foods
Evaluation of dietary data is dependent on knowing the nutrient content of the most common foods. The U.S. Department of Agriculture (USDA) is responsible for carrying out the determinations of the nutrient content of our food supply and making the information available to the public. The task is enormous and our current level of knowledge concerning dietary intake would not be possible without this work. It is the basic information that makes the analysis of food records, recall and food frequency questionnaires possible. Knowledge of the nutrient content of foods is also the basis for nutrient food labeling and standards for food companies.
The USDA publishes these nutrient values of foods in specific handbooks. They are also available on the web at http://www.nal.usda.gov/fnic/foodcomp/search. Evaluation of dietary intake can be most easily accomplished by using one of a variety of computer programs that are based on this data. The nutrient database that is used in the analysis of the students’ food records at Tufts is the new government website http://www.mypyramid.gov. The research level database used by many researchers at Tufts and elsewhere, is the University of Minnesota Nutrition Data Center (NDC) database. The database has over 6,000 items and includes many name brand items. Updates are prepared every year in order to keep up with a changing food industry.
Issues: • All dietary intake data depends on the validity of the food analysis data provided by U.S.
Department of Agriculture plus some specific published food analyses in peer-reviewed journals. • Nutrient food levels are known to vary from year to year, place to place, etc. A sampling method
is used to average out much of the variation. • Methods of cooking and handling can influence nutrient content. The nutrient database often
gives you options on preparation methods and also provides choices for raw and cooked foods. • Analysis gives the amount of nutrients in the food not the amount of the nutrient that is absorbed,
which can vary from person to person. • Data are available on standard vitamin/mineral supplements, but there is tremendous variability in
micronutrient components and bioavailability by product. C. BIOCHEMICAL/LABORATORY DETERMINATIONS
Background: Micronutrient intake and assessing adequacy
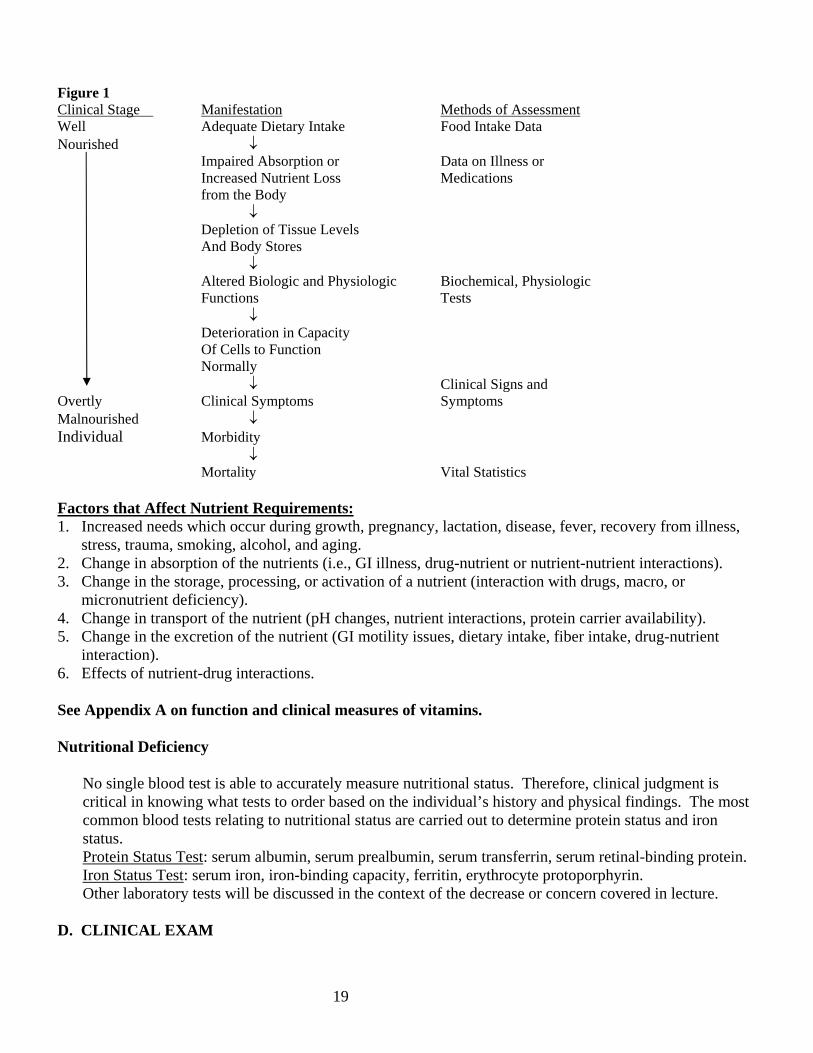
Nutritional assessment of vitamin or mineral status can be complex and differs for each nutrient due to the factors which may affect measurement of status. The first line of defense is in assessment of adequate intake utilizing one of the dietary assessment methods. The figure below outlines the sequence in the development of a vitamin/mineral deficiency, the consequences and the method to assess. In some cases it is more useful to measure specific biochemical functions of a vitamin/mineral as a “functional assay” to determine micronutrient status than simply measuring concentrations of the nutrient in the blood. Some nutrients, such as calcium, are very tightly controlled and do not reflect nutritional status. This will be further developed in the lecture on vitamins and minerals.
NUTRIENT REQUIREMENTS BASED ON CLINICAL PARAMETERS Development of a clinical nutritional deficiency with dietary, biochemical and clinical evaluation (Figure 1)
19
Figure 1 Clinical Stage Manifestation Methods of Assessment Well Adequate Dietary Intake Food Intake Data Nourished ↓ Impaired Absorption or Data on Illness or Increased Nutrient Loss Medications from the Body
↓ Depletion of Tissue Levels
And Body Stores ↓
Altered Biologic and Physiologic Biochemical, Physiologic Functions Tests ↓
Deterioration in Capacity Of Cells to Function Normally
↓ Clinical Signs and Overtly Clinical Symptoms Symptoms Malnourished ↓ Individual Morbidity ↓
Mortality Vital Statistics Factors that Affect Nutrient Requirements: 1. Increased needs which occur during growth, pregnancy, lactation, disease, fever, recovery from illness,
stress, trauma, smoking, alcohol, and aging. 2. Change in absorption of the nutrients (i.e., GI illness, drug-nutrient or nutrient-nutrient interactions). 3. Change in the storage, processing, or activation of a nutrient (interaction with drugs, macro, or
micronutrient deficiency). 4. Change in transport of the nutrient (pH changes, nutrient interactions, protein carrier availability). 5. Change in the excretion of the nutrient (GI motility issues, dietary intake, fiber intake, drug-nutrient
interaction). 6. Effects of nutrient-drug interactions. See Appendix A on function and clinical measures of vitamins. Nutritional Deficiency
No single blood test is able to accurately measure nutritional status. Therefore, clinical judgment is critical in knowing what tests to order based on the individual’s history and physical findings. The most common blood tests relating to nutritional status are carried out to determine protein status and iron status. Protein Status Test: serum albumin, serum prealbumin, serum transferrin, serum retinal-binding protein.
Iron Status Test: serum iron, iron-binding capacity, ferritin, erythrocyte protoporphyrin. Other laboratory tests will be discussed in the context of the decrease or concern covered in lecture.
D. CLINICAL EXAM

20
During Physical Diagnosis, in Year 2, you will review the nutritional components of the physical exam.
Components of Nutrition in the Clinical Exam:
1. Height, weight, BMI, waist circumference. 2. Body Composition, if applicable. 3. “Review of Systems” with consideration of indices of nutritional adequacy or inadequacy for
each system.
Clinical Signs and Symptoms: This topic will be covered in depth in your Physical Diagnosis course.
III. DIETARY ASSESSMENT OF UNITED STATES (U.S.) POPULATION Sources of U.S. Population Data
Dietary guidance, food fortification, nutrition intervention programs, and nutrition policy aimed at improving the American diet depend on knowledge of what Americans eat. The concrete link between food and health has been well documented by numerous studies and reports describing the impact of dietary intake on disease prevention and health promotion.
A. The National Health and Nutrition Examination Survey (NHANES), conducted by the National
Center for Health Statistics (NCHS) and Centers for Disease Control and Prevention (CDC), is a major source of periodic information on the dietary, nutritional, and health status of the U.S. population. The goals of the NHANES are:
• Estimate the national prevalence of selected diseases and risk factors • Document national distributions of selected dietary and health parameters • Document and investigate reasons for trends of selected diseases • Contribute to an understanding of disease etiology • Investigate the natural history of selected diseases
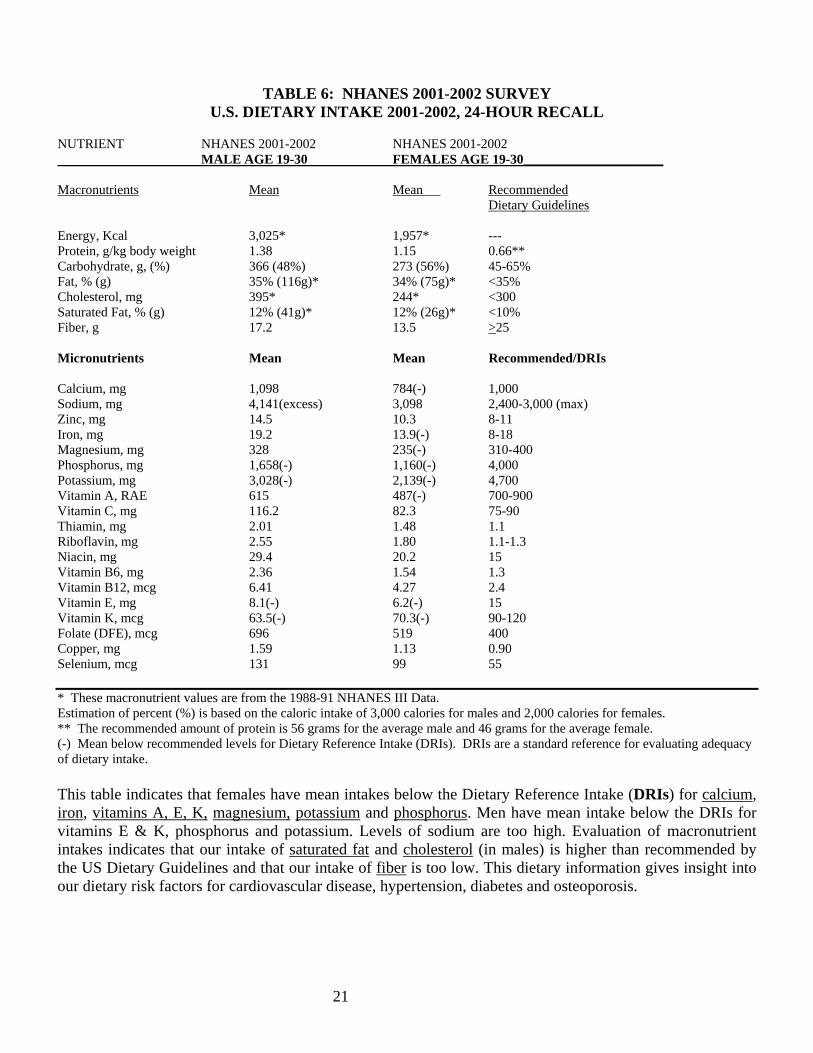
NHANES data play a unique role in nutrition monitoring and epidemiologic research, combining personal dietary interviews with standardized health examinations. The Third National Health and Nutrition Examination Survey (NHANES III) was conducted by NCHS during 1988-1994. Dietary data, obtained from two 24-hour recalls, are reported by age, gender, and ethnic group for most parameters. Starting in 1999, the NHANES became a continuous annual survey with reports for every two-year period. More detailed information and data on these surveys can be obtained from the National Center for Health Statistics at http://www.cdc.gov/nchs.nhanes.htm. Additional data on “What We Eat in America” can be obtained at the USDA Agricultural Research Service based on the NHANES data 2001-02 at http://www.ars.usda.gov/sp2UserFiles/Place/12355000/pdf/usualintaketables2001-02.pdf. The table on the next page, on current micronutrient intake, was constructed from the data at that site. New macronutrient data was not available, and therefore data from the previous survey was used. The most useful data for evaluation of the health of the population utilizes median and interquartile ranges so that one can estimate what percentage of the population is below the recommended level. Mean values are generally not very useful for this.
21
TABLE 6: NHANES 2001-2002 SURVEY U.S. DIETARY INTAKE 2001-2002, 24-HOUR RECALL
NUTRIENT NHANES 2001-2002 NHANES 2001-2002 MALE AGE 19-30 FEMALES AGE 19-30_____________________ Macronutrients Mean Mean Recommended Dietary Guidelines Energy, Kcal 3,025* 1,957* --- Protein, g/kg body weight 1.38 1.15 0.66** Carbohydrate, g, (%) 366 (48%) 273 (56%) 45-65% Fat, % (g) 35% (116g)* 34% (75g)* <35% Cholesterol, mg 395* 244* <300 Saturated Fat, % (g) 12% (41g)* 12% (26g)* <10% Fiber, g 17.2 13.5 >25 Micronutrients Mean Mean Recommended/DRIs Calcium, mg 1,098 784(-) 1,000 Sodium, mg 4,141(excess) 3,098 2,400-3,000 (max) Zinc, mg 14.5 10.3 8-11 Iron, mg 19.2 13.9(-) 8-18 Magnesium, mg 328 235(-) 310-400 Phosphorus, mg 1,658(-) 1,160(-) 4,000 Potassium, mg 3,028(-) 2,139(-) 4,700 Vitamin A, RAE 615 487(-) 700-900 Vitamin C, mg 116.2 82.3 75-90 Thiamin, mg 2.01 1.48 1.1 Riboflavin, mg 2.55 1.80 1.1-1.3 Niacin, mg 29.4 20.2 15 Vitamin B6, mg 2.36 1.54 1.3 Vitamin B12, mcg 6.41 4.27 2.4 Vitamin E, mg 8.1(-) 6.2(-) 15 Vitamin K, mcg 63.5(-) 70.3(-) 90-120 Folate (DFE), mcg 696 519 400 Copper, mg 1.59 1.13 0.90 Selenium, mcg 131 99 55 * These macronutrient values are from the 1988-91 NHANES III Data. Estimation of percent (%) is based on the caloric intake of 3,000 calories for males and 2,000 calories for females. ** The recommended amount of protein is 56 grams for the average male and 46 grams for the average female. (-) Mean below recommended levels for Dietary Reference Intake (DRIs). DRIs are a standard reference for evaluating adequacy of dietary intake. This table indicates that females have mean intakes below the Dietary Reference Intake (DRIs) for calcium, iron, vitamins A, E, K, magnesium, potassium and phosphorus. Men have mean intake below the DRIs for vitamins E & K, phosphorus and potassium. Levels of sodium are too high. Evaluation of macronutrient intakes indicates that our intake of saturated fat and cholesterol (in males) is higher than recommended by the US Dietary Guidelines and that our intake of fiber is too low. This dietary information gives insight into our dietary risk factors for cardiovascular disease, hypertension, diabetes and osteoporosis.
22
IV. STANDARDS FOR EVALUATING THE ADEQUACY OF DIETARY INTAKE
A. Dietary Reference Intakes (DRIs) B. Food Pyramids C. U.S. Dietary Guidelines D. Miscellaneous Standards Being Used
A. DIETARY REFERENCE INTAKES (DRIs) Dietary Reference Intakes (DRIs) is a generic term used to refer to at least three types of reference values: Estimated Average Requirement, Recommended Dietary Allowance, and Tolerable Upper Intake Level. The Estimated Average Requirement (EAR) is the intake value that is estimated to meet the requirement defined by a specified indicator of adequacy in 50 percent of an age- and gender-specific group. At this level of intake, the remaining 50 percent of the specified group would not have its needs met. The Recommended Dietary Allowance (RDA) is the dietary intake level that is sufficient to meet the nutrient requirements of nearly all individuals in the group (95% of the specific population). The Tolerable Upper Intake Level (UL) is the maximum level of daily nutrient intake that is unlikely to pose risks or adverse health effects to almost all of the individuals in the group for whom it is designed. The result is a Reference Range of intakes similar to a standard deviation, rather then one number. Why are the Dietary Reference Intakes being Developed? In the past, the Recommended Dietary Allowances (RDAs), published by the Food and Nutrition Board of the National Academy of Sciences, have served as the benchmark of nutritional adequacy in the United States. The traditional role of the RDA is described by its definition adopted more than 20 years ago: “the levels of intake of essential nutrients that, on the basis of scientific knowledge, are judged by the Food and Nutrition Board to be adequate to meet the known nutrient needs of practically all healthy persons.” This judgment is made on the current available data, which can be limited, or in some cases less than adequate. Deficiency studies are now considered unethical, and nutrient requirements must be determined using a wide range of published data on health parameters, dietary intake, absorption, serum levels of nutrients, and functional assays of micronutrient adequacy. Scientific knowledge regarding the role of nutrients has expanded dramatically since the inception of the RDAs. Contemporary studies address topics ranging from the prevention of classical nutritional deficiency diseases, such as rickets, scurvy, beri-beri, etc., to the reduction of risk of chronic diseases such as osteoporosis, cancer and cardiovascular disease. More recent research indicates nutrient needs vary as different lifestages (ages) and that “adult needs” are highly variable. This expansion has extended the basis for the development of Dietary Reference Intakes. In partnership with Health Canada, the Food and Nutrition Board has responded to these developments by making fundamental changes in its approach to setting nutrient reference values. The new title, Dietary Reference Intakes (DRIs), is the inclusive name being given to this new approach. See following reports at http://www.nap.edu:
• Recommended Intakes for Individuals (DRIs), Vitamins • Recommended Intakes for Individuals (DRIs), Elements (Minerals) • Estimated Average Requirements (EARs) • Tolerable Upper Intake Levels, Vitamins • Tolerable Upper Intake Levels, Elements (Minerals)

23
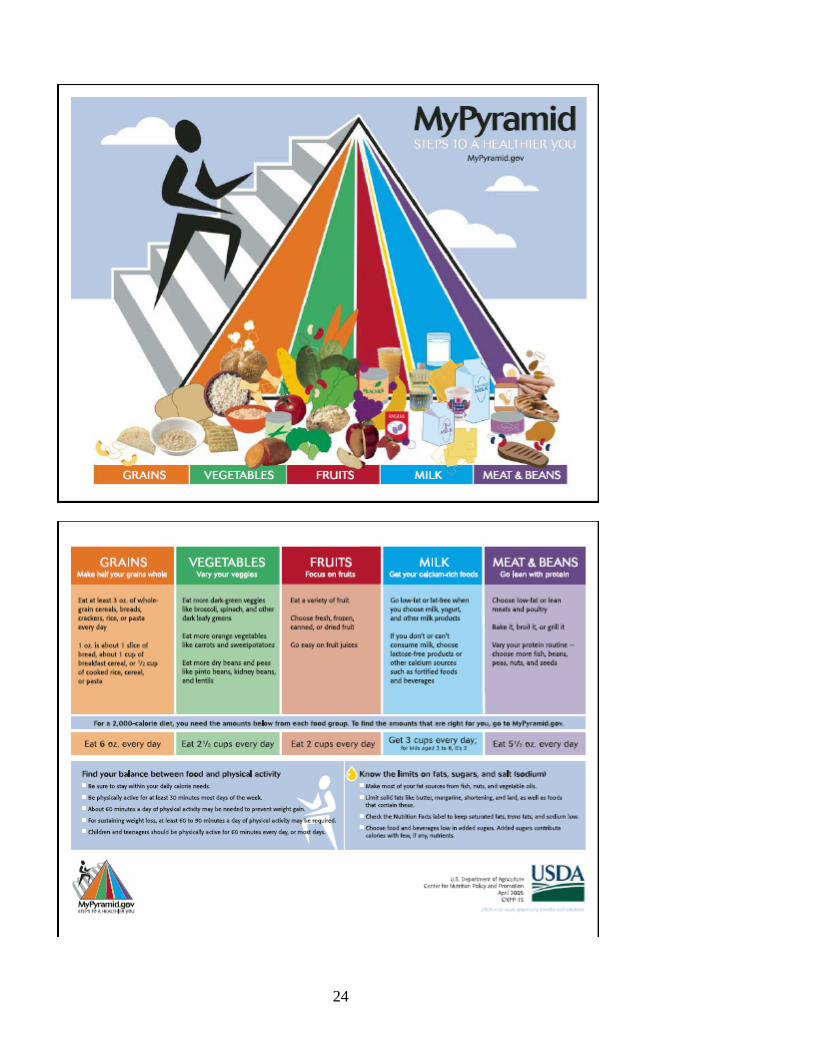
B. FOOD PYRAMIDS Another method to evaluate dietary data is to compare a person’s “usual” food intake to the recommendations outlined in one of the food pyramids available today. The standard is the USDA Food Guide Pyramid but competing pyramids have been proposed with rationale for their greater value in guiding people’s dietary intake. • USDA Food Guide Pyramid
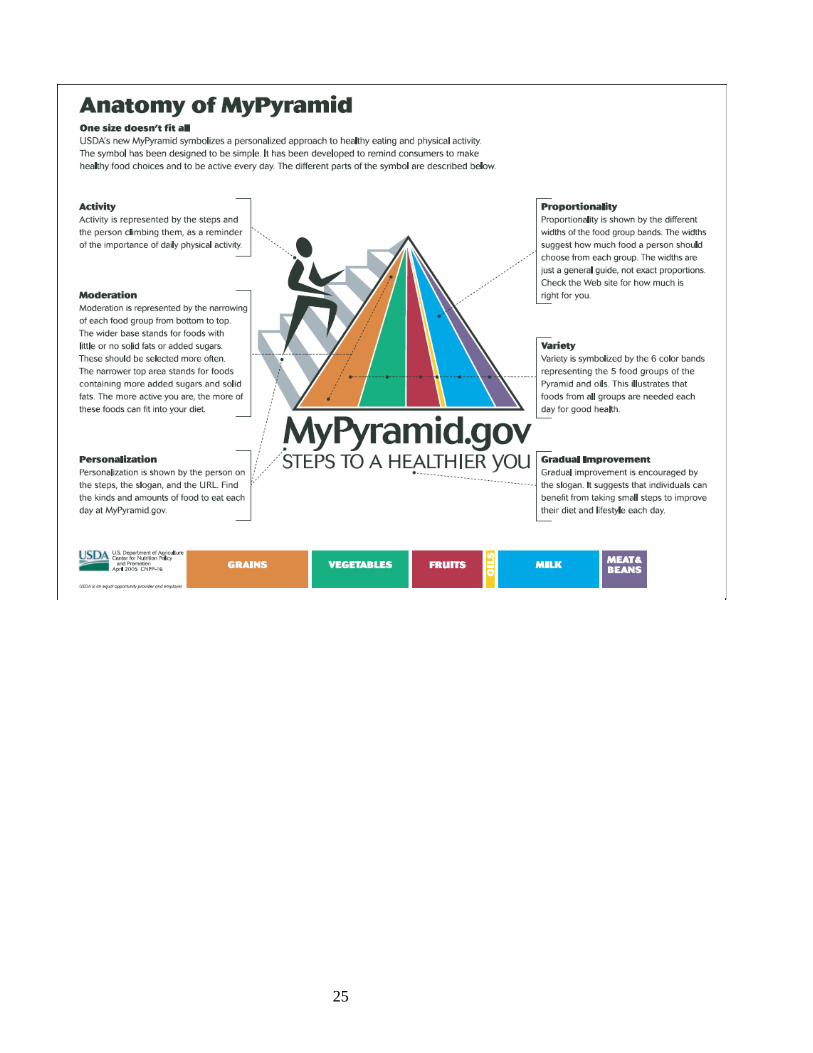
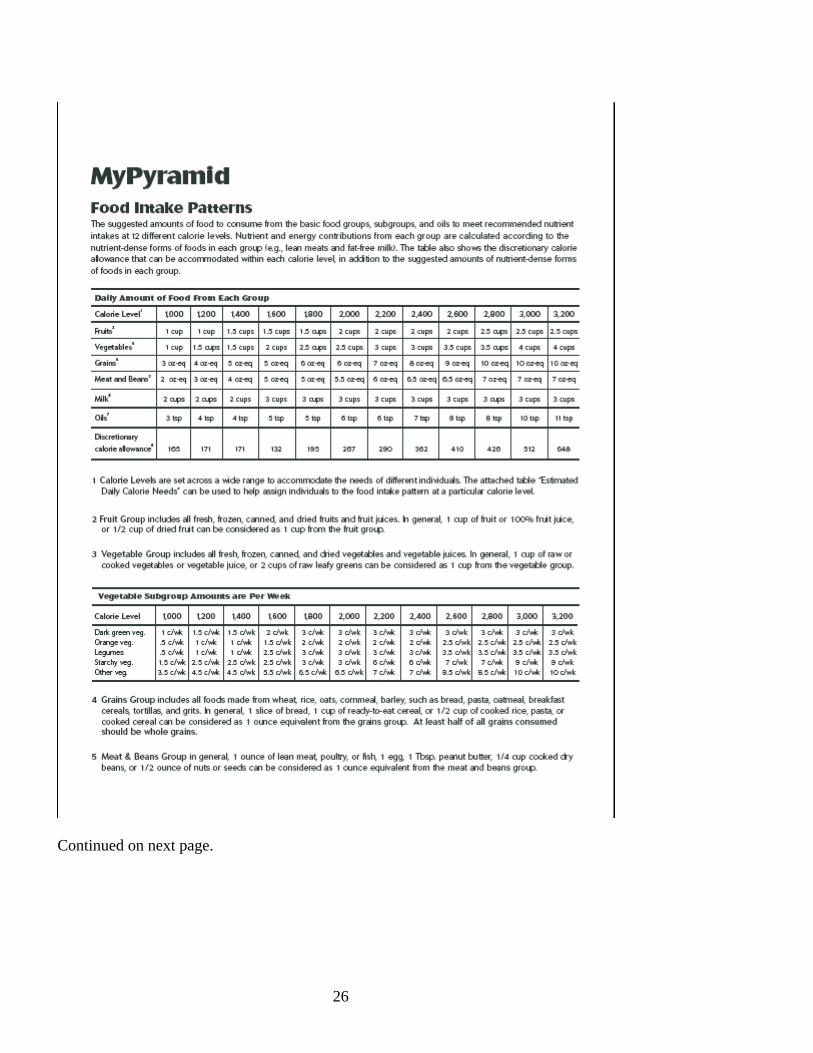
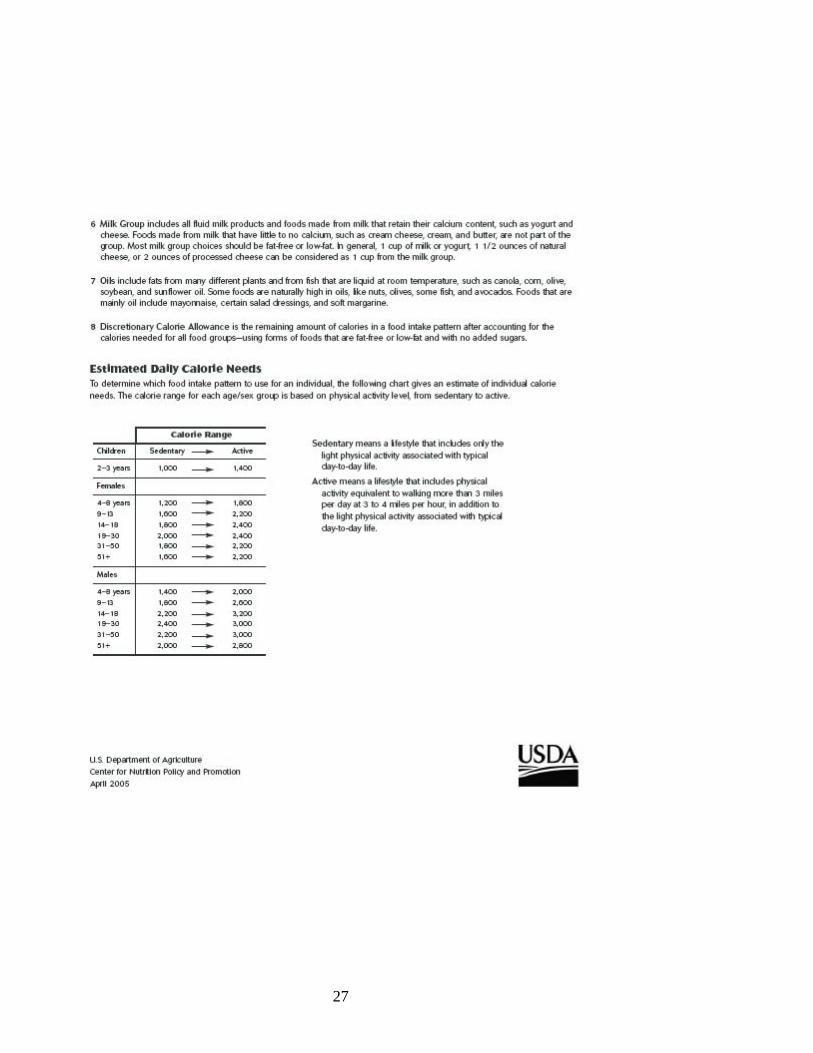
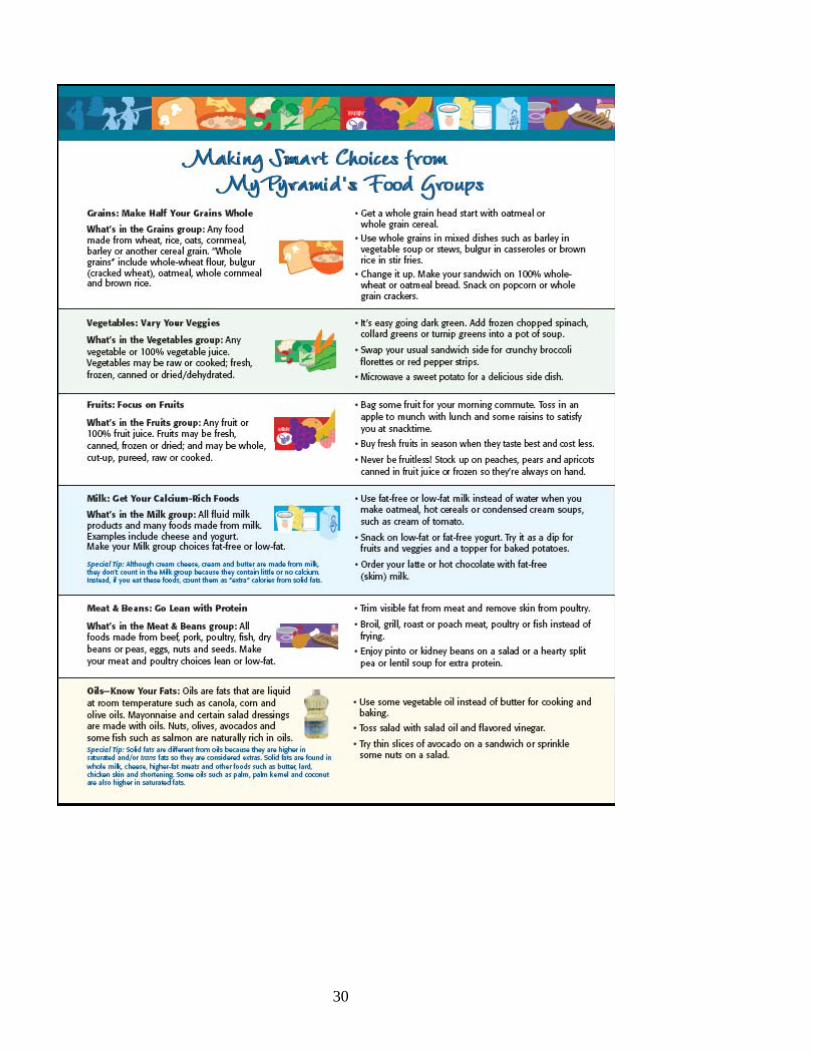
Newly released in 2005 by the United States Department of Agriculture, this is a radically reversed food pyramid designed to help Americans plan healthful diets. It serves as a visual reminder of the detailed information that individualizes a person’s needs and can be obtained at the website http://www.mypyramid.gov. Therefore, it does not provide specific information on the visual pyramid since it would not be accurate for many individuals. The Food Guide Pyramid still includes five major food groups – Bread/Cereals, Fruits, Vegetables, Meat and Milk, but uses a very different visual treatment. It also provides guidelines on quantitation of intake by defining serving size and the recommended number of servings to consume each day based on age, height, weight, activity, etc. It also stresses activity. (See the section on the pros and cons of the new USDA pyramid on page 33.)
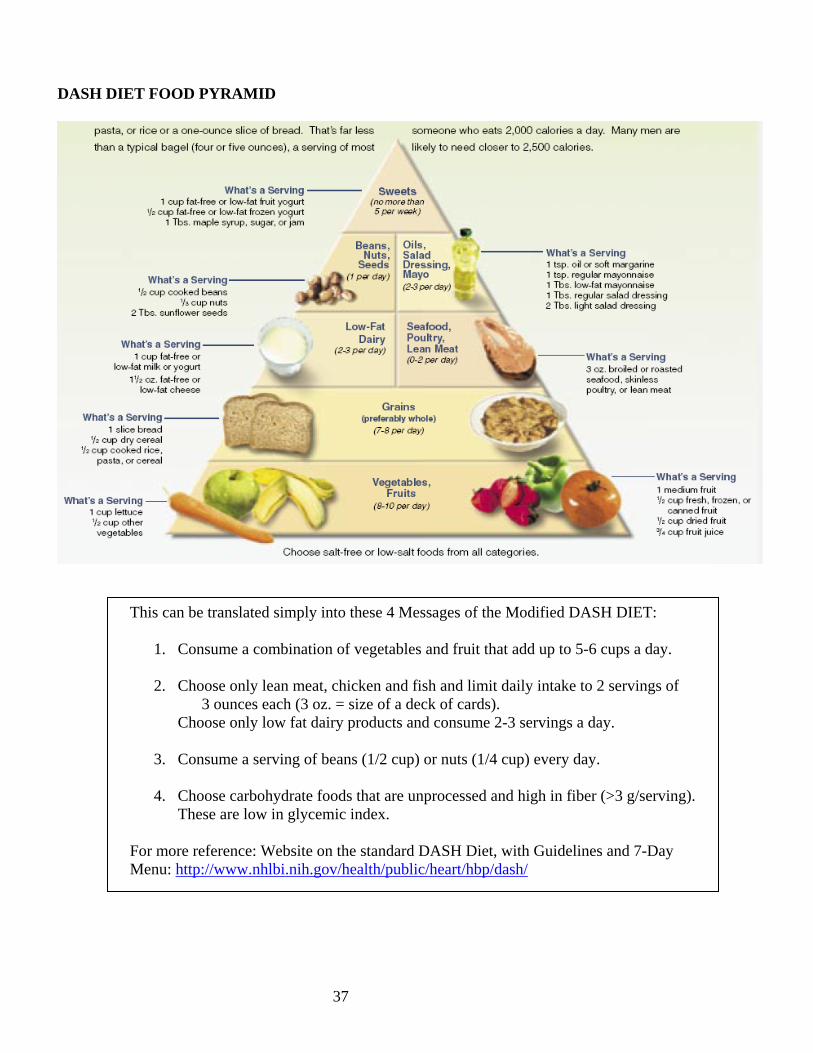
• Dash Diet This pyramid was constructed using the information offered by the DASH Diet at the government site and widely published. It was done by a non-profit consumer group, Nutrition Action, which is in Washington, D.C. It presents the DASH Diet in a similar manner to the earlier Food Pyramid format. It is presented here to acquaint you with another way to image this dietary eating plan that stresses food groups and frequency per week or month versus the 4 MESSAGES that we have chosen to use.
• Walt Willett’s Pyramid Walt Willett, Ph.D., Chairman of the Department of Nutrition at the Harvard School of Public Health released a new pyramid in August, 2001, which challenges the USDA Pyramid. His pyramid encourages whole grains over refined complex carbohydrates (potatoes, pasta, white bread); separates fish and poultry from the meat group; and discourages milk and milk products. He also encourages “good” fats like vegetable oils and discourages “bad” fats like saturated and trans fat. This pyramid includes exercise as the base. It stresses whole grains, plant oils, fruits and vegetables as the mainstays of one’s diet. Red meat, butter, processed grains and sweets are in the “use sparingly” category.
• Low Glycemic Index Pyramid Dr. David Ludwig, of Children’s Hospital in Boston, developed a food pyramid to help overweight children achieve weight loss. After several controlled intervention trials, Dr. Ludwig found that, if children choose foods with a low glycemic index, they are more likely to be satisfied, eat less calories, and lose weight. This pyramid emphasizes fruit and vegetables, lean protein foods, nuts and legumes, and whole grains. Refined carbohydrate foods and sweets – which include white bread, bagels, rolls, white rice and pasta – are at the top of this pyramid to be eaten sparingly.
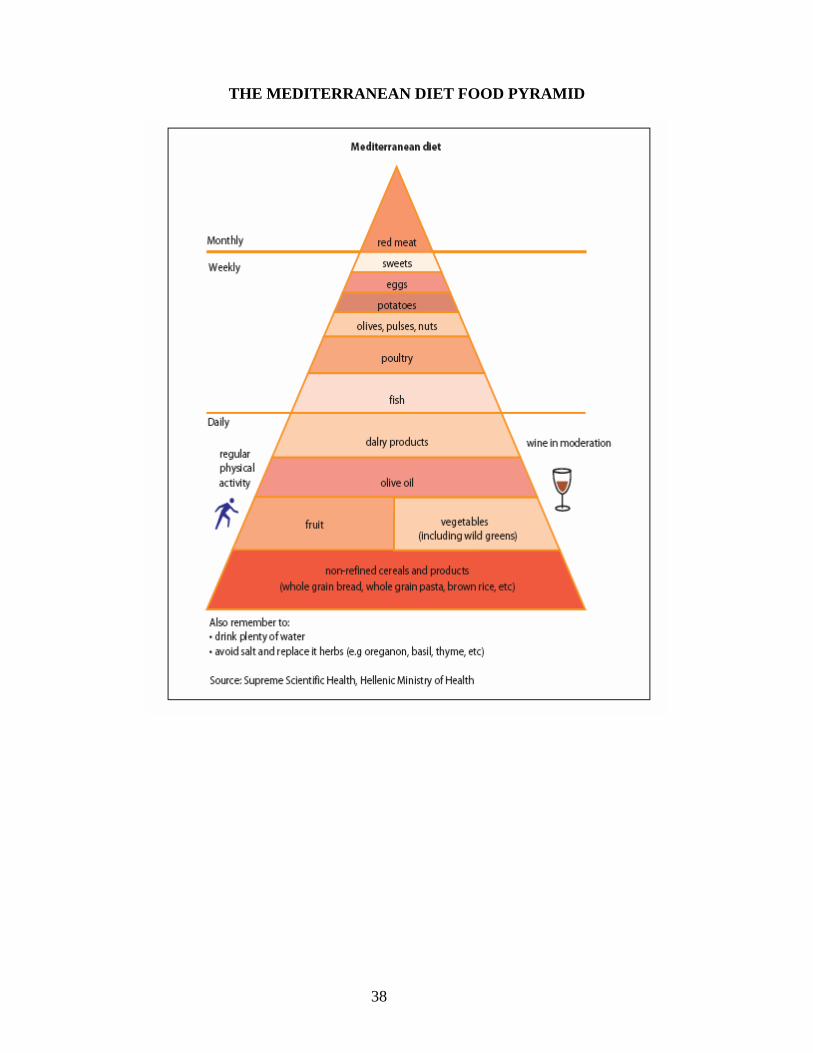
• The Traditional Healthy Mediterranean Diet Pyramid The Oldways Preservation and Exchange Trust, in collaboration with the Harvard School of Public Health, has published a series of “healthy eating pyramids” based on worldwide dietary traditions closely associated with good health. The Mediterranean Pyramid represents a plant-based diet rich in grains, vegetables, fruits, legumes, nuts, and fish.
http://www.mypyramid.gov/
24
25
26
Continued on next page.
27

28

29
30
31

32

33
34
PROS AND CONS OF THE NEW 2005 USDA FOOD PYRAMID AND “MYPYRAMID” WEBSITE
PROS: MYPYRAMID WEBSITE (http://www.mypyramid.gov)
• Developed by the USDA and put in the public domain; it is available to all. • The website allows you to actually enter data on your food intake and physical activity over time. • Able to see how food intake matches the recommended number of servings of each food group and
nutrient needs. • Calories count. • Recommends activity levels based on caloric intake. • Recommends energy balance through food and activity. • Provides explanations of food and nutrition information. • Contains a comprehensive number of foods in the database. • Allows for retrieval of a list of foods that contain high amounts of various nutrients. • Can put together meal plans based on calorie needs. • Provides portion sizes in each food group, and recommends that half of your grains be whole grains. • The new pyramid is customized based on an individual’s age, activity level, and gender. • Site can be updated as new information unfolds. • Educational handouts for the clinician available.
FOOD PYRAMID
• Provides an opportunity to discuss food. • Shows important food groups and how they relate to one another in a balanced diet. • Shows recommended servings/food group. • Defines portion sizes for food groups. • It is a strong visual that the population sees often.
CONS: MYPYRAMID WEBSITE (http://www.mypyramid.gov)
• Requires the use of a computer, to which not all people have access. • The visual for MyPyramid does not show recommended servings per food group because bands are
unlabelled – it rather serves as a reminder of individualized text. • For the grains category, there is no differentiation between whole grains and refined grains and it is
usually white flour. The examples of grains include doughnuts, white flour, and pasta. • Nutrient values are from an earlier version of the USDA Nutrient Database for Standard Reference
and the USDA’s Continuing Survey of Food Intake by Individuals (CSFII), 1994-1996 and 1998, so information is not current.
• Total fat and type of fat and fiber is not quantified. • Does not define sweets, sugars and high fat foods.

35
FOOD PYRAMID • Does not help estimate total fat intake of the diet. • Does not help estimate total fiber in the diet. • Does not quantify or address servings of high fat and high sugar foods.
o Allows 17% of calories to be solid fats and sugars (510 out of 3000 calories). o Allows 10 teaspoons of oil a day which is generally invisible so it is hard to quantify. This is
approximately 45 g/day or 14% of calories in a 3000 calorie diet. This is almost half of the recommended 30 – 35% of calories from fat. Therefore 14% + 17% = 31% of calories that are not nutrient dense but are calorie dense!
• Does not indicate that meats and animal products should not go above the recommended due to high levels of saturated fat in animal products plus dietary cholesterol.
• Lacks Alcohol, Vitamin D and Vitamin K values in nutrient analyses. • Does not allow entering of the same food twice in one record, so you will need to go back to increase
the amounts of food items. • Cannot split food list into meal times and the order when foods were consumed may get changed
around, hence, the resulting food list will not represent the day’s menu. • Unable to add foods to the database to customize your own various foods. You will have to find
something that is similar or use a combination of foods to match the item.

36
MYPYRAMID WEBSITE PHYSICAL ACTIVITY RESOURCES An excellent resource for providing information on exercise and for tracking your physical activity is accessible on http://www.mypyramid.gov. Once you open the website:
• Click on “MyPyramid Tracker” at the bottom of the blue box on the left-hand side of the website’s first page.
• Double-click on “Assess Your Physical Activity” at the bottom of the next page. • You will need to register if you are a new user. • You will fill out a personal profile with your age, gender, the entry date, height, weight and e-mail
address. • If you have an existing account, type in your User ID and Password.
Once you have completed registering:
• Click on the button that reads, “Proceed to Physical Activity.” This will open to the “Physical Activity Tool”, and you will have the option to enter your physical activities for the day.
• On the left-hand side, choose each activity that you have performed by scrolling through the menu and highlighting the ones that match your activities.
• On the right-hand side, where your list of activities appears, select the “Duration” button for the number of minutes performed for each activity.
When completed,
• Click on “Save and Analyze.” • You will receive a report that tells you how many calories you expended on each activity, and gives
you a “score” that compares to the physical activity recommended for good health. The http://www.mypramid.gov website also provides physical activity information. Following are links for your review:
1. Steps to a healthier weight: Get moving!: http://www.mypyramid.gov/steps/getmoving.html 2. Finding your balance between food and physical activity:
http://www.mypyramid.gov/pyramid/physical_activity_tips.html
37
DASH DIET FOOD PYRAMID
This can be translated simply into these 4 Messages of the Modified DASH DIET:
1. Consume a combination of vegetables and fruit that add up to 5-6 cups a day.
2. Choose only lean meat, chicken and fish and limit daily intake to 2 servings of 3 ounces each (3 oz. = size of a deck of cards).
Choose only low fat dairy products and consume 2-3 servings a day.
3. Consume a serving of beans (1/2 cup) or nuts (1/4 cup) every day.
4. Choose carbohydrate foods that are unprocessed and high in fiber (>3 g/serving). These are low in glycemic index.
For more reference: Website on the standard DASH Diet, with Guidelines and 7-Day Menu: http://www.nhlbi.nih.gov/health/public/heart/hbp/dash/
38
THE MEDITERRANEAN DIET FOOD PYRAMID

39
C. DIETARY GUIDELINES FOR AMERICANS From United States Department of Agriculture and Department of Health and Human Services In May 2000, the fifth edition of Dietary Guidelines for Americans was released to provide easily understood, evidence-based information on how Americans can choose diets that promote good health. The new guidelines continue to emphasize balance, moderation and variety in food choices, with a special emphasis on whole grain products, vegetables and fruits.
AIM FOR FITNESS • Aim for a healthy weight
Check BMI (18.5-25 is in the healthy range). Remember to choose sensible portion sizes of food.
• Be physically active each day 30 minutes of moderate activity each day for adults.
60 minutes of moderate activity each day for children. BUILD A HEALTHY BASE • Let the Pyramid guide your food choices
Consume the number of servings recommended per food group. Choose nutrient dense food from each of the food groups.
• Choose a variety of grains daily, especially whole grains Choose carbohydrate foods that are high in fiber which are generally higher in nutrients.
• Choose a variety of fruits and vegetables daily Consume 5 or more servings a day. Choose dark green leafy and dark orange vegetables as the most nutrient dense.
• Keep food safe to eat Pregnant women, young children, older persons and people with weakened immune systems or certain chronic illnesses are at increased risk for food borne illnesses.
CHOOSE SENSIBLY • Choose a diet that is low in saturated fat and cholesterol and moderate in total
fat. - Consume a diet with less than 30% of total fat
In a 2,000 kcal diet, this is less than 66 grams of fat/day and 100 g in a 3,000 kcal diet.
- Saturated fat should be less than 10% of calories In a 2,000 kcal diet, this is less than 20 grams of saturated fat/day and 30 g in a 3,000 kcal diet.
- Keep your dietary cholesterol intake to less than 300 mg/day • Choose beverages and foods to moderate your intake of sugars.
Major sources of added sugars in the US diet: soft drinks, cakes, cookies, pies, fruitades and fruit punch, ice cream and candy. Less than 10% of caloric intake should come from added sugars.
• Choose and prepare foods with less salt (or sodium).
40
Salt is the main source of sodium in our diets which generally come from processed foods. Only a small amount of sodium or salt occurs naturally in foods. Many snack foods are high in sodium; intake should be less than 2,400 mg/day.
• If you drink alcoholic beverages, do so in moderation. Moderation is defined as no more than one drink per day for women and no more than two drinks per day for men. This difference is based on differences in weight and metabolism. (1 drink = 12 oz beer, 5 oz. wine, 1.5 ounces of 80-proof distilled spirits).
D. MISCELLANEOUS STANDARDS BEING USED
a. Nutrient Density: Compares a food’s nutrient content in relation to the calories it
provides. This helps identify foods and eating patterns that improve quality of diet per calorie intake. It is used for individual nutrients. This is expressed as mg or µg of a nutrient per 1,000 kcals.
b. Energy Dense-Nutrient Poor Foods (EDNP): These foods have been defined as
desserts, candy, sweet beverages, salty and fatty snacks. This definition has been used to evaluate the percent of our total daily caloric intake that comes from foods generally low in nutrient value, but high in calories.
c. Healthy Eating Index: This index totals an overall eating pattern based on the Dietary
Guidelines. A single “Score” is given for the diet pattern that takes into account the fruit/vegetable intake, fiber, fat intake, etc.
E. DETERMINATION OF ENERGY REQUIREMENTS Energy: Required to support normal metabolic functions, physical activity, and growth and repair of damaged tissues. Energy is expressed as kilocalories (kcal) provided by the oxidation of dietary protein, fat, carbohydrate, and alcohol. 1 gram of protein = approximately 4 kcal 1 gram of carbohydrate = approximately 4 kcal 1 gram of fat = approximately 9 kcal 1 gram of alcohol = approximately 7 kcal Calorie: the amount of heat required to raise 1 gram of water 1 degree Celsius. Kilocalorie: the amount of heat required to raise 1 kilogram of water 1 degree Celsius. Predicting Energy Requirements: A 3 Step Process Step 1. Calculate Resting Energy Expenditure (REE) and Basal Metabolic Rate (BMR) REE represents the amount of energy required in a rested, fasted state to maintain vital organ function. A subject is required to lie down and rest at least 30 minutes prior to the determination. BMR is the REE measured soon after waking in the morning, after a 7-8 hour resting period, and at least 12 hours after the last meal. The REE and BMR differ in practice by less than 10%, thus
41
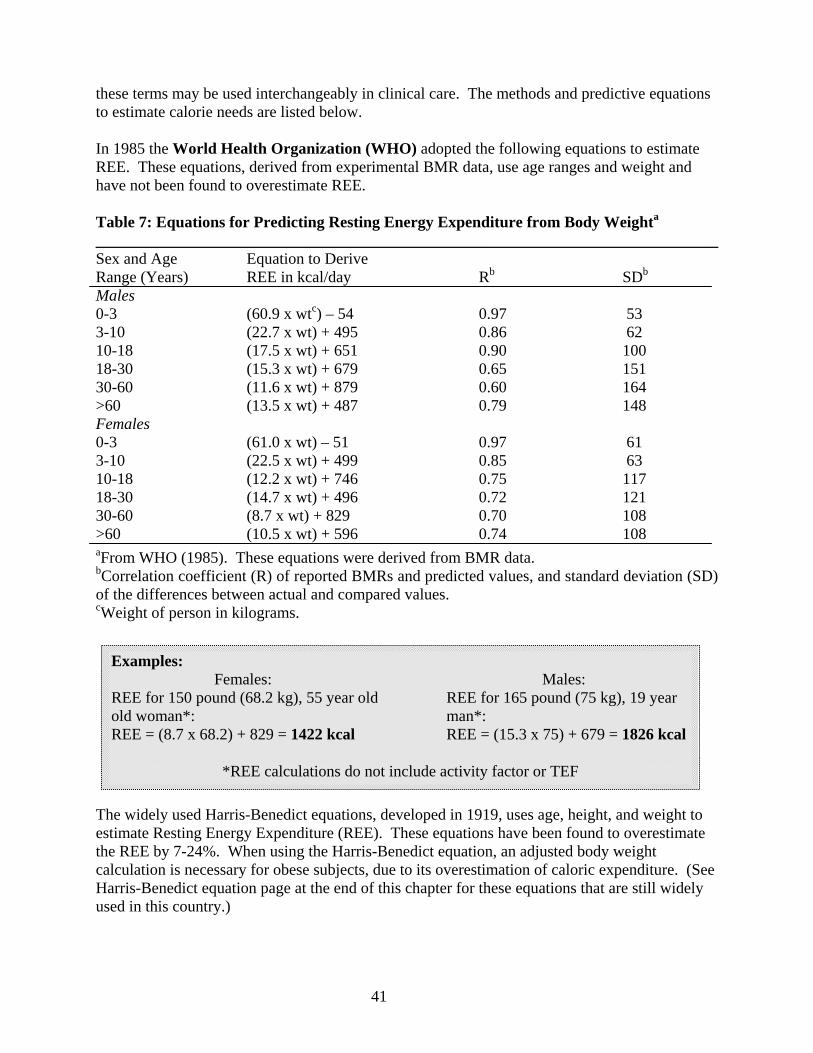
these terms may be used interchangeably in clinical care. The methods and predictive equations to estimate calorie needs are listed below. In 1985 the World Health Organization (WHO) adopted the following equations to estimate REE. These equations, derived from experimental BMR data, use age ranges and weight and have not been found to overestimate REE. Table 7: Equations for Predicting Resting Energy Expenditure from Body Weighta ______________________________________________________________________________ Sex and Age Equation to Derive Range (Years) REE in kcal/day Rb SDb Males 0-3 (60.9 x wtc) – 54 0.97 53 3-10 (22.7 x wt) + 495 0.86 62 10-18 (17.5 x wt) + 651 0.90 100 18-30 (15.3 x wt) + 679 0.65 151 30-60 (11.6 x wt) + 879 0.60 164 >60 (13.5 x wt) + 487 0.79 148 Females 0-3 (61.0 x wt) – 51 0.97 61 3-10 (22.5 x wt) + 499 0.85 63 10-18 (12.2 x wt) + 746 0.75 117 18-30 (14.7 x wt) + 496 0.72 121 30-60 (8.7 x wt) + 829 0.70 108 >60 (10.5 x wt) + 596 0.74 108 aFrom WHO (1985). These equations were derived from BMR data. bCorrelation coefficient (R) of reported BMRs and predicted values, and standard deviation (SD) of the differences between actual and compared values. cWeight of person in kilograms. The widely used Harris-Benedict equations, developed in 1919, uses age, height, and weight to estimate Resting Energy Expenditure (REE). These equations have been found to overestimate the REE by 7-24%. When using the Harris-Benedict equation, an adjusted body weight calculation is necessary for obese subjects, due to its overestimation of caloric expenditure. (See Harris-Benedict equation page at the end of this chapter for these equations that are still widely used in this country.)
Examples: Females: Males: REE for 150 pound (68.2 kg), 55 year old REE for 165 pound (75 kg), 19 year old woman*: man*: REE = (8.7 x 68.2) + 829 = 1422 kcal REE = (15.3 x 75) + 679 = 1826 kcal
*REE calculations do not include activity factor or TEF
42
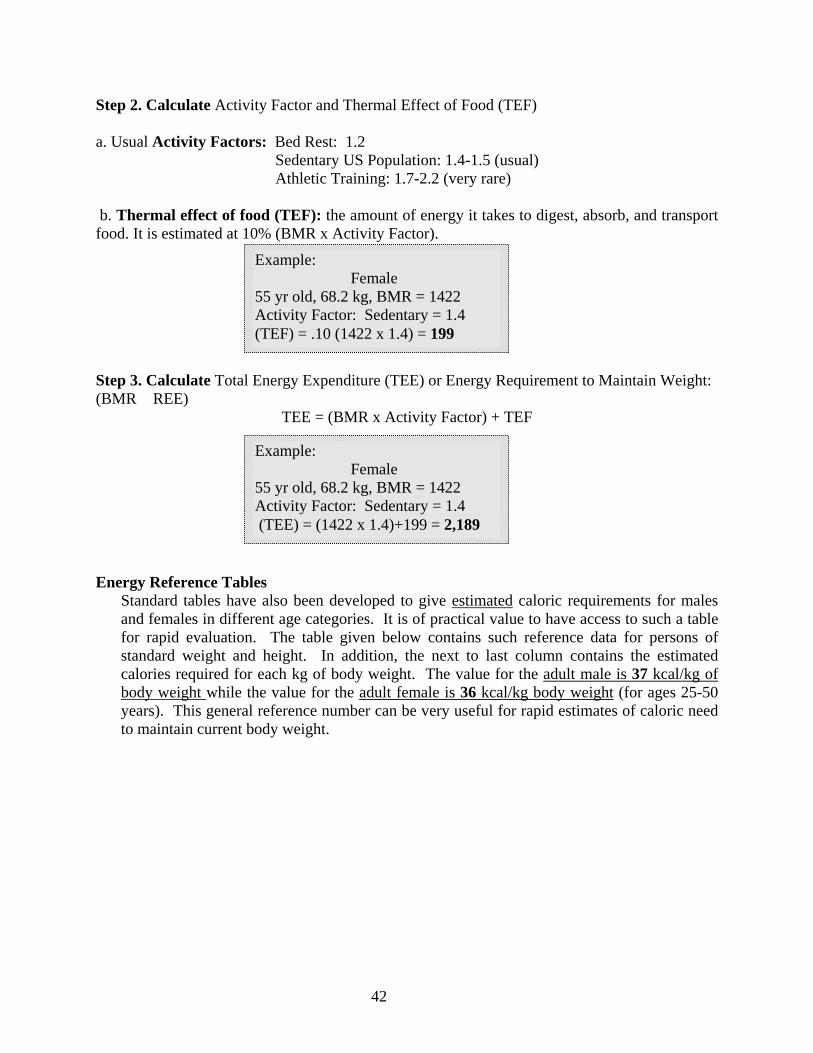
Step 2. Calculate Activity Factor and Thermal Effect of Food (TEF) a. Usual Activity Factors: Bed Rest: 1.2 Sedentary US Population: 1.4-1.5 (usual) Athletic Training: 1.7-2.2 (very rare) b. Thermal effect of food (TEF): the amount of energy it takes to digest, absorb, and transport food. It is estimated at 10% (BMR x Activity Factor).
Step 3. Calculate Total Energy Expenditure (TEE) or Energy Requirement to Maintain Weight: (BMR �REE)
TEE = (BMR x Activity Factor) + TEF
Energy Reference Tables
Standard tables have also been developed to give estimated caloric requirements for males and females in different age categories. It is of practical value to have access to such a table for rapid evaluation. The table given below contains such reference data for persons of standard weight and height. In addition, the next to last column contains the estimated calories required for each kg of body weight. The value for the adult male is 37 kcal/kg of body weight while the value for the adult female is 36 kcal/kg body weight (for ages 25-50 years). This general reference number can be very useful for rapid estimates of caloric need to maintain current body weight.
Example: Female 55 yr old, 68.2 kg, BMR = 1422 Activity Factor: Sedentary = 1.4 (TEF) = .10 (1422 x 1.4) = 199
Example: Female 55 yr old, 68.2 kg, BMR = 1422 Activity Factor: Sedentary = 1.4 (TEE) = (1422 x 1.4)+199 = 2,189
43
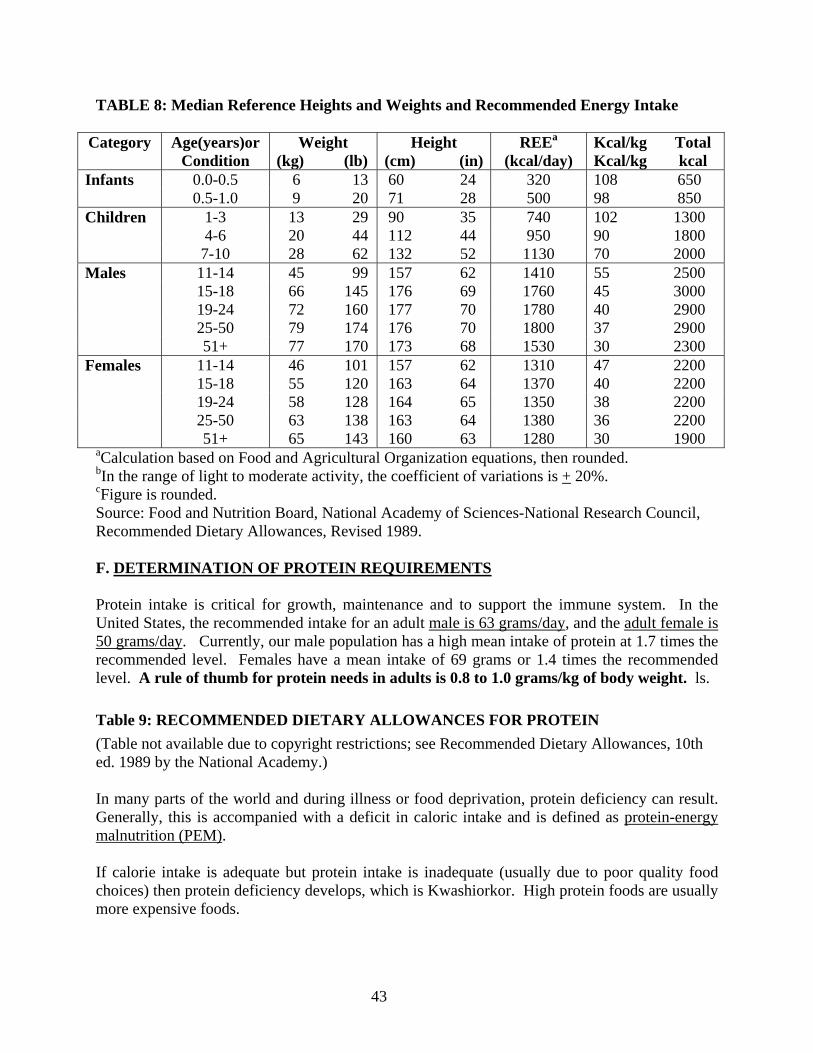
TABLE 8: Median Reference Heights and Weights and Recommended Energy Intake
Category Age(years)or Condition
Weight (kg) (lb)
Height (cm) (in)
REEa (kcal/day)
Kcal/kg Total Kcal/kg kcal
Infants 0.0-0.5 6 13 60 24 320 108 650 0.5-1.0 9 20 71 28 500 98 850 Children 1-3 13 29 90 35 740 102 1300 4-6 20 44 112 44 950 90 1800 7-10 28 62 132 52 1130 70 2000 Males 11-14 45 99 157 62 1410 55 2500 15-18 66 145 176 69 1760 45 3000 19-24 72 160 177 70 1780 40 2900 25-50 79 174 176 70 1800 37 2900 51+ 77 170 173 68 1530 30 2300 Females 11-14 46 101 157 62 1310 47 2200 15-18 55 120 163 64 1370 40 2200 19-24 58 128 164 65 1350 38 2200 25-50 63 138 163 64 1380 36 2200 51+ 65 143 160 63 1280 30 1900
aCalculation based on Food and Agricultural Organization equations, then rounded. bIn the range of light to moderate activity, the coefficient of variations is + 20%. cFigure is rounded. Source: Food and Nutrition Board, National Academy of Sciences-National Research Council, Recommended Dietary Allowances, Revised 1989. F. DETERMINATION OF PROTEIN REQUIREMENTS Protein intake is critical for growth, maintenance and to support the immune system. In the United States, the recommended intake for an adult male is 63 grams/day, and the adult female is 50 grams/day. Currently, our male population has a high mean intake of protein at 1.7 times the recommended level. Females have a mean intake of 69 grams or 1.4 times the recommended level. A rule of thumb for protein needs in adults is 0.8 to 1.0 grams/kg of body weight. ls. Table 9: RECOMMENDED DIETARY ALLOWANCES FOR PROTEIN (Table not available due to copyright restrictions; see Recommended Dietary Allowances, 10th ed. 1989 by the National Academy.) In many parts of the world and during illness or food deprivation, protein deficiency can result. Generally, this is accompanied with a deficit in caloric intake and is defined as protein-energy malnutrition (PEM). If calorie intake is adequate but protein intake is inadequate (usually due to poor quality food choices) then protein deficiency develops, which is Kwashiorkor. High protein foods are usually more expensive foods.
44
REFERENCES 1. Lee R, Nieman DC. Nutritional Assessment, Third Edition, McGraw-Hill, 2002. 2. Shils M, Olson J, Shike M, Ross CA. Modern Nutrition in Health and Disease, Ninth
Edition, Lipincott, Williams & Wilkins, 1999. 3. Standing Committee on the Scientific Evaluation of Dietary Reference Intakes, Food and
Nutrition Board, Institute of Medicine. Dietary Reference Intakes for Calcium, Phosphorous, Magnesium, Vitamin D, and Fluoride, National Academy Press, 1997.
4. Standing Committee on the Scientific Evaluation of Dietary Reference Intakes, Food and
Nutrition Board, Institute of Medicine. Dietary Reference Intakes for B Vitamins, National Academy Press, 1998.
5. Standing Committee on the Scientific Evaluation of Dietary Reference Intakes, Food and
Nutrition Board, Institute of Medicine. Dietary Reference Intakes for Vitamin C, Vitamin E, Selenium, and Carotenoids, National Academy Press, 2000.
6. United States Department of Health and Human Services, United States Department of
Agriculture. Dietary Guidelines for Americans, National Academy Press, 2000. 7. Standing Committee on the Scientific Evaluation of Dietary Reference Intakes, Food and
Nutrition Board, Institute of Medicine. Dietary Reference Intakes for Energy, Carbohydrates, Fiber, Fatty Acids, Cholesterol, Protein, and Amino Acids. National Academy Press, 2002.
45
EVIDENCE-BASED MEDICINE LIST OF WEBSITES
1. http://www.tufts.edu/med/ebcam This site on Evidence-Based Complementary and Alternative Medicine was created by Tufts University School of Medicine in partnership with the New England School of Acupuncture to support the development of an evidence-based medicine (EBM) curriculum. The curriculum is designed to teach medical students EBM skills that can be applied to complementary and alternative medicine (CAM) and to allopathic medicine.
2. http://www.nhlbi.nih.gov/health/public/heart/hbp/dash
From the National Heart, Blood, and Lung Institute. (Provides access to information on the DASH Diet and gives reference material to diseases and conditions.)
3. http://www.guidelines.gov
The National Guideline Clearinghouse™ (NGC), a public resource for evidence-based clinical practice guidelines. NGC is an initiative of the Agency for Healthcare Research and Quality (AHRQ), U.S. Department of Health and Human Services. (Provides a comprehensive database of evidence-based clinical practice guidelines and related documents.)
4. http://care.diabetesjournals.org
From The American Diabetes Association. (Allows on-line viewing of articles from the Diabetes Care Journal.)
5. http://www.heartfoundation.com.au/index.cfm?page=41
The National Heart Foundation of Australia produces an extensive range of evidence based position papers and guidelines for dietitians and other health professionals working in the area of nutrition and cardiovascular health. (Provides policies, information sheets, guidelines and other professional resources on cardiovascular health.)
6. http://www.arborcom.com
From The Arbor Nutrition Guides. (Contains thousands of links to nutrition-related topics and articles.)
7. http://www.mayoclinic.com
From the Mayo Clinic. (Provides information and treatment on diseases and conditions.) 8. http://www.cancer.org
From The American Cancer Society. (Provides information on the prevention and treatment of cancer.)
9. http://www.nutrition.gov
Nutrition.gov is from the Federal Government. (Provides reliable information on food and nutrition.)

46
10. http://www.nutrition.org From the American Society for Nutritional Sciences. (Provides on-line viewing of the Journal of Nutrition.)
11. http://www.ahrq.gov
From the U.S. Department of Health and Human Services, this is the website for accessing information from the Agency for Health Care Research and Quality. (Provides a summary of recommendations and supporting documents for many diseases and conditions.)
12. http://www.eatright.org
The American Dietetics Association website, from which is published the Journal of the American Dietetics Association. (Provides information on nutrition and food-related topics.)
13. http://www.health.gov.au/nhmrc/
This website is from the Australian government’s National Health and Medical Research Council. (Provides access to publications on different diseases and conditions.)
14. http://www.york.ac.uk/inst/crd/
From the National Health Service Centre for Reviews and Dissemination. (Provides access to publications on different diseases and conditions.)
47
NUTRIENT DATABASES ON THE INTERNET Fitday.com Fitday.com is a free website where an individual can track diet, exercise, and weight. You will use this site to analyze your food diary for one of the small group assignments. http://www.fitday.com/ Cyberdiet Allows assessment of personal daily food intake and nutrient requirements. It does require a registration fee. http://www.cyberdiet.com/reg/index.html National Institutes of Health Menu Planner From the National Institutes of Health and the National Heart, Lung, and Blood Institute, this site allows the user to plan a menu, based on a target number of calories. It is very limited in food items and their preparation options. It calculates calories, grams of fat and grams of carbohydrate for the total day, and provides calories per food item. http://hin.nhlbi.nih.gov/menuplanner/ Nutrition Analysis Tool (NAT) 2.0 From the University of Illinois, this is composed of the USDA Handbook #8 and has a limited number of brand-named items. It allows the user to create a personal diet list and analyze it for up to twenty-one nutrients. NAT version 3.0, is the newest version. a Fast Food NAT for cellular or palm is also available at this site. http://www.nat.uiuc.edu/ USDA Food Composition Tables This provides a single food look-up from a large database of foods, from the USDA and the Agricultural Research Services. http://www.nal.usda.gov/fnic/ CDC Nutrition CDC’s Division of Nutrition and Physical Activity (DNPA) takes a public health approach to address the role of nutrition and physical activity in improving the public's health and preventing and controlling chronic diseases. The scope of DNPA activities includes epidemiological and behavioral research, surveillance, training and education, intervention development, health promotion and leadership, policy and environmental change, communication and social marketing, and partnership development. A lifestyle characterized by physical inactivity and poor dietary habits is a leading cause of premature death in the nation, second only to tobacco use. The good news is that people of all ages can obtain health benefits by including regular physical activity and by eating a wide variety of foods based upon the Dietary Guidelines for Americans and the Food Guide Pyramid. http://www.cdc.gov/nccdphp/dnpa/
48
Consumer Lab This webiste's mission is to identify the best quality health and nutrition products through independent testing. Find out if there is any scientific evidence that the supplement is of benefit, does harm, whether a brand of product is biovailable, contaminated, actually contains the indegredients listed on the label, etc. Site includes: laboratory test results, product reviews, natural products encyclopedia, recalls and warnings. Some information is offered free to the public; however, more in-depth information is offered to subscribers. http://www.consumerlab.com FDA Website for Food Safety and Applied Nutrition Information links to 1) recent news: press announcements & fact sheets, etc., 2) special interest areas: seniors; women’s health; kids, teens & educators; consumer advice, 3) National Food Safety Programs, 4) FDA Program Areas such as infant formula, food ingredients & packaging, and color additives, and 5) other info sources: chemical, biological, food technology. http://www.cfsan.fda.gov/list.html FDA Website for Supplements and Herbals Most commonly asked questions about dietary supplements. Helpful for the clinician and patient. http://www.cfsan.fda.gov/~dms/qa-supq.html Arbor Clinical Nutrition Updates A free weekly newsletter that reports nutrition research, one topic per week. It gives a succinct summary of recent literature and comments on the variations between studies and applications to clinical practice. http://www.arborcom.com

49
HARRIS BENEDICT EQUATION (For assessing energy needs – Currently used clinically for determining caloric intake) Energy needs can be determined by several methods. The Harris Benedict equation uses age, height and weight to estimate basal energy expenditure (BEE), the minimum amount of energy needed by the body at rest in a fasting state. Most clinicians use this equation to calculate their patients’ energy needs. In men: BEE (kcal/day) = 66.5 + (13.8 x W) + (5.0 x H) – (6.8 x A) In women: BEE (kcal/day) = 655.1 + (9.6 x W) + (1.8 x H) – (4.7 x A) When W = weight in kilograms H = height in centimeters A = age in years The BEE value is then multiplies by an activity factor and an injury factor (see Table below) to predict the total daily energy expenditure. Activity Categories:* Injury Categories: Confined to bed = 1.0-1.2 Surgery Out of bed = 1.3 Minor = 1.0-1.1 Very light = 1.3 Major = 1.1-1.2 Light = 1.5 (women)
1.6 (men) Infection Moderate = 1.6 (women) Mild = 1.0-1.2
1.7 (men) Moderate = 1.2-1.4 Severe = 1.4-1.8 Heavy = 1.9 (women) Trauma
2.1 (men) Skeletal = 1.2-1.35 Blunt = 1.15-1.35 Head trauma treated with steroids = 1.6 Activity category examples: Very light: seated and standing activities, painting trades, driving, laboratory work, typing, sewing, ironing, cooking, playing cards, playing a musical instrument Light: walking on a level surface at 2.5 mph to 3mph, garage work, electrical trades, carpentry, restaurant trades, house-cleaning, child care, golf, sailing, table tennis Moderate: walking 3.5 mph to 4 mph, weeding and hoeing, carrying a load, cycling, skiing tennis, dancing Heavy: walking with a load uphill, tree felling, heavy manual digging, basketball, climbing, football, soccer From the Manual of Clinical Dietetics, fifth edition, American Dietetic Association, Chicago, Illinois 1996
50
CLINICAL CASES Scenario #1 You are a family physician. Mr. J, a rather overweight 54 year old patient of yours, comes to clinic with complaints of rectal bleeding. A few tests are run and he is discovered to have colon cancer, the likelihood of which is believed to be strongly linked to obesity. He undergoes curative surgery, but you inform him that he is at very high risk of developing a new colon cancer in the decades to come. You are well aware that Mr. J is likely to resist any effort to alter his lifestyle. You nevertheless wish to find a way to compel him to lose weight. What anthropometric measures might you simply obtain in the office for which normative standards exist and which would thereby provide him objective evidence of his obesity? You choose to inform him that his BMI is 32, which clearly falls in the obesity range. Mr. J scoffs at this, and replies “my older son is a competitive body builder who is in great shape and his BMI is 32 as well; how can you then possibly criticize me?” How do you respond? You now ask the experienced dietitian who works in your office to conduct an assessment of Mr. J’s diet. She hands you a sheet the next day which states: ‘Results of 3 day dietary recall on Mr. J. Average daily caloric intake: 1720 kcal; average daily fat intake: 55 gms; average daily protein intake: 60 gms.’ The most likely correct interpretation of this result is:
1. Since 1720 kcals/d, for an adult man whose height is 5’6”, would not cause obesity you conclude that Mr. J’s obesity is caused by a metabolic disturbance such as hypothyroidism.
2. The 3 day dietary recall has not accurately assessed the typical dietary habits of Mr. J because of inherent limitations in this assessment tool.
3. The recall has not accurately assessed the typical dietary habits of Mr. J because of incompetence on the part of the dietitian.
You decide that a more accurate tool needs to be used for this purpose, and the dietitian says you can choose between a food frequency questionnaire or a 7 day dietary record. Which do you choose and why? Scenario #2 You decide to do a fellowship in nutritional epidemiology. You decide to ask the question of whether excessive vitamin A intake during pregnancy leads to birth defects, as has been documented in several non-U.S. populations. Your research mentor suggests that you use the ‘Ten State Nutrition Survey’ database, since your university was one of the participants in this survey and therefore has early access to the data. The survey was conducted in the U.S. between the years of 1968-1970 in the ten poorest states in the nation.

51
You divide up the entire population surveyed into quartiles of vitamin A intake (Q1 = lowest) and examine incidence of birth defects as a function of average daily intake among women of childbearing age (expressed as birth defects/100 live births): Q1 Q2 Q3 Q4 2.3 2.2 2.8 2.2 Give several reasons why you should NOT conclude that excessive vitamin A intake in the U.S. in the 21st century does not result in birth defects. You and your mentor therefore decide to use the NHANES database, which includes a representative sampling of the entire U.S. population in the 1990s. Your mentor reminds you that the NHANES database includes serum retinol (vitamin A) levels, so she suggests that you look at birth defects as a function of serum retinol levels. You insist that you will use data on the dietary intake of vitamin A. Who is correct? Your mentor decides that a definitive examination of this question will require that you initiate a prospective cohort study in which you take a fair sampling of the population, divide them up into quartiles based in vitamin A intake, and then follow them for ten years to determine who delivers babies with birth defects and who doesn’t. Why would this laborious and time-consuming approach be more accurate?