Embed Size (px)
Citation preview
1. Nomenclature,
2. Instrument capability,
3. Sample preparation,
4. Instrument operation,
5. Acquisition method,
6. Data analysis (small molecule, protein)
7. Quantitative analysis,
8. Software,
9. Data presentation,
10.Service support.
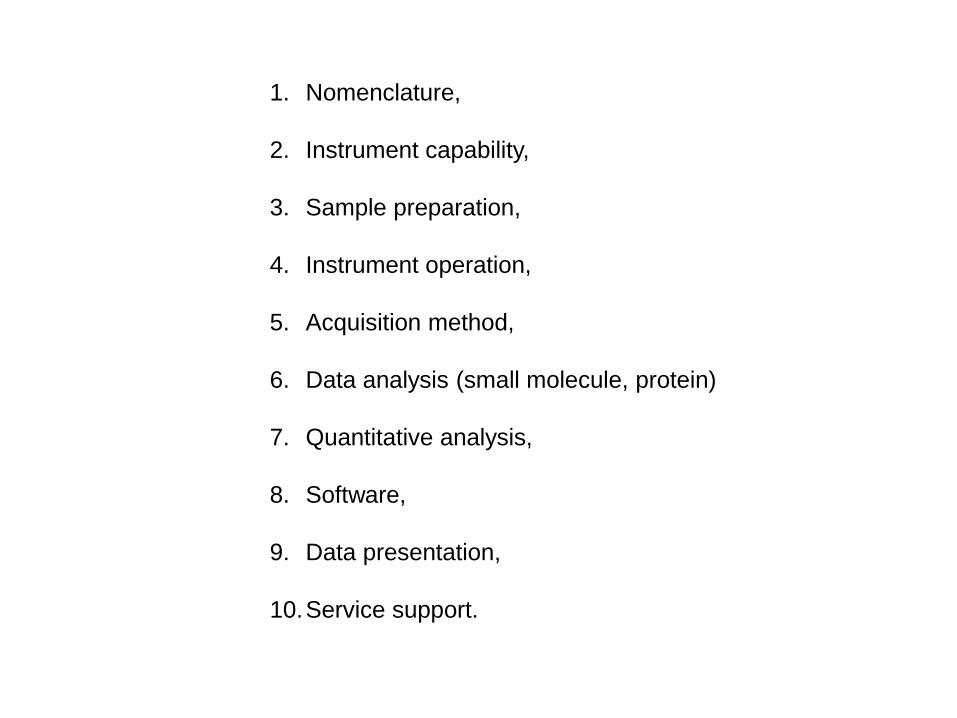
Mass Spectrometry Workshop Department of Chemistry and Biochemistry,
06/25 ~ 27/2013
• Get to know the instruments,
• Exchange ideas,
• Become comfortable in data analysis
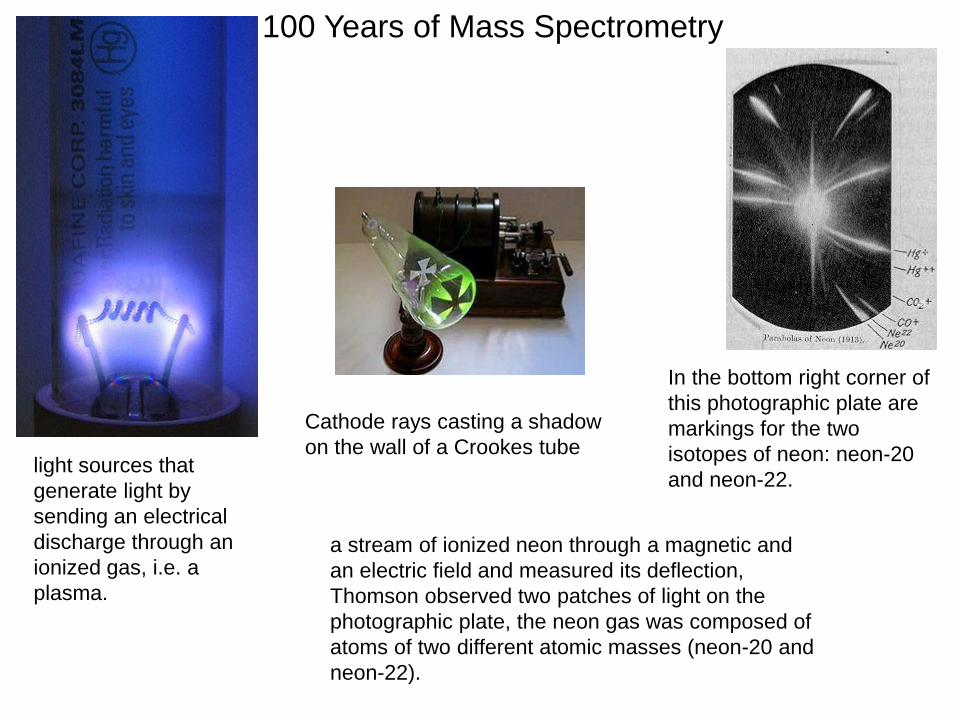
In the bottom right corner of
this photographic plate are
markings for the two
isotopes of neon: neon-20
and neon-22.
a stream of ionized neon through a magnetic and
an electric field and measured its deflection,
Thomson observed two patches of light on the
photographic plate, the neon gas was composed of
atoms of two different atomic masses (neon-20 and
neon-22).
light sources that
generate light by
sending an electrical
discharge through an
ionized gas, i.e. a
plasma.
Cathode rays casting a shadow
on the wall of a Crookes tube
100 Years of Mass Spectrometry
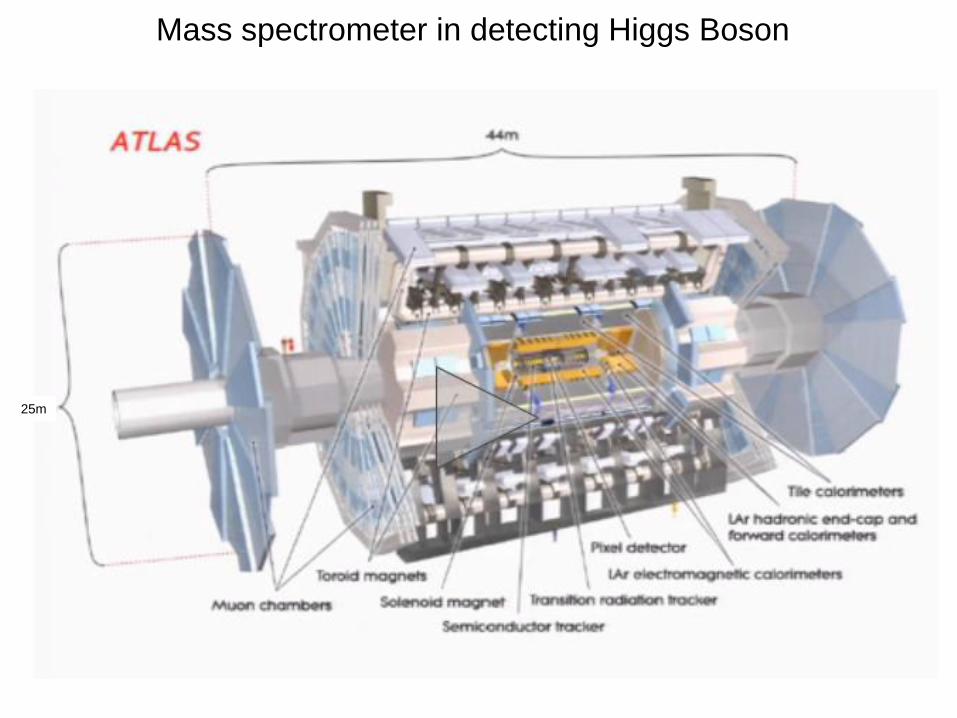
25m
Mass spectrometer in detecting Higgs Boson
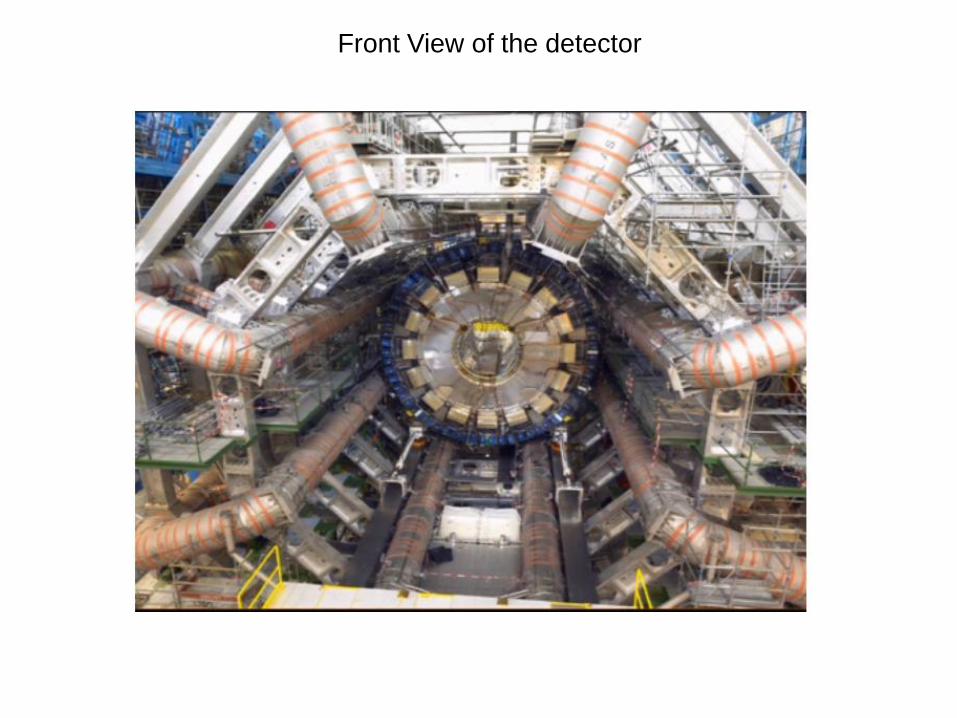
Front View of the detector
m/z
940 942 944 946 948 950 952 954 956 958 960 962 964 966 968 970
%
0
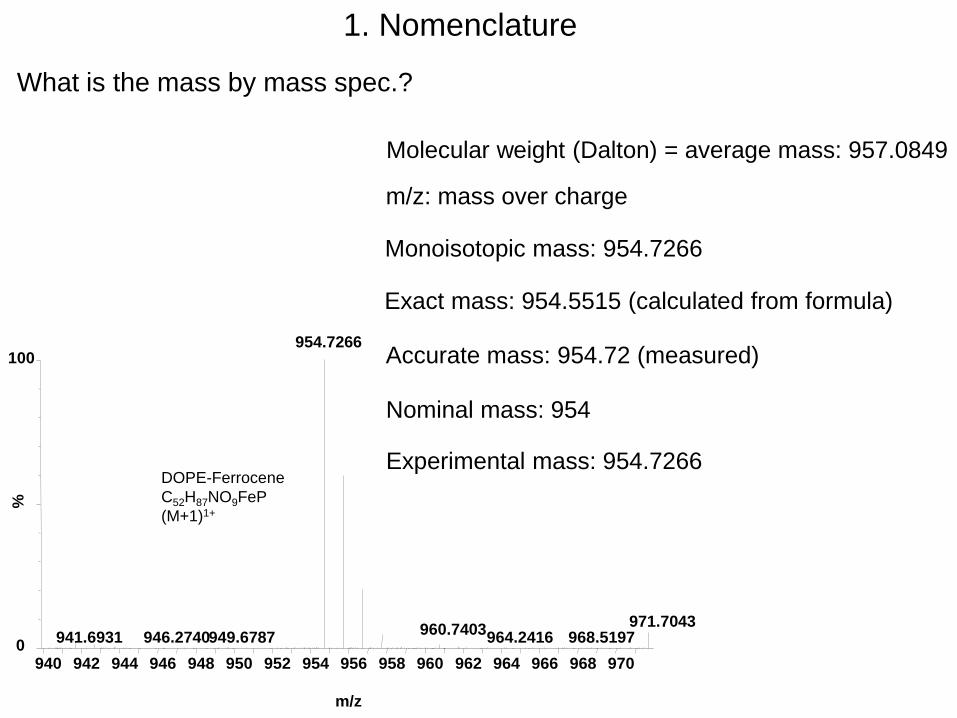
100 954.7266
941.6931 949.6787 946.2740 971.7043
960.7403 964.2416 968.5197
DOPE-Ferrocene
C52H87NO9FeP
(M+1)1+
Molecular weight (Dalton) = average mass: 957.0849
m/z: mass over charge
Monoisotopic mass: 954.7266
Exact mass: 954.5515 (calculated from formula)
Accurate mass: 954.72 (measured)
Nominal mass: 954
Experimental mass: 954.7266
1. Nomenclature
What is the mass by mass spec.?
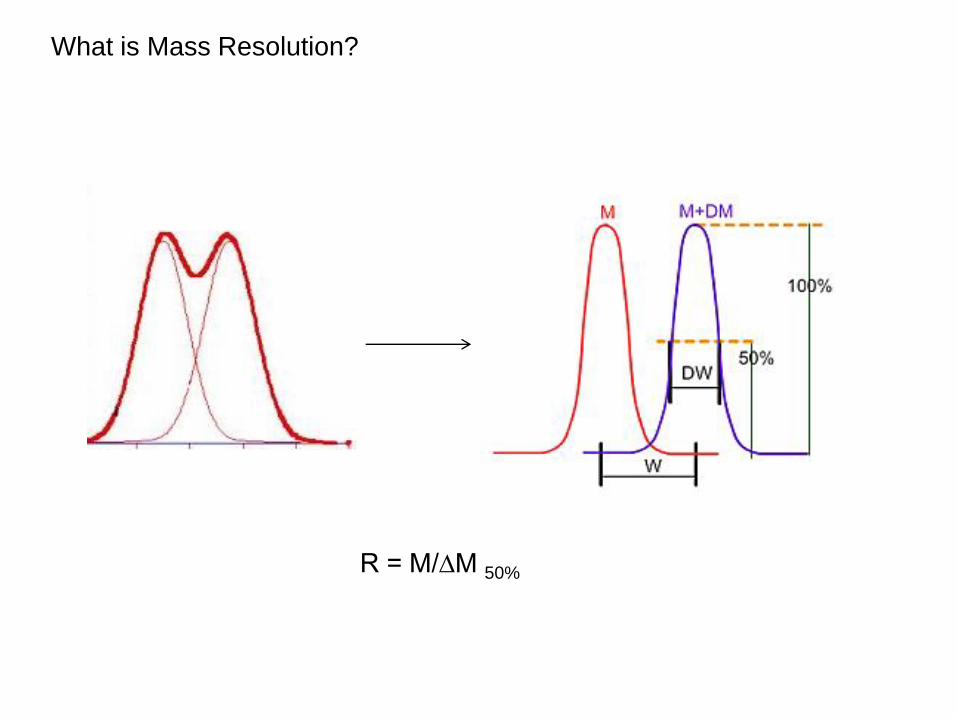
What is Mass Resolution?
R = M/∆M 50%
9/40 ul
m/z300 400 500 600 700 800 900 1000 1100 1200 1300 1400
%
0
100
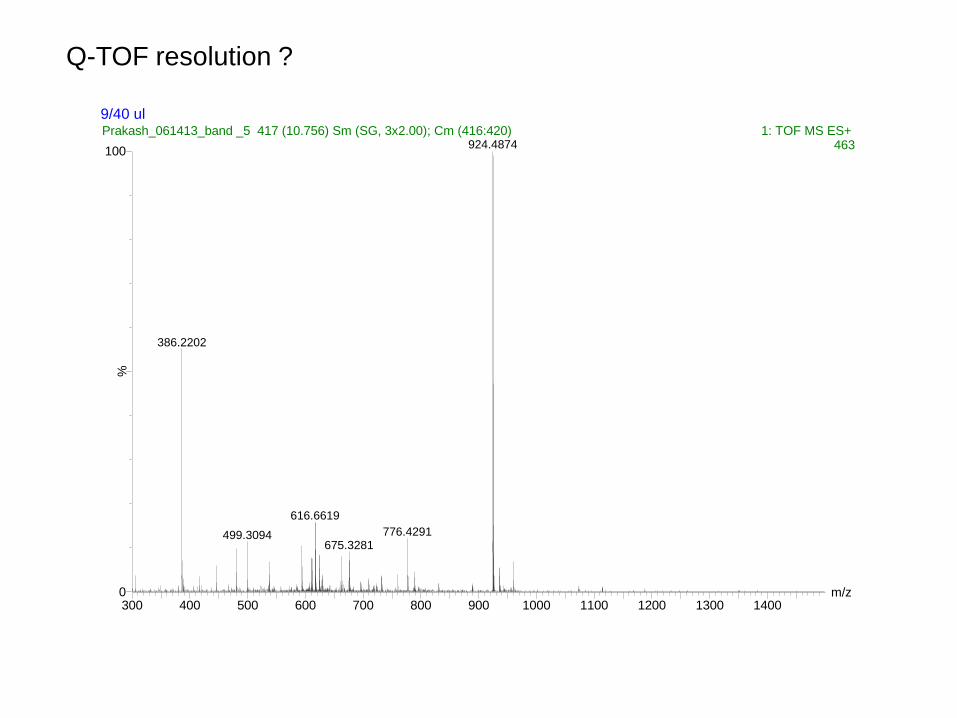
Prakash_061413_band _5 417 (10.756) Sm (SG, 3x2.00); Cm (416:420) 1: TOF MS ES+ 463924.4874
386.2202
616.6619
499.3094 776.4291675.3281
Q-TOF resolution ?
9/40 ul
m/z920 921 922 923 924 925 926 927 928 929
%
0
100
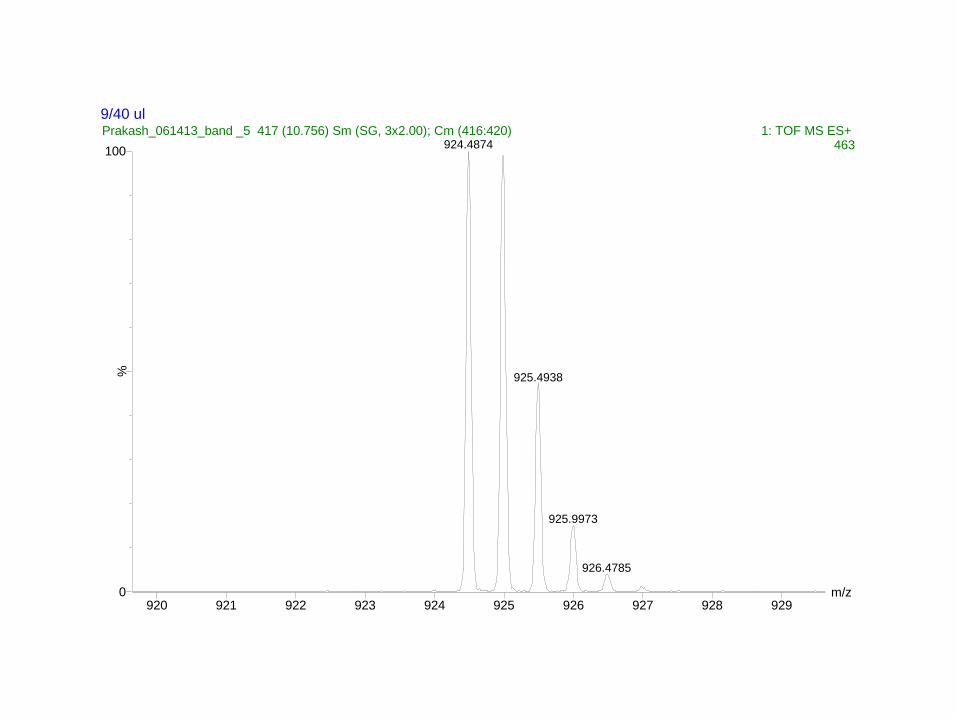
Prakash_061413_band _5 417 (10.756) Sm (SG, 3x2.00); Cm (416:420) 1: TOF MS ES+ 463924.4874
925.4938
925.9973
926.4785
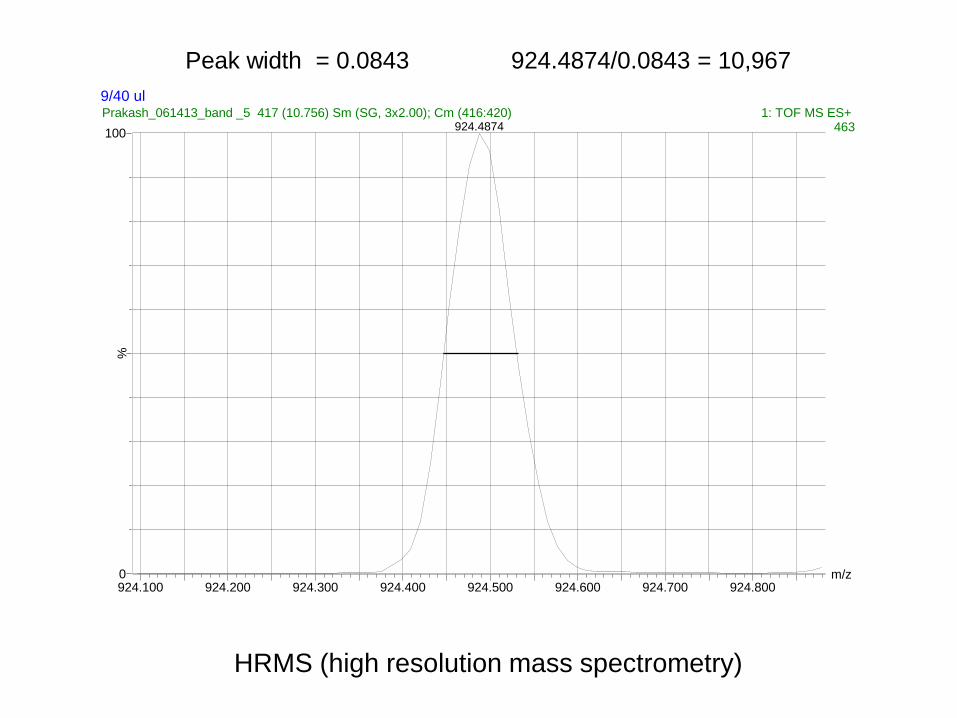
9/40 ul
m/z924.100 924.200 924.300 924.400 924.500 924.600 924.700 924.800
%
0
100
Prakash_061413_band _5 417 (10.756) Sm (SG, 3x2.00); Cm (416:420) 1: TOF MS ES+ 463924.4874
Peak width = 0.0843 924.4874/0.0843 = 10,967
HRMS (high resolution mass spectrometry)
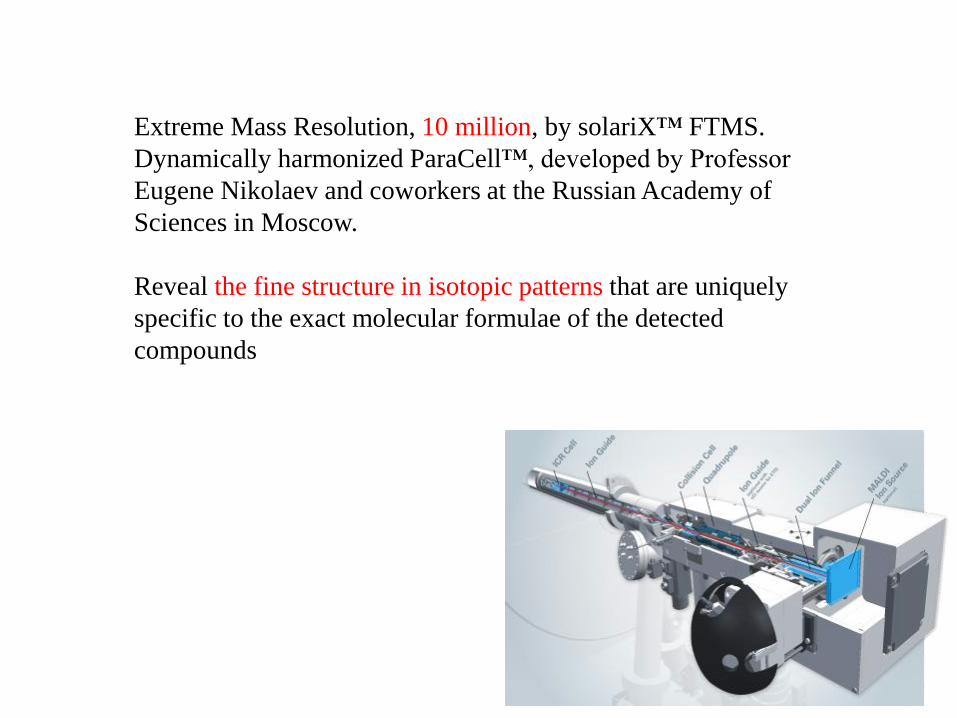
Extreme Mass Resolution, 10 million, by solariX™ FTMS.
Dynamically harmonized ParaCell™, developed by Professor
Eugene Nikolaev and coworkers at the Russian Academy of
Sciences in Moscow.
Reveal the fine structure in isotopic patterns that are uniquely
specific to the exact molecular formulae of the detected
compounds
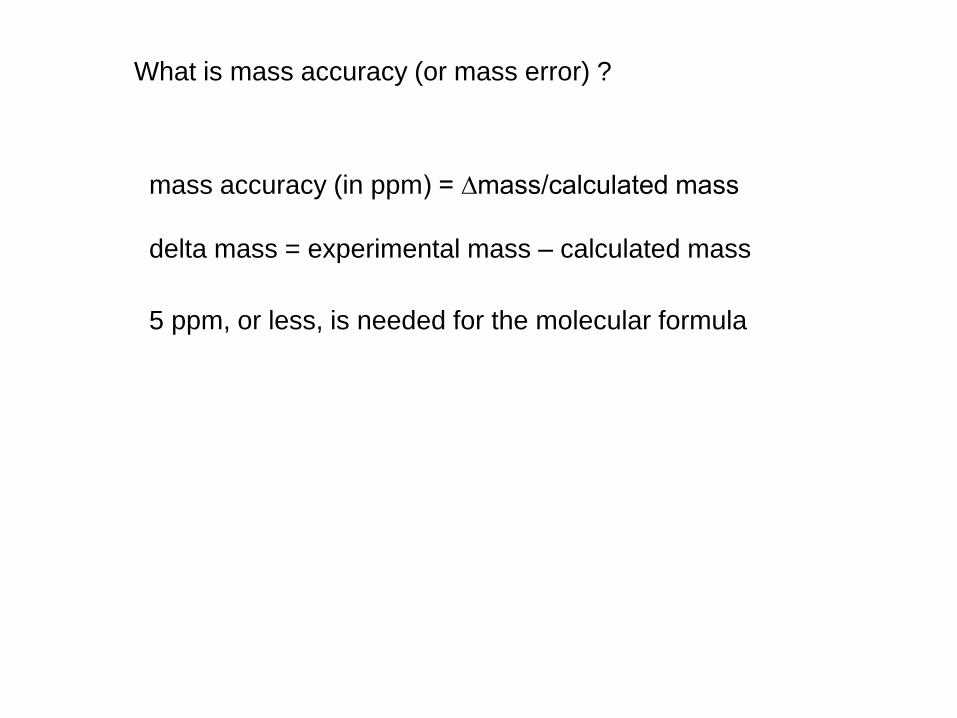
What is mass accuracy (or mass error) ?
mass accuracy (in ppm) = ∆mass/calculated mass
delta mass = experimental mass – calculated mass
5 ppm, or less, is needed for the molecular formula
m/z290 295 300 305 310 315 320 325 330
%
0
100
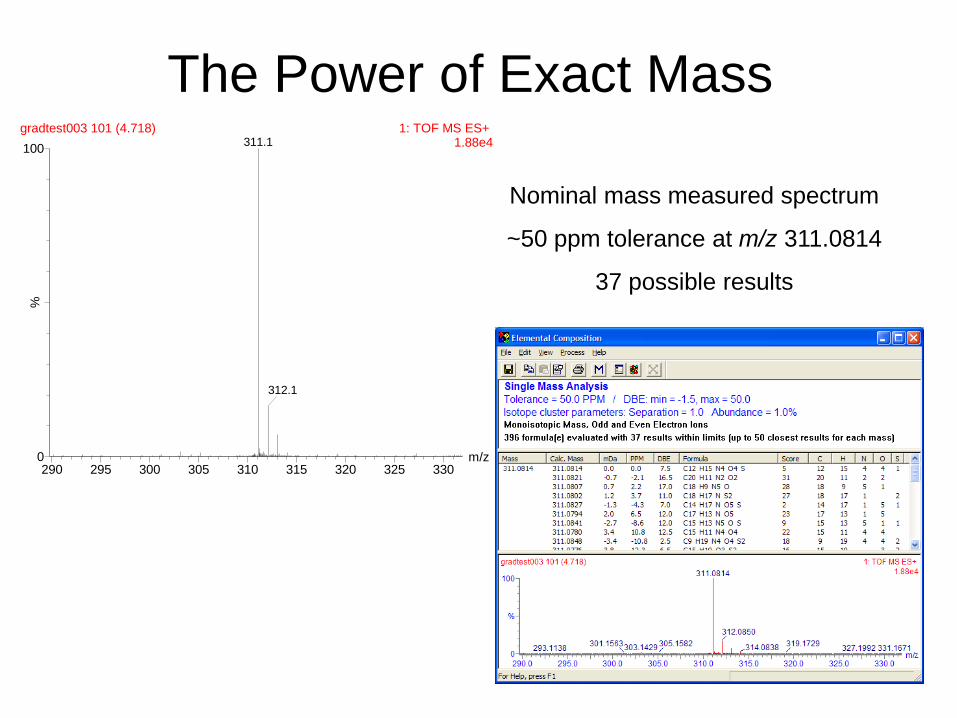
gradtest003 101 (4.718) 1: TOF MS ES+ 1.88e4311.1
312.1
The Power of Exact Mass
Nominal mass measured spectrum
~50 ppm tolerance at m/z 311.0814
37 possible results
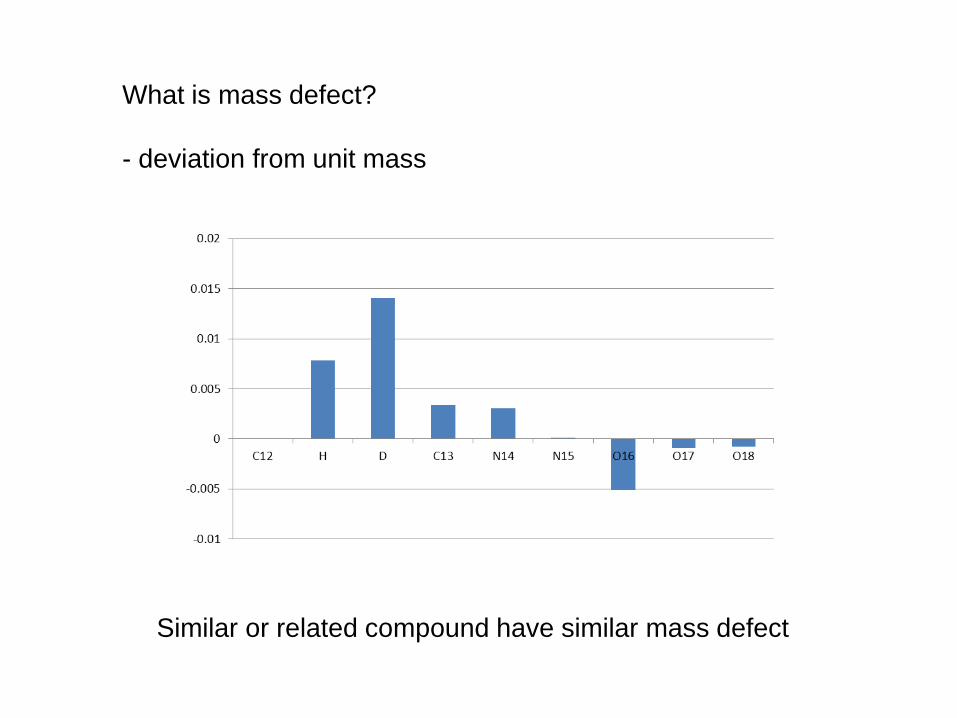
What is mass defect?
- deviation from unit mass
Similar or related compound have similar mass defect
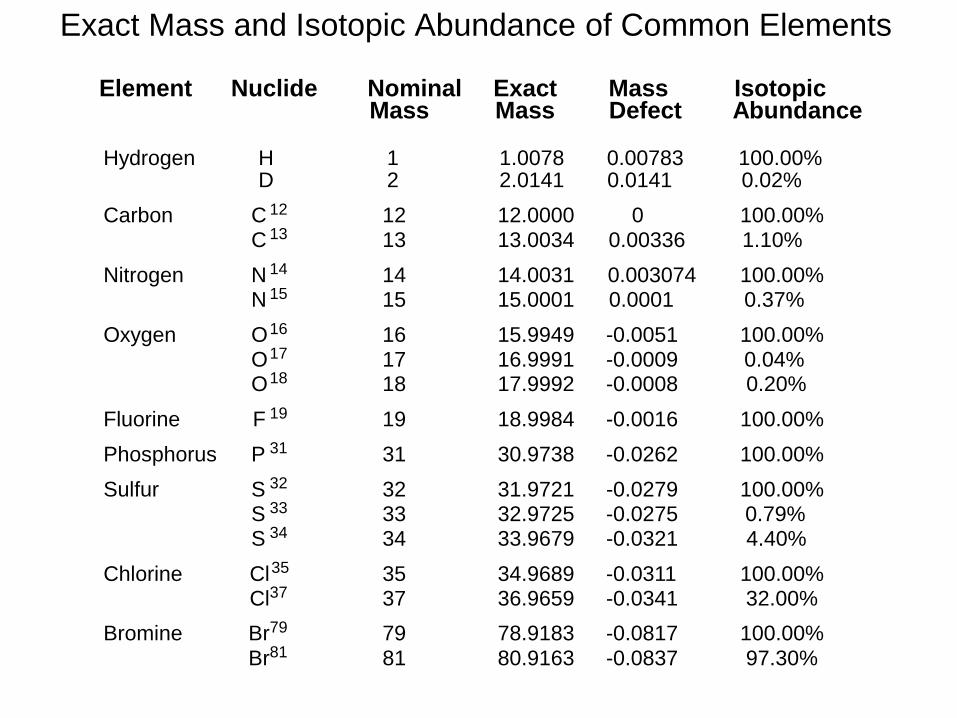
Exact Mass and Isotopic Abundance of Common Elements
Element Nuclide Nominal Exact Mass Isotopic Mass Mass Defect Abundance
Hydrogen H 1 1.0078 0.00783 100.00% D 2 2.0141 0.0141 0.02%
Carbon C 12 12 12.0000 0 100.00% C 13 13 13.0034 0.00336 1.10%
Nitrogen N 14 14 14.0031 0.003074 100.00% N 15 15 15.0001 0.0001 0.37%
Oxygen O 16 16 15.9949 -0.0051 100.00% O 17 17 16.9991 -0.0009 0.04% O 18 18 17.9992 -0.0008 0.20%
Fluorine F 19 19 18.9984 -0.0016 100.00%
Phosphorus P 31 31 30.9738 -0.0262 100.00%
Sulfur S 32 32 31.9721 -0.0279 100.00% S 33 33 32.9725 -0.0275 0.79% S 34 34 33.9679 -0.0321 4.40%
Chlorine Cl 35 35 34.9689 -0.0311 100.00% Cl 37 37 36.9659 -0.0341 32.00%
Bromine Br 79 79 78.9183 -0.0817 100.00%
Br 81 81 80.9163 -0.0837 97.30%
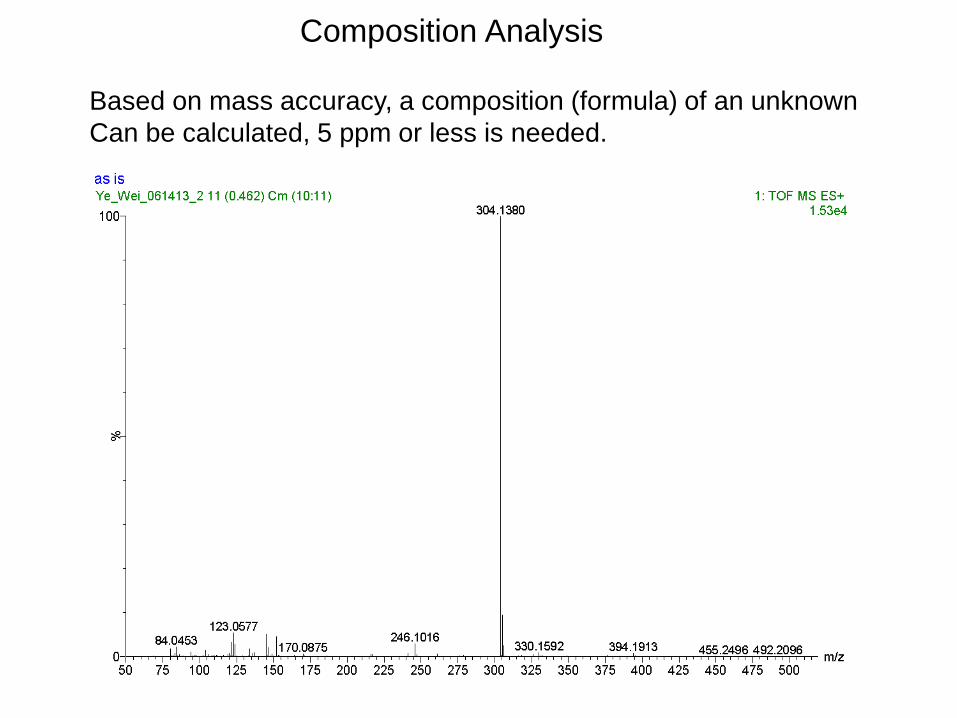
Composition Analysis
Based on mass accuracy, a composition (formula) of an unknown
Can be calculated, 5 ppm or less is needed.
m/z200 210 220 230 240 250 260 270 280 290 300 310 320 330 340 350 360 370 380 390
%
0
100
as is
Ye_Wei_061413_2 11 (0.462) Cm (10:11) 1: TOF MS ES+
1.54e+004304.1380
246.1016241.1813216.0938198.1902
261.1342 279.0959304.0235
305.1450
330.1592 376.1976349.1861361.2078 393.2234
m/z
%
0
100
C11 H20 N4 O6
304.1383
305.1411
306.1431
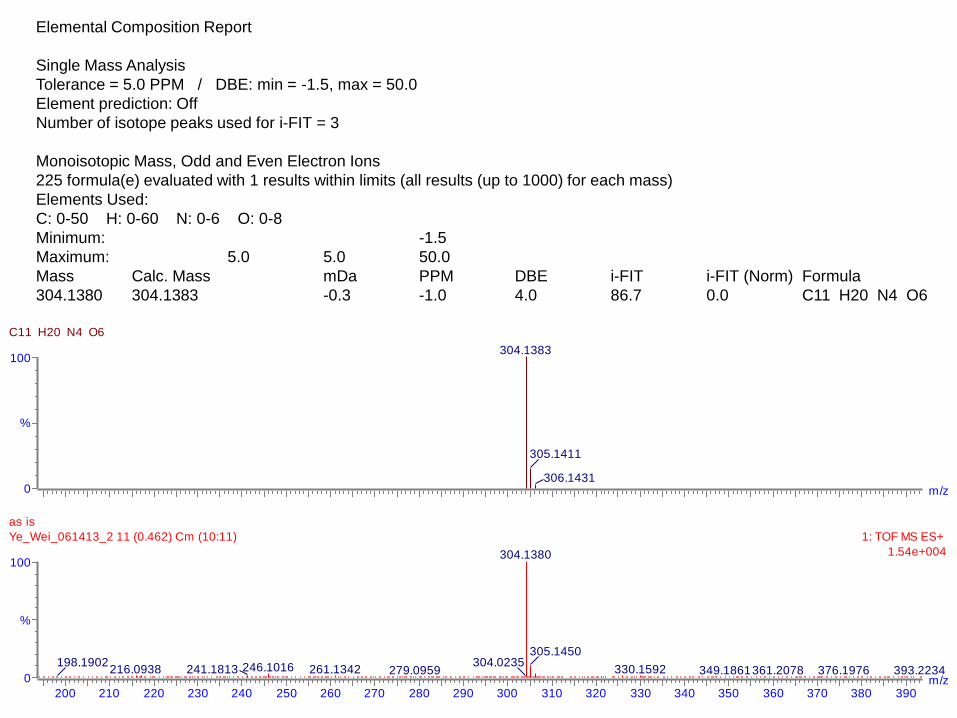
Elemental Composition Report
Single Mass Analysis
Tolerance = 5.0 PPM / DBE: min = -1.5, max = 50.0
Element prediction: Off
Number of isotope peaks used for i-FIT = 3
Monoisotopic Mass, Odd and Even Electron Ions
225 formula(e) evaluated with 1 results within limits (all results (up to 1000) for each mass)
Elements Used:
C: 0-50 H: 0-60 N: 0-6 O: 0-8
Minimum: -1.5
Maximum: 5.0 5.0 50.0
Mass Calc. Mass mDa PPM DBE i-FIT i-FIT (Norm) Formula
304.1380 304.1383 -0.3 -1.0 4.0 86.7 0.0 C11 H20 N4 O6
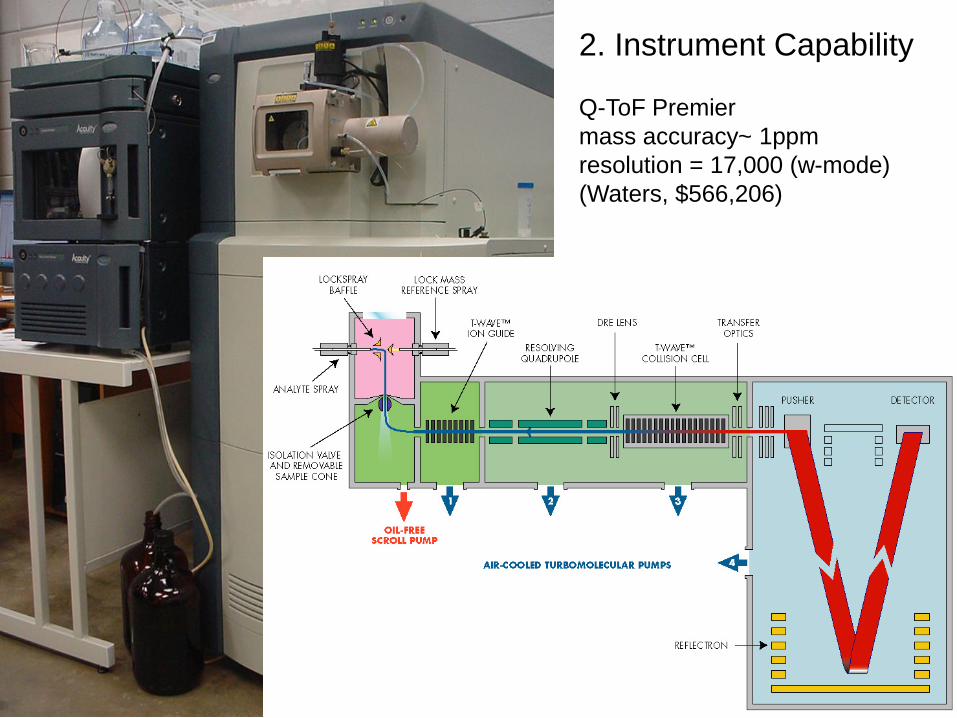
Q-ToF Premier
mass accuracy~ 1ppm
resolution = 17,000 (w-mode)
(Waters, $566,206)
2. Instrument Capability
+
+
+
+
+
+
+
+
+
+
+
+
+
+ +
+
+
+
+
+ +
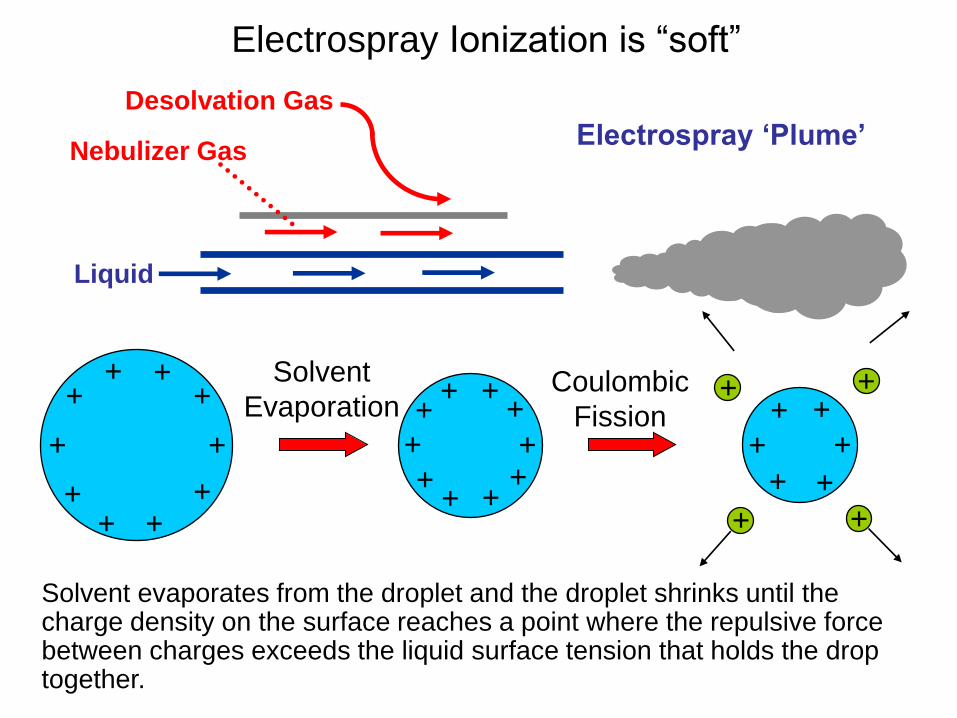
Solvent
Evaporation
+ + +
+
+
+
Coulombic
Fission
+
+
+
Electrospray Ionization is “soft”
Solvent evaporates from the droplet and the droplet shrinks until the charge density on the surface reaches a point where the repulsive force between charges exceeds the liquid surface tension that holds the drop together.
Liquid
Nebulizer Gas
Desolvation Gas
Electrospray ‘Plume’
- - - Liquid
Electrospray
Probe Tip
+ + + +
High Voltage
+ + + +
+
+ +
+
+ -
+
+ +
+
+ +
+
+
+ - +
+ +
+
+
- -
+
+ +
+ +
- - + + +
+
+ - - +
+ +
+
+ - -
+ + + - -
- + - - - -
+ - - - +
- + - - - + -
- + - + -
- - + -
- +
- - +
- -
-
+
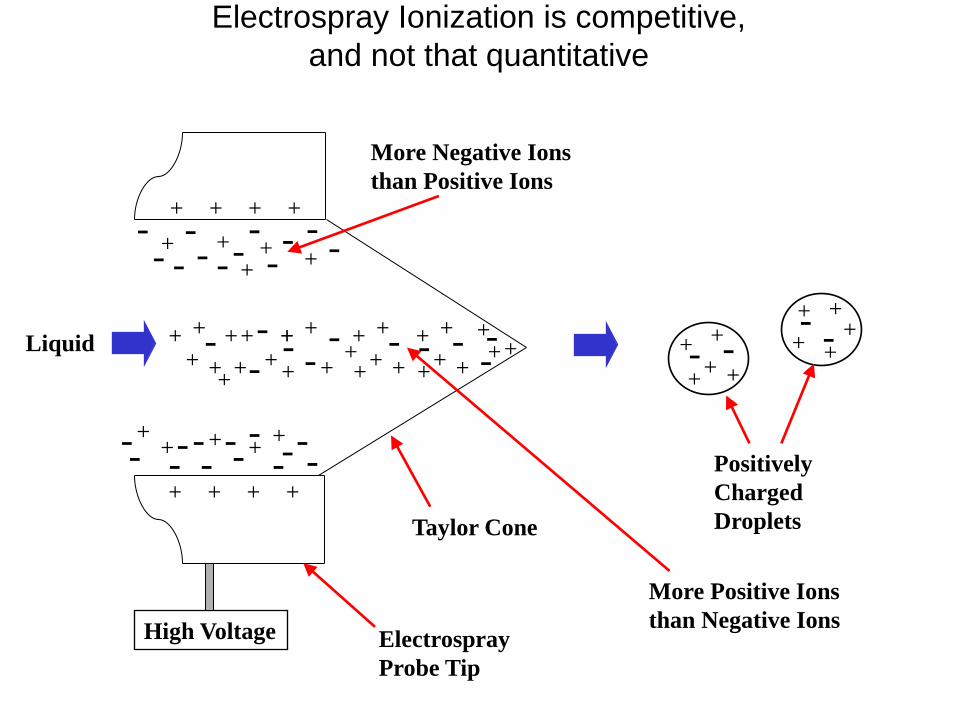
Electrospray Ionization is competitive,
and not that quantitative
Taylor Cone
More Negative Ions
than Positive Ions
More Positive Ions
than Negative Ions
Positively
Charged
Droplets
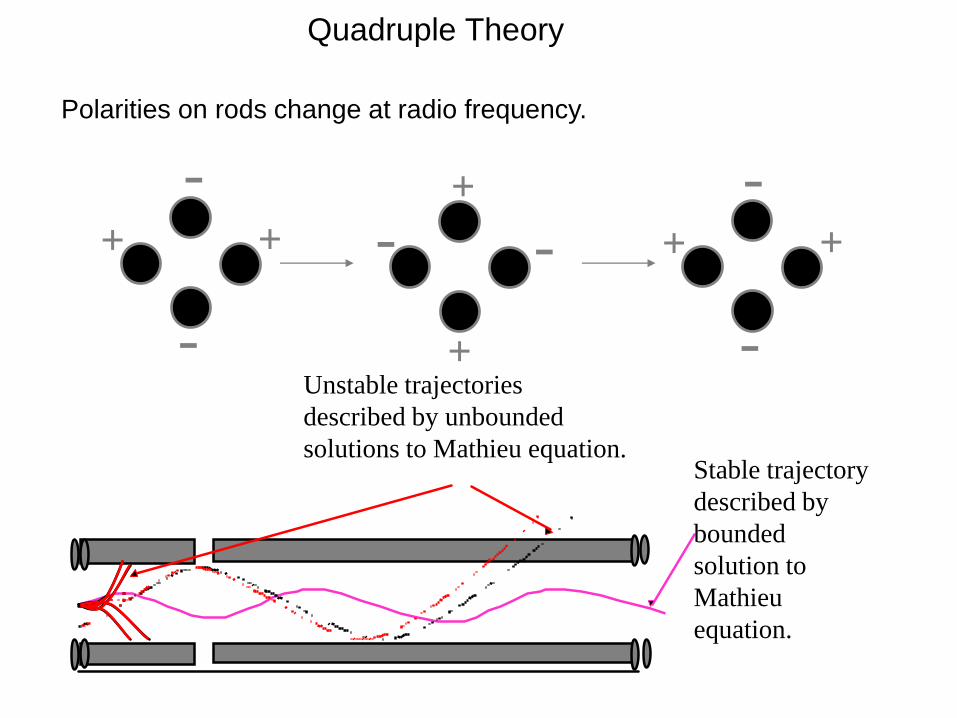
Unstable trajectories
described by unbounded
solutions to Mathieu equation.
+
-
Quadruple Theory
Polarities on rods change at radio frequency.
Stable trajectory
described by
bounded
solution to
Mathieu
equation.
-
+
+
-
- + +
-
+
-
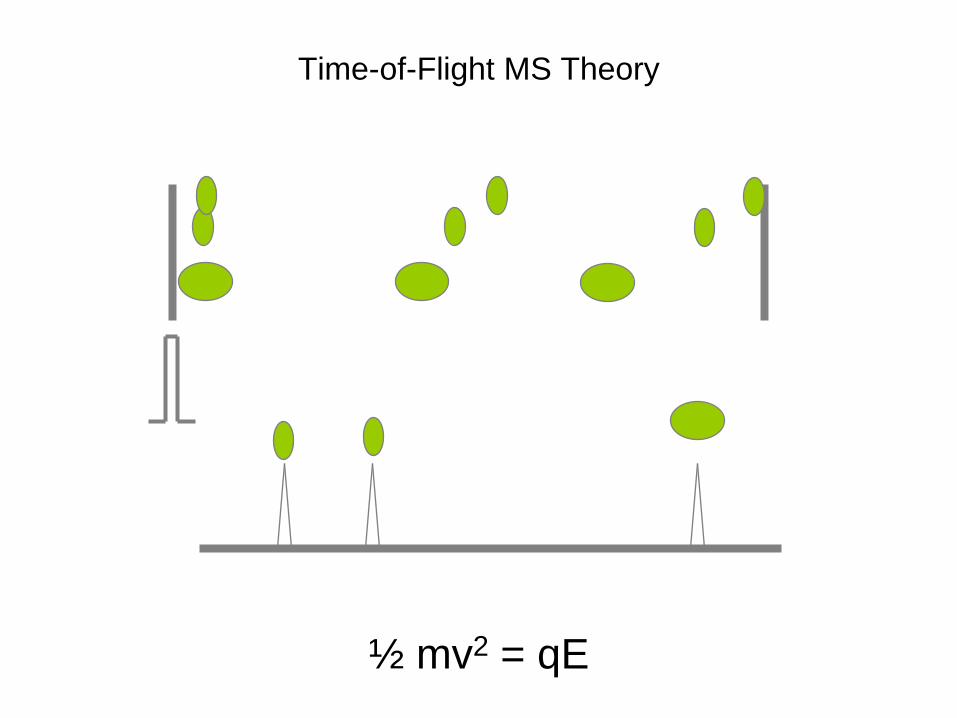
Pusher Detector
Time from Push
Time-of-Flight MS Theory
½ mv2 = qE
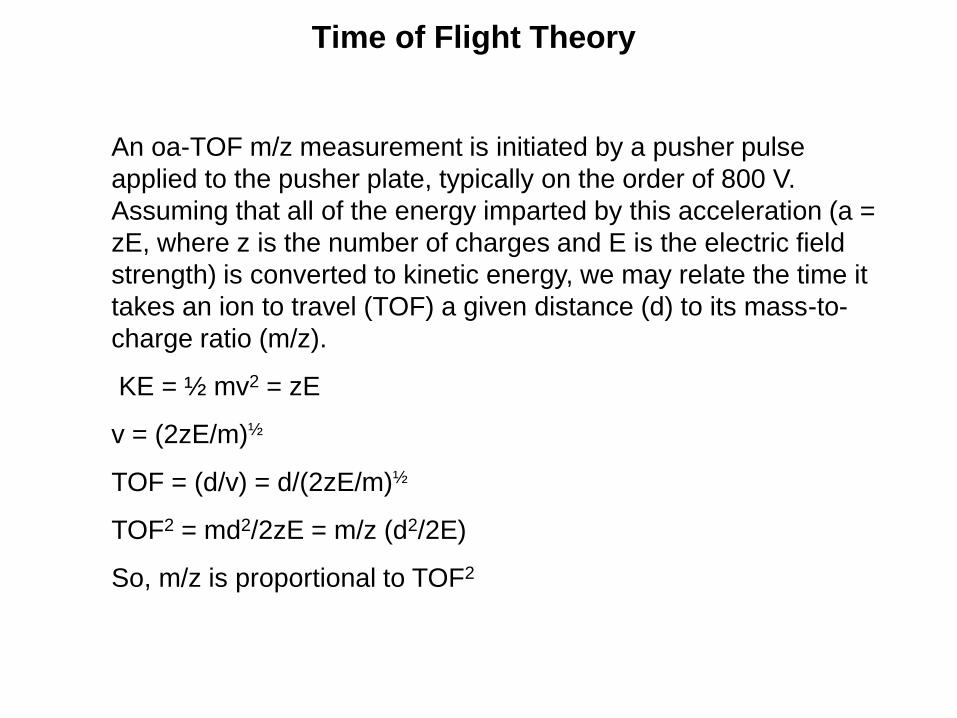
Time of Flight Theory
An oa-TOF m/z measurement is initiated by a pusher pulse
applied to the pusher plate, typically on the order of 800 V.
Assuming that all of the energy imparted by this acceleration (a =
zE, where z is the number of charges and E is the electric field
strength) is converted to kinetic energy, we may relate the time it
takes an ion to travel (TOF) a given distance (d) to its mass-to-
charge ratio (m/z).
KE = ½ mv2 = zE
v = (2zE/m)½
TOF = (d/v) = d/(2zE/m)½
TOF2 = md2/2zE = m/z (d2/2E)
So, m/z is proportional to TOF2
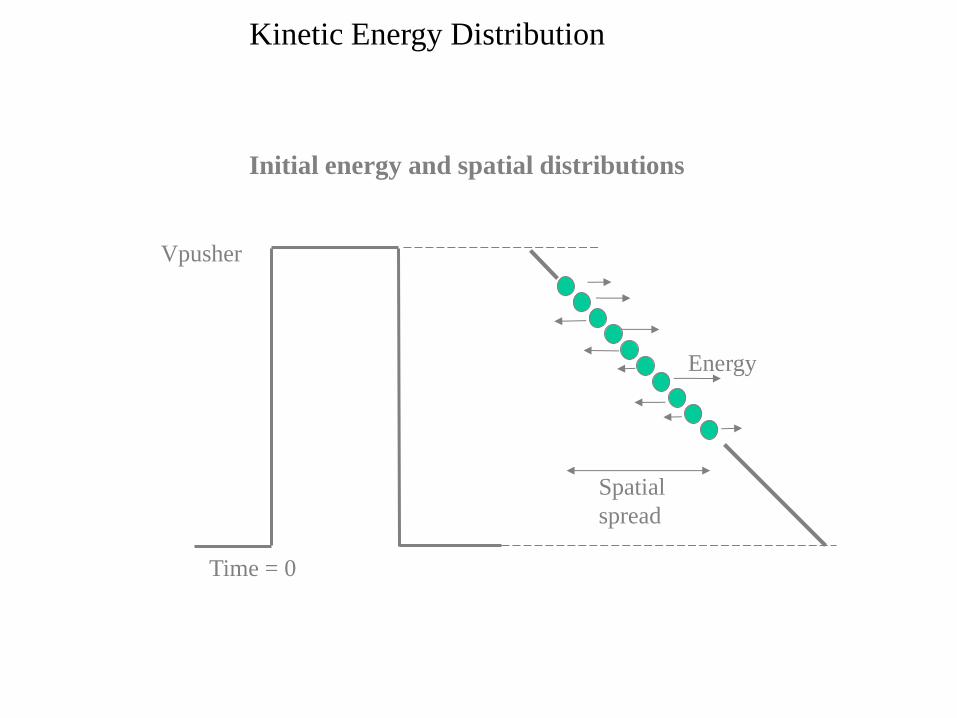
Vpusher
Time = 0
Spatial
spread
Energy
Initial energy and spatial distributions
Kinetic Energy Distribution
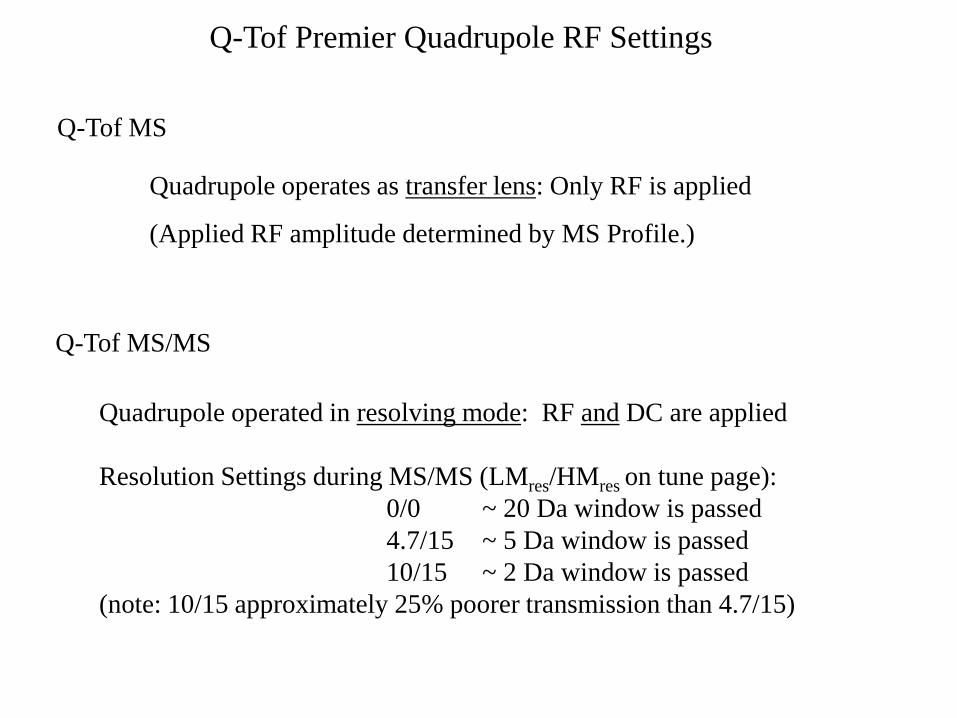
Q-Tof MS/MS
Quadrupole operated in resolving mode: RF and DC are applied
Resolution Settings during MS/MS (LMres/HMres on tune page):
0/0 ~ 20 Da window is passed
4.7/15 ~ 5 Da window is passed
10/15 ~ 2 Da window is passed
(note: 10/15 approximately 25% poorer transmission than 4.7/15)
Q-Tof MS
Quadrupole operates as transfer lens: Only RF is applied
(Applied RF amplitude determined by MS Profile.)
Q-Tof Premier Quadrupole RF Settings
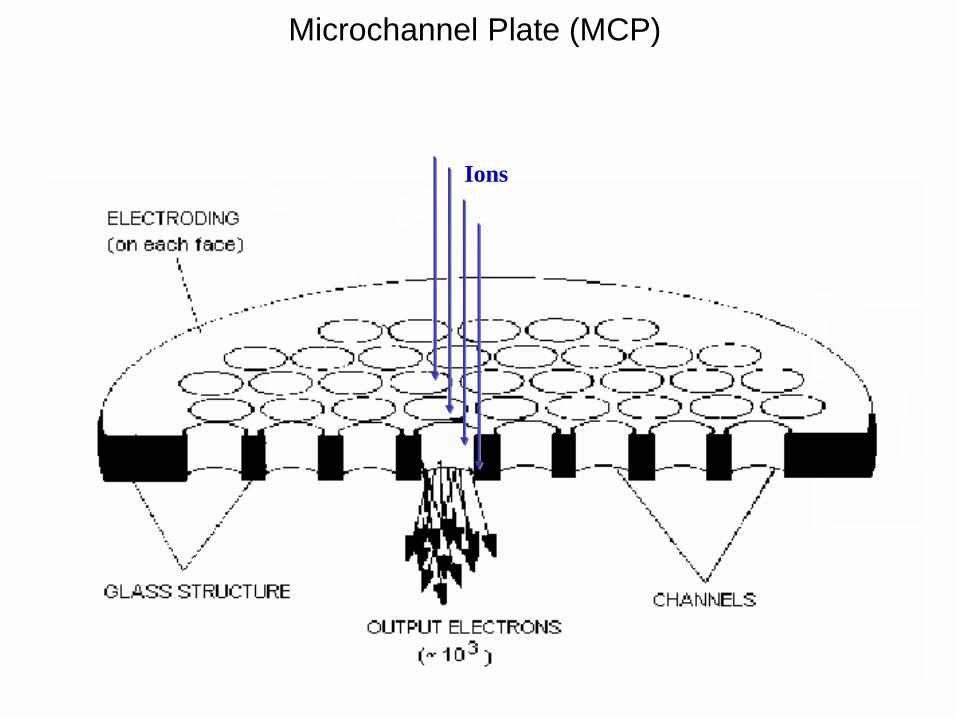
Microchannel Plate (MCP)
Ions
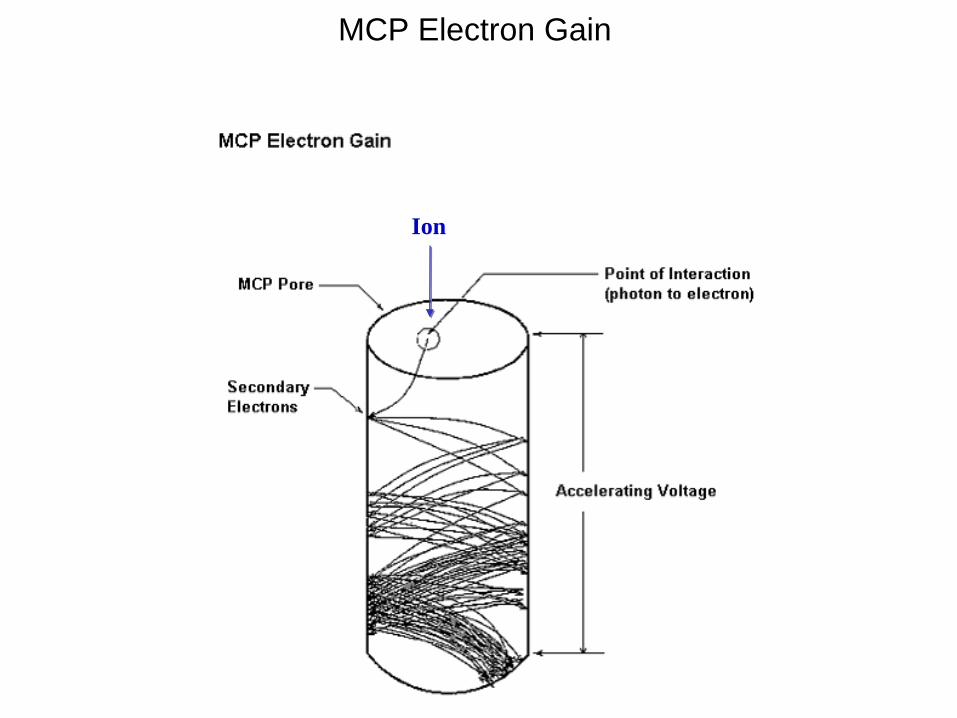
MCP Electron Gain
Ion
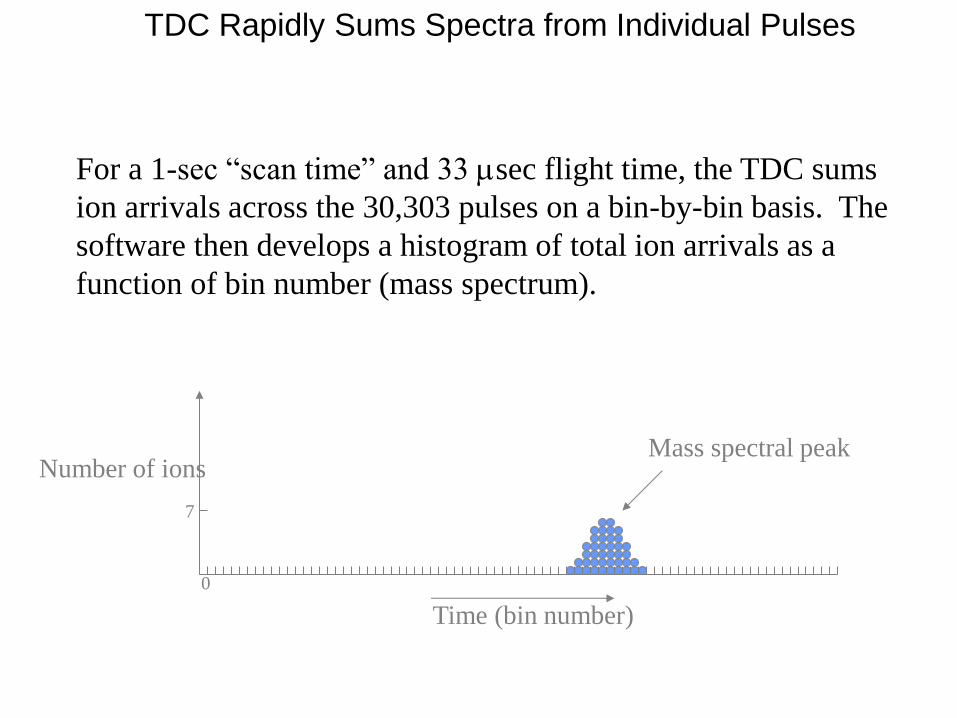
Time (bin number)
0
Number of ions Mass spectral peak
7
TDC Rapidly Sums Spectra from Individual Pulses
For a 1-sec “scan time” and 33 sec flight time, the TDC sums
ion arrivals across the 30,303 pulses on a bin-by-bin basis. The
software then develops a histogram of total ion arrivals as a
function of bin number (mass spectrum).
Time
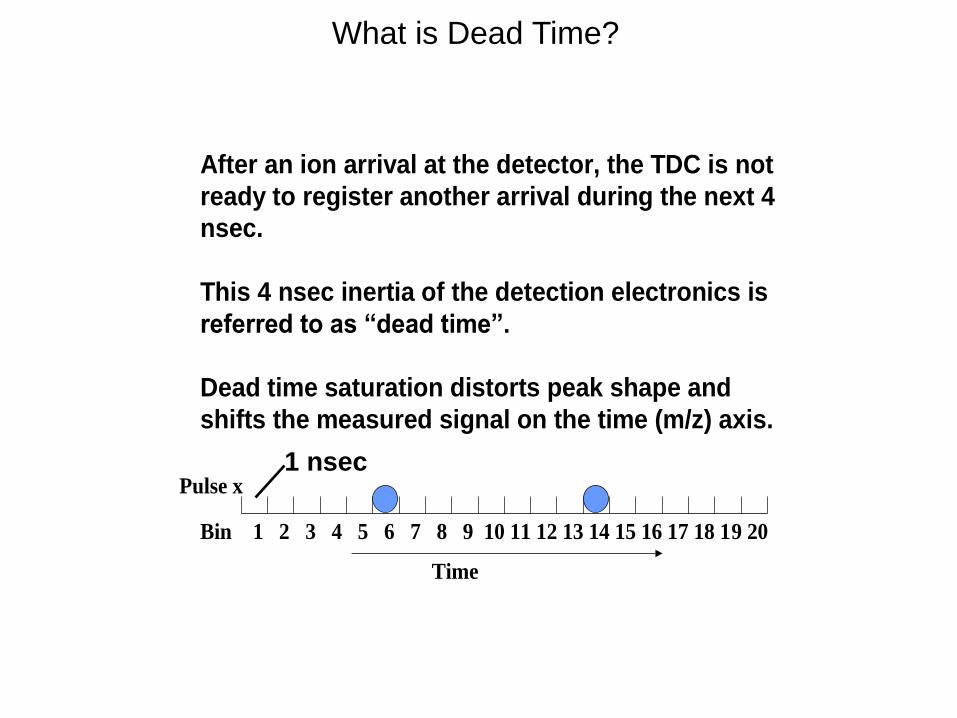
After an ion arrival at the detector, the TDC is not
ready to register another arrival during the next 4
nsec.
This 4 nsec inertia of the detection electronics is
referred to as “dead time”.
Dead time saturation distorts peak shape and
shifts the measured signal on the time (m/z) axis.
Bin 1 2 3 4 5 6 7 8 9 10 11 12 13 14 15 16 17 18 19 20
Pulse x
What is Dead Time?
1 nsec
1 2 3 4 5 6 7 8 9 10 11 12 13 14 15 16 17 18 19 20 21
Bin num be r
Inte
ns
ity
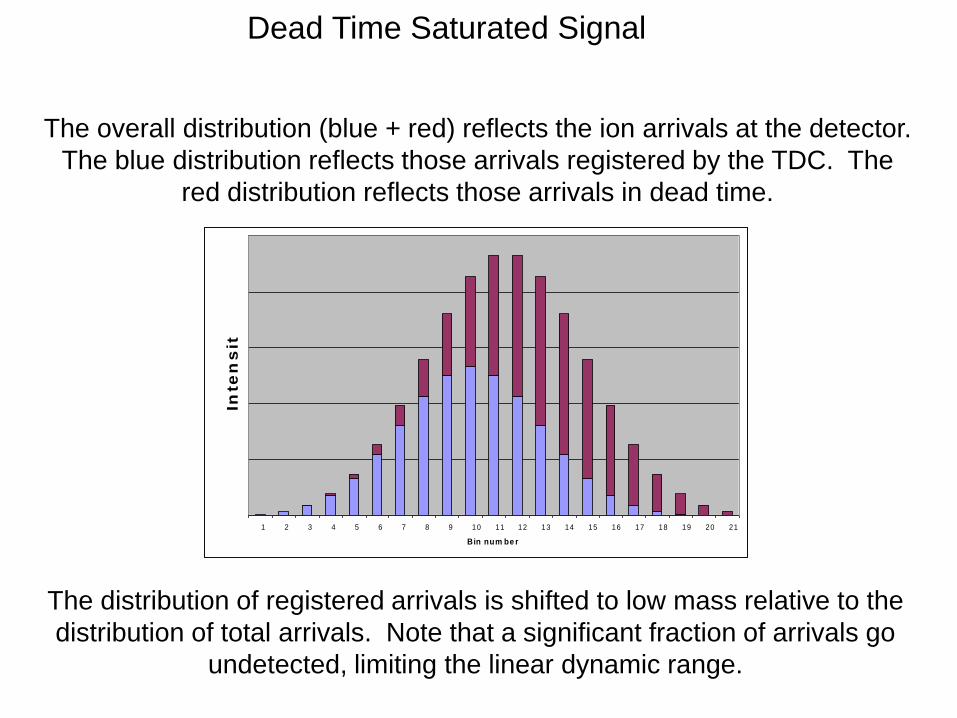
Dead Time Saturated Signal
The overall distribution (blue + red) reflects the ion arrivals at the detector.
The blue distribution reflects those arrivals registered by the TDC. The
red distribution reflects those arrivals in dead time.
The distribution of registered arrivals is shifted to low mass relative to the
distribution of total arrivals. Note that a significant fraction of arrivals go
undetected, limiting the linear dynamic range.
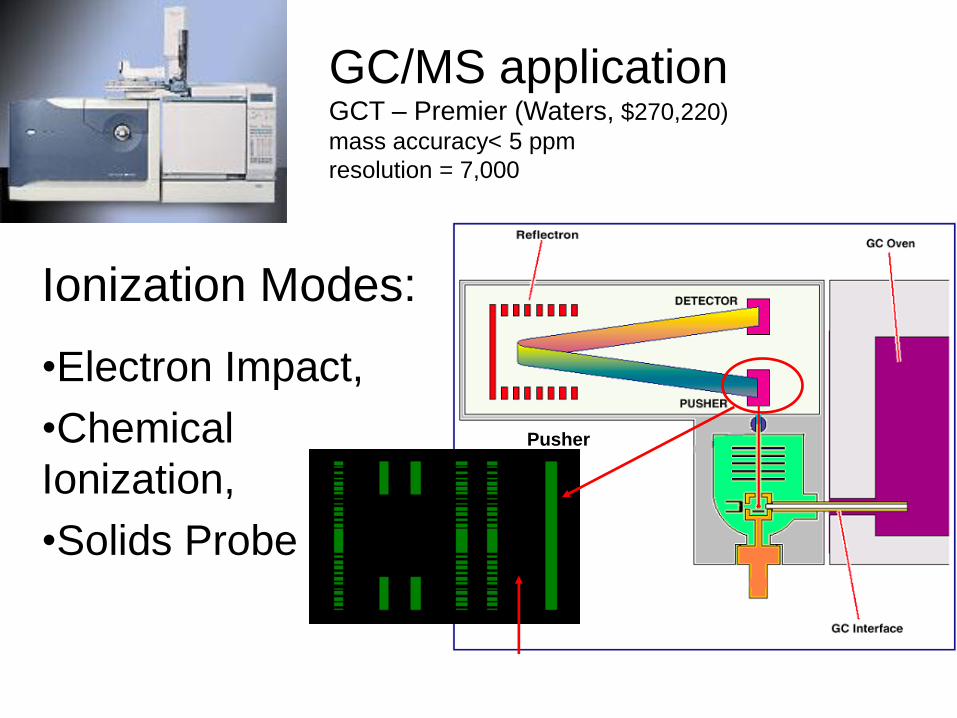
GC/MS application GCT – Premier (Waters, $270,220)
mass accuracy< 5 ppm
resolution = 7,000
Ionization Modes:
•Electron Impact,
•Chemical
Ionization,
•Solids Probe
Ion
Beam
Ring
Lenses
Pusher
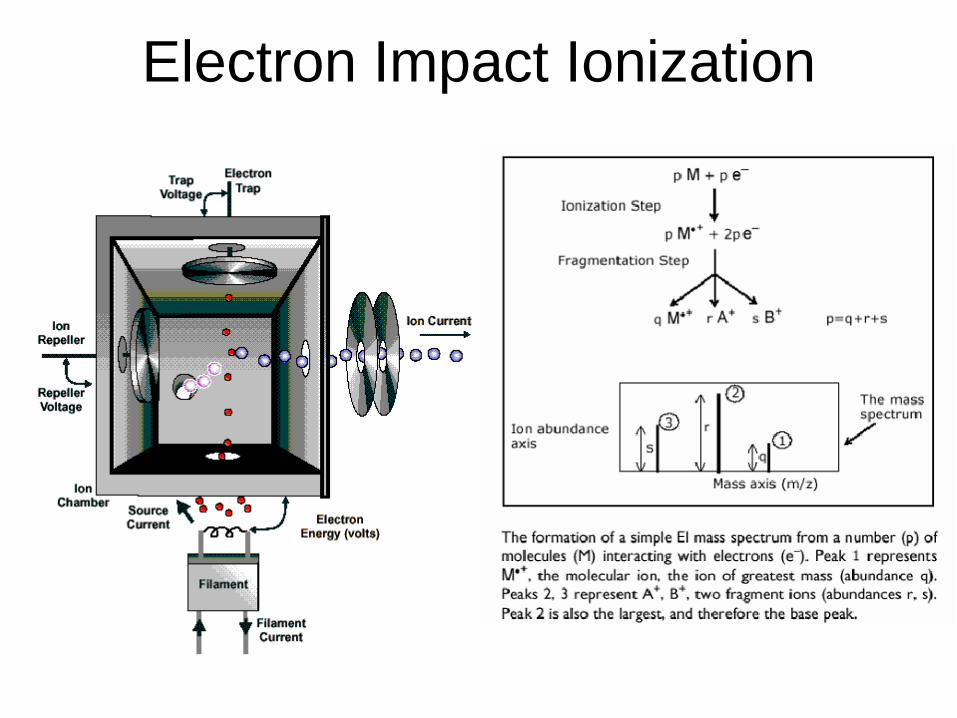
Electron Impact Ionization
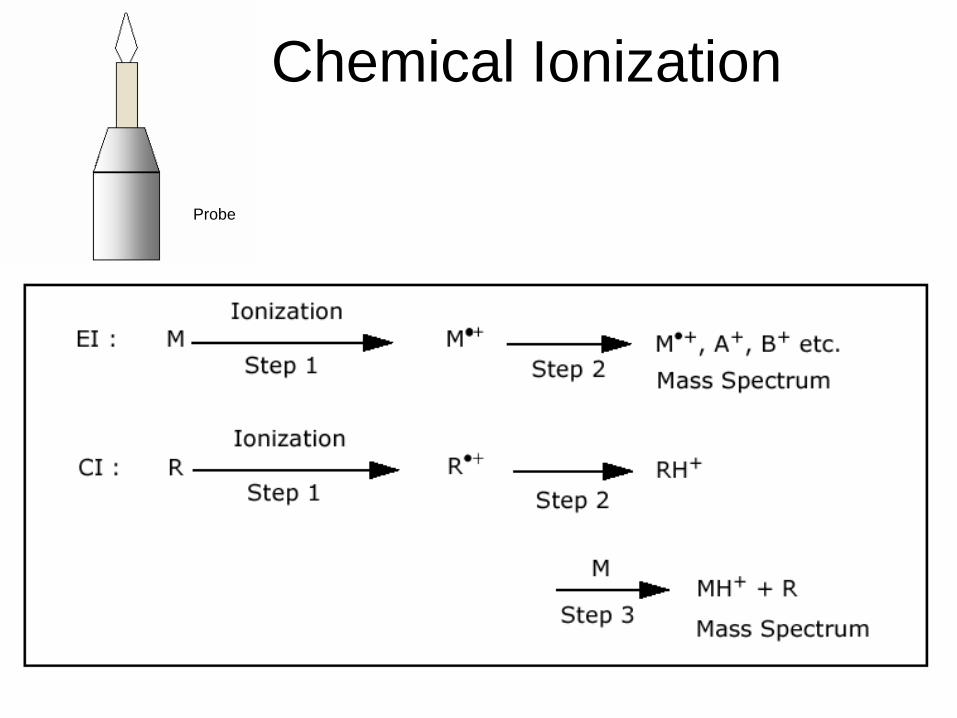
Chemical Ionization
Probe
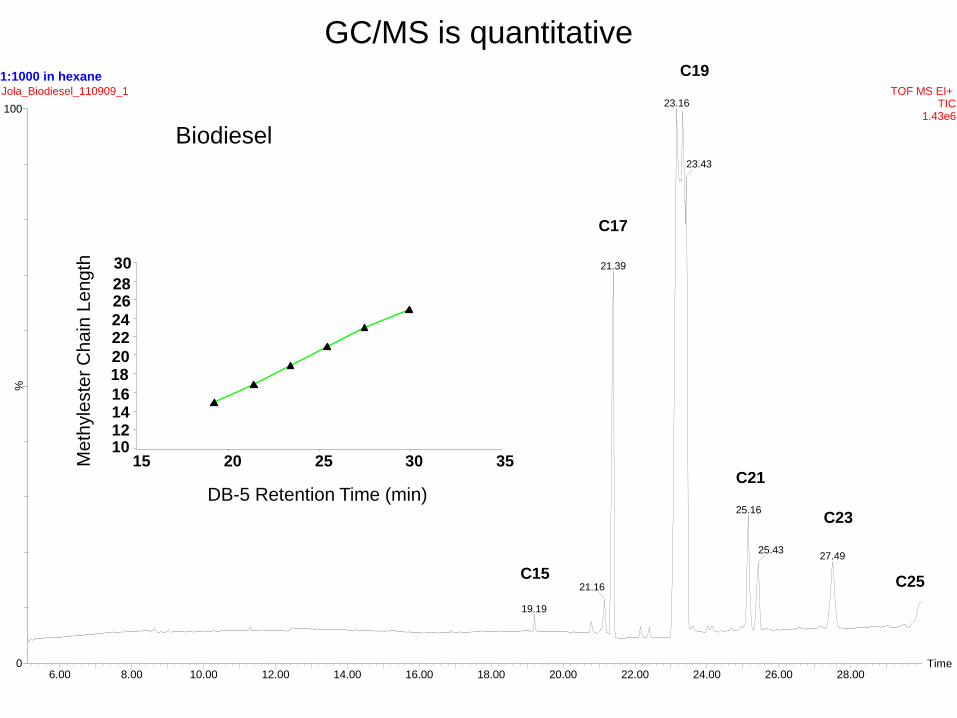
1:1000 in hexane
Time6.00 8.00 10.00 12.00 14.00 16.00 18.00 20.00 22.00 24.00 26.00 28.00
%
0
100
Jola_Biodiesel_110909_1 TOF MS EI+ TIC
1.43e6
23.16
21.39
21.16
19.19
23.43
25.16
27.4925.43
Biodiesel
C17
C19
C21
C23
C25 C15
GC/MS is quantitative
10 12 14 16
18 20
22 24
26 28
30
15 20 25 30 35
DB-5 Retention Time (min)
Me
thyle
ste
r C
ha
in L
en
gth
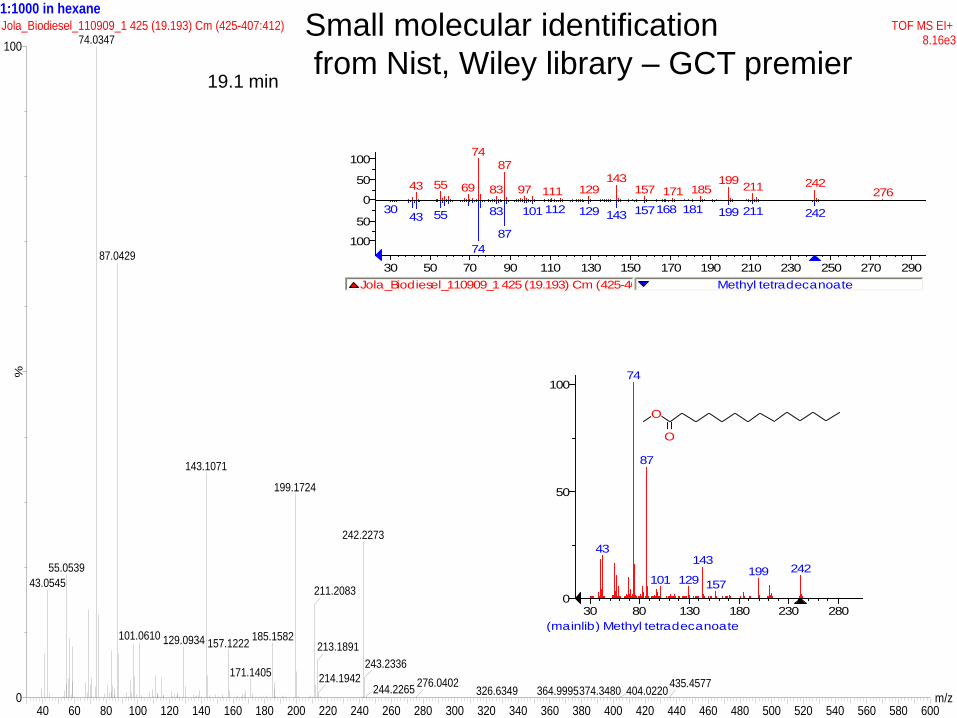
1:1000 in hexane
m/z40 60 80 100 120 140 160 180 200 220 240 260 280 300 320 340 360 380 400 420 440 460 480 500 520 540 560 580 600
%
0
100
Jola_Biodiesel_110909_1 425 (19.193) Cm (425-407:412) TOF MS EI+ 8.16e374.0347
55.0539
43.0545
87.0429
143.1071
101.0610 129.0934
199.1724
185.1582157.1222
171.1405
242.2273
211.2083
213.1891
214.1942
243.2336
244.2265276.0402
364.9995326.6349 374.3480 404.0220435.4577
(mainlib) Methyl tetradecanoate
30 80 130 180 230 280
0
50
100
43
74
87
101 129
143
157199 242
O
O
Jola_Biodiesel_110909_1 425 (19.193) Cm (425-407:412) Methyl tetradecanoate
30 50 70 90 110 130 150 170 190 210 230 250 270 290
0
50
100
50
100
30
43
43
55
55
69
74
74
83
83
87
87
97
101
111
112
129
129
143
143
157
157168
171
181
185199
199
211
211
242
242
276
19.1 min
Small molecular identification
from Nist, Wiley library – GCT premier
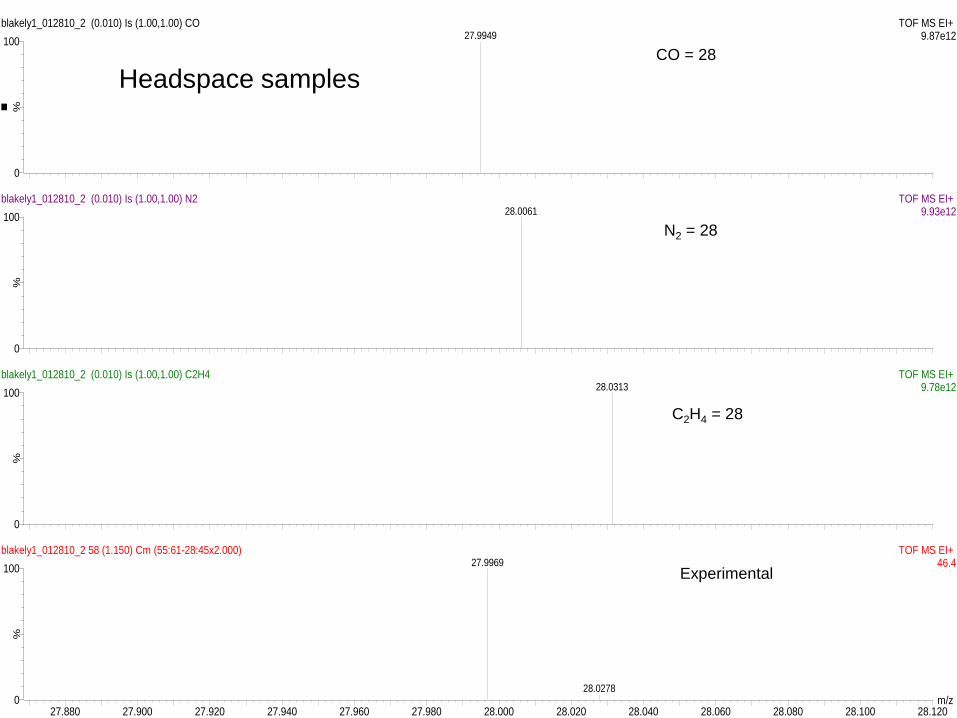
m/z27.880 27.900 27.920 27.940 27.960 27.980 28.000 28.020 28.040 28.060 28.080 28.100 28.120
%
0
100
%
0
100
%
0
100
%
0
100
blakely1_012810_2 (0.010) Is (1.00,1.00) CO TOF MS EI+ 9.87e1227.9949
blakely1_012810_2 (0.010) Is (1.00,1.00) N2 TOF MS EI+ 9.93e1228.0061
blakely1_012810_2 (0.010) Is (1.00,1.00) C2H4 TOF MS EI+ 9.78e1228.0313
blakely1_012810_2 58 (1.150) Cm (55:61-28:45x2.000) TOF MS EI+ 46.427.9969
28.0278
CO = 28
N2 = 28
C2H4 = 28
Experimental
Headspace samples
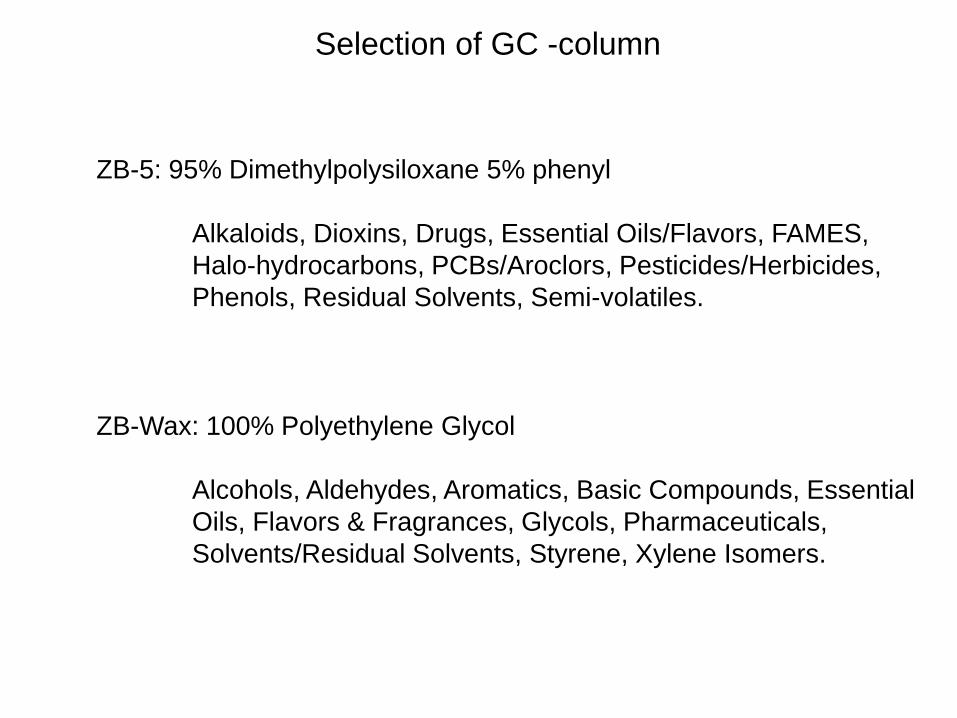
Selection of GC -column
ZB-5: 95% Dimethylpolysiloxane 5% phenyl
Alkaloids, Dioxins, Drugs, Essential Oils/Flavors, FAMES,
Halo-hydrocarbons, PCBs/Aroclors, Pesticides/Herbicides,
Phenols, Residual Solvents, Semi-volatiles.
ZB-Wax: 100% Polyethylene Glycol
Alcohols, Aldehydes, Aromatics, Basic Compounds, Essential
Oils, Flavors & Fragrances, Glycols, Pharmaceuticals,
Solvents/Residual Solvents, Styrene, Xylene Isomers.
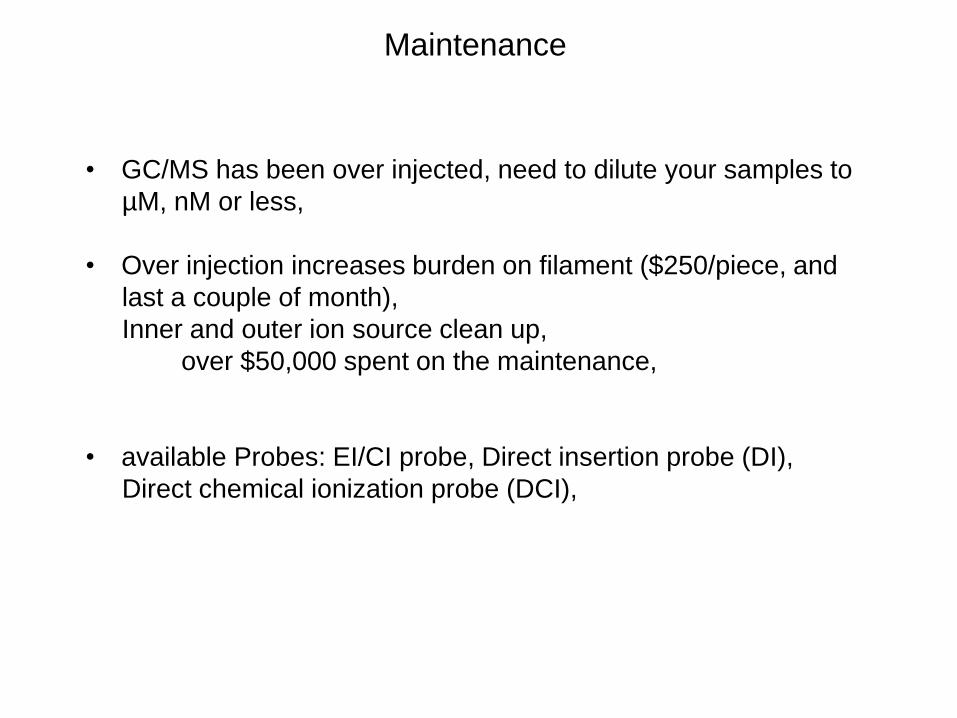
• GC/MS has been over injected, need to dilute your samples to
µM, nM or less,
• Over injection increases burden on filament ($250/piece, and
last a couple of month),
Inner and outer ion source clean up,
over $50,000 spent on the maintenance,
• available Probes: EI/CI probe, Direct insertion probe (DI),
Direct chemical ionization probe (DCI),
Maintenance
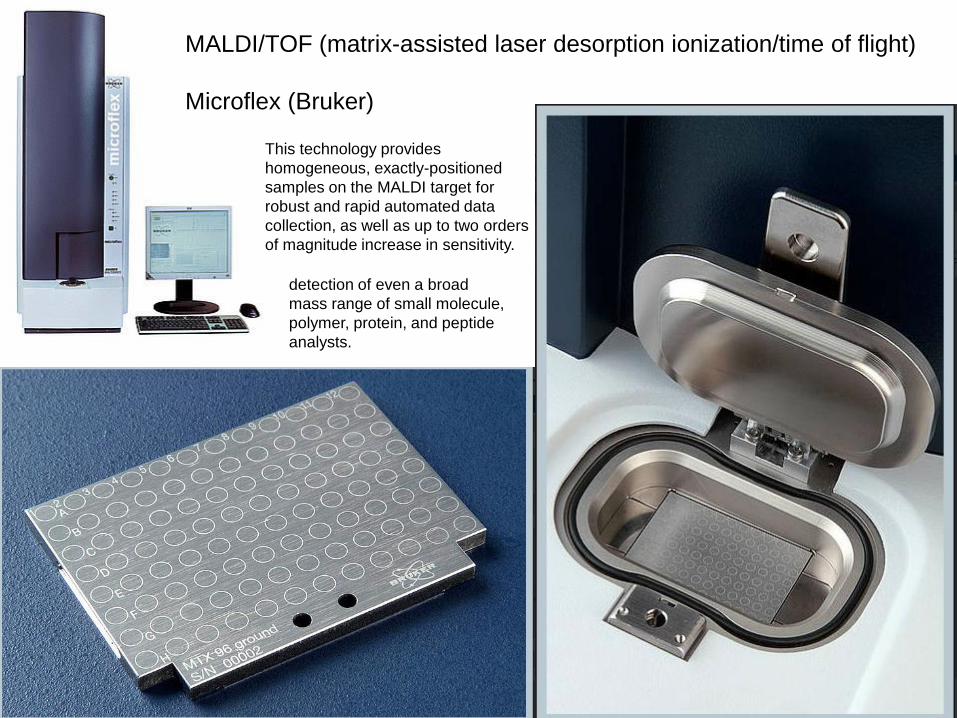
MALDI/TOF (matrix-assisted laser desorption ionization/time of flight)
Microflex (Bruker)
This technology provides
homogeneous, exactly-positioned
samples on the MALDI target for
robust and rapid automated data
collection, as well as up to two orders
of magnitude increase in sensitivity.
detection of even a broad
mass range of small molecule,
polymer, protein, and peptide
analysts.
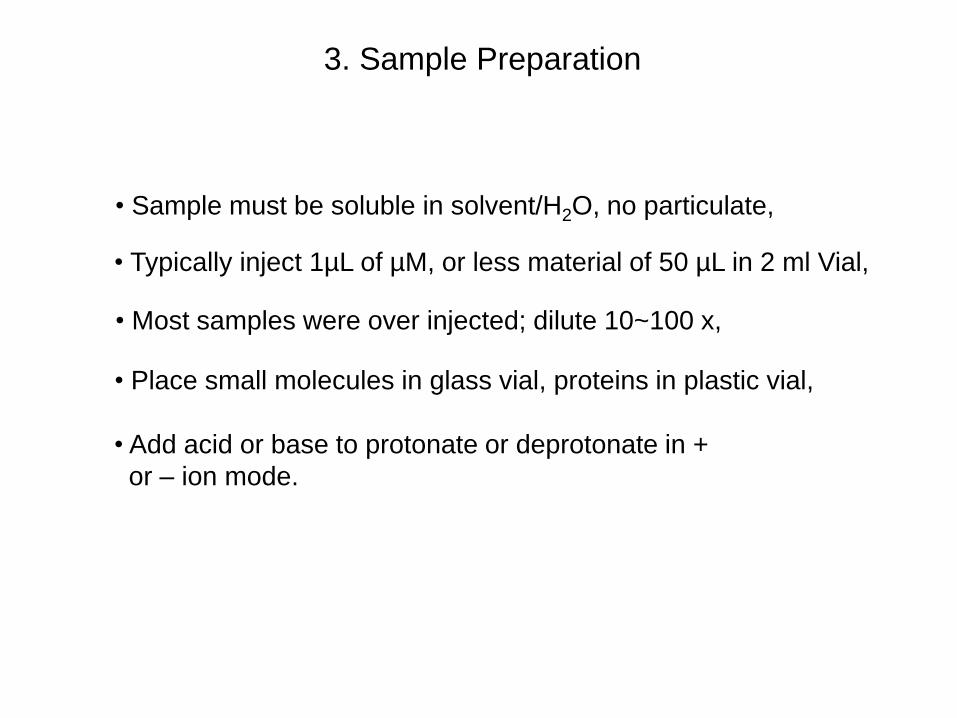
• Sample must be soluble in solvent/H2O, no particulate,
3. Sample Preparation
• Add acid or base to protonate or deprotonate in +
or – ion mode.
• Place small molecules in glass vial, proteins in plastic vial,
• Most samples were over injected; dilute 10~100 x,
• Typically inject 1µL of µM, or less material of 50 µL in 2 ml Vial,
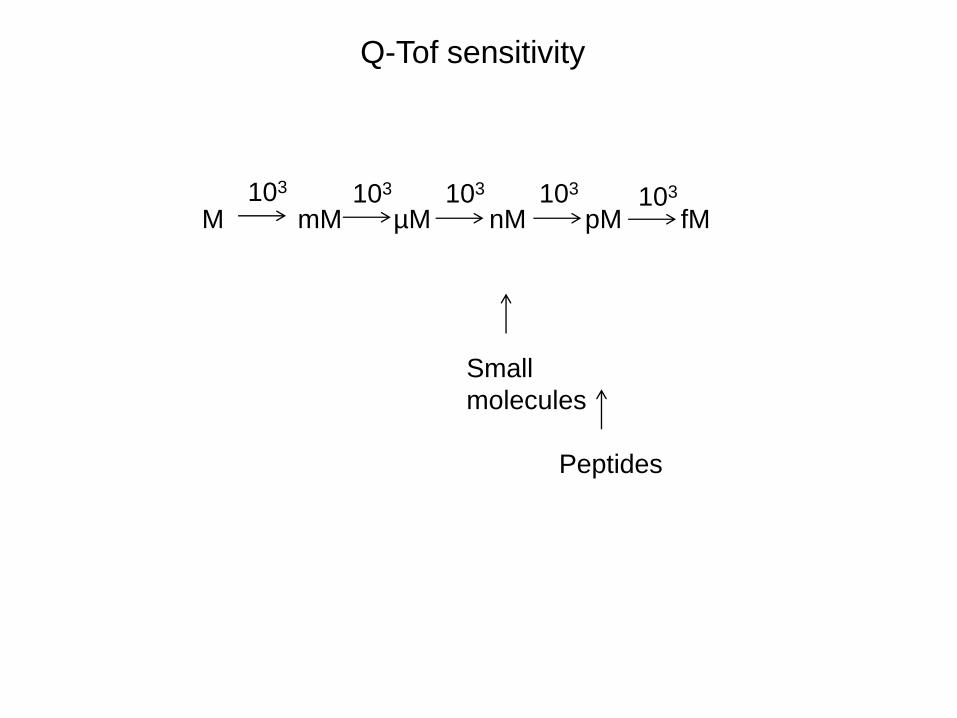
Q-Tof sensitivity
M mM µM nM pM fM 103 103 103 103 103
Small
molecules
Peptides
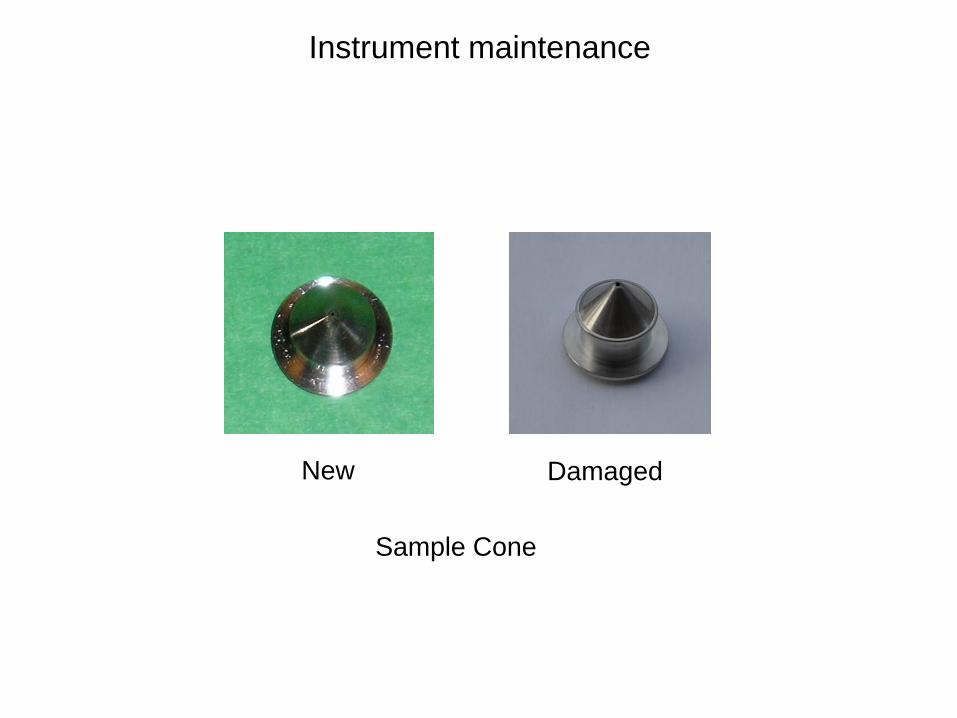
Sample Cone
New Damaged
Instrument maintenance
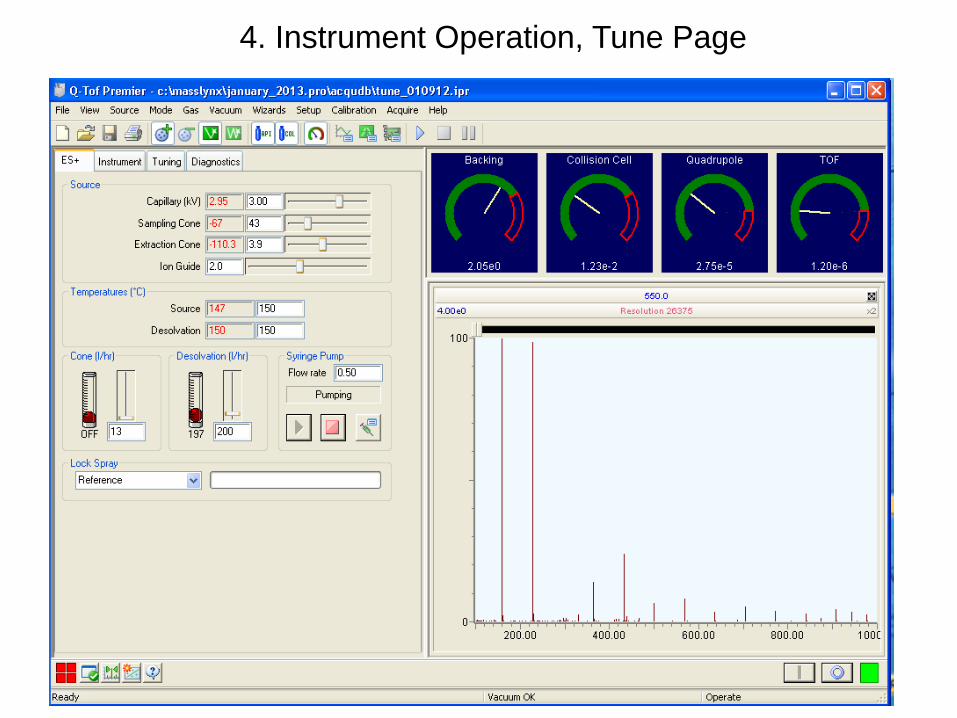
4. Instrument Operation, Tune Page
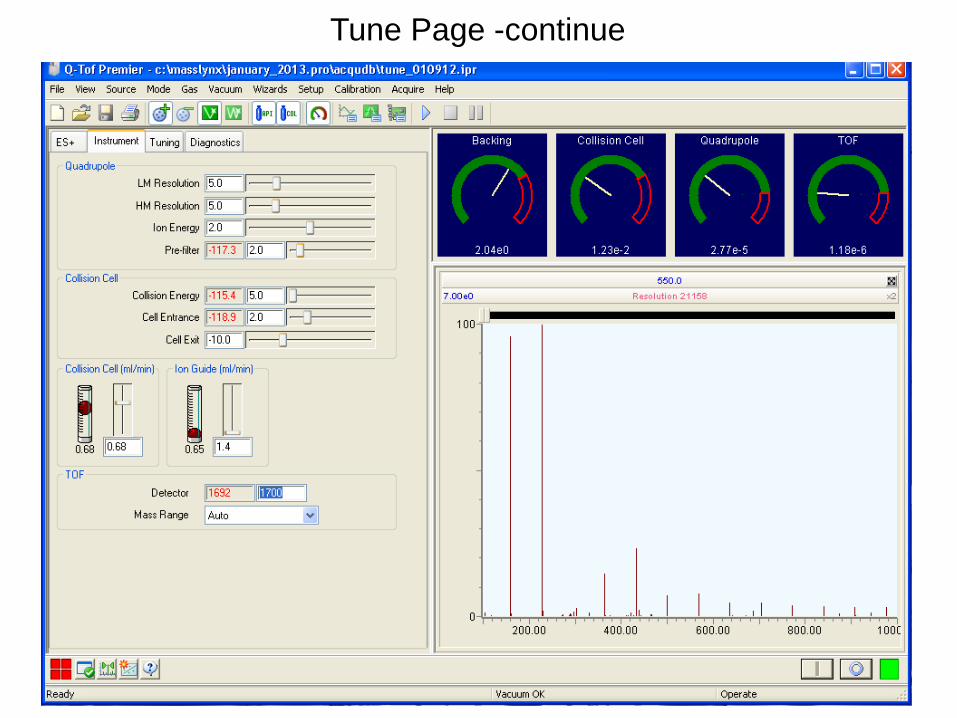
Tune Page -continue
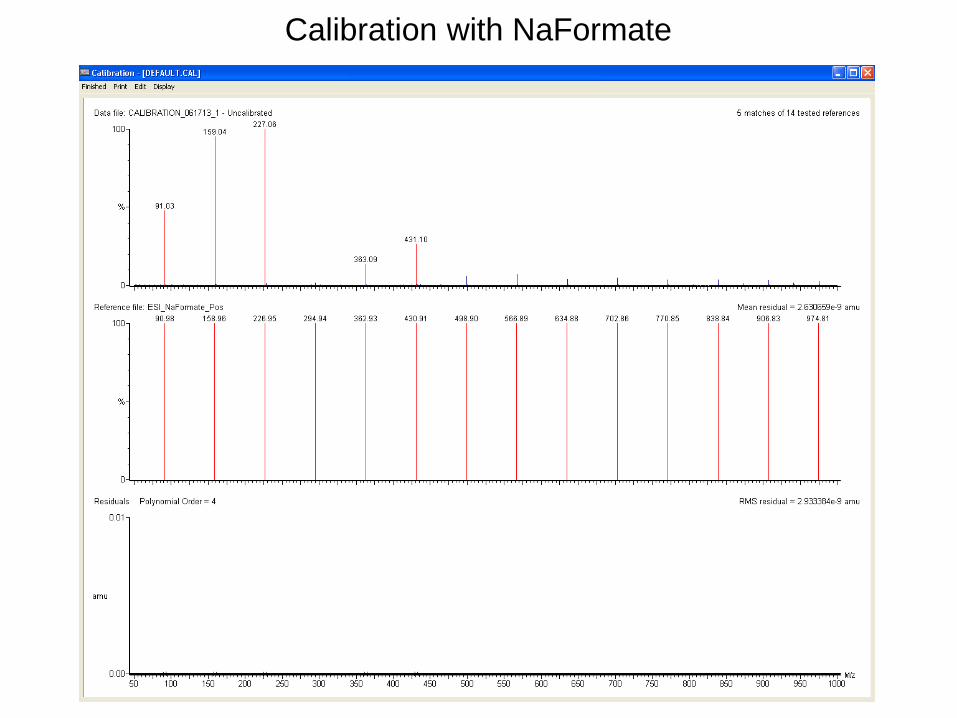
Calibration with NaFormate
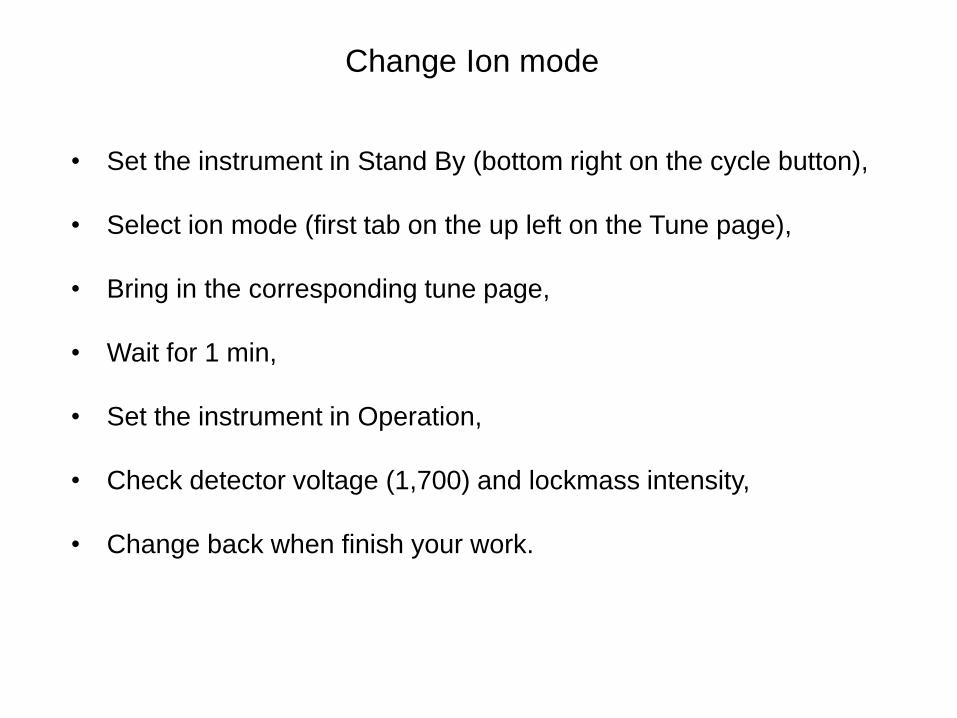
Change Ion mode
• Set the instrument in Stand By (bottom right on the cycle button),
• Select ion mode (first tab on the up left on the Tune page),
• Bring in the corresponding tune page,
• Wait for 1 min,
• Set the instrument in Operation,
• Check detector voltage (1,700) and lockmass intensity,
• Change back when finish your work.
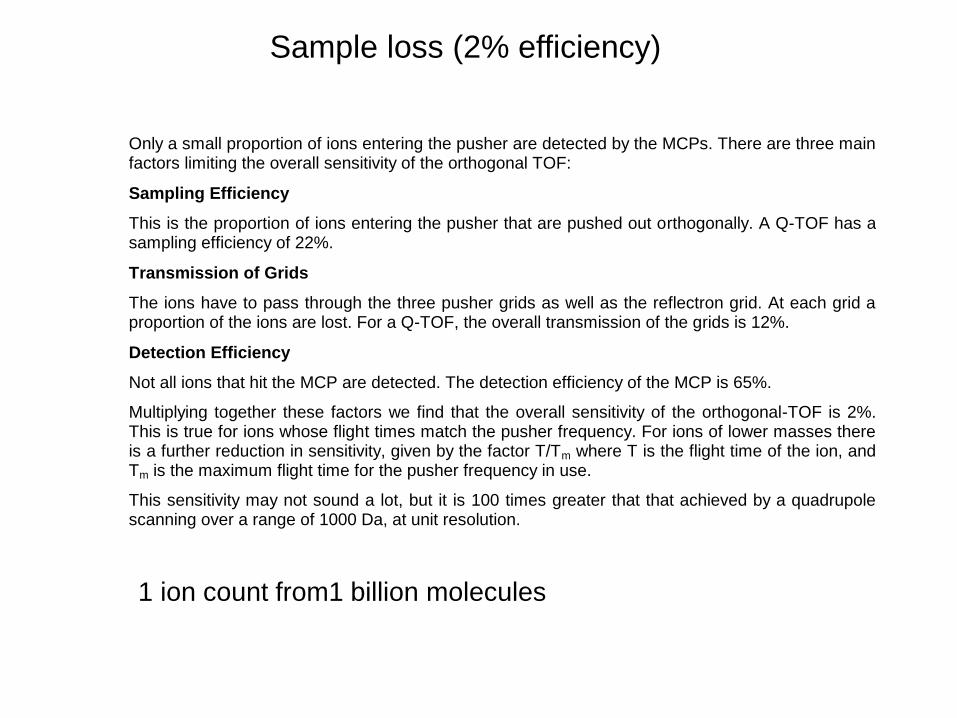
Only a small proportion of ions entering the pusher are detected by the MCPs. There are three main factors limiting the overall sensitivity of the orthogonal TOF:
Sampling Efficiency
This is the proportion of ions entering the pusher that are pushed out orthogonally. A Q-TOF has a sampling efficiency of 22%.
Transmission of Grids
The ions have to pass through the three pusher grids as well as the reflectron grid. At each grid a proportion of the ions are lost. For a Q-TOF, the overall transmission of the grids is 12%.
Detection Efficiency
Not all ions that hit the MCP are detected. The detection efficiency of the MCP is 65%.
Multiplying together these factors we find that the overall sensitivity of the orthogonal-TOF is 2%. This is true for ions whose flight times match the pusher frequency. For ions of lower masses there is a further reduction in sensitivity, given by the factor T/Tm where T is the flight time of the ion, and Tm is the maximum flight time for the pusher frequency in use.
This sensitivity may not sound a lot, but it is 100 times greater that that achieved by a quadrupole scanning over a range of 1000 Da, at unit resolution.
Sample loss (2% efficiency)
1 ion count from1 billion molecules
Tips for Accurate Mass Work
• Use separate calibrations for positive and negative ion work,
• Save the instrument tuning files and note which calibrations
apply (general housekeeping),
• Leave the instrument in operate at all times,
• Stabilization is greater than two hours,
• Familiarize yourself with the limits of deadtime correction.
• MS Methods (small molecule, polar compounds)
• MS/MS Methods (structural analysis)
• Data Dependent Analysis: Survey Methods (peptide
sequencing)
• Data Dependent Analysis: Parent Ion Discovery via Product
Ions (structural analysis)
5. Acquisition method for Q-ToF
53
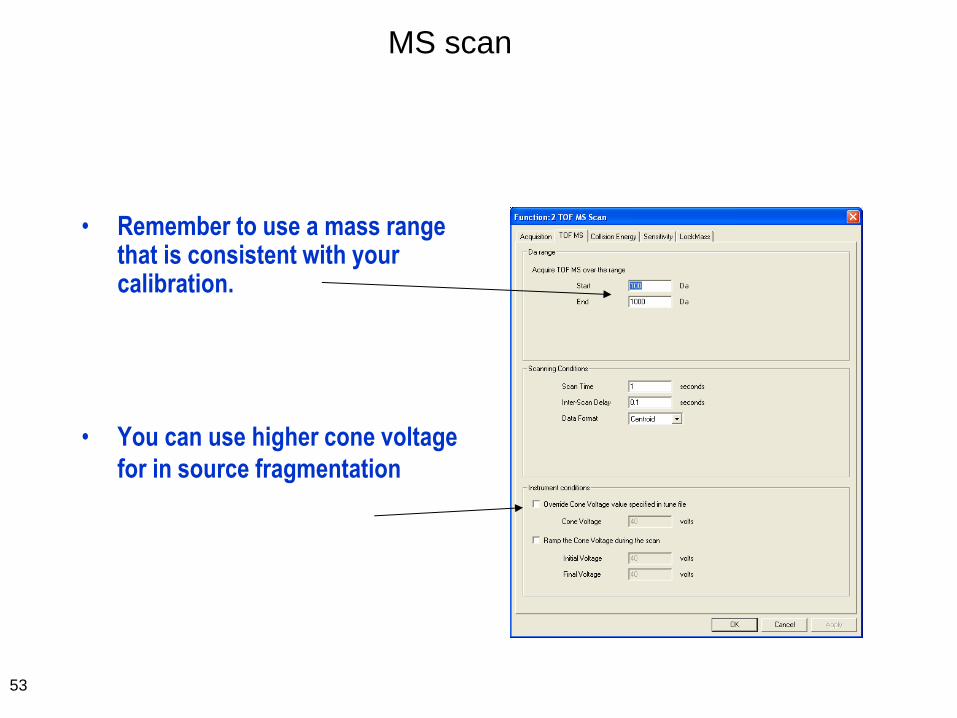
• Remember to use a mass range that is consistent with your calibration.
• You can use higher cone voltage
for in source fragmentation
MS scan
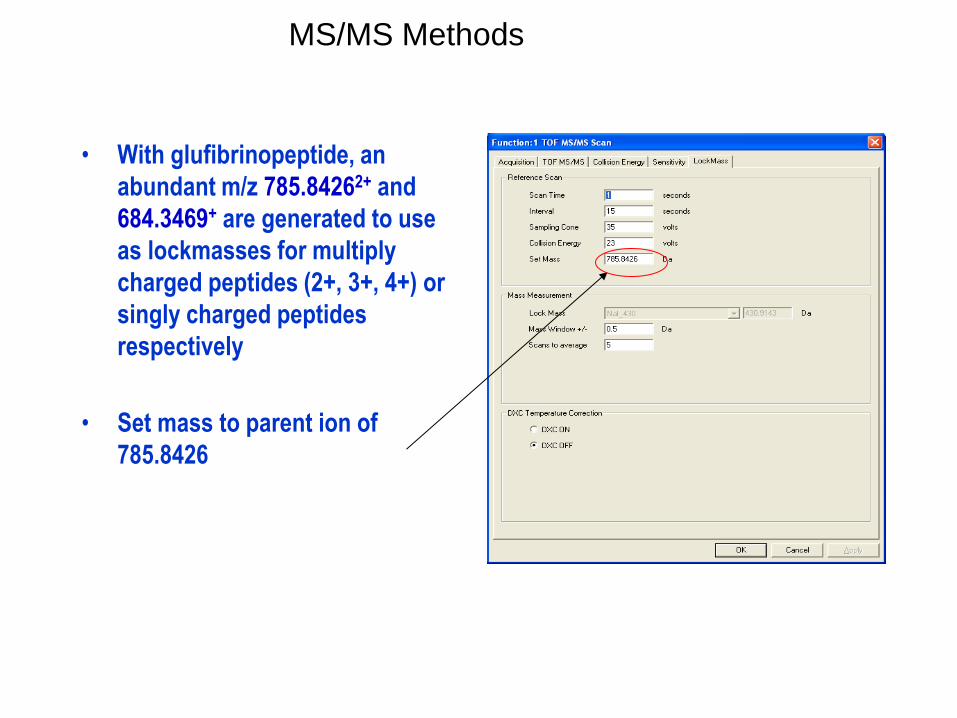
MS/MS Methods
• With glufibrinopeptide, an
abundant m/z 785.84262+ and
684.3469+ are generated to use
as lockmasses for multiply
charged peptides (2+, 3+, 4+) or
singly charged peptides
respectively
• Set mass to parent ion of
785.8426
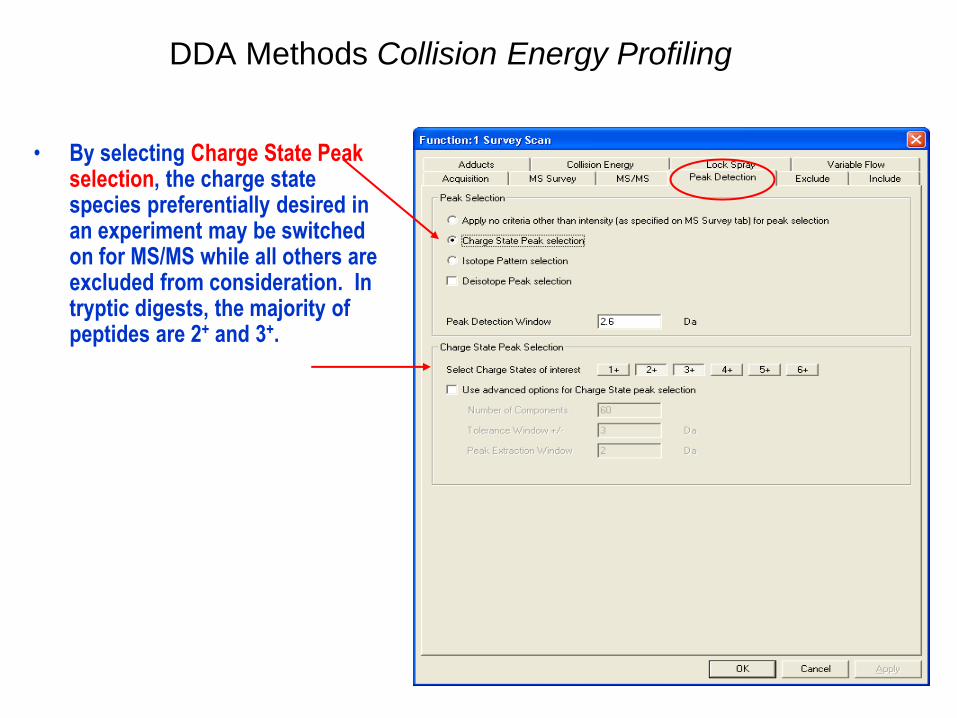
• By selecting Charge State Peak selection, the charge state species preferentially desired in an experiment may be switched on for MS/MS while all others are excluded from consideration. In tryptic digests, the majority of peptides are 2+ and 3+.
DDA Methods Collision Energy Profiling
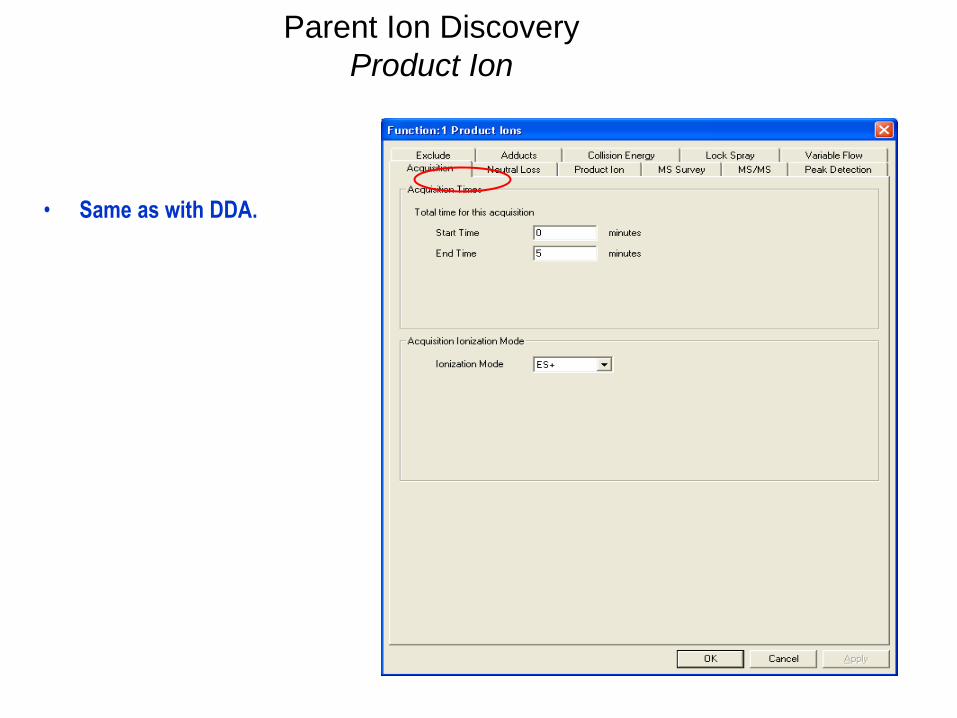
• Same as with DDA.
Parent Ion Discovery
Product Ion
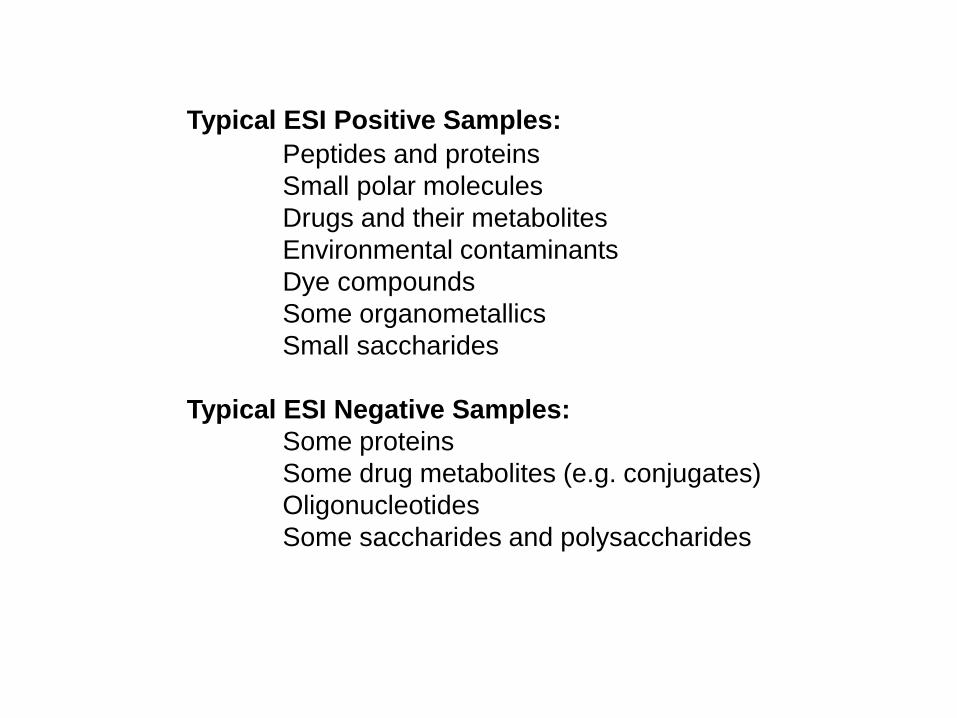
Typical ESI Positive Samples:
Peptides and proteins
Small polar molecules
Drugs and their metabolites
Environmental contaminants
Dye compounds
Some organometallics
Small saccharides
Typical ESI Negative Samples:
Some proteins
Some drug metabolites (e.g. conjugates)
Oligonucleotides
Some saccharides and polysaccharides
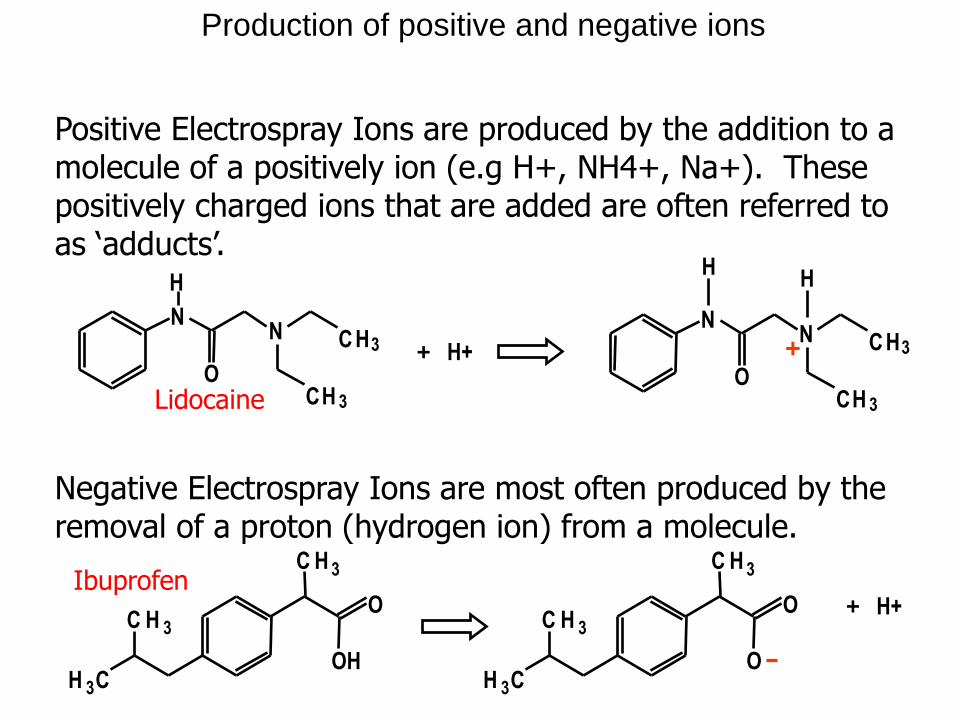
Positive Electrospray Ions are produced by the addition to a molecule of a positively ion (e.g H+, NH4+, Na+). These positively charged ions that are added are often referred to as ‘adducts’.
N N C H 3
O C H 3
H
C H 3
O
OH
C H 3
C H 3
C H 3
O
O
C H 3
C H 3
Negative Electrospray Ions are most often produced by the removal of a proton (hydrogen ion) from a molecule.
+ H+
+ H+
Lidocaine
Ibuprofen
N N C H 3
O C H 3
H
+
H
Production of positive and negative ions
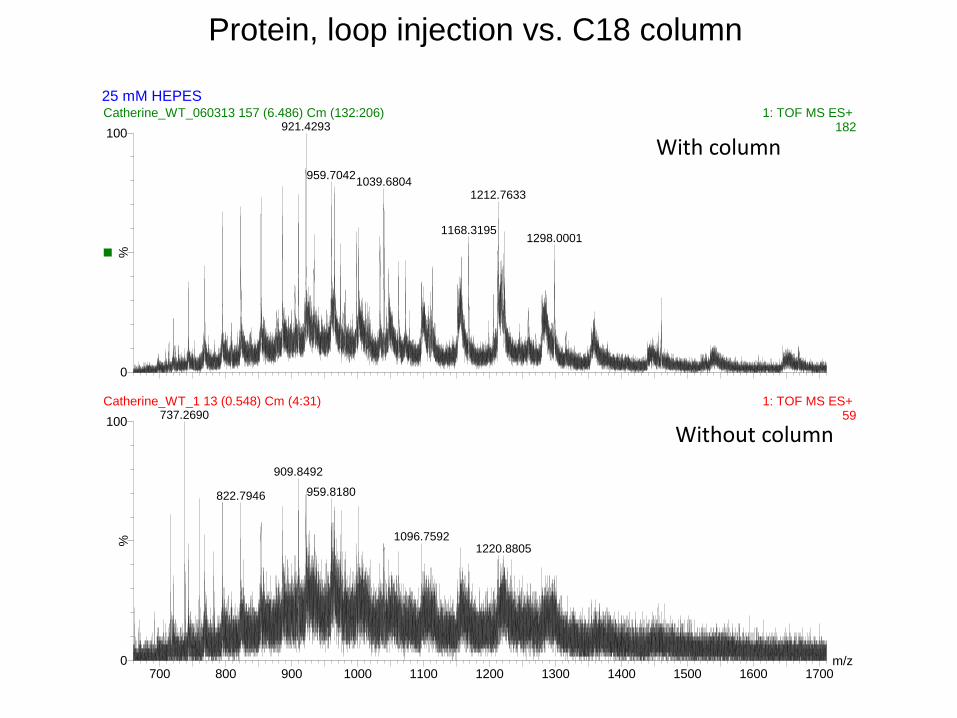
25 mM HEPES
m/z700 800 900 1000 1100 1200 1300 1400 1500 1600 1700
%
0
100
%
0
100
Catherine_WT_060313 157 (6.486) Cm (132:206) 1: TOF MS ES+ 182921.4293
959.70421039.6804
1212.7633
1168.31951298.0001
Catherine_WT_1 13 (0.548) Cm (4:31) 1: TOF MS ES+ 59737.2690
909.8492
822.7946 959.8180
1096.75921220.8805
With column
Without column
Protein, loop injection vs. C18 column
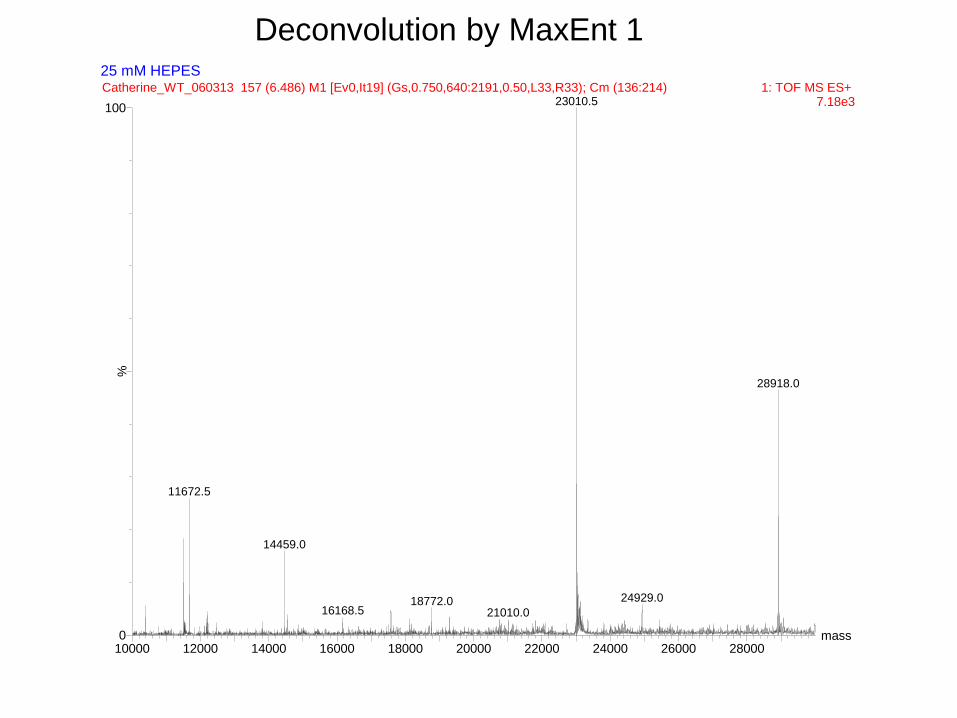
25 mM HEPES
mass10000 12000 14000 16000 18000 20000 22000 24000 26000 28000
%
0
100
Catherine_WT_060313 157 (6.486) M1 [Ev0,It19] (Gs,0.750,640:2191,0.50,L33,R33); Cm (136:214) 1: TOF MS ES+ 7.18e323010.5
11672.5
14459.0
18772.016168.5 21010.0
28918.0
24929.0
Deconvolution by MaxEnt 1
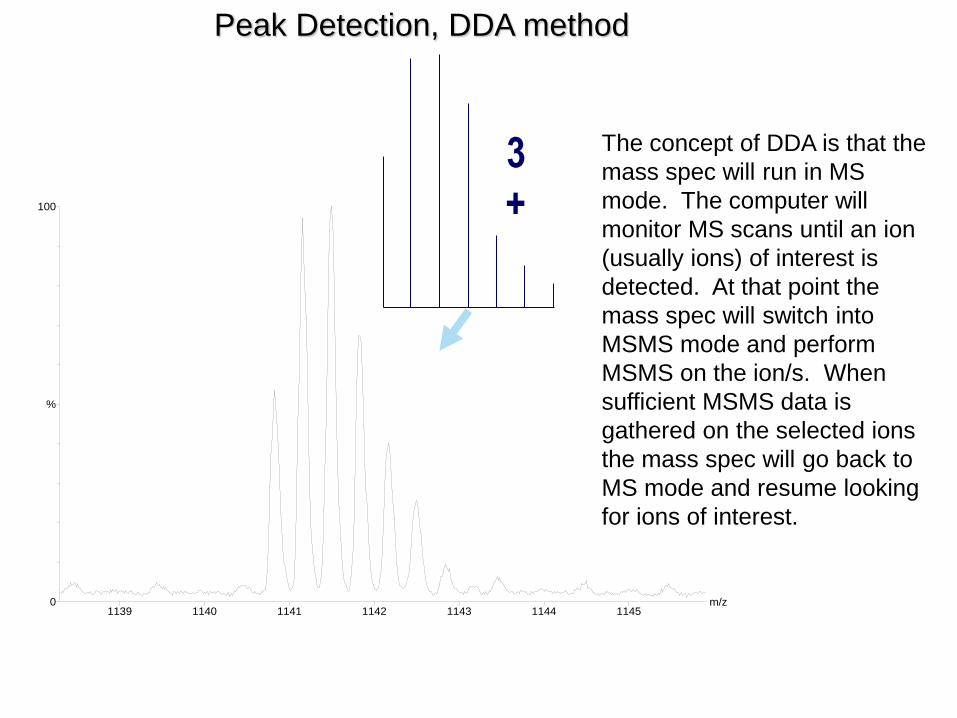
1139 1140 1141 1142 1143 1144 1145m/z0
100
%
3
+
Peak Detection, DDA method
The concept of DDA is that the
mass spec will run in MS
mode. The computer will
monitor MS scans until an ion
(usually ions) of interest is
detected. At that point the
mass spec will switch into
MSMS mode and perform
MSMS on the ion/s. When
sufficient MSMS data is
gathered on the selected ions
the mass spec will go back to
MS mode and resume looking
for ions of interest.
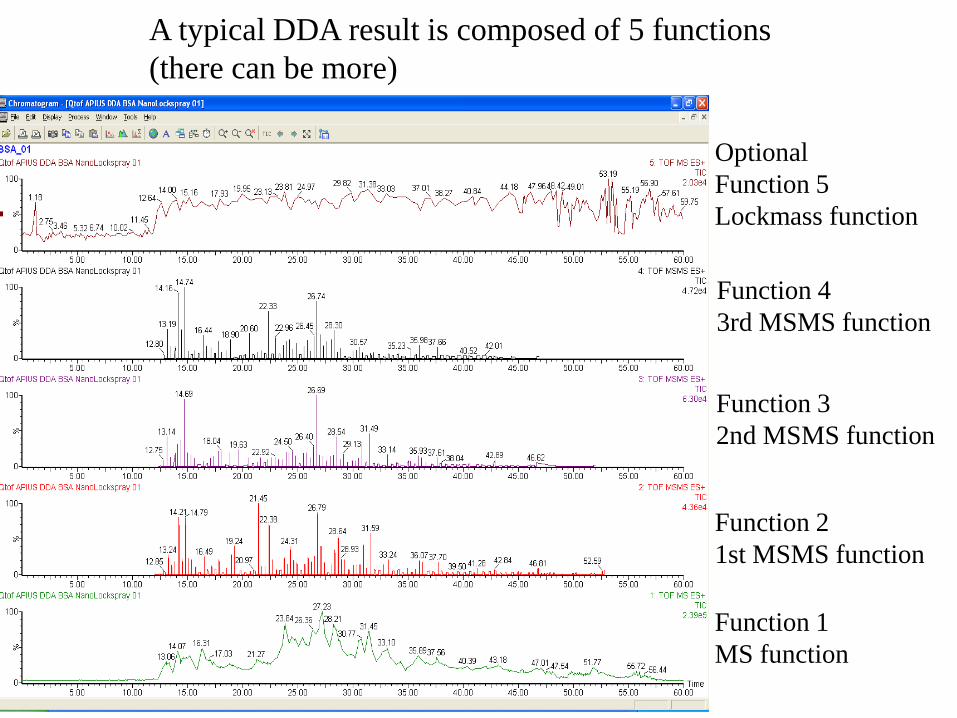
Function 1
MS function
Function 2
1st MSMS function
Optional
Function 5
Lockmass function
Function 4
3rd MSMS function
Function 3
2nd MSMS function
A typical DDA result is composed of 5 functions
(there can be more)
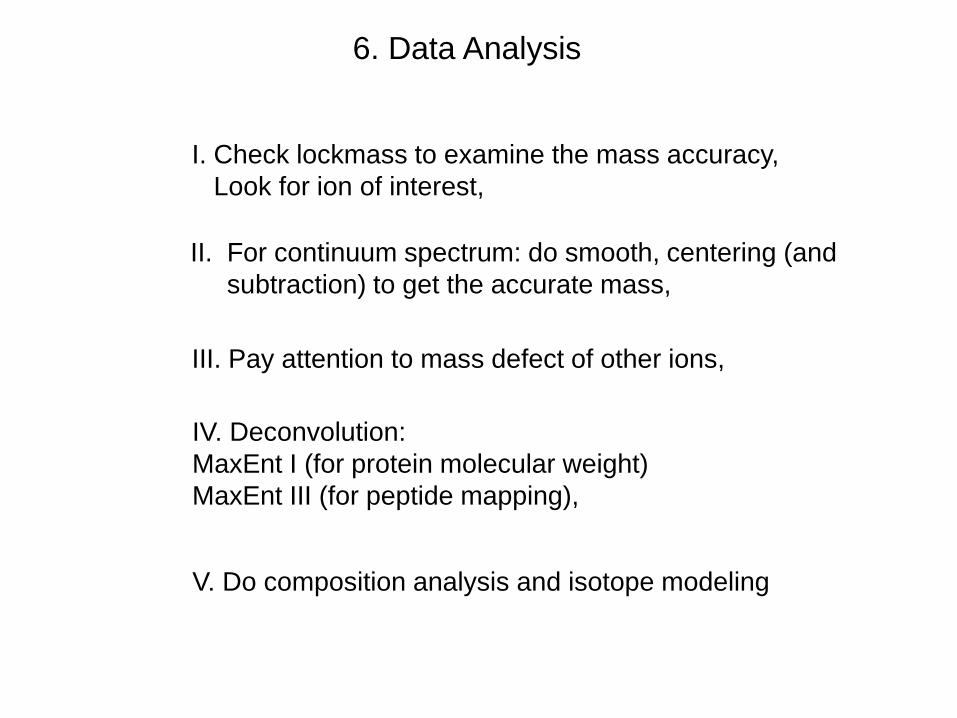
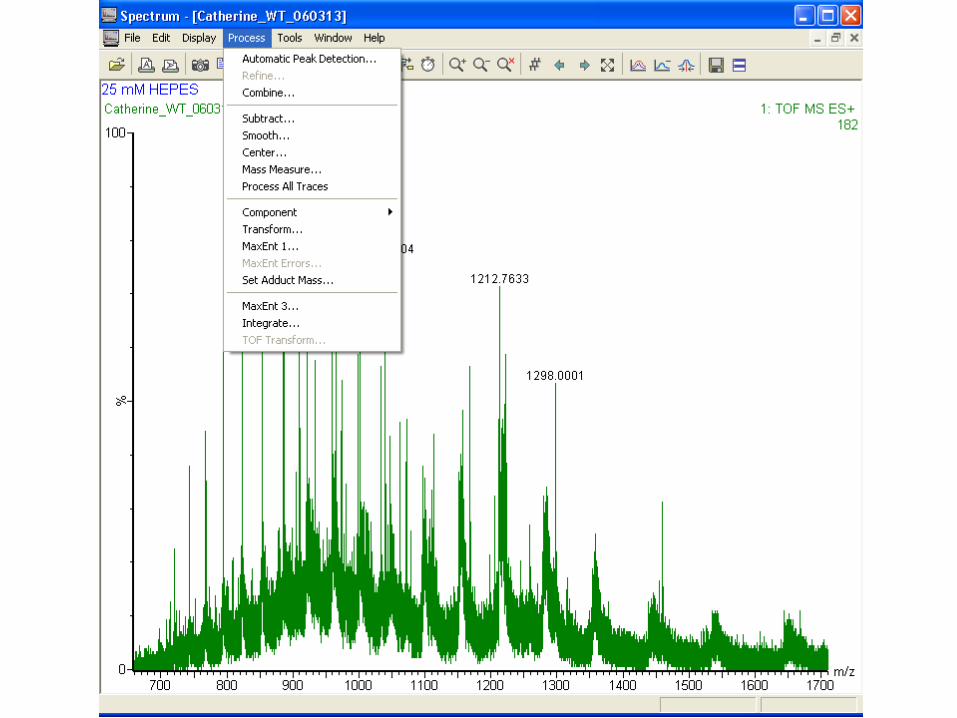
6. Data Analysis
IV. Deconvolution:
MaxEnt I (for protein molecular weight)
MaxEnt III (for peptide mapping),
II. For continuum spectrum: do smooth, centering (and
subtraction) to get the accurate mass,
I. Check lockmass to examine the mass accuracy,
Look for ion of interest,
III. Pay attention to mass defect of other ions,
V. Do composition analysis and isotope modeling
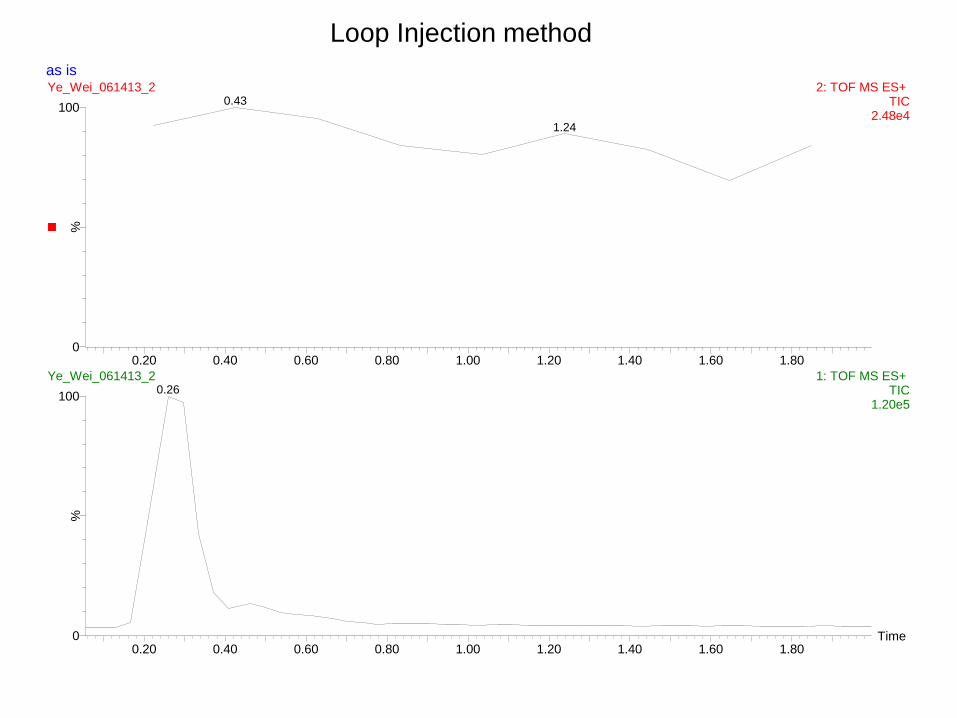
as is
Time0.20 0.40 0.60 0.80 1.00 1.20 1.40 1.60 1.80
%
0
100
0.20 0.40 0.60 0.80 1.00 1.20 1.40 1.60 1.80
%
0
100
Ye_Wei_061413_2 2: TOF MS ES+ TIC
2.48e4
0.43
1.24
Ye_Wei_061413_2 1: TOF MS ES+ TIC
1.20e5
0.26
Loop Injection method
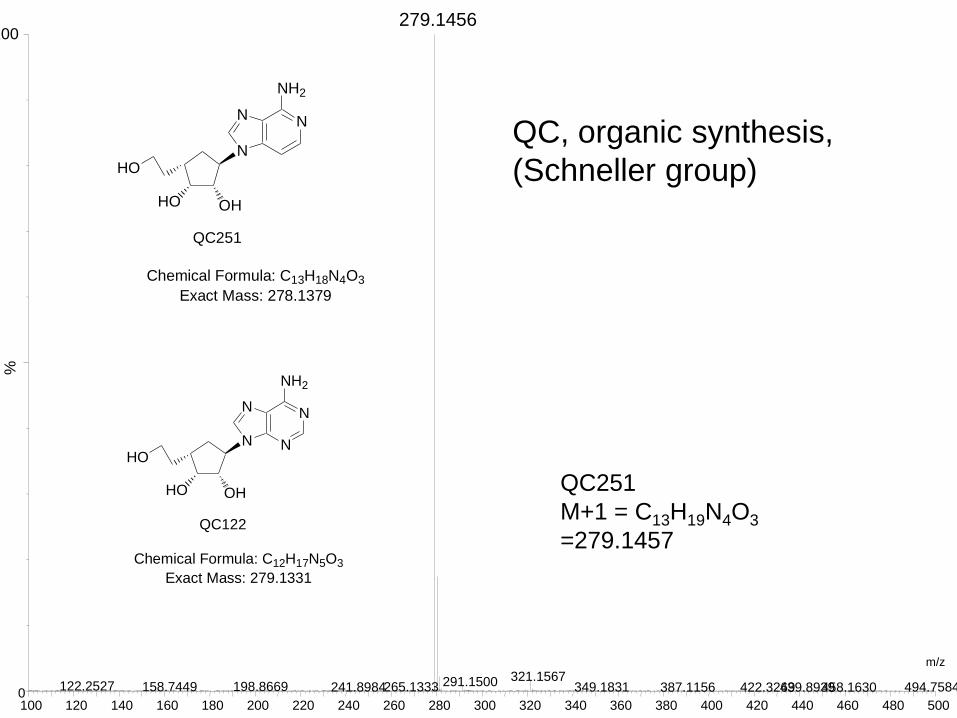
m/z268.0 270.0 272.0 274.0 276.0 278.0 280.0 282.0 284.0 286.0 288.0 290.0 292.0 294.0 296.0
%
0
100
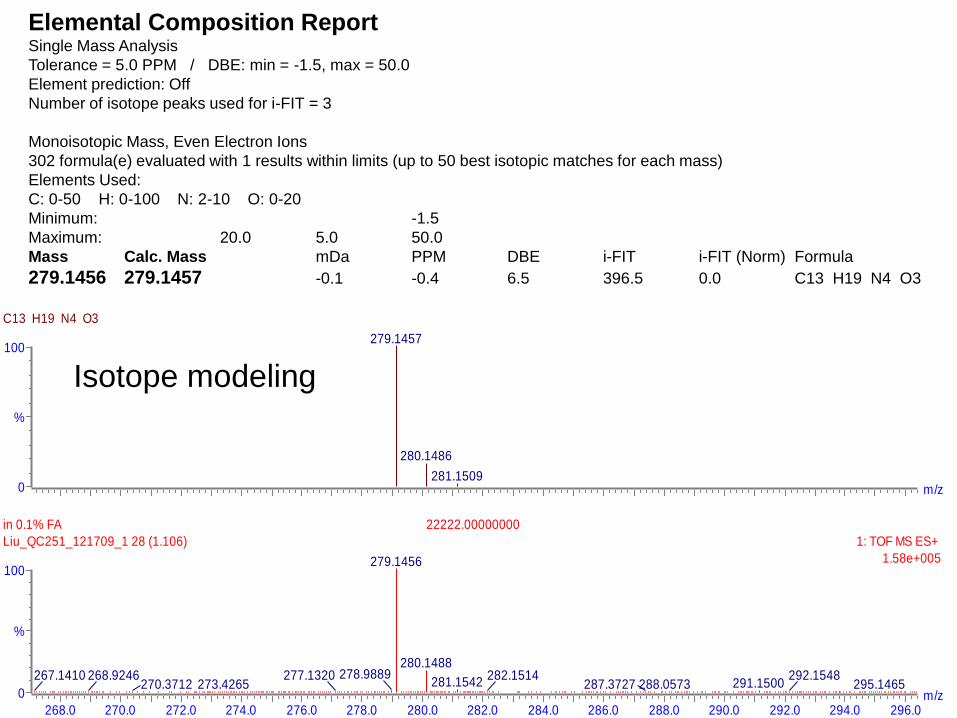
in 0.1% FA 22222.00000000
Liu_QC251_121709_1 28 (1.106) 1: TOF MS ES+
1.58e+005279.1456
278.9889277.1320273.4265
267.1410 268.9246270.3712
280.1488
281.1542 291.1500282.1514
288.0573287.3727292.1548
295.1465
m/z
%
0
100
C13 H19 N4 O3
279.1457
280.1486
281.1509
Elemental Composition Report Single Mass Analysis
Tolerance = 5.0 PPM / DBE: min = -1.5, max = 50.0
Element prediction: Off
Number of isotope peaks used for i-FIT = 3
Monoisotopic Mass, Even Electron Ions
302 formula(e) evaluated with 1 results within limits (up to 50 best isotopic matches for each mass)
Elements Used:
C: 0-50 H: 0-100 N: 2-10 O: 0-20
Minimum: -1.5
Maximum: 20.0 5.0 50.0
Mass Calc. Mass mDa PPM DBE i-FIT i-FIT (Norm) Formula
279.1456 279.1457 -0.1 -0.4 6.5 396.5 0.0 C13 H19 N4 O3
Isotope modeling
m/z
QC251
M+1 = C13H19N4O3
=279.1457
N
NN
N
NH2
HO OH
HO
NN
N
NH2
HO OH
HO
N
NN
N
NH2
HO OH
HO
NN
N
NH2
HO OH
HO
O O
O
OH O
OHO
Si
O
QC122 QC251
QC120
CL253
CL269
Chemical Formula: C11H15N5O3
Exact Mass: 265.1175
Molecular Weight: 265.2685
m/z: 265.1175 (100.0%), 266.1208 (11.9%),
266.1145 (1.8%)
Elemental Analysis: C, 49.81; H, 5.70; N, 26.40; O,
18.09
CL273
Chemical Formula: C12H16N4O3
Exact Mass: 264.1222
Molecular Weight: 264.2804
m/z: 264.1222 (100.0%), 265.1256 (13.0%),
265.1193 (1.5%)
Elemental Analysis: C, 54.54; H, 6.10; N,
21.20; O, 18.16
Chemical Formula: C12H17N5O3
Exact Mass: 279.1331
Molecular Weight: 279.2951
m/z: 279.1331 (100.0%), 280.1365 (13.0%), 280.1302
(1.8%)
Elemental Analysis: C, 51.60; H, 6.14; N, 25.08; O,
17.19
Chemical Formula: C13H18N4O3
Exact Mass: 278.1379
Molecular Weight: 278.3070
m/z: 278.1379 (100.0%), 279.1412 (14.1%),
279.1349 (1.5%)
Elemental Analysis: C, 56.10; H, 6.52; N, 20.13;
O, 17.25
Chemical Formula: C28H30O4
Exact Mass: 430.2144
Molecular Weight: 430.5354
m/z: 430.2144 (100.0%), 431.2178 (30.3%),
432.2211 (4.4%)
Elemental Analysis: C, 78.11; H, 7.02; O, 14.86
Chemical Formula: C16H32O4Si
Exact Mass: 316.2070
Molecular Weight: 316.5084
m/z: 316.2070 (100.0%), 317.2103 (17.3%),
317.2066 (5.1%), 318.2038 (3.3%), 318.2137
(1.4%)
Elemental Analysis: C, 60.72; H, 10.19; O, 20.22;
Si, 8.87
N
NN
N
NH2
HO OH
HO
NN
N
NH2
HO OH
HO
N
NN
N
NH2
HO OH
HO
NN
N
NH2
HO OH
HO
O O
O
OH O
OHO
Si
O
QC122 QC251
QC120
CL253
CL269
Chemical Formula: C11H15N5O3
Exact Mass: 265.1175
Molecular Weight: 265.2685
m/z: 265.1175 (100.0%), 266.1208 (11.9%),
266.1145 (1.8%)
Elemental Analysis: C, 49.81; H, 5.70; N, 26.40; O,
18.09
CL273
Chemical Formula: C12H16N4O3
Exact Mass: 264.1222
Molecular Weight: 264.2804
m/z: 264.1222 (100.0%), 265.1256 (13.0%),
265.1193 (1.5%)
Elemental Analysis: C, 54.54; H, 6.10; N,
21.20; O, 18.16
Chemical Formula: C12H17N5O3
Exact Mass: 279.1331
Molecular Weight: 279.2951
m/z: 279.1331 (100.0%), 280.1365 (13.0%), 280.1302
(1.8%)
Elemental Analysis: C, 51.60; H, 6.14; N, 25.08; O,
17.19
Chemical Formula: C13H18N4O3
Exact Mass: 278.1379
Molecular Weight: 278.3070
m/z: 278.1379 (100.0%), 279.1412 (14.1%),
279.1349 (1.5%)
Elemental Analysis: C, 56.10; H, 6.52; N, 20.13;
O, 17.25
Chemical Formula: C28H30O4
Exact Mass: 430.2144
Molecular Weight: 430.5354
m/z: 430.2144 (100.0%), 431.2178 (30.3%),
432.2211 (4.4%)
Elemental Analysis: C, 78.11; H, 7.02; O, 14.86
Chemical Formula: C16H32O4Si
Exact Mass: 316.2070
Molecular Weight: 316.5084
m/z: 316.2070 (100.0%), 317.2103 (17.3%),
317.2066 (5.1%), 318.2038 (3.3%), 318.2137
(1.4%)
Elemental Analysis: C, 60.72; H, 10.19; O, 20.22;
Si, 8.87
QC, organic synthesis,
(Schneller group)
100 120 140 160 180 200 220 240 260 280 300 320 340 360 380 400 420 440 460 480 500
%
0
100 279.1456
122.2527 198.8669 158.7449 265.1333 241.8984 321.1567 291.1500 494.7584 349.1831 387.1156 458.1630 439.8939 422.3269
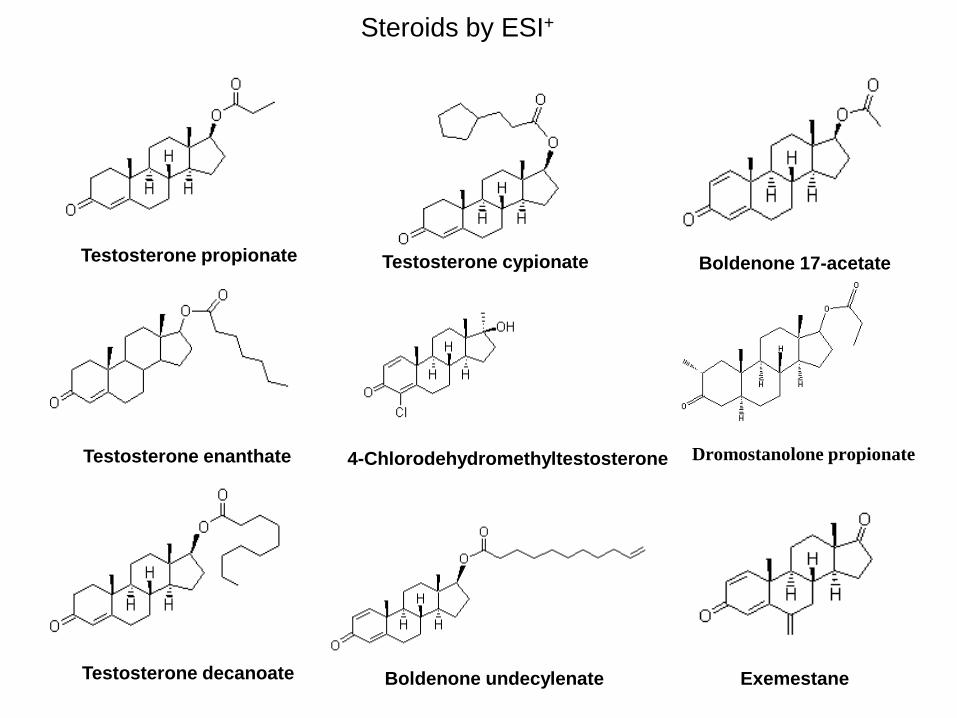
Steroids by ESI+
Boldenone undecylenate
Dromostanolone propionate
Testosterone decanoate
Testosterone propionate Boldenone 17-acetate Testosterone cypionate
Testosterone enanthate 4-Chlorodehydromethyltestosterone
Exemestane
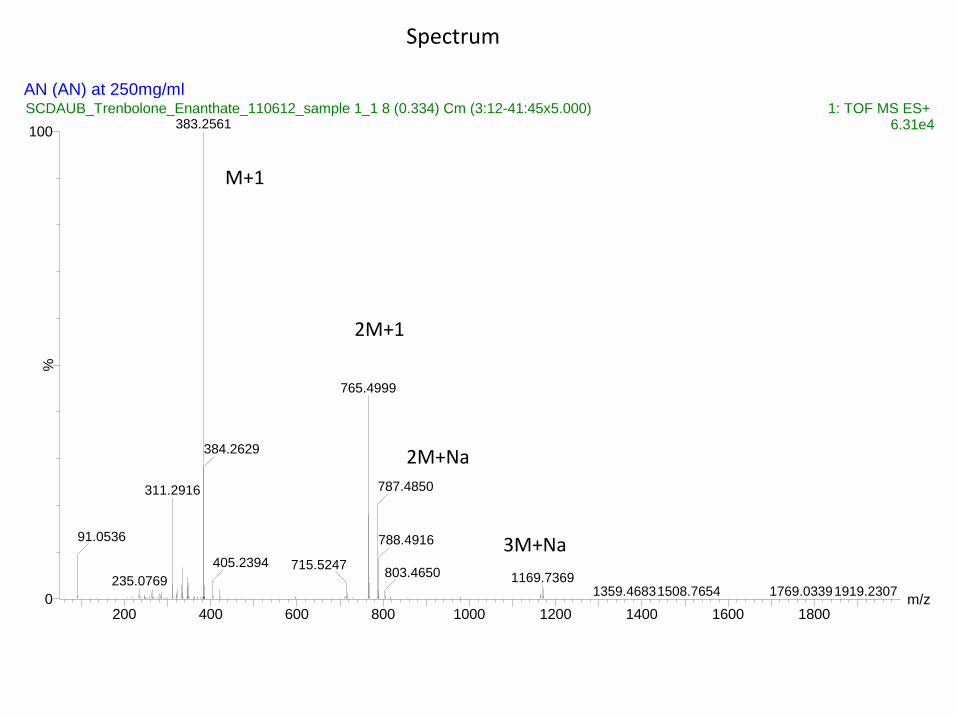
AN (AN) at 250mg/ml
m/z200 400 600 800 1000 1200 1400 1600 1800
%
0
100
SCDAUB_Trenbolone_Enanthate_110612_sample 1_1 8 (0.334) Cm (3:12-41:45x5.000) 1: TOF MS ES+ 6.31e4383.2561
311.2916
91.0536
235.0769
765.4999
384.2629
405.2394 715.5247
787.4850
788.4916
1169.7369803.4650
1919.23071508.76541359.4683 1769.0339
Spectrum
M+1
2M+1
2M+Na
3M+Na
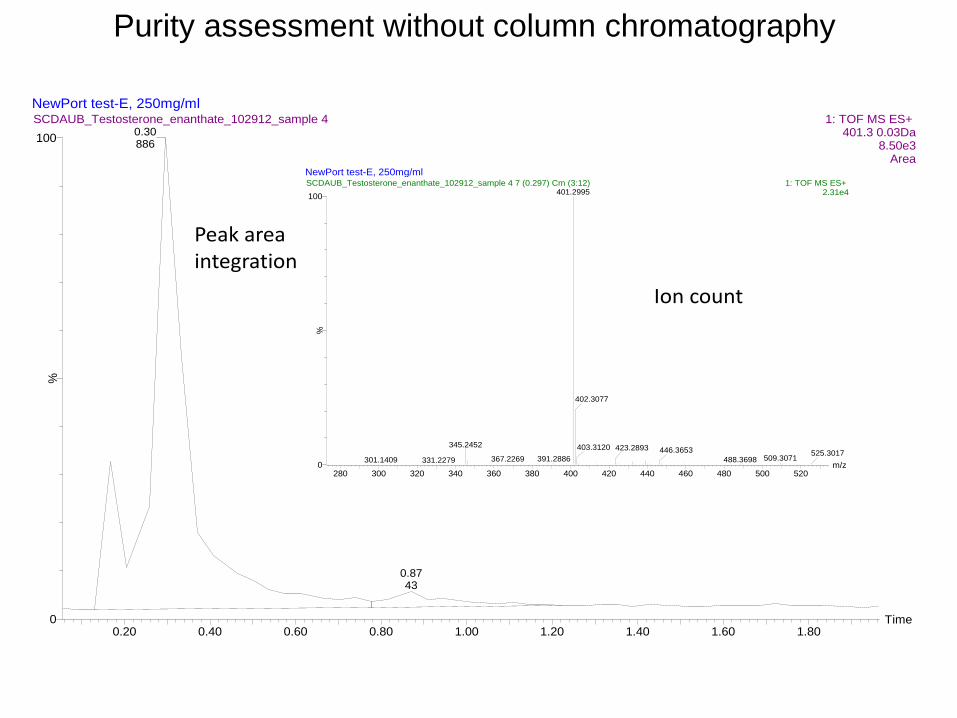
NewPort test-E, 250mg/ml
Time0.20 0.40 0.60 0.80 1.00 1.20 1.40 1.60 1.80
%
0
100
SCDAUB_Testosterone_enanthate_102912_sample 4 1: TOF MS ES+ 401.3 0.03Da
8.50e3Area
0.30886
0.8743
NewPort test-E, 250mg/ml
m/z280 300 320 340 360 380 400 420 440 460 480 500 520
%
0
100
SCDAUB_Testosterone_enanthate_102912_sample 4 7 (0.297) Cm (3:12) 1: TOF MS ES+ 2.31e4401.2995
345.2452
301.1409 331.2279 391.2886367.2269
402.3077
403.3120 423.2893 446.3653509.3071488.3698
525.3017
Ion count
Peak areaintegration
Purity assessment without column chromatography
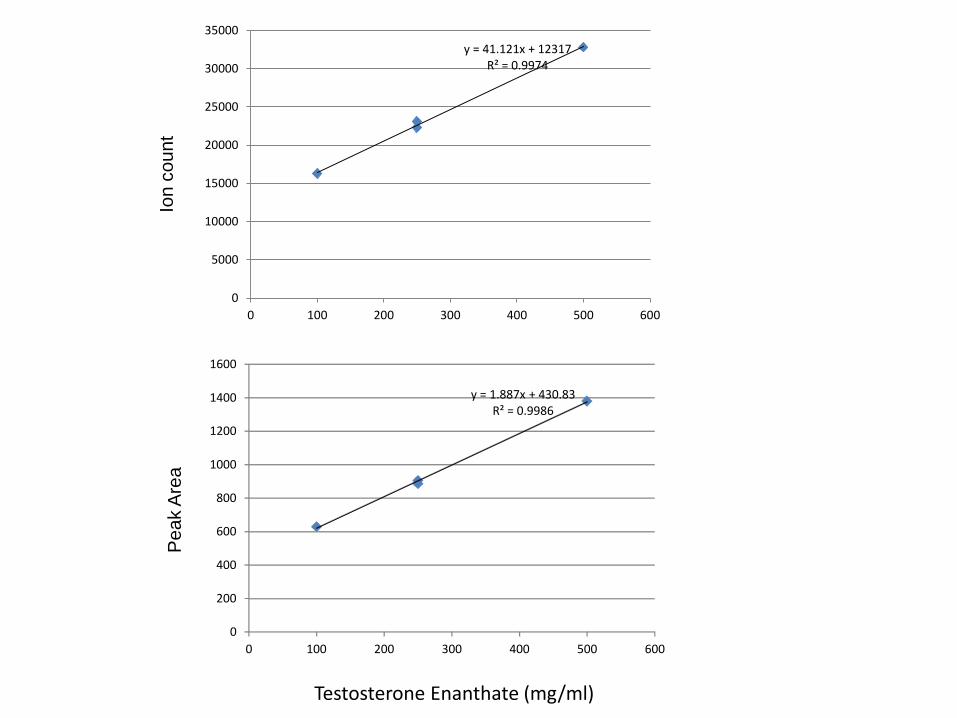
y = 41.121x + 12317 R² = 0.9974
0
5000
10000
15000
20000
25000
30000
35000
0 100 200 300 400 500 600
y = 1.887x + 430.83
R² = 0.9986
0
200
400
600
800
1000
1200
1400
1600
0 100 200 300 400 500 600
Testosterone Enanthate ( mg/ml)
Ion
co
un
t P
ea
k A
rea
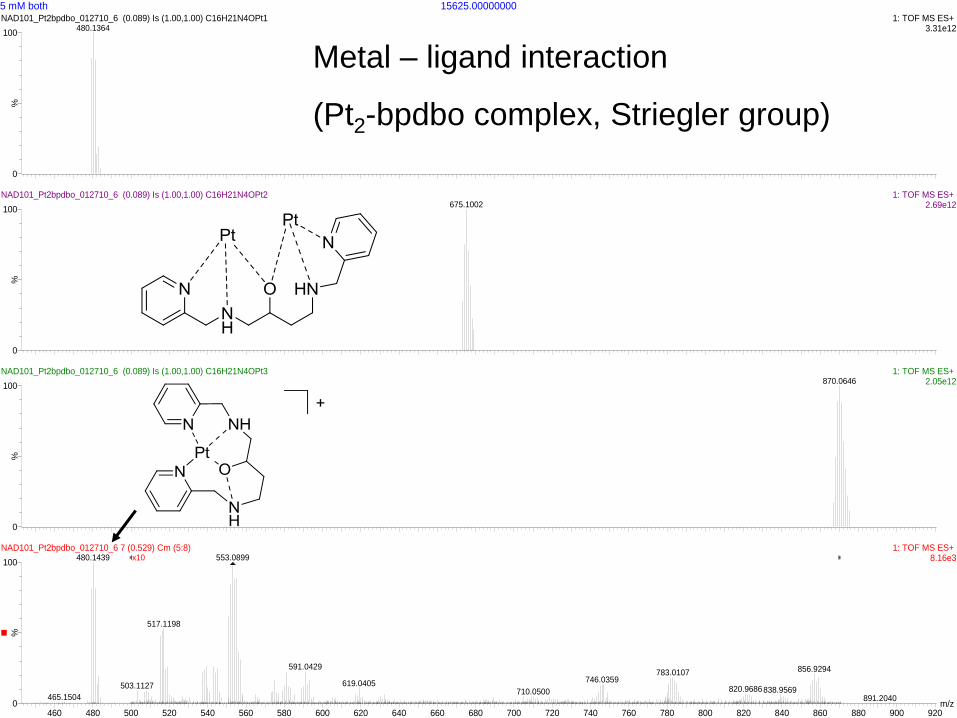
Metal – ligand interaction
(Pt2-bpdbo complex, Striegler group)
15625.000000005 mM both
m/z460 480 500 520 540 560 580 600 620 640 660 680 700 720 740 760 780 800 820 840 860 880 900 920
%
0
100
%
0
100
%
0
100
%
0
100
NAD101_Pt2bpdbo_012710_6 (0.089) Is (1.00,1.00) C16H21N4OPt1 1: TOF MS ES+ 3.31e12480.1364
NAD101_Pt2bpdbo_012710_6 (0.089) Is (1.00,1.00) C16H21N4OPt2 1: TOF MS ES+ 2.69e12675.1002
NAD101_Pt2bpdbo_012710_6 (0.089) Is (1.00,1.00) C16H21N4OPt3 1: TOF MS ES+ 2.05e12870.0646
NAD101_Pt2bpdbo_012710_6 7 (0.529) Cm (5:8) 1: TOF MS ES+ 8.16e3x10480.1439
465.1504
553.0899
517.1198
503.1127
591.0429 856.9294783.0107746.0359619.0405
710.0500 820.9686838.9569891.2040
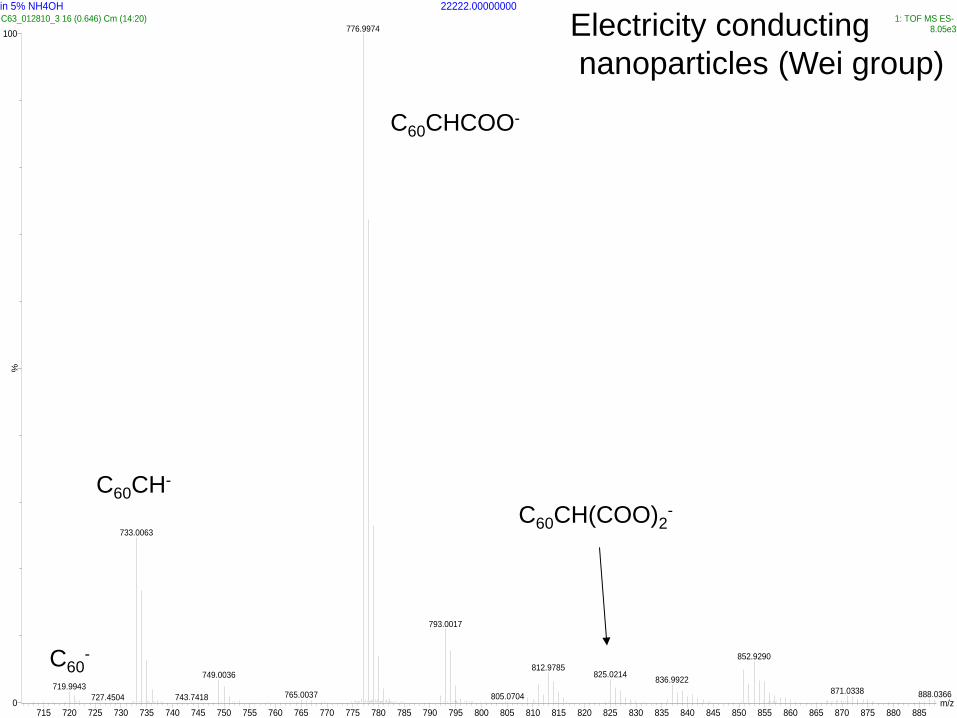
22222.00000000in 5% NH4OH
m/z715 720 725 730 735 740 745 750 755 760 765 770 775 780 785 790 795 800 805 810 815 820 825 830 835 840 845 850 855 860 865 870 875 880 885
%
0
100
C63_012810_3 16 (0.646) Cm (14:20) 1: TOF MS ES- 8.05e3776.9974
733.0063
719.9943
727.4504
749.0036
743.7418 765.0037
793.0017
852.9290
812.9785
805.0704
825.0214836.9922
871.0338 888.0366
C60CH-
C60CH(COO)2-
C60CHCOO-
Electricity conducting
nanoparticles (Wei group)
C60-
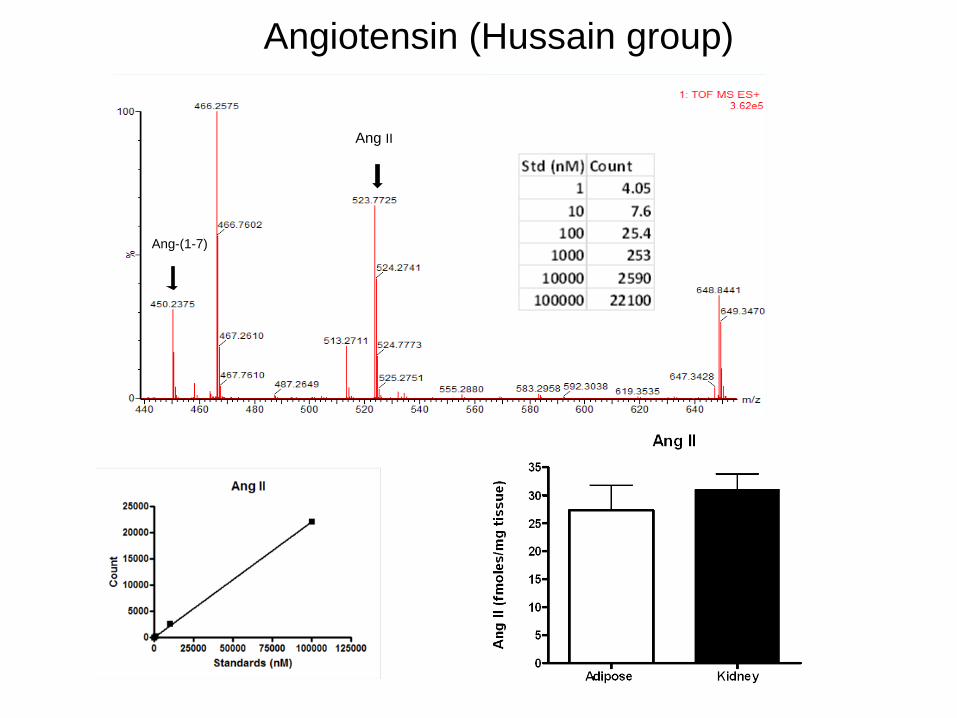
Angiotensin (Hussain group)
Ang II
Ang-(1-7)
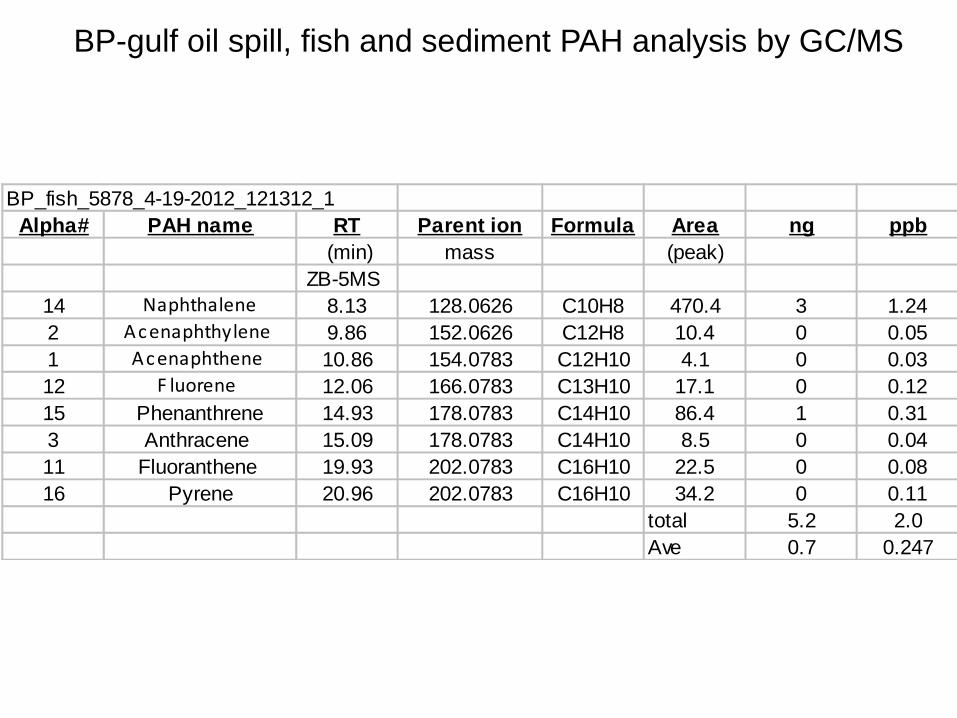
BP_fish_5878_4-19-2012_121312_1
Alpha# PAH name RT Parent ion Formula Area ng ppb
(min) mass (peak)
ZB-5MS
14 Naphthalene 8.13 128.0626 C10H8 470.4 3 1.24
2 Acenaphthylene 9.86 152.0626 C12H8 10.4 0 0.05
1 Acenaphthene 10.86 154.0783 C12H10 4.1 0 0.03
12 F luorene 12.06 166.0783 C13H10 17.1 0 0.12
15 Phenanthrene 14.93 178.0783 C14H10 86.4 1 0.31
3 Anthracene 15.09 178.0783 C14H10 8.5 0 0.04
11 Fluoranthene 19.93 202.0783 C16H10 22.5 0 0.08
16 Pyrene 20.96 202.0783 C16H10 34.2 0 0.11
total 5.2 2.0
Ave 0.7 0.247
BP-gulf oil spill, fish and sediment PAH analysis by GC/MS
2
N1
5
4
N3
R1
R2
Cl
O
O
hv
6
7
8
9
2
N1
5
4
N3
R1
R2
H
O
O
6
7
8
9
2
N1
5
4
N3
R1
R2
H
O
O
6
7
8
9
+
(B)(A)
Cl
Cl
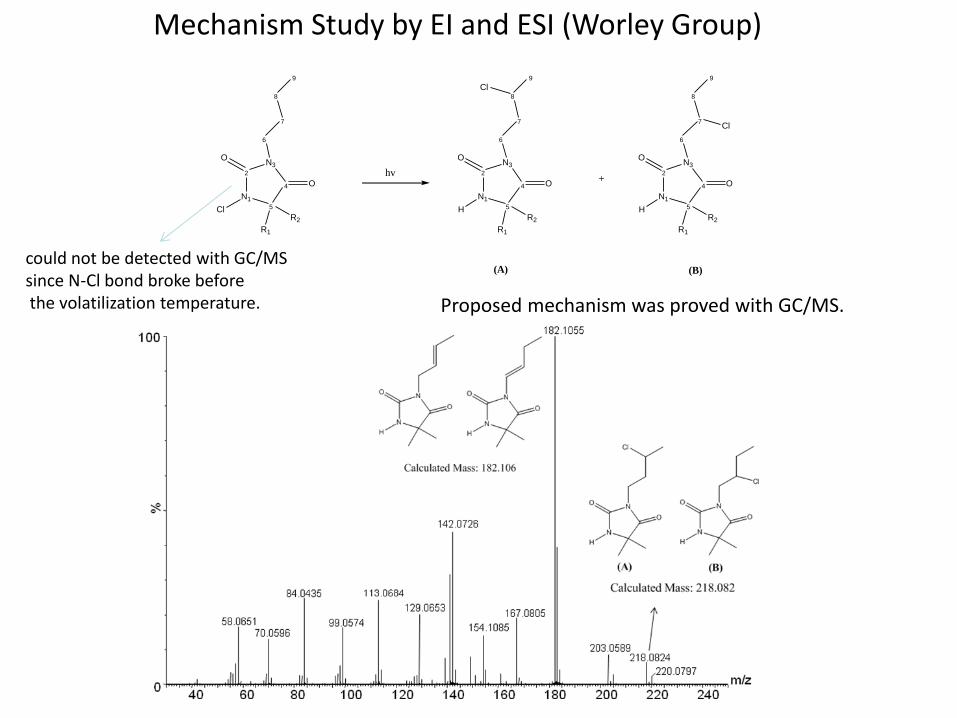
could not be detected with GC/MS since N-Cl bond broke before the volatilization temperature.
Mechanism Study by EI and ESI (Worley Group)
Proposed mechanism was proved with GC/MS.
2.00 4.00 6.00 8.00 10.00 12.00 14.00 16.00 18.00 20.00 22.00
%
0
100 6.42
0.50 0.78
1.04
5.75
4.37 3.03 2.07
7.29 8.12
10.53
11.66
20.32
18.69
15.06
0
TIC
Time (min)
mass 10000 20000 30000 40000 50000
%
0
100
10983.9316
48148.7852 39237.6484 20401.5566 29821.5742
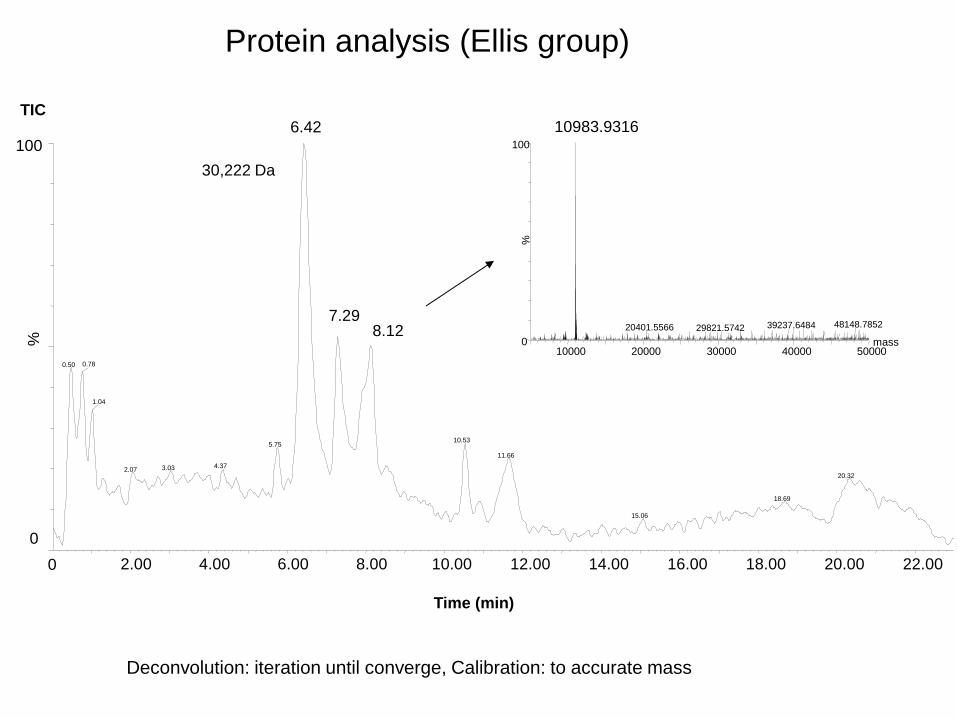
30,222 Da
Deconvolution: iteration until converge, Calibration: to accurate mass
Protein analysis (Ellis group)
15625.0000000010 dilution
m/z850 900 950 1000 1050 1100 1150 1200 1250 1300 1350 1400 1450 1500 1550 1600 1650 1700
%
0
100
Shigeki1-175-Ost4p-100x_013010_2 20 (0.406) Cm (17:25) 1: TOF MS ES+ 1.96e3892.6113
950.4639
922.3710
1108.7026
1070.9321
999.2365
1330.2330
1377.0215
1662.5688
15625.0000000010 dilution
m/z892 893 894 895 896 897 898
%
0
100
Shigeki1-175-Ost4p-100x_013010_2 20 (0.406) Cm (14:26) 1: TOF MS ES+ 2.21e3892.6113
895.2826
897.7816898.2663
15625.0000000010 dilution
m/z950 951
%
0
100
Shigeki1-175-Ost4p-100x_013010_2 20 (0.406) Cm (14:26) 1: TOF MS ES+ 1.26e3950.4639
950.3278
950.1805
950.0331
949.9086
950.6112
950.7473
950.8832
951.0420
951.1781
951.3369
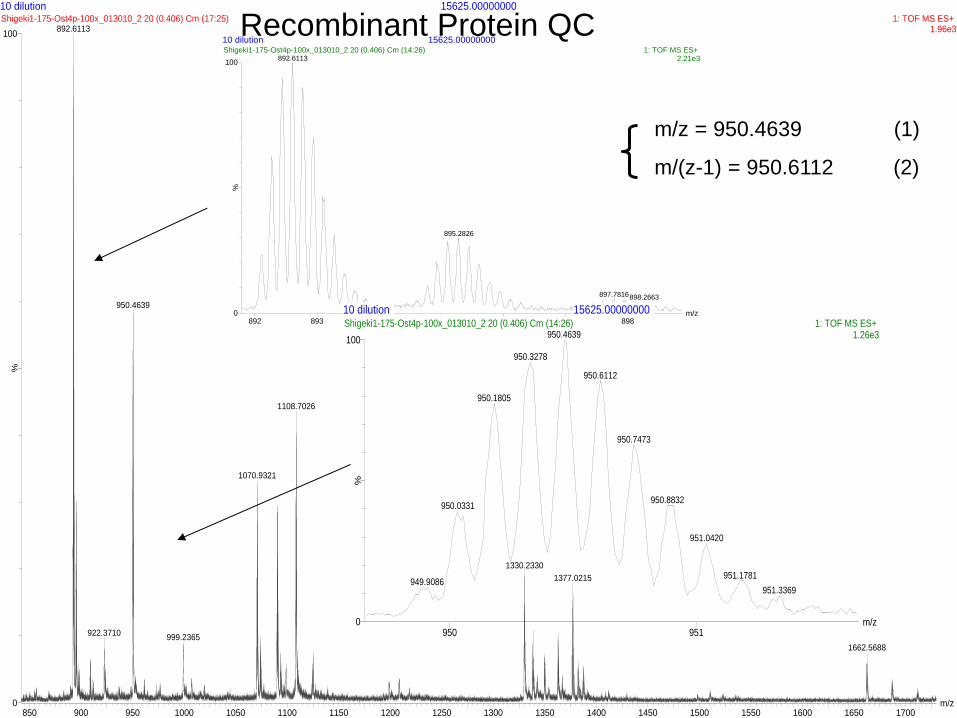
m/z = 950.4639 (1)
m/(z-1) = 950.6112 (2)
Recombinant Protein QC
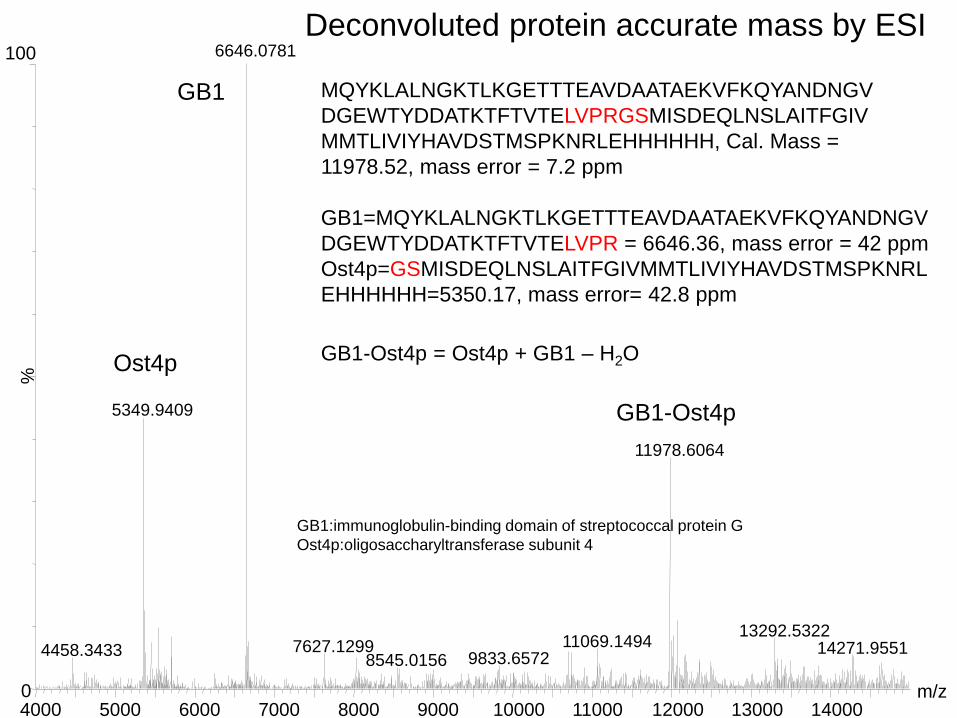
GB1-Ost4p
GB1
Ost4p
m/z 4000 5000 6000 7000 8000 9000 10000 11000 12000 13000 14000
%
0
100 6646.0781
5349.9409
4458.3433
11978.6064
11069.1494 7627.1299 9833.6572 8545.0156
13292.5322 14271.9551
Deconvoluted protein accurate mass by ESI
GB1-Ost4p = Ost4p + GB1 – H2O
GB1=MQYKLALNGKTLKGETTTEAVDAATAEKVFKQYANDNGV
DGEWTYDDATKTFTVTELVPR = 6646.36, mass error = 42 ppm
Ost4p=GSMISDEQLNSLAITFGIVMMTLIVIYHAVDSTMSPKNRL
EHHHHHH=5350.17, mass error= 42.8 ppm
GB1:immunoglobulin-binding domain of streptococcal protein G
Ost4p:oligosaccharyltransferase subunit 4
MQYKLALNGKTLKGETTTEAVDAATAEKVFKQYANDNGV
DGEWTYDDATKTFTVTELVPRGSMISDEQLNSLAITFGIV
MMTLIVIYHAVDSTMSPKNRLEHHHHHH, Cal. Mass =
11978.52, mass error = 7.2 ppm
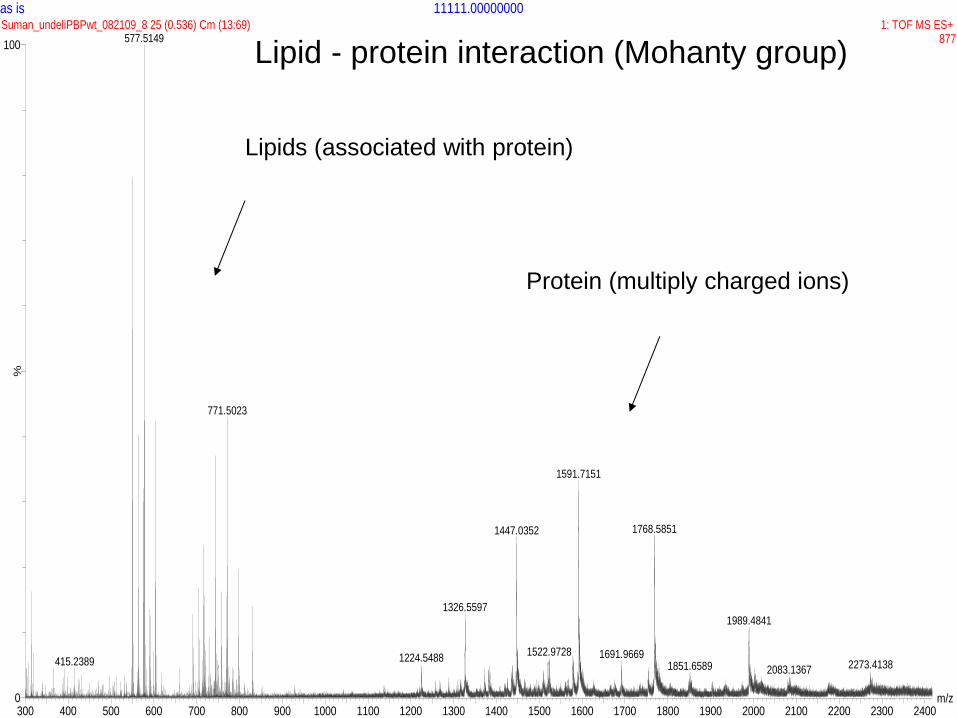
11111.00000000as is
m/z300 400 500 600 700 800 900 1000 1100 1200 1300 1400 1500 1600 1700 1800 1900 2000 2100 2200 2300 2400
%
0
100
Suman_undeliPBPwt_082109_8 25 (0.536) Cm (13:69) 1: TOF MS ES+ 877577.5149
415.2389
771.5023
1591.7151
1447.0352
1326.5597
1224.54881522.9728
1768.5851
1691.9669
1989.4841
1851.6589 2273.41382083.1367
Lipids (associated with protein)
Protein (multiply charged ions)
Lipid - protein interaction (Mohanty group)
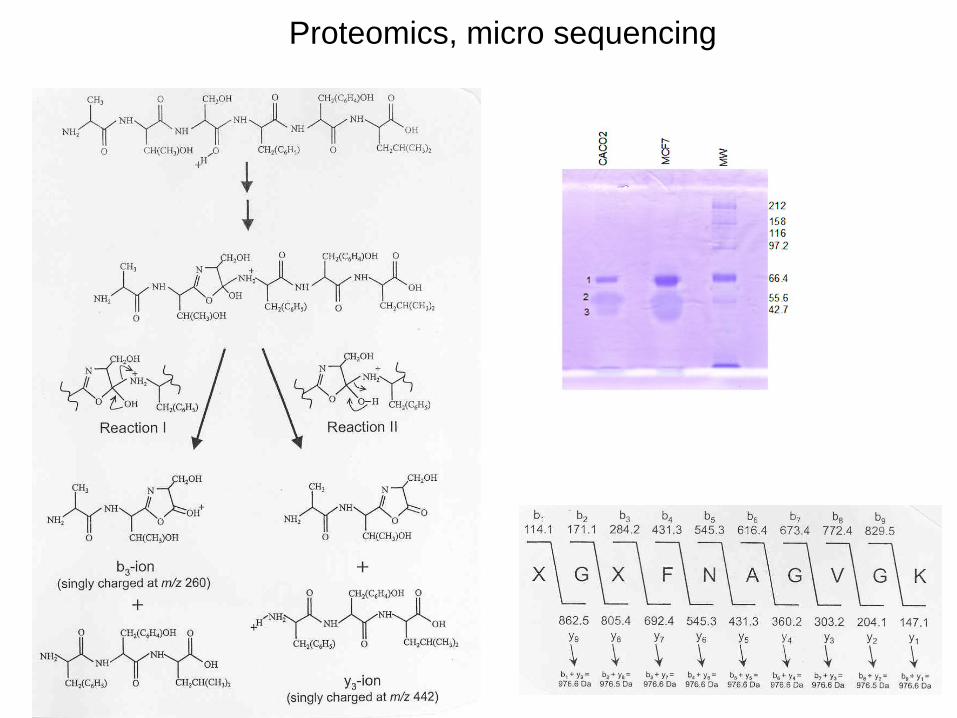
Proteomics, micro sequencing
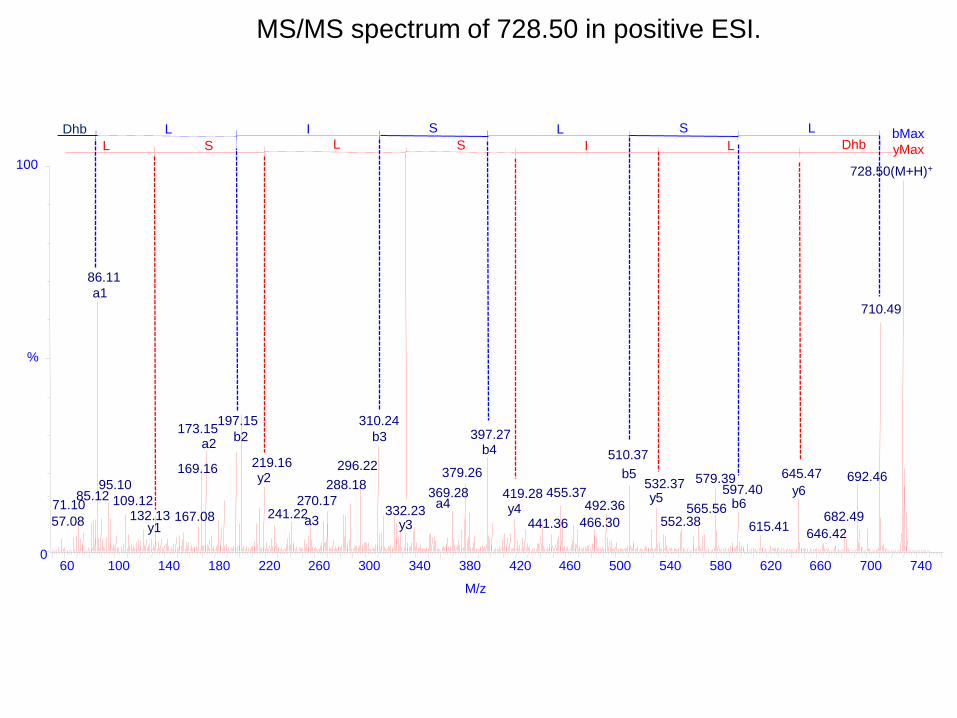
MS/MS spectrum of 728.50 in positive ESI.
M/z
60 100 140 180 220 260 300 340 380 420 460 500 540 580 620 660 700 740
%
0
100
L S L bMax L Dhb yMax
728.50(M+H)+
86.11
a1
85.12 71.10
57.08
710.49
b2 173.15
a2
169.16
95.10
109.12 132.13 167.08
310.24
296.22 219.16
288.18
270.17
a3 241.22
397.27 b4
379.26
369.28 a4
692.46
510.37
455.37 419.28
441.36
492.36
466.30
579.39 532.37
565.56 552.38
645.47
597.40 b6
615.41
y6
682.49
646.42
b5
S
b3
I
197.15
L
y5
I
y4
S
332.23
L
y3
y2
S
Dhb
L
y1
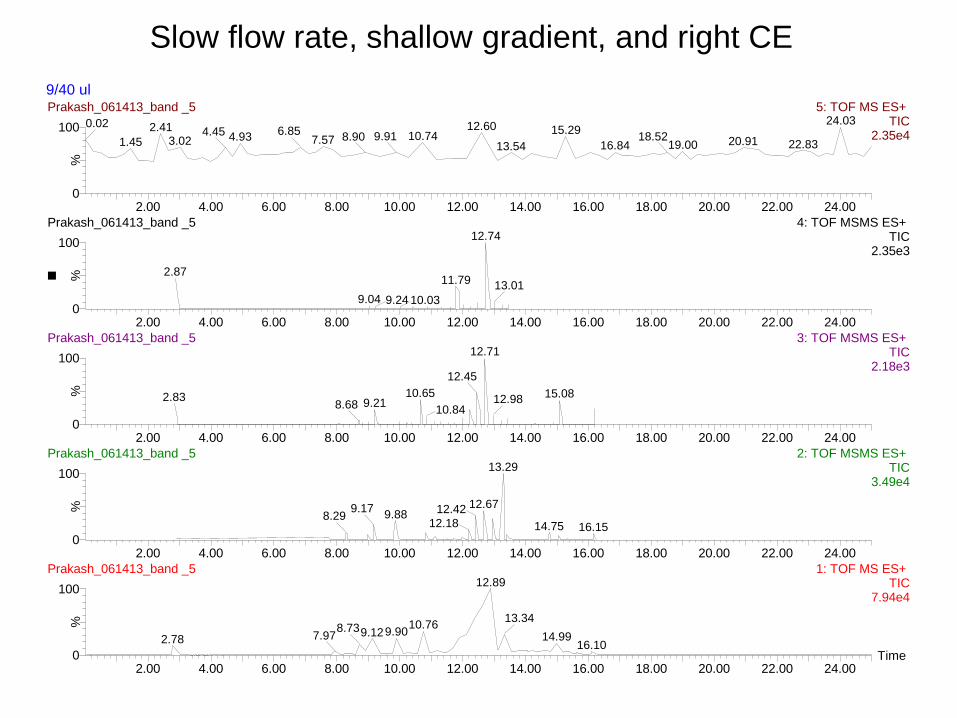
9/40 ul
Time2.00 4.00 6.00 8.00 10.00 12.00 14.00 16.00 18.00 20.00 22.00 24.00
%
0
100
2.00 4.00 6.00 8.00 10.00 12.00 14.00 16.00 18.00 20.00 22.00 24.00
%
0
100
2.00 4.00 6.00 8.00 10.00 12.00 14.00 16.00 18.00 20.00 22.00 24.00
%
0
100
2.00 4.00 6.00 8.00 10.00 12.00 14.00 16.00 18.00 20.00 22.00 24.00
%
0
100
2.00 4.00 6.00 8.00 10.00 12.00 14.00 16.00 18.00 20.00 22.00 24.00
%
0
100
Prakash_061413_band _5 5: TOF MS ES+ TIC
2.35e4
24.0312.602.410.02
1.4510.744.933.02
4.457.57
6.85 9.918.9015.29
13.54 20.9119.0016.8418.52
22.83
Prakash_061413_band _5 4: TOF MSMS ES+ TIC
2.35e3
12.74
2.8711.79
9.04 9.24 10.03
13.01
Prakash_061413_band _5 3: TOF MSMS ES+ TIC
2.18e3
12.71
12.45
10.652.839.218.68 10.84
15.0812.98
Prakash_061413_band _5 2: TOF MSMS ES+ TIC
3.49e4
13.29
12.6712.429.889.17
8.2912.18 14.75 16.15
Prakash_061413_band _5 1: TOF MS ES+ TIC
7.94e4
12.89
10.769.909.128.73
2.78 7.97
13.34
14.9916.10
Slow flow rate, shallow gradient, and right CE
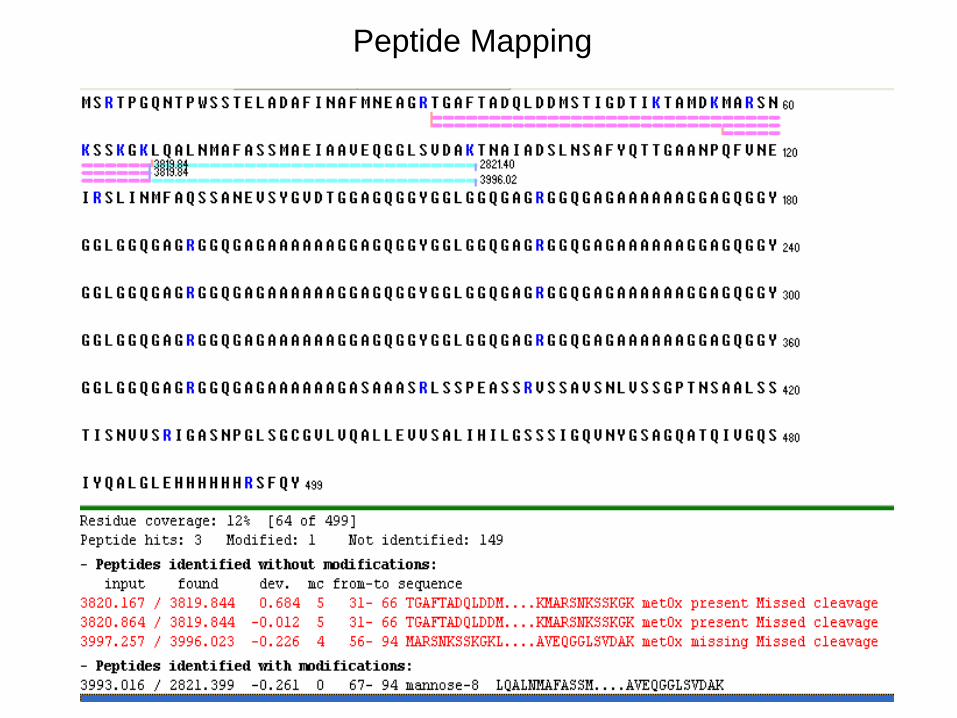
Peptide Mapping
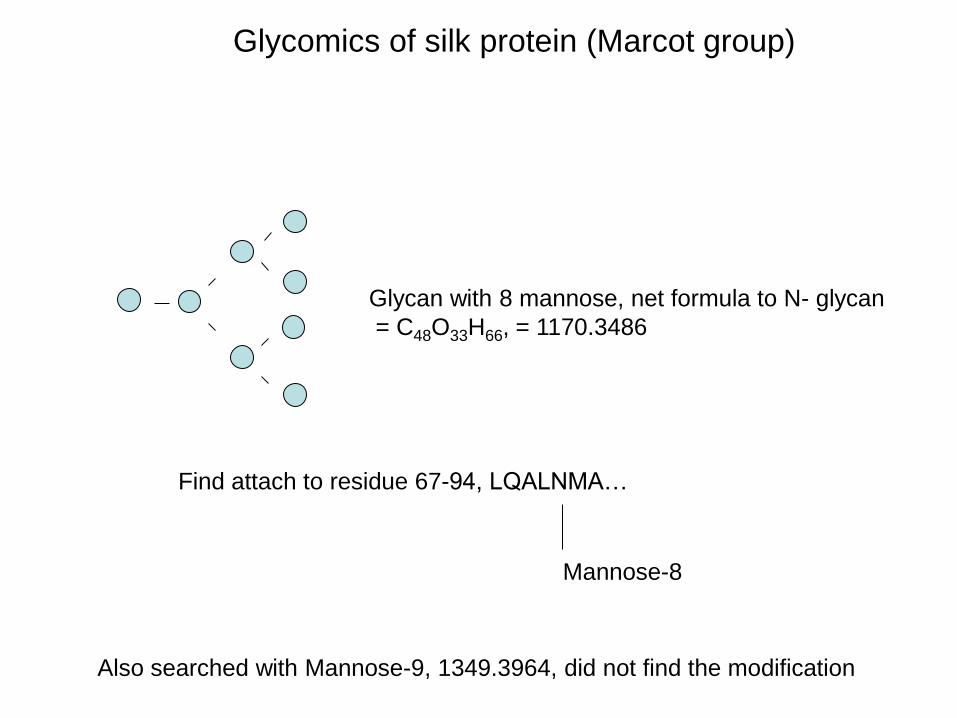
Glycan with 8 mannose, net formula to N- glycan
= C48O33H66, = 1170.3486
Find attach to residue 67-94, LQALNMA…
Mannose-8
Also searched with Mannose-9, 1349.3964, did not find the modification
Glycomics of silk protein (Marcot group)
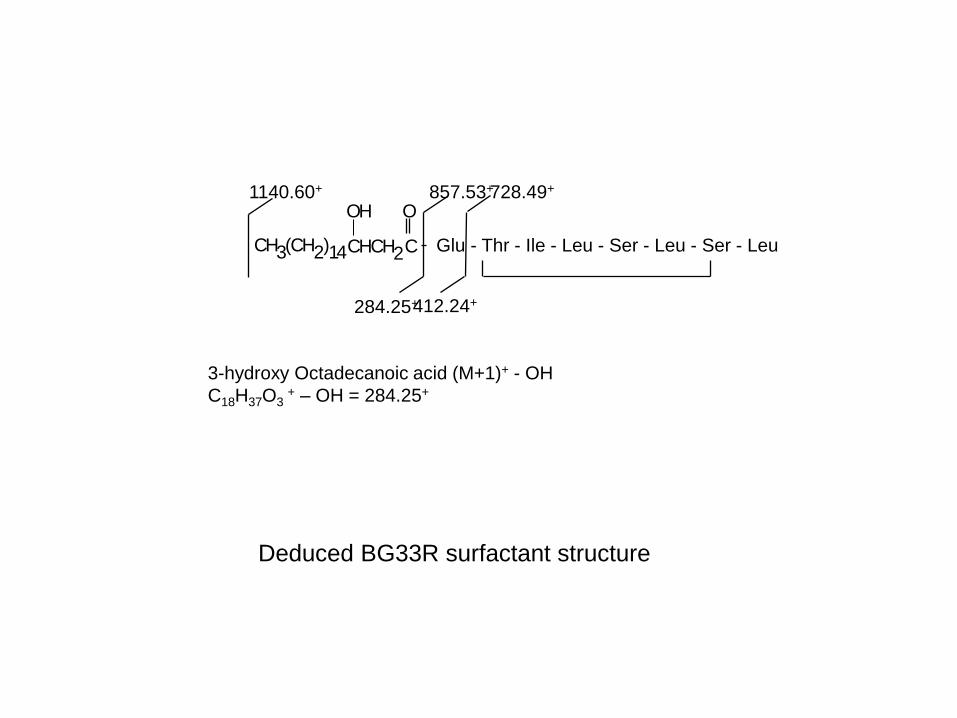
3-hydroxy Octadecanoic acid (M+1)+ - OH
C18H37O3 + – OH = 284.25+
Glu - Thr - Ile - Leu - Ser - Leu - Ser - Leu
284.25+
857.53+ 728.49+ 1140.60+
412.24+
C H 3 ( C H 2 ) 1 4 C H C H 2 C
O H O
Deduced BG33R surfactant structure
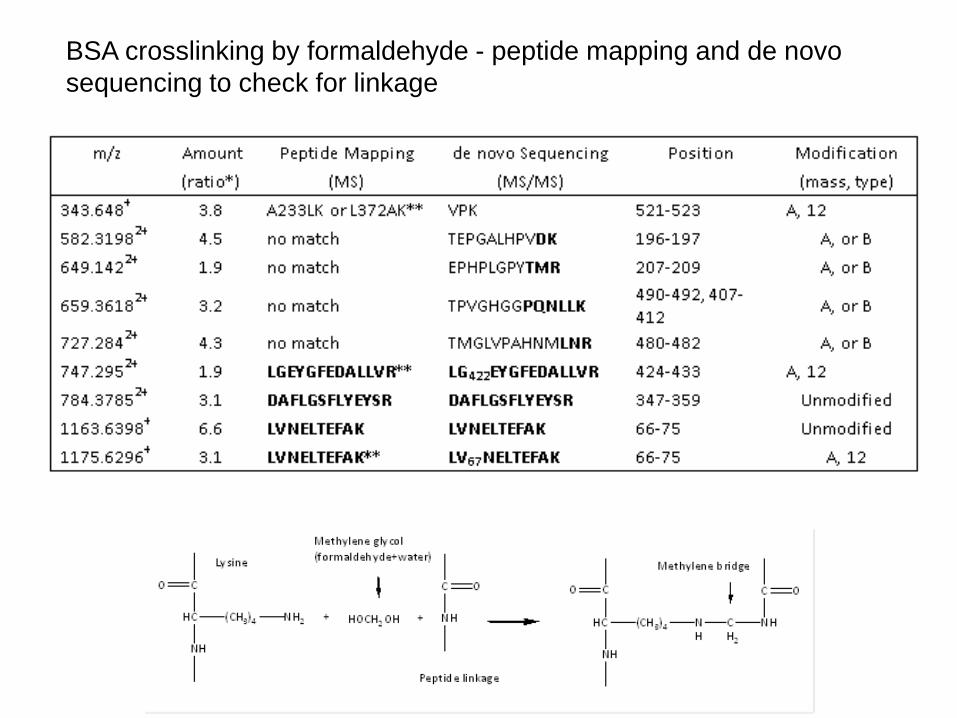
BSA crosslinking by formaldehyde - peptide mapping and de novo
sequencing to check for linkage
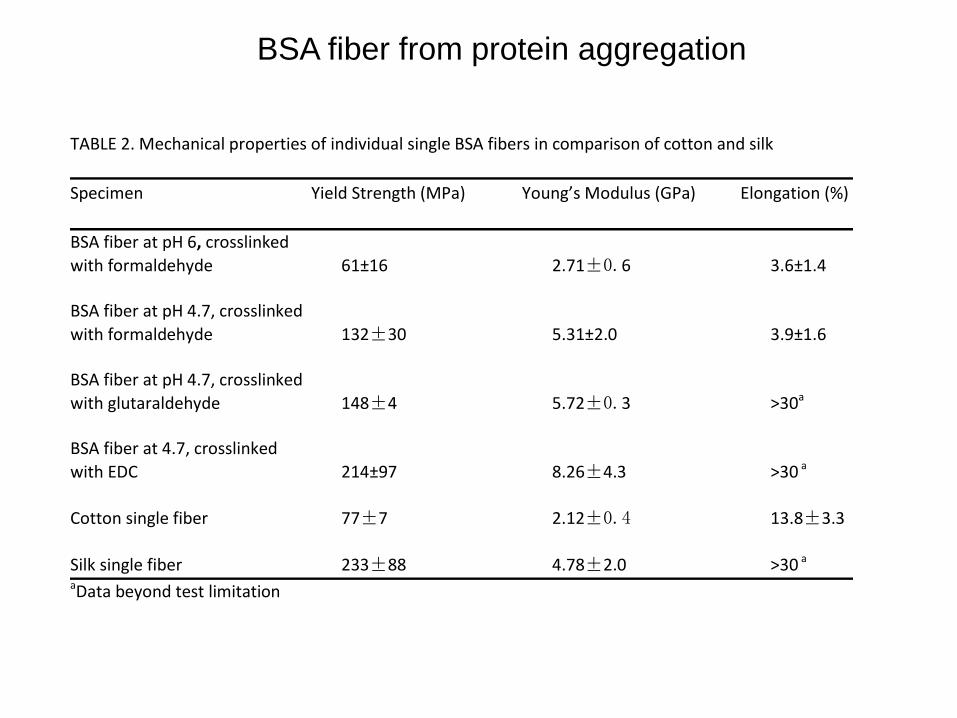
BSA fiber from protein aggregation
TABLE 2. Mechanical properties of individual single BSA fibers in comparison of cotton and silk 1 2
Specimen Yield Strength (MPa) Young’s Modulus (GPa) Elongation (%) 3 4
BSA fiber at pH 6, crosslinked 5
with formaldehyde 61±16 2.71±0.6 3.6±1.4 6 7 BSA fiber at pH 4.7, crosslinked 8
with formaldehyde 132±30 5.31±2.0 3.9±1.6 9 10 BSA fiber at pH 4.7, crosslinked 11
with glutaraldehyde 148±4 5.72±0.3 >30a 12 13 BSA fiber at 4.7, crosslinked 14
with EDC 214±97 8.26±4.3 >30 a 15 16
Cotton single fiber 77±7 2.12±0.4 13.8±3.3 17 18
Silk single fiber 233±88 4.78±2.0 >30 a 19 aData beyond test limitation 20
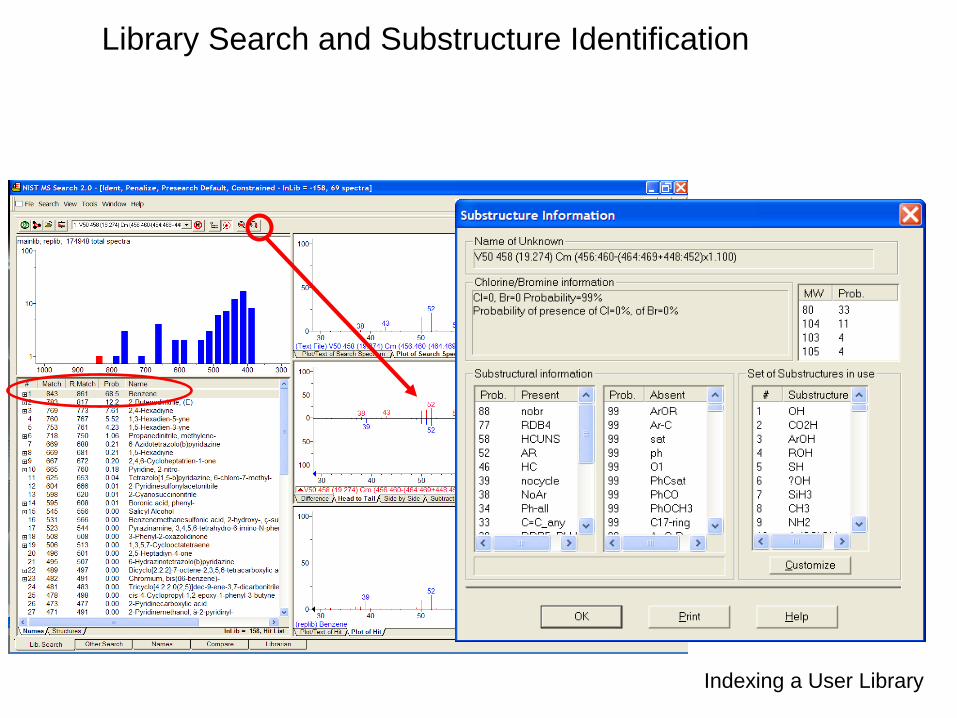
Library Search and Substructure Identification
Indexing a User Library
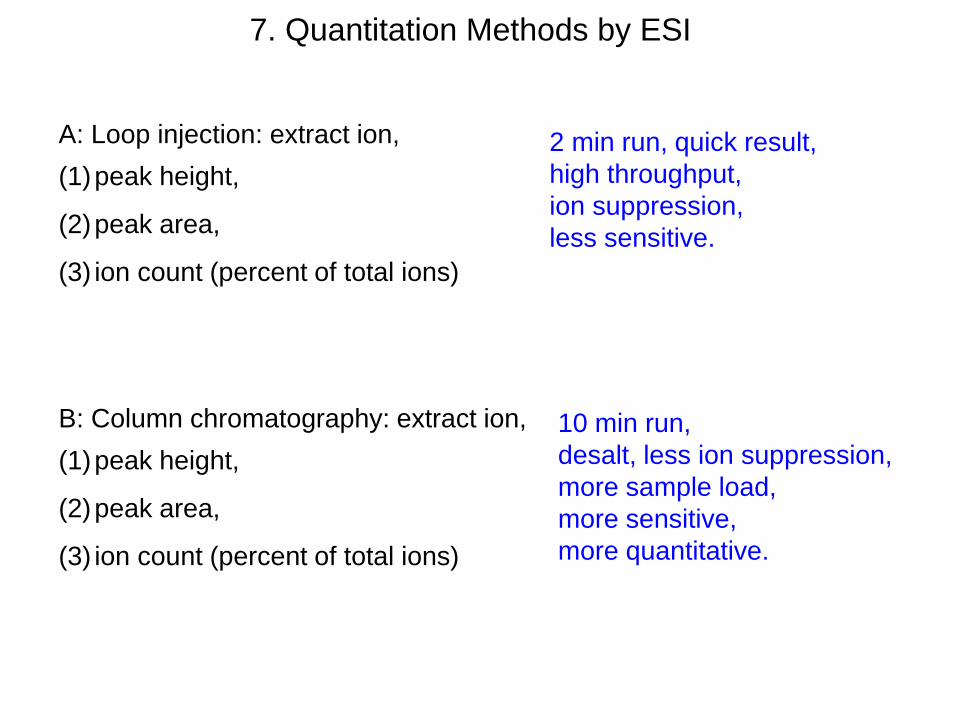
7. Quantitation Methods by ESI
A: Loop injection: extract ion,
(1)peak height,
(2)peak area,
(3) ion count (percent of total ions)
B: Column chromatography: extract ion,
(1)peak height,
(2)peak area,
(3) ion count (percent of total ions)
2 min run, quick result,
high throughput,
ion suppression,
less sensitive.
10 min run,
desalt, less ion suppression,
more sample load,
more sensitive,
more quantitative.
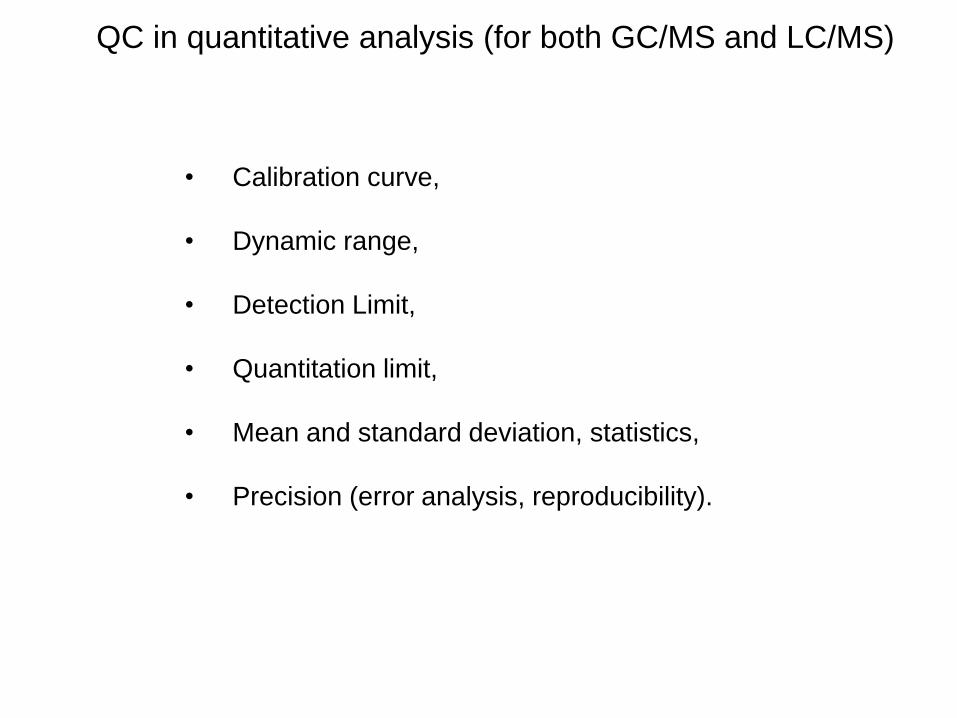
QC in quantitative analysis (for both GC/MS and LC/MS)
• Calibration curve,
• Dynamic range,
• Detection Limit,
• Quantitation limit,
• Mean and standard deviation, statistics,
• Precision (error analysis, reproducibility).
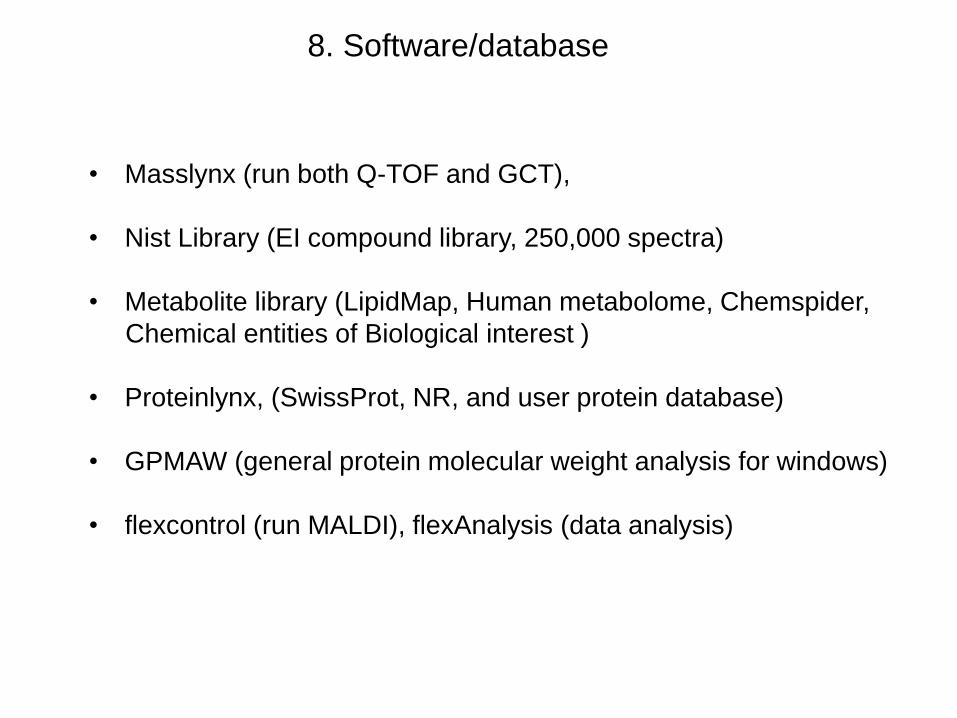
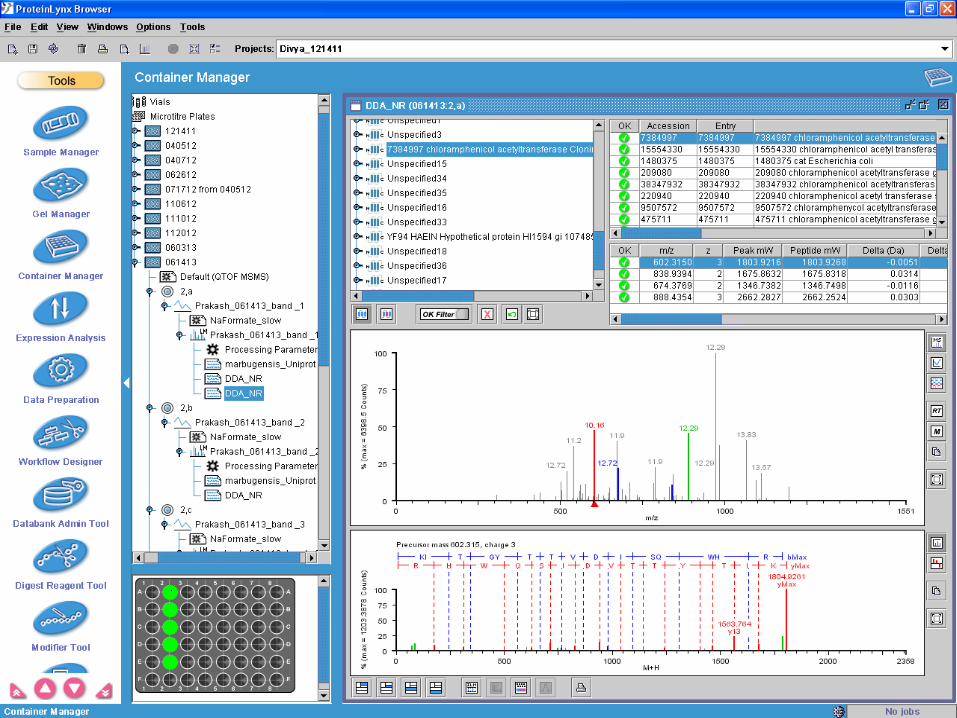
8. Software/database
• Masslynx (run both Q-TOF and GCT),
• Nist Library (EI compound library, 250,000 spectra)
• Metabolite library (LipidMap, Human metabolome, Chemspider,
Chemical entities of Biological interest )
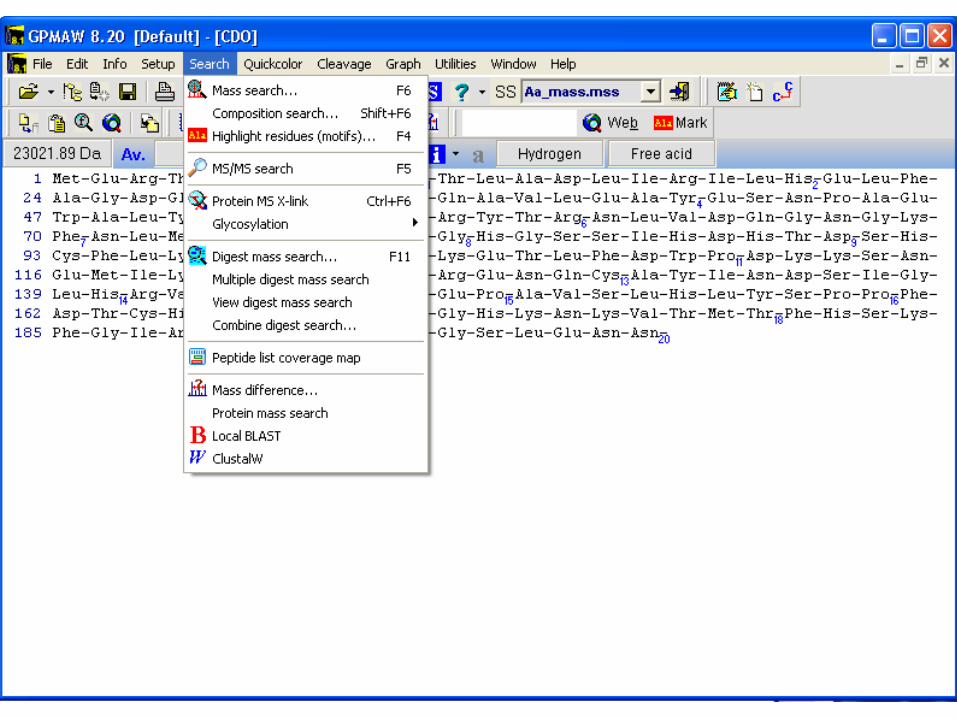
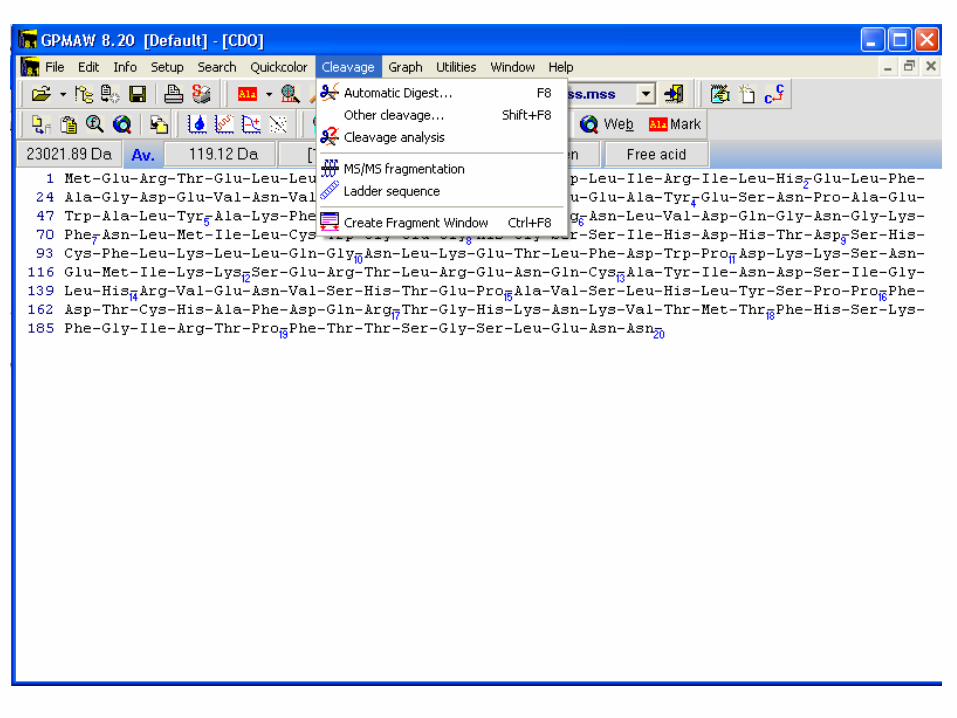
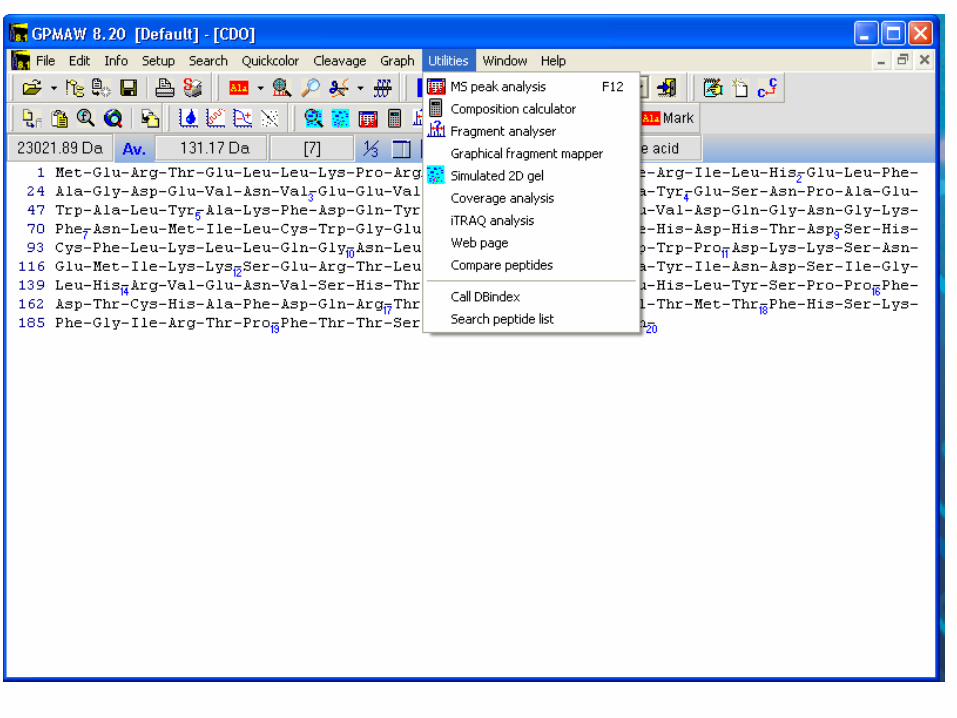
• Proteinlynx, (SwissProt, NR, and user protein database)
• GPMAW (general protein molecular weight analysis for windows)
• flexcontrol (run MALDI), flexAnalysis (data analysis)
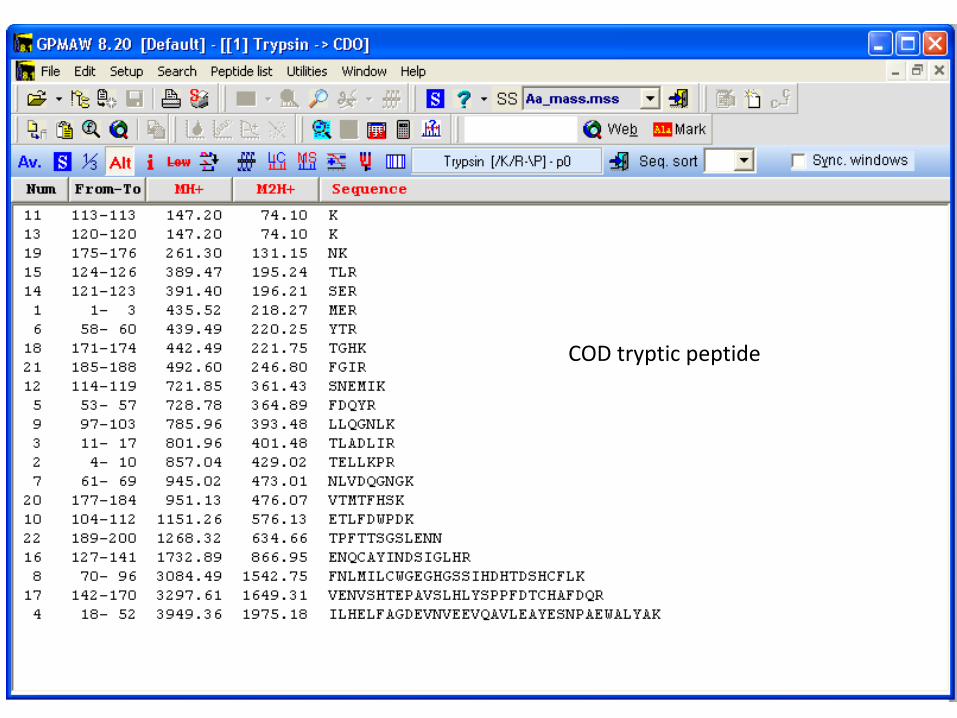
COD tryptic peptide
9. Data Storage, Retrieval, and Presentation
• All data are stored in C drive and backed up in two other locations,
they can be retrieved at any time.
• Data can be downloaded into other formate (Excel, PPT…)
• Chromatogram and spectrum can be reformatted .
as is
m/z60 80 100 120 140 160 180 200 220
%
0
100
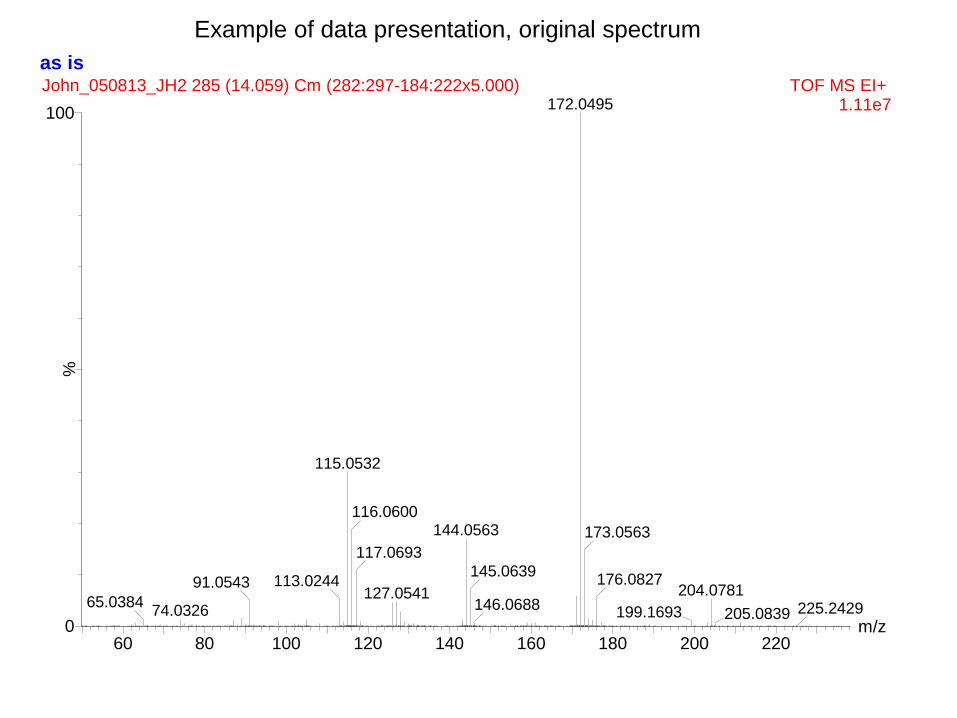
John_050813_JH2 285 (14.059) Cm (282:297-184:222x5.000) TOF MS EI+ 1.11e7172.0495
115.0532
113.024491.0543
74.032665.0384
116.0600144.0563
117.0693
127.0541
145.0639
146.0688
173.0563
176.0827204.0781
199.1693 205.0839 225.2429
Example of data presentation, original spectrum
m/z
60 80 100 120 140 160 180 200 220
Re
lati
ve I
nte
ns
ity (
%)
0
1.11e7 172.0495
115.0532
113.0244 91.0543
74.0326 65.0384
116.0600 144.0563
117.0693
127.0541
145.0639
146.0688
173.0563
176.0827 204.0781
199.1693 205.0839 225.2429
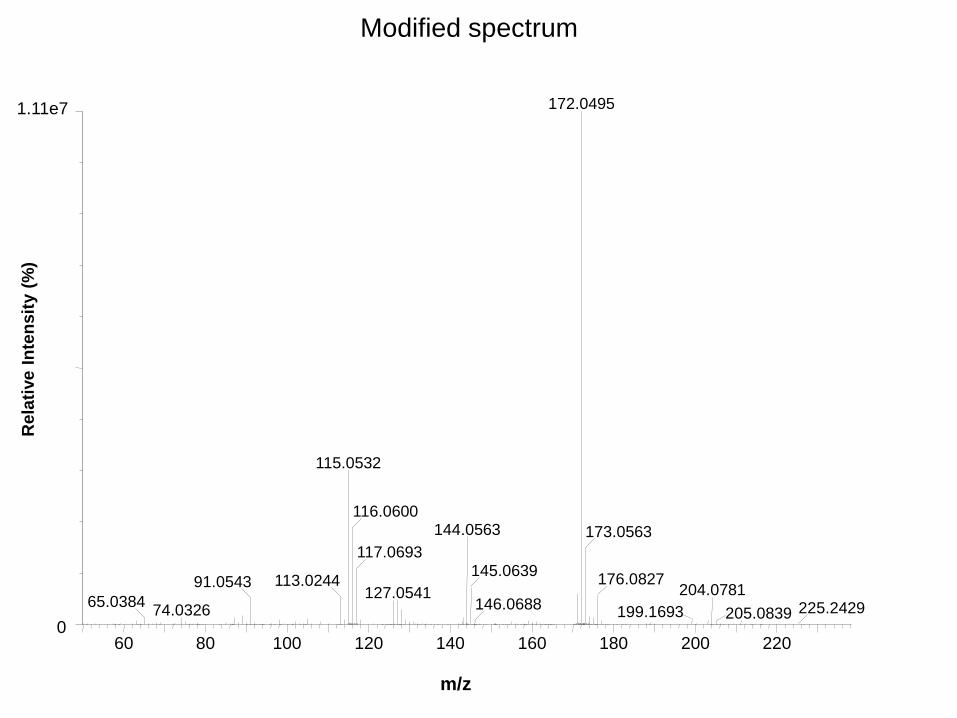
Modified spectrum
m/z
200 400 600 800 1000 1200
%
0
%
0
12,000
728.4044
645.3759
532.3084 226.9587 398.8255
857.4340
922.5161
5,150 609.3486
496.2772
284.2161
401.2253
728.4049
857.4309
1122.5986
922.5136 1226.2308
1140.6039
Ion
Co
un
ts
Ion
Co
un
ts
A, CE = 20 V
B, CE = 40 V
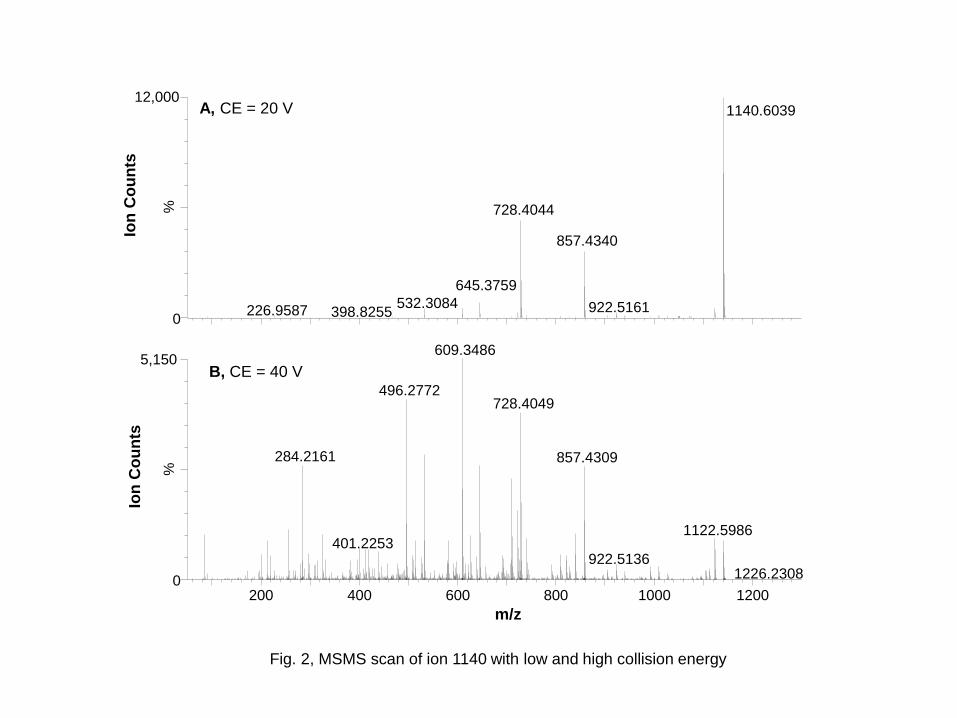
Fig. 2, MSMS scan of ion 1140 with low and high collision energy

•Experiment design
•Data acquisition (same day turnaround)
•Data analysis
•Technical write-up
•Consultation and brain-storming (free)
10. Service Support
Yonnie Wu, Ph.D.
Mass Spec Center, Director
172 Chemistry Building
(334) 844-6911
http://www.auburn.edu/cosam/departments/chemistry/Mass_Spec%20Usage.html
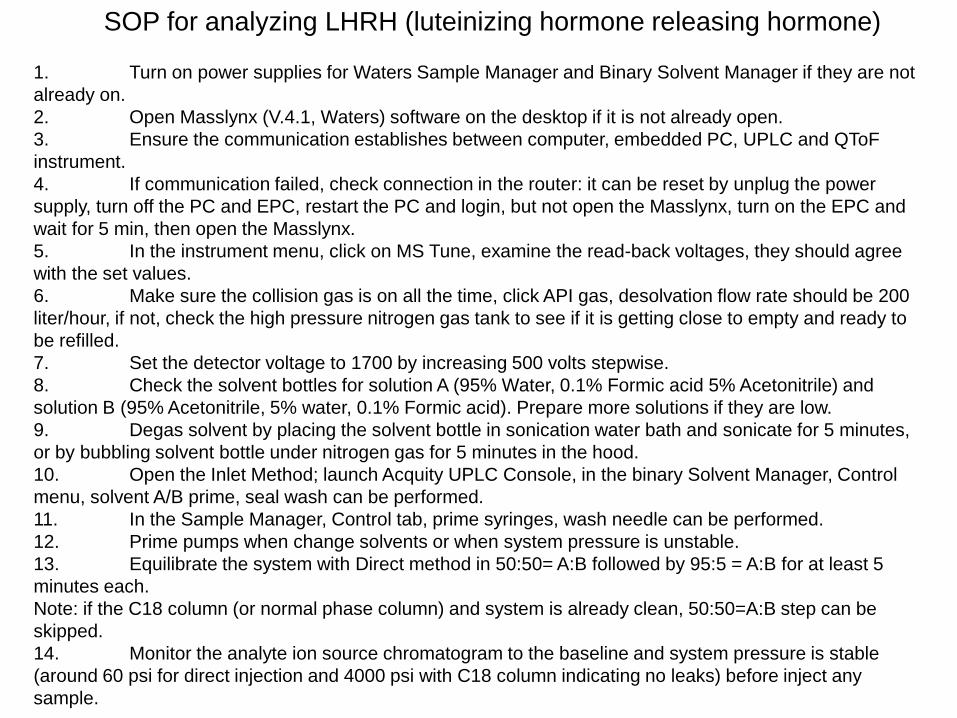
1. Turn on power supplies for Waters Sample Manager and Binary Solvent Manager if they are not
already on.
2. Open Masslynx (V.4.1, Waters) software on the desktop if it is not already open.
3. Ensure the communication establishes between computer, embedded PC, UPLC and QToF
instrument.
4. If communication failed, check connection in the router: it can be reset by unplug the power
supply, turn off the PC and EPC, restart the PC and login, but not open the Masslynx, turn on the EPC and
wait for 5 min, then open the Masslynx.
5. In the instrument menu, click on MS Tune, examine the read-back voltages, they should agree
with the set values.
6. Make sure the collision gas is on all the time, click API gas, desolvation flow rate should be 200
liter/hour, if not, check the high pressure nitrogen gas tank to see if it is getting close to empty and ready to
be refilled.
7. Set the detector voltage to 1700 by increasing 500 volts stepwise.
8. Check the solvent bottles for solution A (95% Water, 0.1% Formic acid 5% Acetonitrile) and
solution B (95% Acetonitrile, 5% water, 0.1% Formic acid). Prepare more solutions if they are low.
9. Degas solvent by placing the solvent bottle in sonication water bath and sonicate for 5 minutes,
or by bubbling solvent bottle under nitrogen gas for 5 minutes in the hood.
10. Open the Inlet Method; launch Acquity UPLC Console, in the binary Solvent Manager, Control
menu, solvent A/B prime, seal wash can be performed.
11. In the Sample Manager, Control tab, prime syringes, wash needle can be performed.
12. Prime pumps when change solvents or when system pressure is unstable.
13. Equilibrate the system with Direct method in 50:50= A:B followed by 95:5 = A:B for at least 5
minutes each.
Note: if the C18 column (or normal phase column) and system is already clean, 50:50=A:B step can be
skipped.
14. Monitor the analyte ion source chromatogram to the baseline and system pressure is stable
(around 60 psi for direct injection and 4000 psi with C18 column indicating no leaks) before inject any
sample.
SOP for analyzing LHRH (luteinizing hormone releasing hormone)
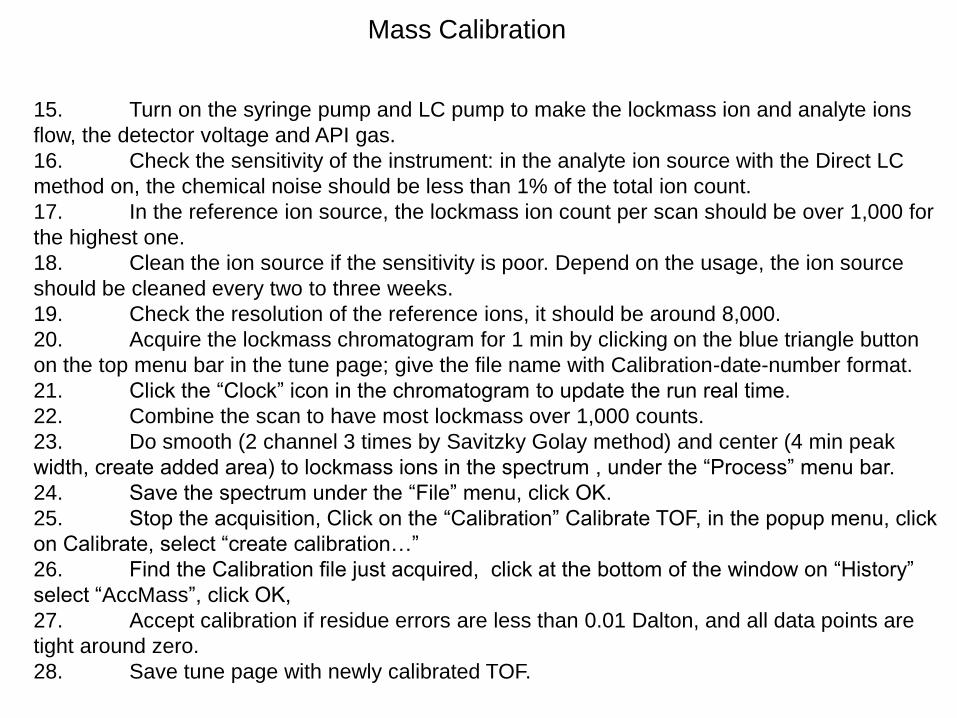
15. Turn on the syringe pump and LC pump to make the lockmass ion and analyte ions
flow, the detector voltage and API gas.
16. Check the sensitivity of the instrument: in the analyte ion source with the Direct LC
method on, the chemical noise should be less than 1% of the total ion count.
17. In the reference ion source, the lockmass ion count per scan should be over 1,000 for
the highest one.
18. Clean the ion source if the sensitivity is poor. Depend on the usage, the ion source
should be cleaned every two to three weeks.
19. Check the resolution of the reference ions, it should be around 8,000.
20. Acquire the lockmass chromatogram for 1 min by clicking on the blue triangle button
on the top menu bar in the tune page; give the file name with Calibration-date-number format.
21. Click the “Clock” icon in the chromatogram to update the run real time.
22. Combine the scan to have most lockmass over 1,000 counts.
23. Do smooth (2 channel 3 times by Savitzky Golay method) and center (4 min peak
width, create added area) to lockmass ions in the spectrum , under the “Process” menu bar.
24. Save the spectrum under the “File” menu, click OK.
25. Stop the acquisition, Click on the “Calibration” Calibrate TOF, in the popup menu, click
on Calibrate, select “create calibration…”
26. Find the Calibration file just acquired, click at the bottom of the window on “History”
select “AccMass”, click OK,
27. Accept calibration if residue errors are less than 0.01 Dalton, and all data points are
tight around zero.
28. Save tune page with newly calibrated TOF.
Mass Calibration
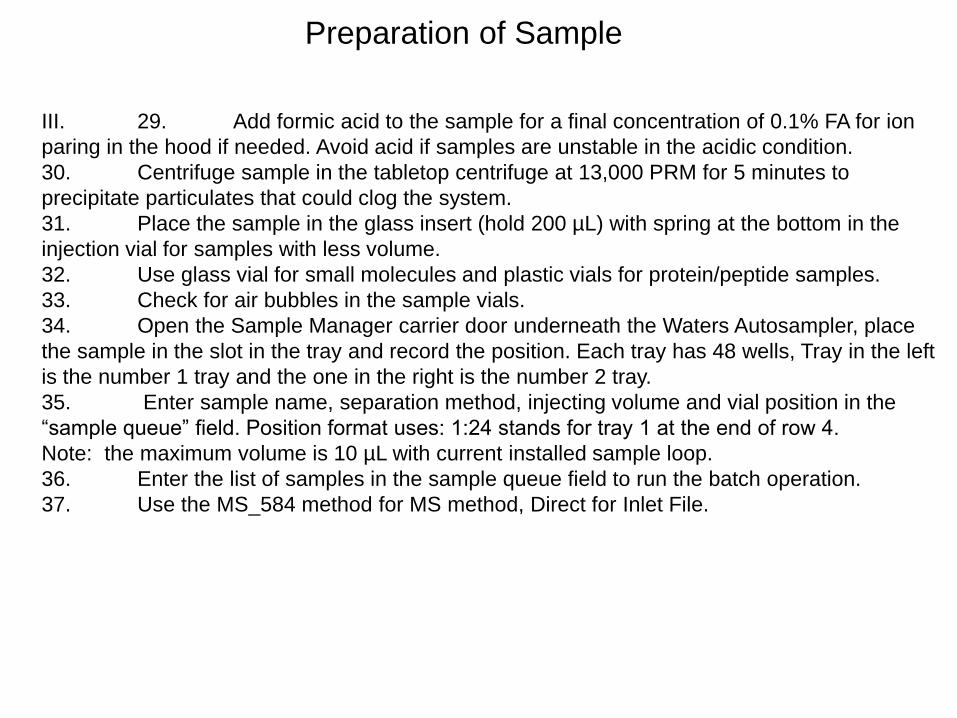
III. 29. Add formic acid to the sample for a final concentration of 0.1% FA for ion
paring in the hood if needed. Avoid acid if samples are unstable in the acidic condition.
30. Centrifuge sample in the tabletop centrifuge at 13,000 PRM for 5 minutes to
precipitate particulates that could clog the system.
31. Place the sample in the glass insert (hold 200 µL) with spring at the bottom in the
injection vial for samples with less volume.
32. Use glass vial for small molecules and plastic vials for protein/peptide samples.
33. Check for air bubbles in the sample vials.
34. Open the Sample Manager carrier door underneath the Waters Autosampler, place
the sample in the slot in the tray and record the position. Each tray has 48 wells, Tray in the left
is the number 1 tray and the one in the right is the number 2 tray.
35. Enter sample name, separation method, injecting volume and vial position in the
“sample queue” field. Position format uses: 1:24 stands for tray 1 at the end of row 4.
Note: the maximum volume is 10 µL with current installed sample loop.
36. Enter the list of samples in the sample queue field to run the batch operation.
37. Use the MS_584 method for MS method, Direct for Inlet File.
Preparation of Sample
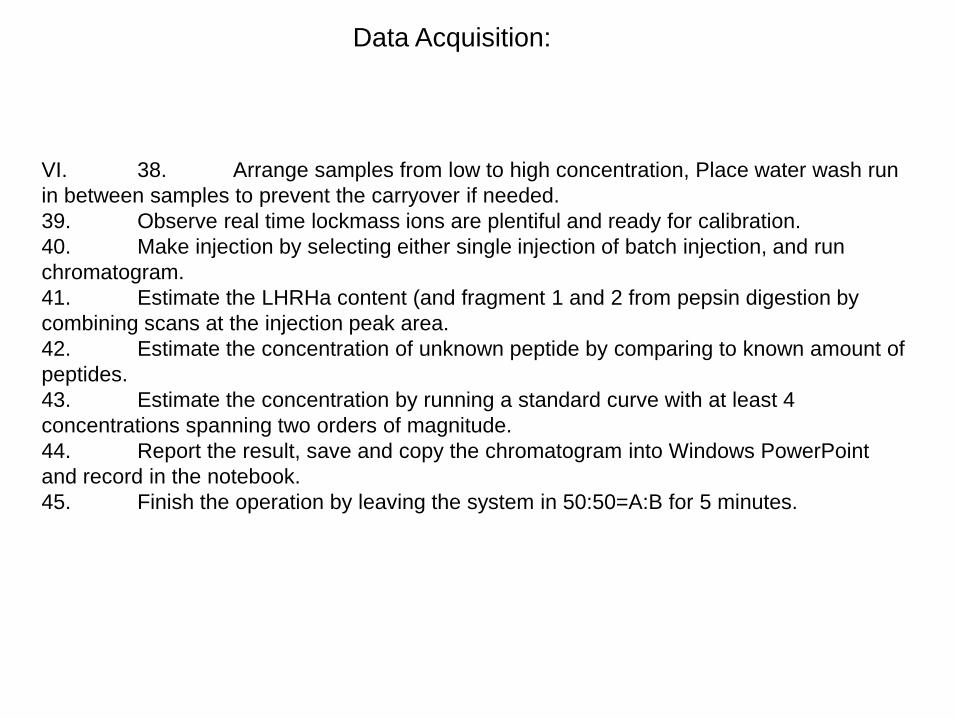
VI. 38. Arrange samples from low to high concentration, Place water wash run
in between samples to prevent the carryover if needed.
39. Observe real time lockmass ions are plentiful and ready for calibration.
40. Make injection by selecting either single injection of batch injection, and run
chromatogram.
41. Estimate the LHRHa content (and fragment 1 and 2 from pepsin digestion by
combining scans at the injection peak area.
42. Estimate the concentration of unknown peptide by comparing to known amount of
peptides.
43. Estimate the concentration by running a standard curve with at least 4
concentrations spanning two orders of magnitude.
44. Report the result, save and copy the chromatogram into Windows PowerPoint
and record in the notebook.
45. Finish the operation by leaving the system in 50:50=A:B for 5 minutes.
Data Acquisition:
46. When instrument is not in use, turn off the solvent flow by clicking on the “water
fountain”
47. Set the detector voltage to zero.
48. Turn off the API gas by clicking on the icon, leave COL gas on.
49. Turn off the syringe pump of the lockmass, by clicking on the pump arrow; it
changes red color to blue color at the center of the “instrument” tab.
Set the instrument in idle
Kimwipe
Glove
Pipetmans: 5 mL, 1 mL, 200 µL, 100 µL and
1~10µL
Pipet tips: 1-10 µL, 200 µL, 1 mL and 5 mL
1.5 mL eppendorf tubes
1 mL glass vials and insert
Tube Blocks
MilliQ water
HPLC grade Acetonitrile
Formic acid (very volatile, work in hood)
Beakers
Bottles
Sonicator
Tabletop Centrifuge (Argosflexifuge)
Materials and Reagents