Embed Size (px)
Citation preview

1 NLB Group Interim Report Q3 2018
Interim Report
Q3 2018

2 NLB Group Interim Report Q3 2018
NLB Group Strategic Members’ Overview
NLB Group
349 Number of branches
1,826,483 Number of
active clients
158.3 Result after tax
(consolidated, in EUR million)
12,783.7 Total assets
(consolidated, in EUR million)

3 NLB Group Interim Report Q3 2018
AAAA AAA
Slovenia Bosnia and Herzegovina
NLB, Ljubljana NLB Banka, Banja Luka
108 9,035.7 57 711.4 Number of
branches
Total assets
(in EUR million)
Number of
branches
Total assets
(in EUR million)
688,431 23.5% 225,863 17.6% Number of
active clients
Market share
by total assets
Number of
active clients
Market share*
by total assets
134.6 11.7 Result after tax
(in EUR million)
Result after tax
(in EUR million)
*Market share in the Republic of Srpska as at 30 June 2018
NLB Skladi, Ljubljana NLB Banka, Sarajevo
1,286 31.5% 38 565.3 Assets under
management
(in EUR million)
Market share*
(mutual funds)
Number of
branches
Total assets
(in EUR million)
3.5 135,948 5.1% Result after tax
(in EUR million)
Number of
active clients
Market share*
by total assets
* Market share of assets under management in mutual funds
7.5
Result after tax
(in EUR million)
NLB Vita, Ljubljana * Market share in the Federation of Bosnia and Herzegovina as at 30 June
2018.
454.5 14.8%
Assets of covered funds
without own resources (in
EUR million)
Market share*
5.84
Result after tax
(in EUR million)
* Market share in traditional life insurance.
4 NLB Group Interim Report Q3 2018
AAAA AAA
Macedonia
Kosovo
NLB Banka, Skopje NLB Banka, Prishtina
54 1,270.1 43 645.4 Number of
branches
Total assets
(in EUR million)
Number of
branches
Total assets
(in EUR million)
377,284 15.9% 202,324 16.5% Number of
active clients
Market share
by total assets
Number of
active clients
Market share
by total assets
33.3 11.2 Result after tax
(in EUR million)
Result after tax
(in EUR million)
AAAA AAA
Serbia Montenegro
NLB Banka, Beograd NLB Banka, Podgorica
31 439.2 18 484.6 Number of
branches
Total assets
(in EUR million)
Number of
branches
Total assets
(in EUR million)
135,430 1.5% 61,203 11.0% Number of
active clients
Market share
by total assets
Number of
active clients
Market share
by total assets
6.4 7.7 Result after tax
(in EUR million)
Result after tax
(in EUR million)
Note: The result ‘after tax data‘ in the figure above shows the Group members’ standalone result, and not their contribution to the consolidated result after tax. An active client is a client who has for a period not shorter than one month any investment-saving product with a positive balance, or loan/deposit/guarantee product, or insurance business, or who made at least one debit bank account or credit card transaction in the last three months.

5 NLB Group Interim Report Q3 2018
Contents
Figures at a glance of NLB Group ...................................................................................................................................................... 6 Key financial caption of NLB Group ................................................................................................................................................... 7 Definitions and glossary of selected terms ....................................................................................................................................... 8 Macroeconomic environment ............................................................................................................................................................. 9
Business Report ................................................................................................................................................................... 11
Financial performance of NLB Group .............................................................................................................................................. 13 Profit................................................................................................................................................................................................... 13 Net interest income ........................................................................................................................................................................... 17 Net non-interest income.................................................................................................................................................................... 19 Total costs ......................................................................................................................................................................................... 21 Net impairments and provisions for credit risk ............................................................................................................................... 22 Financial position of NLB Group ...................................................................................................................................................... 23 Segment analysis .............................................................................................................................................................................. 26 Retail banking in Slovenia ................................................................................................................................................................ 27 Corporate and Investment banking in Slovenia .............................................................................................................................. 30 Strategic foreign markets ................................................................................................................................................................. 33 Financial markets in Slovenia........................................................................................................................................................... 35 Non-core markets and activities ....................................................................................................................................................... 36 Capital and Liquidity ......................................................................................................................................................................... 37 Capital adequacy ............................................................................................................................................................................... 37 Liquidity ............................................................................................................................................................................................. 39 Risk management .............................................................................................................................................................................. 40 Events after 30 September 2018 ....................................................................................................................................................... 45
Condensed Interim Financial Statements of NLB Group and NLB ...................................................... 46

6 NLB Group Interim Report Q3 2018
Figures at a glance of NLB Group
Profit a.t. - quarterly (in EUR million) ROE a.t. - YtD (in %)
Cost /income ratio (CIR) - YtD (in %) Interest margin - YtD (in %)
Non-performing exposure (NPE) - YtD (in %) Cost of risk net - YtD (in bp)
Loan to deposit ratio (LTD) - YtD (in %) Total capital ratio - YtD (in %)
2.54%2.57%
2.49%
2.55% 2.53%
Sept.17 Dec.17 Mar.18 Jun.18 Sept.18
16.3%
15.9%
16.6%
18.7%
16.9%
Sept.17 Dec.17 Mar.18 Jun.18 Sept.18
66.1
41.1
57.7
47.2
53.5
Q3 17 Q4 17 Q1 18 Q2 18 Q3 18
56.9%
58.3%
53.2% 53.2%
57.0%
Sept.17 Dec.17 Mar.18 Jun.18 Sept.18
15.9%
14.4%13.5%
12.1% 11.9%
Sept.17 Dec.17 Mar.18 Jun.18 Sept.18
8.3%
6.7%
6.2%
5.8%
5.3%
Sept.17 Dec.17 Mar.18 Jun.18 Sept.18
72.3%
70.8%69.8%
70.5%
69.1%
Sept.17 Dec.17 Mar.18 Jun.18 Sept.18
-70
-62
-20
-46 -45
Sept.17 Dec.17 Mar.18 Jun.18 Sept.18
Note:31 December 2017: envisaging dividend payment in 100% profit after tax of the Bank (EUR 189 million)
30 June 2018: IFRS 9 implementation effect included (EUR 43.8 million)30 Sep 2018 after dividend pay-out (EUR -271 million), but including 1H 2018 result (EUR 109 million)

7 NLB Group Interim Report Q3 2018
Key financial caption of NLB Group
Table 1: Key financial caption of NLB Group
in EUR million / % / bps 1-9 2018 1-9 2017
Change
YoY Q3 18 Q2 18 Q3 17
Key Income statement data (in EUR million)
Net operating income 369.0 365.3 1% 125.9 112.7 124.2
Net interest income 231.9 228.7 1% 80.2 76.7 80.1
Net non-interest income 137.1 136.6 0% 45.7 36.0 44.1
Costs -210.4 -207.8 1% -70.4 -70.6 -68.8
Result before impairments and provisions 158.6 157.4 1% 55.5 42.1 55.4
Impairments and provisions 19.0 37.3 -49% 4.6 11.6 11.7
Result after tax 158.3 184.0 -14% 53.5 47.2 66.1
Key financial indicators
Return on equity after tax (ROE a.t.) 11.9% 15.9% -3.9 p.p.
Return on assets after tax (ROA a.t.) 1.7% 2.0% -0.4 p.p.
RORAC a.t.1 15.9% 21.0% -5.1 p.p.
Interest margin (on interest bearing assets)2 2.53% 2.54% -0.01 p.p. 2.59% 2.52% 2.67%
Interest margin (on total assets - BoS ratio) 2.48% 2.54% -0.06 p.p. 2.53% 2.46% 2.67%
Cost-to-income ratio (CIR) 57.0% 56.9% 0.1 p.p. 55.9% 62.6% 55.4%
Cost-to-income ratio (CIR) normalised 3 58.7% 58.5% 0.3 p.p. 55.4% 62.6% 56.1%
Cost of Risk Net (bps)4
-45 -70 26 b.p.
30 Sept 2018 31 Dec 2017 30 Sept 2017
Change
YoY
Change
YtD
Key financial position statement data (in EUR million)
Total assets 12,784 12,238 12,008 6% 4%
Loans to customers (gross) 7,619 7,641 7,788 -2% 0%
Loans to customers (net) 7,081 6,994 6,989 1% 1%
o/w Key business activities 6,654 6,425 6,386 4% 4%
Deposits from customers 10,247 9,879 9,672 6% 4%
Total equity 1,844 1,654 1,611 15% 12%
Other key financial indicators
LTD (Loans to customers/Deposits from customers)5 69.1% 70.8% 72.3% -3.2 p.p. -1.7 p.p.
Common Equity Tier 1 Ratio* 16.9% 15.9% 16.3% 0.6 p.p. 1.0 p.p.
Total capital ratio* 16.9% 15.9% 16.3% 0.6 p.p. 1.0 p.p.
Total risk exposure amount (RWA) 8,607 8,546 8,128 6% 1%
NPL - Gross (in EUR million) 706 844 1,089 -35% -16%
NPL coverage ratio 16 76.4% 77.5% 77.5% -1.1 p.p. -1.2 p.p.
NPL coverage ratio 27 65.5% 62.2% 65.6% -0.1 p.p. 3.4 p.p.
Share of non-performing loans (NPL) in all loans 7.6% 9.2% 11.9% -4.3 p.p. -1.7 p.p.
NPL ratio - Net8 2.8% 3.8% 4.5% -1.7 p.p. -1.0 p.p.
NPE ratio9
5.3% 6.7% 8.3% -3.0 p.p. -1.4 p.p.
Employees
Number of employees 5,951 6,029 6,090 -2.3% -1.3%
6 NPL Coverage ratio 1 = Coverage of gross non-performing loans w ith impairments for all loans
7 NPL Coverage ratio 2 = Coverage of gross non-performing loans w ith impairments for non-performing loans
8 NPL ratio - Net = Net non performing loans/Net loan portfolio
9 EBA definition
5 Net loans to customers /Deposits from customers
*31 Dec 2017 envisaging dividend payment in 100% of net profit after tax of the Bank (EUR 189 million)
30 Sep 2018 after dividend pay-out (EUR -271 million), but including 1H 2018 result (EUR 109 million)
1 RORAC a.t. = profit a.t./average capital requirement normalized at 15.38% RWA for 2018 and onw ards, 14.75% before2 Further analyses of interest margins are based on interest bearing assets3 Without non-recurring revenues and restructuring costs
4 Cost of risk NET = Credit impairments and provisions (annualised level) /average net loans to non-banking sector
International credit ratings NLB 30 September 2018 31 December 2017 Outlook
Standard & Poor's BB+ BB Developing
Fitch* BB BB Rating watch evolving
*On 23 November 2018 Fitch upgraded NLB's Long-term IDR to "BB+" from "BB" and removed it from Rating Watch Evolving (RWE). The Outlook is stable.

8 NLB Group Interim Report Q3 2018
Definitions and glossary of selected terms
ALM Asset and Liability Management
CET 1 Common Equity Tier 1
CIR Cost-to-Income Ratio
DGS Deposit Guarantee Scheme
EBA European Banking Authority
ECB European Central Bank
Euro area The euro area consists of those member states of the EU that have adopted the euro as their currency
FX Foreign Exchange
GDP Gross Domestic Product
IAS 39 International Accounting Standard 39
ICAAP Internal Capital Adequacy Assessment Process
IFRS 9 International Financial Reporting Standard 9
IMAD Institute of Macroeconomic Analysis and Development of the Republic of Slovenia
LTD Loan-to-Deposit Ratio
MREL Minimum requirement for own funds and eligible liabilities
NAFTA The North American Free Trade Agreement
NLB or the Bank NLB d.d.
NPE Non-Performing Exposures
NPL Non-Performing Loans
OCR Overall capital requirement
PMI Purchasing Managers Index
p.p. Percentage point(s)
PD Probability of Default
QR Quick Response
ROA Return on Assets
ROE Return on Equity
RWA Risk Weighted Assets
SEE South-Eastern Europe
SME Small and Medium-sized Enterprises
SREP Supervisory Review and Evaluation Process
The Group NLB Group
TLOF Total Liabilities and Own Funds
US or USA United States of America
ZVKNNLB
Zakon za zaščito vrednosti kapitalske naložbe Republike Slovenije v Novi Ljubljanski banki d.d., Ljubljana (ZVKNNLB), Act on the Protection of the Value of Capital Investment of the Republic of Slovenia in NLB
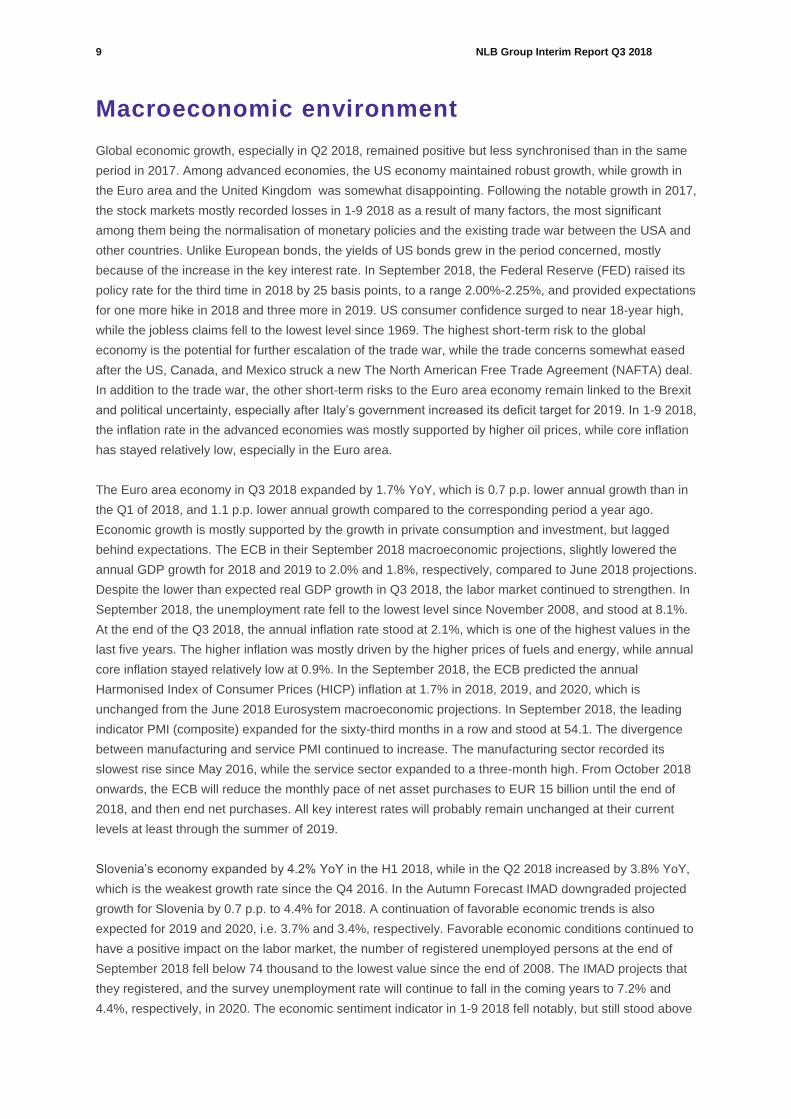
9 NLB Group Interim Report Q3 2018
Macroeconomic environment
Global economic growth, especially in Q2 2018, remained positive but less synchronised than in the same
period in 2017. Among advanced economies, the US economy maintained robust growth, while growth in
the Euro area and the United Kingdom was somewhat disappointing. Following the notable growth in 2017,
the stock markets mostly recorded losses in 1-9 2018 as a result of many factors, the most significant
among them being the normalisation of monetary policies and the existing trade war between the USA and
other countries. Unlike European bonds, the yields of US bonds grew in the period concerned, mostly
because of the increase in the key interest rate. In September 2018, the Federal Reserve (FED) raised its
policy rate for the third time in 2018 by 25 basis points, to a range 2.00%-2.25%, and provided expectations
for one more hike in 2018 and three more in 2019. US consumer confidence surged to near 18-year high,
while the jobless claims fell to the lowest level since 1969. The highest short-term risk to the global
economy is the potential for further escalation of the trade war, while the trade concerns somewhat eased
after the US, Canada, and Mexico struck a new The North American Free Trade Agreement (NAFTA) deal.
In addition to the trade war, the other short-term risks to the Euro area economy remain linked to the Brexit
and political uncertainty, especially after Italy’s government increased its deficit target for 2019. In 1-9 2018,
the inflation rate in the advanced economies was mostly supported by higher oil prices, while core inflation
has stayed relatively low, especially in the Euro area.
The Euro area economy in Q3 2018 expanded by 1.7% YoY, which is 0.7 p.p. lower annual growth than in
the Q1 of 2018, and 1.1 p.p. lower annual growth compared to the corresponding period a year ago.
Economic growth is mostly supported by the growth in private consumption and investment, but lagged
behind expectations. The ECB in their September 2018 macroeconomic projections, slightly lowered the
annual GDP growth for 2018 and 2019 to 2.0% and 1.8%, respectively, compared to June 2018 projections.
Despite the lower than expected real GDP growth in Q3 2018, the labor market continued to strengthen. In
September 2018, the unemployment rate fell to the lowest level since November 2008, and stood at 8.1%.
At the end of the Q3 2018, the annual inflation rate stood at 2.1%, which is one of the highest values in the
last five years. The higher inflation was mostly driven by the higher prices of fuels and energy, while annual
core inflation stayed relatively low at 0.9%. In the September 2018, the ECB predicted the annual
Harmonised Index of Consumer Prices (HICP) inflation at 1.7% in 2018, 2019, and 2020, which is
unchanged from the June 2018 Eurosystem macroeconomic projections. In September 2018, the leading
indicator PMI (composite) expanded for the sixty-third months in a row and stood at 54.1. The divergence
between manufacturing and service PMI continued to increase. The manufacturing sector recorded its
slowest rise since May 2016, while the service sector expanded to a three-month high. From October 2018
onwards, the ECB will reduce the monthly pace of net asset purchases to EUR 15 billion until the end of
2018, and then end net purchases. All key interest rates will probably remain unchanged at their current
levels at least through the summer of 2019.
Slovenia’s economy expanded by 4.2% YoY in the H1 2018, while in the Q2 2018 increased by 3.8% YoY,
which is the weakest growth rate since the Q4 2016. In the Autumn Forecast IMAD downgraded projected
growth for Slovenia by 0.7 p.p. to 4.4% for 2018. A continuation of favorable economic trends is also
expected for 2019 and 2020, i.e. 3.7% and 3.4%, respectively. Favorable economic conditions continued to
have a positive impact on the labor market, the number of registered unemployed persons at the end of
September 2018 fell below 74 thousand to the lowest value since the end of 2008. The IMAD projects that
they registered, and the survey unemployment rate will continue to fall in the coming years to 7.2% and
4.4%, respectively, in 2020. The economic sentiment indicator in 1-9 2018 fell notably, but still stood above

10 NLB Group Interim Report Q3 2018
the long-term average. In September 2018 the economic sentiment indicator amounted to 8.1, which is half
the value recorded at the beginning of 2018, and which was one of the highest value since the indicator
was first measured in 1996. After the all-time high in January 2018, the consumer confidence indicator fell
by 11 p.p. to -9 by the end of September 2018, but still stayed 11 p.p. above long-term average (2005-
2017). In the Q2 2018, the house prices were on average 13.4% higher at the annual level, while on
quarterly level went up by 4.2%, which is the highest quarterly growth after 2007. A lively real estate market
continued in Q2 2018, although the number of transactions was the lowest since Q3 2015. Industrial
production and construction output continued with growth in Q3 2018. In 1-9 2018 industrial production was
6.2% YoY, while compared to the annual average of 2015 it increased by 22.0%. Also, growth in real
construction output strengthened notably in 1-9 2018. Average annual growth came at 21.8%, but real
construction output is still lagging behind the pre-crisis level (1-9 2007) by more than 43%, according to the
SURS (Statistical Office of the Republic of Slovenia).
At the end of August 2018, Slovenia’s banking system's balance sheet grew by 3.3% YoY to EUR 38.5
billion, and recorded a pre-tax profit of EUR 406.6 million in 1-8 2018. Pre-tax profit increased by 19.7%
YoY, and corresponded to a ROE of 12.95%. Loans to the non-banking sector increased by 6.7% YoY. In
addition, loans to non-financial corporations increased by 2.8%, while loans to households grew by 6.9%
YoY. Deposits by the non-banking sector amounted to EUR 28,370 million, which is 5.8% YoY. Deposits by
non-financial corporations and households grew by 9.2% and 6.7% YoY, respectively. LTD stood at 77.6%,
down from 78.2% at the end of 2017. NPEs in August 2018 have further declined to 4.6%, compared to
6.0% at the end of 2017.

11 NLB Group Interim Report Q3 2018
Business Report

Unaudited Annual Financial Statements 2017
Key developments of NLB Group:
EUR 158.3 million
Profit after tax
In the nine months of 2018 the Group realised
profit after tax in the amount of EUR 158.3
million, a decrease of 14% YoY, mostly due to
the lower release of credit impairments and
provisions and higher income tax (income tax in
2017 includes a positive impact from non-
recurring event due to the utilisation of
previously tax non-deductible expenses from
impairments of a subsidiary that was divested in
the year 2017).
42%
Strategic foreign markets continued to perform
well and contributed 42% to the Group result.
4%
Fee and commission income increase
The Total Net operating income amounted EUR
369.0 million, an increase of 1% YoY (EUR
365.3 million) based on higher net interest
income (1% YoY), and fee and commission
income (4% YoY).
57.0%
CIR stood 57.0% and normalised CIR* at 58.7%,
which is 0.1 p.p. or 0.3 p.p. higher YoY,
respectively.
* Without non-recurring revenues and
restructuring costs.
1%
Recurring profit before impairments and
provisions amounted to EUR 147.4 million, an
increase of 1% YoY (EUR 0.8 million).
7%
Continued loan growth in Strategic foreign
markets (7% YtD) and in retail loan balances in
Slovenia (4% YtD).
16.9%
Total capital ratio
At the end of Q3 2018, the capital ratios (CET 1
and total capital ratio) of the Group remained
very strong, reaching 16.9% (after dividend pay-
out, but including the 1H 2018 result), and were
well above regulatory thresholds.
5.3%
NPE
Further improvement of the loan portfolio quality
was also shown in the additional reduction of
NPLs in Q3 2018. The NPL ratio thus decreased
to 7.6%, while the NPE ratio fell to 5.3%.

13 NLB Group Interim Report Q3 2018
Financial performance of NLB Group
Table 2: Income statement of NLB Group
Profit
In the nine months of 2018, the Group generated EUR 158.3 million of profit after tax, EUR 25.7 million or 14%
less YoY, mostly due to a reduction in the release of credit impairments and provisions compared to the nine
months of 2017. That is, in Q1 2017 EUR 21 million of pool provisions were released with a strong, positive effect
on profit in the nine months of 2017.
in EUR million 1-9 2018 1-9 2017
Change
YoY Q3 18 Q2 18 Q3 17
Change
QoQ
Net interest income 231.9 228.7 1% 80.2 76.7 80.1 5%
Net fee and commission income 120.0 115.2 4% 40.4 40.2 39.5 0%
Dividend income 0.1 0.2 -29% 0.0 0.1 0.0 -86%
Net income from financial transactions 11.7 22.5 -48% 5.0 3.9 5.3 27%
Net other income 5.4 -1.3 - 0.3 -8.2 -0.7 -
Net non-interest income 137.1 136.6 0% 45.7 36.0 44.1 27%
Total net operating income 369.0 365.3 1% 125.9 112.7 124.2 12%
Employee costs -122.0 -120.6 1% -41.1 -40.6 -40.1 1%
Other general and administrative expenses -67.9 -66.5 2% -22.5 -23.1 -21.6 -3%
Depreciation and amortisation -20.5 -20.8 -2% -6.9 -6.8 -7.0 0%
Total costs -210.4 -207.8 1% -70.4 -70.6 -68.8 0%
Result before impairments and provisions 158.6 157.4 1% 55.5 42.1 55.4 32%
Impairments and provisions for credit risk 23.2 36.9 -37% 7.6 12.3 8.9 -38%
Other impairments and provisions -4.2 0.4 - -3.0 -0.7 2.7 316%
Impairments and provisions 19.0 37.3 -49% 4.6 11.6 11.7 -60%
Gains less losses from capital investments in
subsidiaries, associates, and joint ventures4.1 3.7 10% 1.6 1.4 1.0 15%
Profit before income tax 181.7 198.4 -8% 61.7 55.0 68.1 12%
Income tax -16.6 -7.2 132% -6.0 -6.3 0.9 -5%
Result of non-controlling interests 6.7 7.3 -8% 2.2 1.5 2.9 42%
Profit for the period 158.3 184.0 -14% 53.5 47.2 66.1 13%
NLB Group

14 NLB Group Interim Report Q3 2018
Figure 1: Profit after tax of NLB Group – evolution YoY (in EUR million)
,
The Group’s result in the nine months of 2018 is based on the following key drivers and YoY evolution:
• Non-recurring income from the sale of the subsidiary NLB Nov penziski fond, Skopje in the positive amount of
EUR 12.2 million;
• Negative non-recurring effect from the sale of 28.13% minority stake in Skupna pokojninska družba in the
amount of EUR 0.5 million;
• Higher net interest income on the Group level (EUR 3.2 million, or 1%); mainly due to the decrease of interest
expenses;
• Higher net fee and commission income by EUR 4.8 million, or 4%; strong growth was realised in the Retail
segment in Slovenia (5%) and in Strategic foreign markets (5%);
• Lower regular net other income due to lower income from services provided by the Bank to other clients (EUR
1.9 million), expenses related to the correction of errors to prevent the cashing the guarantees (EUR 1.2
million), EUR 0.6 million negative effect related to enforceable court decisions in connection with litigation
started by Croatian bank regarding transferred old foreign currency deposits, deposited with Ljubljanska banka
Zagreb Branch before dissolution of the former Socialist Federal Republic of Yugoslavia (SFRY), and lower
received bonuses from insurance companies (EUR 0.6 million);
• A reduction in the release of impairments and provisions by EUR 18.3 million, or 49% due to the release of
pool provisions in Q1 2017;
• Higher income tax (EUR 9.5 million), due to 2017 positive impact from non-recurring event related to the
utilisation of previously tax non-deductible expenses from impairments of a subsidiary that was divested in the
year 2017.
184.0
3.2 4.8
-4.2 -2.5
-18.3 0.4-9.5 0.6
158.3
1-9 2017 Net interestincome
Fees &Commissions
Other Net non-interest income
Total costs Netimpairments
and provisions
Gains andlosses*
Income tax Result of non-controllinginterests
1-9 2018
15.9%11.9%
ROE a.t.
* Gains less losses from capital investments in subsidiaries, associates, and joint ventures.

15 NLB Group Interim Report Q3 2018
Figure 2: Profit before impairments and provisions of NLB Group – evolution YoY (in EUR million)
Profit before impairments and provisions (including non-recurring items1) was EUR 158.6 million, EUR 1.2 million
or 1% higher YoY. The increase in costs and lower other net non-interest income was partially offset by an
increase in net interest income and net fees and commissions.
Notes:
1 Non-recurring items in nine months of 2017: positive effects from non-core equity participation (EUR 9.5 million), a court settlement with Zavarovalnica Triglav (EUR
1.2 million), sale of noncore subsidiary NLB Factoring Brno a.s. “v likvidaci” (2.5 million) and the negative effect of restructuring costs (EUR 1.4 million). Non-recurring items in nine months of 2018: the positive effect from the sale of core subsidiary NLB Nov penziski fond, Skopje (EUR 12.2 million), the negative effect from the sale of 28.13% minority stake of core subsidiary Skupna pokojninska družba (EUR 0.5 million) and the negative effect of restructuring costs (EUR 0.5 million).
158.6157.4
-10.8 11.2 0.3-3.5
3.2 4.8
-3.9 0.0
1-9 2017 Non-recurringeffects 2017
Non-recurringeffects 2018
Net profit fromfinancial
transaction
Total costs Net interestincome
Fees andcommissions
Other regularnet income
Dividendsreceived
1-9 2018
Net effects from recurring eventsNet effects from non-recurring events
EUR 0.4 million EUR 0.8 million

16 NLB Group Interim Report Q3 2018
Figure 3: Profit before tax of NLB Group by segments (in EUR million)
In nine months of 2018, the Corporate segment recorded an increase in profit before tax of 40%, mostly due to
higher net interest income (EUR 2.6 million), higher net income from financial transactions (EUR 2.6 million), and
an increase in the release of impairments and provisions in Restructuring and Workout (EUR 2.3 million). The
profit before tax of Key/Mid/Small corporates was higher by EUR 1.8 million or 7% YoY, mostly due to higher
release of impairments and provisions (EUR 5.2 million), but was offset with lower operating income (EUR 1.7
million) and higher costs (EUR 1.6 million). In the nine months of 2018, the Retail banking in Slovenia realised
profit after tax in the amount of EUR 29.4 million, a decrease of 10% YoY, mostly due to higher costs and credit
impairments and provisions compaired to the nine months of 2017. The segment includes the negative non-
recurring effect from the sale of a 28.13% minority stake in Skupna pokojninska družba in the amount of EUR 0.5
million. An important drop in profit was also recorded on Non-core markets and activities, due to one-offs in the
nine months of 20172. The Strategic foreign market segment includes the positive effect from non-recurring income
from the sale of the subsidiary NLB Nov penziski fond, Skopje in the amount of EUR 12.2 million. All Group
subsidiary banks in the South-Eastern European market generated a profit, contributing EUR 76.2 million (42%)3
Notes:
2 Non-recurring items in nine months of 2017: the positive effects from non-core equity participation (EUR 9.5 million), a court settlement with Zavarovalnica Triglav
(EUR 1.2 million), and the negative effect from the sale of noncore subsidiary NLB Factoring Brno a.s. “v likvidaci” (2.5 million). 3 On NLB Banka, Skopje, the positive effect from non-recurring income from the sale of the subsidiary NLB Nov penziski fond, Skopje in the amount of EUR 8.5 million
is excluded.
26.4
32.5
88.3
19.8
30.7
-1.7
28.3 29.4
83.7
22.7
8.8
-3.3
Corporatebanking
in Slovenia
Retail bankingin Slovenia
Strategic foreignmarkets
Financial marketsin Slovenia
Non-core marketsand activities
Otheractivities
1-9 2017
1-9 2018
Key business activities
z
2.5
12.1
Restructuring and workout
key / mid / small
1-9 2017: 147.2 1-9 2018: 141.3

17 NLB Group Interim Report Q3 2018
to the Group profit before tax in nine months of 2018 (nine months of 2017: EUR 89.9 million, 45%), lower by EUR
13.7 million mostly due to a reduction in the release of credit impairments and provisions in 2018.
Net interest income
Figure 4: Net interest income of NLB Group (in EUR million)
Net interest income increased by EUR 3.2 million, or 1% in the nine months 2018 compared to the same period of
last year and totaled EUR 231.9 million, which was supported by higher net interest income in all segments except
in Non-core markets and activities (EUR 5.1 million, or a 41% lower) and in the reduction of the interest expenses
of the Bank, attributed in large part to the maturity of the Bank’s bond in July 2017 (bond in the amount of EUR
300 million issued in July 2014).
Figure 5: Net interest margin of NLB Group (in %)

18 NLB Group Interim Report Q3 2018
Net interest margin of the Group increased slightly by 0.02 p.p. to 2.53% in Q3 2018.
Figure 6: Net interest income of NLB Group by segments (in EUR million)
Net interest income of Key business activities in nine months of 2018 increased by EUR 4.3 million, or 2% YoY:
• Net interest income in Key/Mid/Small corporates in Slovenia decreased by EUR 1.1 million, or 4%, mainly due
to lower loan volume in the Key corporate clients segment;
• Net interest income in Retail banking in Slovenia increased by EUR 3.0 million, or 6% as a result of the
increase in loans volume and rising active interest rates on new production;
• In Strategic foreign markets net interest income improved by EUR 2.4 million, or 2%, due to YoY increase of
gross loans volume for 10%, or EUR 260.2 million;
• Net interest income in Financial markets in Slovenia increased by EUR 1.3 million, or 6%, due to the lower
costs of refinancing;
• Lower contributions in net interest income was evident in Non-core markets and activities as a result of the
reduction of operations according to the Restructuring plan.
27.4
53.8
108.2
24.0
12.6
-0.2
26.3
56.8
110.6
25.3
7.5
-0.1
Corporatebanking
in Slovenia
Retail bankingin Slovenia
Strategic foreignmarkets
Financial marketsin Slovenia
Non-coremarkets
and activities
Otheractivities
1-9 2017
1-9 2018
Key business activities
2.9
5.5
Restructuring and workout
key / mid / small
1-9 2017: 189.4 1-9 2018: 193.7
z
19 NLB Group Interim Report Q3 2018
Net non-interest income
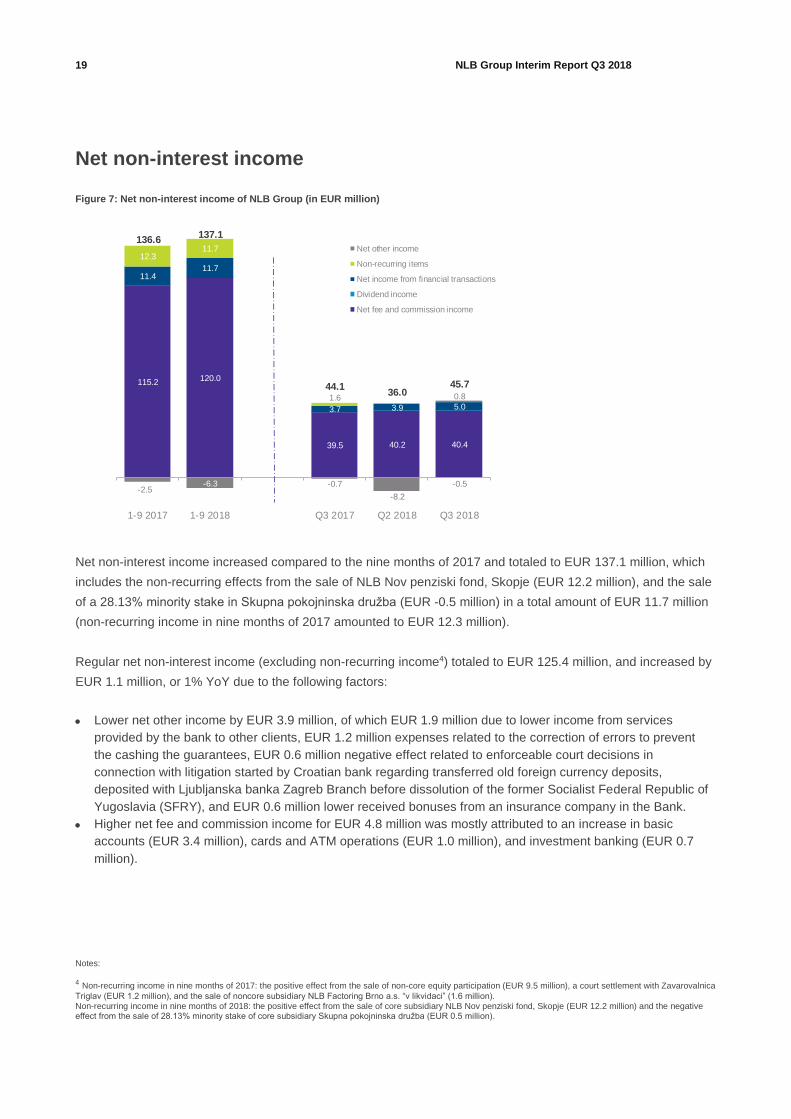
Figure 7: Net non-interest income of NLB Group (in EUR million)
Net non-interest income increased compared to the nine months of 2017 and totaled to EUR 137.1 million, which
includes the non-recurring effects from the sale of NLB Nov penziski fond, Skopje (EUR 12.2 million), and the sale
of a 28.13% minority stake in Skupna pokojninska družba (EUR -0.5 million) in a total amount of EUR 11.7 million
(non-recurring income in nine months of 2017 amounted to EUR 12.3 million).
Regular net non-interest income (excluding non-recurring income4) totaled to EUR 125.4 million, and increased by
EUR 1.1 million, or 1% YoY due to the following factors:
• Lower net other income by EUR 3.9 million, of which EUR 1.9 million due to lower income from services
provided by the bank to other clients, EUR 1.2 million expenses related to the correction of errors to prevent
the cashing the guarantees, EUR 0.6 million negative effect related to enforceable court decisions in
connection with litigation started by Croatian bank regarding transferred old foreign currency deposits,
deposited with Ljubljanska banka Zagreb Branch before dissolution of the former Socialist Federal Republic of
Yugoslavia (SFRY), and EUR 0.6 million lower received bonuses from an insurance company in the Bank.
• Higher net fee and commission income for EUR 4.8 million was mostly attributed to an increase in basic
accounts (EUR 3.4 million), cards and ATM operations (EUR 1.0 million), and investment banking (EUR 0.7
million).
Notes:
4 Non-recurring income in nine months of 2017: the positive effect from the sale of non-core equity participation (EUR 9.5 million), a court settlement with Zavarovalnica
Triglav (EUR 1.2 million), and the sale of noncore subsidiary NLB Factoring Brno a.s. “v likvidaci” (1.6 million). Non-recurring income in nine months of 2018: the positive effect from the sale of core subsidiary NLB Nov penziski fond, Skopje (EUR 12.2 million) and the negative effect from the sale of 28.13% minority stake of core subsidiary Skupna pokojninska družba (EUR 0.5 million).
115.2 120.0
39.5 40.2 40.4
11.411.7
3.7 3.9 5.0
12.311.7
1.6
-0.5-2.5
-6.3 -0.7
-8.2
0.8
136.6137.1
44.136.0
45.7
1-9 2017 1-9 2018 Q3 2017 Q2 2018 Q3 2018
Net other income
Non-recurring items
Net income from financial transactions
Dividend income
Net fee and commission income

20 NLB Group Interim Report Q3 2018
Table 3: Net fees and commission income of NLB Group by type of transaction (in EUR million)
Figure 8: Net non-interest income by segments of NLB Group (in EUR million)
Net non-interest income of Key business activities increased by EUR 14.9 million, or 14% YoY, almost exclusively
due to the contribution of the Strategic foreign markets:
• Strategic foreign markets net non-interest income increased substantially by EUR 16.5 million, or 49% YoY, of
which EUR 12.2 million represents non-recurring income from the sale of the NLB Nov penziski fond, Skopje;
• Corporate banking in Slovenia realised EUR 24.7 million of net non-interest income, of which EUR 21.9 million
were net fees and commission income;
• Retail banking in Slovenia recorded a decrease in net non-interest income of EUR 0.7 million (1%) with an
increase of net fees and commission (5%) mainly related to basic accounts (a new package offer for
in EUR million Q3 18 Q2 18 Q3 17
Net fees and commissions 120.0 115.2 4.8 4% 40.4 40.2 39.5
Payment transactions 37.2 37.9 -0.8 -2% 12.3 12.8 12.7
Cards and ATM operations 18.1 17.1 1.0 6% 5.9 6.0 6.3
Basic accounts 35.4 32.0 3.4 11% 12.4 11.9 11.0
Guarantees 7.9 8.1 -0.3 -3% 2.7 2.6 2.7
Investment banking 3.7 3.0 0.7 23% 0.9 1.1 1.1
Investment funds 12.4 12.6 -0.2 -2% 4.2 3.9 4.3
Bancassurance 3.5 3.1 0.4 13% 1.4 1.1 1.0
Other 1.9 1.4 0.5 39% 0.7 0.9 0.4
1-9 2017
NLB Group
1-9 2018Change
YoY
Quarters
21.4
50.1
33.8
5.1
21.4
5.3
20.7
49.4 50.3
6.6 5.9
1.6
Corporatebanking
in Slovenia
Retail bankingin Slovenia
Strategic foreignmarkets
Financial marketsin Slovenia
Non-coremarkets
and activities
Otheractivities
1-9 2017
1-9 2018
Key business activities
1.43.9
Restructuring andworkout
key / mid / small
1-9 2017: 105.3 1-9 2018: 120.4

21 NLB Group Interim Report Q3 2018
individuals) and card operation business (due to the new currency exchange fee for card operations introduced
at the beginning of 2018), and the negative effect from the sale of a 28.13% minority stake in Skupna
pokojninska družba (EUR -0.5 million);
• Financial markets in Slovenia recorded an increase in net non-interest income by EUR 1.4 million, due to lower
expenses for Single resolution fund (SRF) (EUR 1.3 million) and increased fees related to issuance of the
Republic Slovenia bond.
• Non-core markets and activities contribution to the Group’s net non-interest income was significantly lower
compared to nine months of 2017 (EUR 15.5 million less), mainly due to the non-recurring events in nine
months of 2017 (EUR 12.3 million; refer to note 4) which had positive impact on the result.
Total costs
Figure 9: Total costs of NLB Group (in EUR million)
Total costs amounted to EUR 210.4 million (of which EUR 0.5 million were costs of restructuring), and are thus by
EUR 2.5 million, or 1% higher YoY. A major increase was recorded in costs related to accelerated
marketing/promotion and business consulting, but was offset by the decrease of the restructuring costs (EUR 1.0
million, or 64%).
CIR increased by 0.1 p.p. to 57.0%, while CIR normalised5 increased by 0.3 p.p. to 58.7%.
Notes:
5 Non-recurring items from note 1 are excluded.
120.6 122.0
40.1 40.6 41.1
66.5 67.9
21.6 23.1 22.5
20.820.5
7.0 6.8 6.9
207.8210.4
68.8 70.6 70.4
1-9 2017 1-9 2018 Q3 2017 Q2 2018 Q3 2018
Depreciation and amortisation
Other general administrative expenses
Employee costs
CIR: 56.9% 57.0%

22 NLB Group Interim Report Q3 2018
Net impairments and provisions for credit risk
Figure 10: NLB Group impairments and provisions for credit risk and cost of risk (in bps)
In the nine months of 2018 impairments and provisions for credit risk of the Group were net released in the amount
of EUR 23.2 million (EUR 13.7 million lower YoY) as a result of a successful restructuring of some major
exposures and the recovery of non-performing loans. The release in nine months of 2017 was to a large extent
affected by the release of pool provisions in the approx. amount of EUR 21 million in that period, mainly in the
Corporate client segment. Consequently, the cost of risk increased from -70 bps to -45 bps.

23 NLB Group Interim Report Q3 2018
Financial position of NLB Group6
Table 4: Statement of the financial position of NLB Group
Total assets increased by EUR 546.0 million in the nine months 2018 YtD, and totaled EUR 12,783.7 million,
mainly driven by the continued inflows of deposits from individuals.
At the end of Q3 2018, the total gross loans to the non-banking sector amounted to EUR 7,618.7 million, and were
on the same level as at the end of 2017 (EUR 22.5 million lower YtD).
The share of customers’ deposits continued to increase and accounted for 94% of the total funding of the Group at
the end of Q3 2018. The YtD increase derives from deposits from individuals (EUR 293.7 million, or 4%) and
corporate deposits (EUR 49.9 million, or 2%).
Notes:
6 On 1 January 2018, the IFRS 9 was implemented, therefore the data from 1 January 2018 onwards are not totally comparable with previous years.
in EUR million 30 Sept 2018 31 Dec 2017 30 Sept 2017
Change
YoY
Change
YtD
ASSETSCash, cash balances at central banks, and other demand
deposits at banks1,557.4 1,256.5 1,094.2 42% 24%
Loans to banks 402.0 510.1 483.0 -17% -21%
Loans to customers 7,080.9 6,994.5 6,989.1 1% 1%
Gross loans 7,618.7 7,641.2 7,787.8 -2% 0%
- Corporate 3,561.5 3,705.0 3,834.5 -7% -4%
- Individuals 3,663.5 3,470.2 3,408.8 7% 6%
- State 393.8 466.0 544.5 -28% -16%
Impairments and deviations from fair value -537.8 -646.8 -798.7 -33% -17%
Financial assets (securities) 3,276.7 2,963.4 2,911.2 13% 11%
- Trading 45.2 72.2 110.2 -59% -37%
- Non-trading 3,231.4 2,891.2 2,801.1 15% 12%
Investments in subsidiaries, associates, and joint ventures 37.8 43.8 42.5 -11% -14%
Property and equipment, investment property 234.0 240.2 271.0 -14% -3%
Intangible assets 31.1 35.0 35.1 -12% -11%
Other assets 163.9 194.4 181.7 -10% -16%
Total assets 12,783.7 12,237.7 12,007.9 6% 4%
LIABILITIESDeposits from customers 10,246.7 9,879.0 9,672.2 6% 4%
- Corporate 2,310.0 2,260.1 2,191.7 5% 2%
- Individuals 7,656.7 7,362.9 7,123.1 7% 4%
- State 280.0 256.0 357.3 -22% 9%
Deposits from banks and central banks 43.3 40.6 48.8 -11% 7%
Debt securities in issue 0.0 0.0 0.0 - -
Borrowings 329.6 353.9 370.4 -11% -7%
Other liabilities 264.3 248.7 244.4 8% 6%
Subordinated liabilities 15.3 27.4 27.5 -44% -44%
Equity 1,844.5 1,653.6 1,610.9 15% 12%
Non-controlling interests 40.1 34.6 33.7 19% 16%
TOTAL LIABILITIES AND EQUITY 12,783.7 12,237.7 12,007.9 6% 4%
NLB Group

24 NLB Group Interim Report Q3 2018
At the end of Q3 2018, the LTD ratio (net) was 69.1% on the Group level; a decrease of 1.7 p.p. YtD as a result of
the growing, but still a moderate demand for loans and increased deposits.
Figure 11: Total assets by country (in %)7
Figure 12: Gross loans to customers by core segment (in EUR million)
Key business activities recorded a 2% increase of gross loans to customers YtD to EUR 6,925.5 million. YtD
increases of gross loans to customers were recorded in Strategic foreign markets (EUR 190.9 million), and in the
Retail segment in Slovenia (EUR 89.5 million). The significant decrease was recorded in the Key/mid/small
corporate segment (EUR 151.4 million YtD) because of the higher amount of matured loans, prepayment of some
larger exposures, and transfer of some assets to restructuring segment.
Notes:
7 Geographical analysis based on location of Group member’s headquarter.
197.9 175.1 220.9
2,089.3
2,013.51,862.0
2,092.9 2,122.5 2,211.9
2,591.3 2,660.6 2,851.5
241.2 221.1 112.4
30 Sept 2017 31 Dec 2017 30 Sept 2018
Financial markets in Slovenia Strategic foreign markets
Retail banking in Slovenia Key/mid/small corporate
Restructuring and workout
6,773.4
1.9% YtD
Key business activities in loan
book 6,796.6 6,925.5
2.2% YoY

25 NLB Group Interim Report Q3 2018
Figure 13: Deposits from customers by core segment (in EUR million)
Deposits from customers in Key business activities increased by 8% YoY. On the YtD basis, a slight increase of
deposits was recorded in the Key/mid/small corporate segment in Slovenia (EUR 35.0 million), while Strategic
foreign markets and Retail banking in Slovenia recorded a substantial increase in deposits (EUR 190.2 million and
EUR 194.5 million, respectively).
30.3 26.7 27.1
226.0 172.4 120.4
1,029.8 1,054.2 1,089.2
2,957.9 3,078.3 3,268.5
5,391.55,537.1
5,731.6
30 Sept 2017 31 Dec 2017 30 Sept 2018
Retail banking in Slovenia Strategic foreign markets
Key/mid/small corporate Financial markets in Slovenia
Restructuring and workout
9,669.7 10,089.3
9,379.2 7.6% YoY
4.3% YtD
Key business activities inDeposits

26 NLB Group Interim Report Q3 2018
Segment analysis
The Group monitors clients' operations in various segments that are defined in accordance with the Bank’s long-
term strategy and are divided into two major segments, i.e. Core and Non-core.
The Core markets and activities include:
• Retail banking in Slovenia, which includes banking with individuals and asset management, as well as the
results of the jointly-controlled company NLB Vita and the associated company Bankart;
• Corporate banking in Slovenia, which includes banking with large (key), medium-sized, micro, and small
companies. The results of operations with healthy companies (Sales), companies in restructuring, or defaulters
(Restructuring and workout) are monitored separately within the segment;
• Financial markets in Slovenia include treasury activities and trading in financial instruments, and also present
the results of asset and liabilities management (ALM). Investment banking as a part of Financial markets in
Slovenia that includes brokerage, custody of securities, as well as financial consulting, is represented as a
separate segment within Corporate banking in Slovenia;
• Strategic foreign markets, which include the operations of strategic Group companies on strategic markets
(Bosnia and Herzegovina, Montenegro, Kosovo, Macedonia, and Serbia).
Non-core markets and activities include the operations of non-core Group members and the non-core part of the
portfolio of the Bank.
Other activities (‘Other’) include the categories whose operating results cannot be allocated to individual segments
and include the costs of restructuring, and the expenses from vacant business premises.

27 NLB Group Interim Report Q3 2018
Retail banking in Slovenia
Financial highlights
• Net interest income was still under pressure given
the continued low interest rates environment;
nevertheless, it increased (6% YoY) due to growth
in retail loan portfolio and slow growth in interest
rates on new loans.
• Net non-interest income was burdened by the
negative effect from the sale of 28.13% minority
stake in Skupna pokojninska družba (EUR -0.5
million).
• Net fees and commission income increased by 5%
YoY mainly on basic accounts business due to a
new package offer for individuals and on card
operations.
• Higher costs and additional impairments and
provisions contributed to the lower profit before tax
by 10% YoY.
• Growth of 4% YtD (6% YoY) in loan balances and
growth of 4% YtD (6% YoY) in deposits volume.
Business highlights
• Mobile wallet NLB Pay also enables clients to pay
instalment payments, with their mobile phones.
• A package offer for individuals simplifies banking
services.
• Klikin continues to grow in the number of users and
in the scope of offered functionalities.
Table 5: Key financials of Retail banking in Slovenia
The Bank maintained a leading position, with a market share in retail lending of 23.3% (2017: 23.4%) and 30.4%
(2017: 30.7%) in deposit-taking.
in EUR million
consolidated
1-9 2018 1-9 2017 Q3 2018 Q2 2018 Q3 2017Change
QoQ
Net interest income 56.8 53.8 3.0 6% 20.2 18.4 18.7 10%
Net non-interest income 49.4 50.1 -0.7 -1% 18.4 12.7 18.5 45%
Total net operating income 106.2 103.9 2.2 2% 38.6 31.1 37.2 24%
Total costs -77.9 -73.9 -4.0 -5% -26.7 -25.7 -24.5 4%
Result before impairments and provisions 28.3 30.0 -1.7 -6% 11.9 5.4 12.7 120%
o/w non-recurring items -0.5 -0.5 #DIV/0! -0.5
Impairments and provisions -3.0 -1.2 -1.8 -148% -0.8 -1.0 -1.1 -19%
Net gains from investments in subsidiaries,
associates, and JVs'4.1 3.7 0.4 10% 1.6 1.4 1.0 15%
Result before tax 29.4 32.5 -3.2 -10% 12.7 5.8 12.6 119%
30 Sept 2018 31 Dec 2017 30 Sept 2017
Net loans to customers 2,184.8 2,083.9 2,053.7 100.9 5% 131.1 6%
Gross loans to customers 2,211.9 2,122.5 2,092.9 89.5 4% 119.0 6%
Housing loans 1,370.7 1,324.6 1,312.9 46.1 3% 57.9 4%
Consumer loans 578.7 525.0 511.6 53.7 10% 67.0 13%
Other 262.5 272.9 268.4 -10.4 -4% -5.9 -2%
Deposits from customers 5,731.6 5,537.1 5,391.5 194.5 4% 340.1 6%
Change YoYChange YtD
Retail banking in Slovenia
Change YoY

28 NLB Group Interim Report Q3 2018
The Bank’s mobile wallet NLB Pay app (launched in 2018) enables clients to pay with the NLB MasterCard and
Maestro cards contactless, simple, fast, and safe payments on contactless POS (in Slovenia and abroad). NLB
Pay also enables instalment payments. 5,506 users downloaded the app by the end of Q3 2018, and they carried
out over 80 thousand transactions in a total volume of more than EUR 1.6 million. NLB Pay will also be gradually
introduced by other Group banks. In September 2018 it was already introduced in the NLB Banka Skopje.
Figure 14: NLB Pay in numbers
The Bank was the first on the Slovenian market to offer contactless ATMs to clients. By the end of the Q3 2018
almost every second ATM was contactless. With the implementation of contactless functionality, the level of safety
increased as such ATMs are “immune” to skimming. Beside contactless cash withdrawals account balance can be
checked.
The Bank provides the clients the right solutions at the right time and place. One such solution is also providing
packages for individuals (offered to clients earlier in 2018). By 30 September 2018 every fifth Bank client already
had one of the packages. Various options and procedures enable clients to change the existing personal account
to package without visiting the branch office. To ease personal finance management NLB Klik was updated with a
counter of the remaining number of free services in the scope of the packages.
To enhance clients’ banking experiences, the Bank offered a complete housing solution complementing financing
with consultancy in the pre-sales stage and support in the after-sale stage of the housing loan. A portal “Ustvarjam
dom” (Creating home) was upgraded to give clients access to special offers for the purchase of furnishings via the
Bank’s partners. In order to meet the market demands, the financing of all types of turn-key houses was
introduced. To further improve the user experience the possibility of using the letter of credit account to draw the
loan was offered to the borrower.
The use of the mobile bank Klikin continues to grow; the total number of users increased to 160,866 (52,915 of
new users in 2018), and reached almost a quarter of all the Bank’s customers (a 10.2 p.p. increase YoY). Klikin

29 NLB Group Interim Report Q3 2018
holds the number one position in the Finance apps category, both in the Apple App Store and Google Play Store,
with ratings of 4.8 and 4.4, respectively (on 19 October 2018). Klikin is available in Slovenian and English, and
was ranked the best mobile bank on the Slovenian market in an independent market evalution in 2018
(mBančništvo v Sloveniji 2018, performed by E-laborat in 2018). Several Klikin upgrades were done in 2018,
including Face ID log-in option, chat and video call within the application, and also subscription for selected NLB
Vita insurance products.
The ‘Express Loan,’ which was implemented in Klikin at the end of 2017, was very well accepted by the Bank’s
clients. In 2018 57% of all Express Loans were already concluded via Klikin.
The NLB Skladi market share increased to 31.49% (30 September 2017: 29.05%). Ranked first in the amount of
net-inflows with EUR 53.55 million (30 September 2017: EUR 67.52 million), the company remained the largest
asset management company in Slovenia, and the largest mutual funds management company as well. Total
assets under management were EUR 1.286 billion (30 September 2017: EUR 1.157 billion) of which EUR 858.4
million consisted of mutual funds (30 September 2017: EUR 760.3 million) and EUR 428.0 million in the
discretionary potfolio (30 September 2017: EUR 396.9 million).
NLB Vita charged EUR 57.85 million in gross written premium YtD (a 9.3% increase YoY; 30 September 2017:
EUR 52.95 million), of which EUR 54.9 million was in life insurance (30 September 2017: EUR 50.4 million), with
an estimated balance sheet of EUR 466 million (a 4.9% increase YoY, 30 September 2017: EUR 444 million).
Market share of the insurance company, excluding pension companies stood at 14.8% (30 September 2017:
13.5%), which ranked NLB Vita third among classic life insurance products in Slovenia.
In September 2018, NLB also sold its 28.13% share in Skupna pokojninska družba to the insurance company
Zavarovalnica Triglav d.d.

30 NLB Group Interim Report Q3 2018
Corporate and Investment banking in Slovenia
Financial highlights
• The segment contributed EUR 40.4 million in profit
before tax in nine months of 2018, showing an
increase by EUR 11.5 million or 40% YoY, mainly
due to higher release of impairments and provisions
(EUR 7.6 million), mostly in Restructuring and
Workout.
• Net operating income increased EUR 3.4 million
YoY, mostly due to higher net interest income and
higher net income from financial transactions due to
the effects of the valuation of loans at fair value in
Restructuring and Workout.
• Costs remained stable YoY.
• A decrease in gross loans due to the size of
matured loans in Key enterprises and prepayment
of some larger exposures, while Small enterprises
continued to grow (10% YtD).
Business highlights
• Mobile wallet NLB Pay was also implemented for
NLB business cards Maestro and MasterCard.
• Klikpro was upgraded with quick financing, video
call, and chat funtionallities.
• Successful organization of the syndicated loan
facilities to (re)finance Hidria Group, Kovintrade,
and Interblock Group’s companies.
• A Group-wide payment offer was launched for
clients of the Group.
• New package offer for companies was introduced.
• The Bank participates in the project “Štartaj
Slovenija” (Start it up Slovenia).
Table 6: Key financials of Corporate banking of Slovenia
The Bank has an 18.6% market share in corporate loans (2017: 20.8%), and 25.7%8 in trade finance (2017:
25.6%).
Notes:
8 Data per 31 August 2018.
in EUR million
consolidated
1-9 2018 1-9 2017 Q3 2018 Q2 2018 Q3 2017Change
QoQ
Net interest income 31.8 30.3 1.5 5% 11.6 10.6 20.3 10%
Net non-interest income 24.7 22.8 1.9 8% 8.8 7.5 14.7 18%
Total net operating income 56.5 53.1 3.4 6% 20.5 18.1 35.0 13%
Total costs -31.9 -32.4 0.5 1% -10.5 -10.9 -22.0 -4%
Result before impairments and provisions 24.6 20.7 3.9 19% 10.0 7.2 13.1 39%
Impairments and provisions 15.8 8.2 7.6 93% 5.8 11.1 4.0 -47%
Result before tax 40.4 28.9 11.5 40% 15.8 18.2 17.0 -13%
30 Sept 2018 31 Dec 2017 30 Sept 2017
Net loans to customers 1,959.7 2,026.3 2,106.0 -66.6 -3% -146.4 -7%
Gross loans to customers 2,082.9 2,188.6 2,287.2 -105.7 -5% -204.3 -9%
- corporate 1,869.1 1,939.3 1,985.7 -70.2 -4% -116.6 -6%
-o/w Restructuring and Workout 214.5 168.6 189.7 45.9 27% 24.8 13%
-o/w Key/Mid/Small Corporate 1,654.6 1,770.7 1,796.0 -116.1 -7% -141.4 -8%
- state 213.3 248.7 301.0 -35.4 -14% -87.7 -29%
Deposits from customers 1,116.3 1,080.9 1,060.1 35.4 3% 56.2 5%
Corporate banking in Slovenia
Change YoY
Change YtD Change YoY

31 NLB Group Interim Report Q3 2018
The Bank’s mobile wallet NLB Pay app (launched in 2018) enables clients to pay with the NLB Business
MasterCard and NLB Business Maestro cards contactless, simple, fast, and safe payments on contactless POS (in
Slovenia and abroad). NLB Pay also enables instalment payments.
In the mobile bank Klikpro, which besides Face ID login and the possibility of video call and chat, the Bank is the
first bank in Slovenia implementing 24/7 availability of financing with Express loan and Express overdraft in an
amount of up to EUR 15,000. The approval process is completed within minutes. By 30 September 2018 the
number of Klikpro users increased 78% YoY to 16,252 with 37.9% of all corporate clients using Klikpro.
A new package offers for legal entities – NLB Business Start Basic, NLB Business Start Mobile, NLB Business
Start Advanced, NLB Business Package Basic, and NLB Business Package Comprehensive – combine the most
common every day banking products, and are tailored to different client segments’ needs.
The Bank is not only well acquainted with the business environement, it is also aware that first steps in the
entrepreneurial world are the toughest, therefore the Bank again participates in the project “Štartaj Slovenija” (Start
it up Slovenia). For all new entrepreneurs and those who are still thinking about it, a content was included on the
Bank’s web page focusing on various aspects of entrepreneurship.
The Bank is committed to the Western Balkans and is striving to become the regional champion. This was also
proved by the NLB Business Forum organised by the Bank, which connected customers (existing and potential),
and the Group banks from the region to contribute to potential opportunities for Slovenian companies to explore
potentials for growth and investment in infrastructure projects.
To cater to the Bank’s clients operating in the region, all banking members of the Group jointly launched the Group
payment offer for outgoing and incoming international payments of customers legal entities operating in the
Group’s markets.
Table 7: Key financials of Investment banking and custody services of Slovenia
Investment banking and custody services revenues increased YoY; fewer concluded interest rate hedge deals with
clients were more than successfully compensated, with 43% growth in corporate finances, 26% growth of
brokerage fees, and a 10% growth of custody fees.
At the end of Q3 2018, the total asset value under custody exceeded EUR 15.8 billion, a 5.18% increase YoY.
The Bank is unique on the Slovenian financial market in offering a broad spectrum of options to raise funds for its
clients. A continuous track record of providing support and adjusting to clients’ needs was enriched by the
arranging of the issue of bonds for the Titus in the amount EUR 12 million in February 2018 and bonds for the
in million EUR
consolidated
1-9 2018 1-9 2017 Q3 2018 Q2 2018 Q3 2017Change
QoQ
Net non-interest income 6.9 6.8 0.2 3% 2.5 2.1 2.7 20%
Total costs -4.4 -4.2 -0.2 -5% -1.5 -1.5 -1.4 1%
Result before tax 2.7 2.8 -0.2 -6% 1.1 0.7 1.4 66%
Change YoY
Investment banking

32 NLB Group Interim Report Q3 2018
GEN-I in the amount of EUR 20 million in June 2018. Additionally, the Bank led the organisation of large
syndicated loans for the Interblock Group companies in Slovenia and the USA in the amount USD 72 million and
EUR 30 million; for Kovintrade in the amount EUR 23 million, which were both closed in June 2018; and for the
Hidria Group in the amount EUR 127 million, which was closed in July 2018.

33 NLB Group Interim Report Q3 2018
Strategic foreign markets
Financial highlights
• Profit before tax amounted to EUR 83.7 million, and
includes non-recurring income from the sale of the
subsidiary NLB Nov penziski fond, Skopje in the
positive amount of EUR 12.2 million (effect on net
non-interest income). In contrast, in nine months of
2017 the profit was positively affected by the
release of impairments and provisions in the
amount of EUR 16.9 million (release of pool
provisions in Q1 2017).
• Despite the competitive market environment and
high pressure on interest rates, net interest income
increased by 2% YoY.
• Strong growth in net non-interest income, especially
in fees and commission income (5% YoY).
• The cost of risk remained low.
• Growth of 7% YtD (10% YoY) in loan balances and
growth of 6% YtD (10% YoY) in deposits volume.
Business highlights
• The subsidiary banks generated a net profit.
• 100% of the shares of NLB Nov penziski fond, Skopje were sold.
• The subsidiary banks received several awards.
Table 8: Key financials of Strategic foreign markets
in EUR million
consolidated
1-9 2018 1-9 2017 Q3 2018 Q2 2018 Q3 2017Change
QoQNet interest income 110.6 108.2 2.4 2% 38.6 36.4 37.9 6%
Net non-interest income 50.3 33.8 16.5 49% 13.1 12.7 10.8 3%
Total net operating income 160.9 142.0 18.9 13% 51.7 49.1 48.8 5%
Total costs -73.8 -70.6 -3.3 -5% -24.7 -25.0 -23.6 -1%
Result before impairments and provisions 87.0 71.4 15.6 22% 27.0 24.0 25.1 12%
o/w non-recurring items 12.2 - - - - - - -
Impairments and provisions -3.4 16.9 -20.2 - -1.9 -4.4 4.4 -
Result before tax 83.7 88.3 -4.6 -5% 25.1 19.6 29.5 28%
o/w Result of minority shareholders -6.7 -7.3 0.6 4% -2.2 -1.5 -2.9 -42%
30 Sept 2018 31 Dec 2017 30 Sept 2017
Net loans to customers 2,624.1 2,393.5 2,304.4 230.6 10% 319.7 14%
Gross loans to customers 2,851.5 2,660.6 2,591.3 190.9 7% 260.2 10%
Deposits from customers 3,268.5 3,078.3 2,957.9 190.2 6% 310.6 10%
Change YtD Change YoY
Change YoY
Strategic foreign markets

34 NLB Group Interim Report Q3 2018
Figure 15: Profit after tax of strategic NLB Group banks (on standalone basis) (in EUR million)
Despite a competitive market environment, all subsidiary banks generated a profit before impairments and tax, and
the net profit after tax in the first nine months of 2018.
Subsidiary banks together achieved the higher net interest income and net non-interest income than at the same
period previous year. Some of subsidiary banks additionally improved cost efficiency and cost control. Lending
activity in the segment of NBS was intensified, especially by NLB Banka Beograd and NLB Banka Prishtina.
An additional positive impact on the Group result and the result of NLB Banka, Skopje was the sale of NLB Nov
penziski fond, Skopje.
Subsidiaries remain committed to ensuring a locally anchored organic growth strategy, and boosting business
operations and service excellence by implementing Group-wide initiatives.
The subsidiary banks received several awards. In July, NLB Banka Skopje was named the best bank in
Macedonia for 2017 and received the Euromoney Award for Excellence 2018. In September, NLB Banka Banja
Luka received an award Gold BAM for the highest ROE and ROA among banks in BIH.

35 NLB Group Interim Report Q3 2018
Financial markets in Slovenia9
Financial highlights
• Profit before tax amounted to EUR 20.0 million, an
increase of 18% YoY.
• Higher net interest income due to lower costs of
refinancing.
• Negative, but higher net non-interest income due
to lower expenses for SRF (EUR 1.3 million) and
increased fees related to issuance of the Republic
Slovenia bond.
Business highlights
• The Bank acted as one of the joint lead managers
in the EUR 1.5 billion, a 10-year benchmark bond
issuance for the Republic of Slovenia.
Table 9: Key financials of Financial markets in Slovenia
Notes:
9 Investment banking as a part of Financial markets in Slovenia that includes brokerage, custody of securities, as well as financial consulting is represented as a
separate segment within Corporate and Investment banking in Slovenia.
in million EUR
consolidated
1-9 2018 1-9 2017 Q3 2018 Q2 2018 Q3 2017Change
QoQ
Net interest income 25.2 23.7 1.5 6% 7.6 9.0 14.1 -16%
Net non-interest income -0.4 -1.6 1.3 78% 0.2 -0.4 -2.8 149%
Total net operating income 24.8 22.0 2.8 13% 7.7 8.6 11.3 -10%
Total costs -4.9 -5.0 0.1 2% -1.6 -1.7 -3.5 -10%
Result before impairments and provisions 19.9 17.0 2.9 17% 6.2 6.9 7.8 -10%
Impairments and provisions 0.1 -0.1 0.2 - 0.1 -0.1 0.0 -
Result before tax 20.0 17.0 3.0 18% 6.3 6.8 7.8 -7%
30 Sept 2018 31 Dec 2017 30 Sept 2017
Gross loans to customers 112.3 221.1 241.1 -108.9 -49% -128.8 -53%
Borrowings 252.4 260.7 271.2 -8.3 -3% -18.8 -7%
Financial markets Slovenia
Change YtD Change YoY
Change YoY

36 NLB Group Interim Report Q3 2018
Non-core markets and activities
Financial highlights
• The Non-core result before tax was EUR 8.8
million – a significant drop YoY (71%) due to non-
recurring income impacting the result for the nine
months of 201710.
• The cost base was reduced by 15% YoY to EUR
13.8 million due to the continued divestment
process.
• Segment assets decreased by 21% YtD (30%
YoY).
Business highlights
• In Q3 2018 the Group continued with the controlled
wind-down of the remaining non-core segment,
including credit business with foreign clients,
operations of non-strategic Group members, the
Bank’s equity participations, as well as active
management of real-estate assets (contributing to
the reduction of the Group’s NPLs).
• In addition to the 2017 achievements, non-strategic
subsidiaries continued with the collections of
claims, leading to a further decrease of the Group’s
non-core assets.
Table 10: Key financials of Non-core markets and activities
Notes:
10 Please refer to note 4.
in EUR million
consolidated
1-9 2018 1-9 2017 Q3 2018 Q2 2018 Q3 2017Change
QoQNet interest income 7.5 12.6 -5.1 -41% 2.1 2.3 14.8 -6%
Net non-interest income 5.9 21.4 -15.5 -72% 1.7 1.6 3.5 3%
Total net operating income 13.4 34.0 -20.6 -61% 3.8 3.9 41.3 -2%
Total costs -13.8 -16.3 2.5 15% -4.4 -4.7 -8.8 5%
Result before impairments and provisions -0.4 17.7 -18.1 -103% -0.6 -0.8 32.5 21%
o/w non-recurring items - 10.7 - - - - 5.8 -
Impairments and provisions 9.3 13.0 -3.7 -29% 1.5 5.5 18.2 -73%
Result before tax 8.8 30.7 -21.8 -71% 0.9 4.8 51.9 -82%
30 Sept 2018 31 Dec 2017 30 Sept 2017
Segment assets 310.6 391.3 444.8 -80.7 -21% -134.1 -30%
Net loans to customers 200.0 269.9 283.8 -69.8 -26% -83.8 -30%
Gross loans to customers 360.0 448.5 575.2 -88.4 -20% -215.2 -37%
Investment Property and Property & Equipment
received for repayment of loans74.6 81.6 117.1 -6.9 -9% -42.4 -36%
Other assets 36.0 39.9 43.8 -3.9 -10% -7.9 -18%
Deposits from customers 9.8 10.2 36.5 -0.4 -4% -26.7 -73%
Change YoY
Non-core markets and activities
Change YtD Change YoY

37 NLB Group Interim Report Q3 2018
Capital and Liquidity
Capital adequacy
Figure 16: NLB Group CET 1 capital (in EUR million) and CET 1 ratio (in %)
In September 2018, the overall capital requirement (OCR) amounted to 13.375% for the Bank on the consolidated
level, consisting of:
• 11.50% total SREP capital requirement (TSCR) (8% Pillar 1 requirement and 3.50% Pillar 2 requirement); and
• 1.875% CBR (1.875% Capital conservation buffer and 0% Countercyclical buffer).
The applicable OCR requirement for 2018 has increased from 12.75% in 2017 to 13.375%, due solely to the
gradual phase-in of the capital conservation buffer as prescribed by law.
*Env isaging div idend pay ment in 100% prof it af ter tax of the Bank (EUR 189 million).
**Including undistributed div idend (EUR 189 million) and IFRS9 implementation ef f ect (EUR 44 million).
***Af ter div idend pay -out (EUR -271 million), but including 1H 2018 result (EUR 109 million).
1,327 1,3621,436
1,623
1,458
16.3%15.9%
16.6%
18.7%
16.9%
0.0
200.0
400.0
600.0
800.0
1000.0
1200.0
1400.0
1600.0
1800.0
31 Dec 2016 31 Dec 2017 31 Mar 2018 30 Jun 2018 30 Sep 2018
0.0%
2.0%
4.0%
6.0%
8.0%
10.0%
12.0%
14.0%
16.0%
18.0%
20.0%
CET1 capital CET1 ratio
**
* ****
***Po izplačilu div idend (-271 mio EUR), v sebuje pa rezultat 1. polletja 2018 (109 mio EUR).
*Vključeno predv ideno izplačilo div idend v v išini 100 % NLB dobička po dav kih (189 mio EUR).
**Vsebuje neizplačano div idendo (189 mio EUR) in učinek uv edbe MSRP9 (44 mio EUR).
1,327 1,3621,436
1,623
1,458
16.3%15.9%
16.6%
18.7%
16.9%
0.0
200.0
400.0
600.0
800.0
1000.0
1200.0
1400.0
1600.0
1800.0
30. sep. 2017 31. dec. 2017 31. mar. 2018 30. jun. 2018 30. sep. 2018
0.0%
2.0%
4.0%
6.0%
8.0%
10.0%
12.0%
14.0%
16.0%
18.0%
20.0%
CET1 kapital CET1 količnik
* * ***
**

38 NLB Group Interim Report Q3 2018
The capital of the Bank and the Group consists of the components of top quality common equity tier 1 (CET 1)
capital, which is why all three capital ratios (CET 1 ratio, Tier 1 capital ratio, and the Total capital ratio) are the
same. It remained strong, at a level which covers all current and announced regulatory capital requirements,
including capital buffers and other currently known requirements, as well as the Pillar 2 Guidance. Moreover, it is
within the stated risk appetite limit and above the EU average, as published by the EBA (Q4 2017: 16.2%).
At the end of September 2018, the capital ratios for Group stood at 16.9% (or 1.0 percentage points higher than at
the end of 2017), and for NLB at 23.9% (or 2.1 percentage points higher than at the end of 2017). The
improvement of capital adequacy derives from higher capital, mainly due to inclusion of the first six months of 2018
result (EUR 108.8 million for Group), lower retained earnings (EUR - 81.5 million) as part of dividend pay out, the
inclusion of the positive effect from the implementation of IFRS 9 (EUR 43.8 million for Group and EUR 27.7
million for NLB), and the conclusion of transitional arrangements relevant until the end of 2017.
In September 2018 NLB applied for formal approval with ECB to pay-out the dividends in the total amount of EUR
270.6 million which consists of: EUR 189.1 million of profit for fiscal year 2017 and EUR 81.5 million of retained
profit from previous years. Pursuant to ECB’s permission for distribution of the dividends, the General Assembly of
NLB’s Shareholders approved the distribution and NLB paid dividends in the amount of EUR 270.6 million to the
registered shareholders of NLB on 22 October 2018.
Table 11: Total risk exposure (in EUR million) for NLB Group
Despite the higher RWA for credit risk at the beginning of 2018 resulting from transition to IFRS9, it remained
almost at previous end of year level, and namely an (YtD) increase in the amount of EUR 5 million was recorded.
Besides that, higher RWA on the retail segment (EUR 183 million) for consumer and housing loans and higher
RWA for corporates (EUR 44 million, mainly in subsidiary banks) are a consequence of increased business. The
RWA for exposures to institutions decreased (in a total amount of EUR 177 million). The increase in RWA for
market risks and credit value adjustments (CVA) (EUR 52 million) is mainly the result of more open positions in
domestic currencies of non-euro subsidiary banks. The increase in the RWA for operating risks (EUR 4 million)
arises from the higher three-year average of income, which represents the basis for the calculation.
30 Sep 2018 31 Dec 2017 30 Sep 2017 YtD
Total risk exposure amount (RWA) 8,607 8,546 7,862 0.7%
RWA for credit risk 7,102 7,096 6,865 0.1%
RWA for market risks + CVA 552 501 105 10.3%
RWA for operational risk 953 949 893 0.5%

39 NLB Group Interim Report Q3 2018
Liquidity
The liquidity position of the Group remains strong, with a LTD ratio (net) of 69.1%, meeting liquidity indicators high
above regulatory requirements, and confirming the low liquidity risk tolerance of the Group.
Liquid assets of the Group at the end of Q3 2018 amounted to EUR 5.73 billion (44.8% of total assets; 2017 year-
end: EUR 5.45 billion, 44.6% of total assets), of which EUR 0.40 billion (2017 year-end: EUR 0.43 billion) were
encumbered for operational and regulatory purposes.
Figure 17: NLB Group liquid assets structure reflects a robust liquidity position (in EUR million)
The banking book securities portfolio, which represented 55.4% of the Group’s liquid assets at the end of Q3 2018
(2017 year-end: 53.4%), was dispersed appropriately in relation to issuers, countries, and remaining maturity, with
the aim of managing liquidity and interest risk.
Driven by the low interest rate environment, the main change in the funding structure of the Group was the
continued transformation of term-to-sight customer deposits, representing the key funding base. Share-of-sight
customer deposits equaled 63.0% of total assets at the end of Q3 2018 (2017 year-end: 59.9%).
849 1.0681.389
724694
5679559
33
2.8242.915
3.174
779718
5635.270
5.4555.726
30-Sep-17 31-Dec-17 30-Sep-18
Cash & CB reserves Placements with banks Trading book securities
Banking book securities ECB eligible loans

40 NLB Group Interim Report Q3 2018
Risk management
The key goal of Risk Management is to assess, monitor, and manage risks within the Group in line with the
Group’s Risk Appetite and Risk Strategy, which are its fundamental risk management documents. Moreover, the
Group is constantly enhancing its robust risk management framework in accordance with best banking practices
in order to proactively support business decision-making, ensuring comprehensive steering and mitigation
processes by incorporating the internal capital adequacy assessment process (ICAAP), the internal liquidity
adequacy assessment process (ILAAP), the Recovery plan, and other internal stress-testing capabilities.
The activities related to International Financial Reporting Standard (IFRS) 9 requirements, which entered into force
in the beginning of 2018 including methodological adaptations and anticipated quantitative impacts, were fully
implemented at the end of the year 2017, and included internal validation and an external pre-audit methodological
review. Due to very favorable macroeconomic trends and the improved quality of the credit portfolio, the
cumulative effects on the Group basis in the amount of EUR 43.8 million (as at 1 January 2018) were recognized
(as the difference between IFRS 9 and IAS 39), arising mainly from collective impairments. These effects
strengthened the Group’s capital basis in Q1 2018.
On 30 April 2018, the Group received the Bank of Slovenia Decree on the determination of the MREL requirement.
MREL is determined in the percent of Total Liabilities and Own Funds (TLOF) on the sub-consolidated level of the
NLB Resolution Group and must be attained by 31 March 2019. The MREL requirement for the Group is based on
the Multiple Point of Entry (MPE) approach, and was determined to be 17.40% of TLOF.
One of the key aims of Risk Management is to ensure that the Group’s capital adequacy is managed prudently.
The Group monitors its capital adequacy at both the Group and subsidiary bank levels within the framework of the
established ICAAP process under normal conditions (regulatory capital adequacy) and stressed conditions. As at
30 September 2018, the Group had a solid level of capital adequacy (CET 1) of 16.9%, which is within the stated
risk appetite limit. The reported capital adequacy ratio also includes the first six months result of the year 2018,
with lower retained earnings as part of the dividend pay out and positive effects from the implementation of IFRS
9. In addition, the adjustment of treatment of the FX position on the consolidated level as result of a request by the
ECB is also influencing the capital adequacy ratio, referring to the treatment of structural positions arising from
equity investments in non-euro subsidiary banks. In line with the Supervisory Review and Evaluation Process
(SREP), both CET 1 and total capital requirement for the Group in 2018 are fulfilled in the current and fully loaded
requirements.
The second key aim is to maintain a solid liquidity level and structure. The Group holds a strong liquidity position at
both the Group and subsidiary bank levels, well above the risk appetite, with a liquidity coverage ratio (LCR)
(according to the delegated act) of 358%, and unencumbered eligible reserves in the amount of EUR 5,317 million.
Even if the stress scenario were to occur, the Group has sufficiently high liquidity reserves in place in the form of
placements at the ECB, prime debt securities, and money market placements. The main funding base of the
Group at the Group and individual subsidiary bank levels predominately entails customer deposits with a
comfortable level of LTD (net) in the amount of 69.1%, giving the Group the potential for further customer loan
placements.
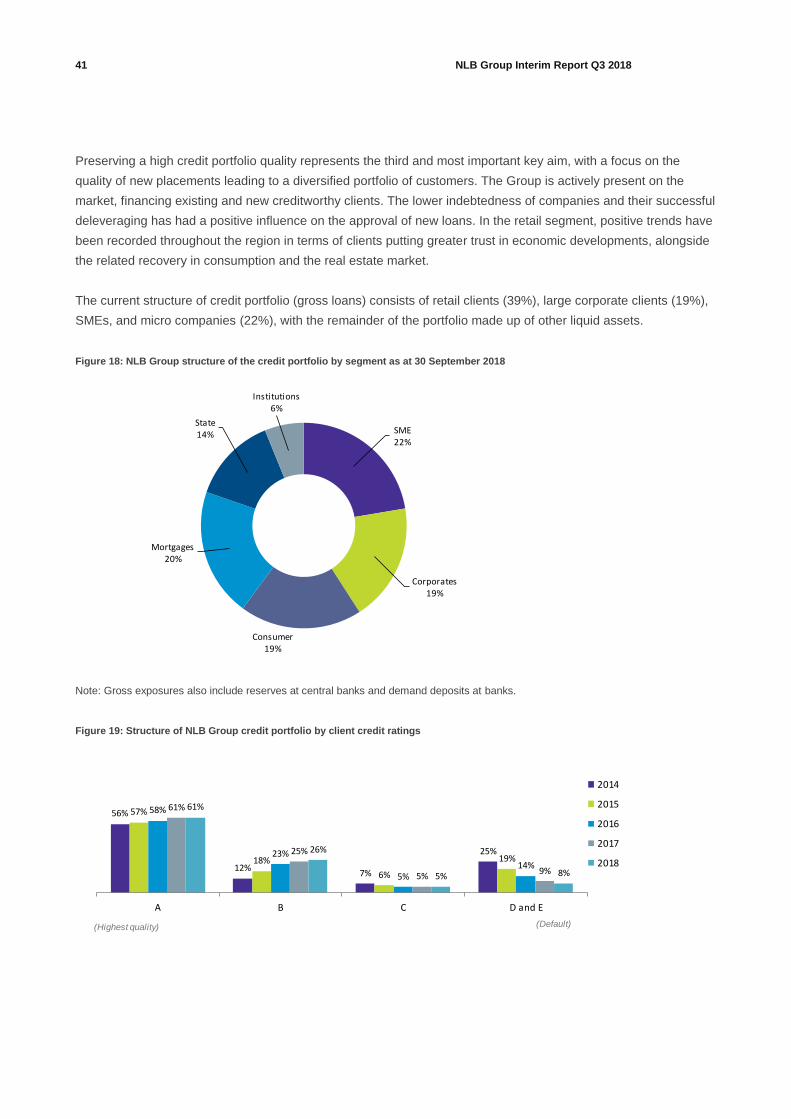
41 NLB Group Interim Report Q3 2018
Preserving a high credit portfolio quality represents the third and most important key aim, with a focus on the
quality of new placements leading to a diversified portfolio of customers. The Group is actively present on the
market, financing existing and new creditworthy clients. The lower indebtedness of companies and their successful
deleveraging has had a positive influence on the approval of new loans. In the retail segment, positive trends have
been recorded throughout the region in terms of clients putting greater trust in economic developments, alongside
the related recovery in consumption and the real estate market.
The current structure of credit portfolio (gross loans) consists of retail clients (39%), large corporate clients (19%),
SMEs, and micro companies (22%), with the remainder of the portfolio made up of other liquid assets.
Figure 18: NLB Group structure of the credit portfolio by segment as at 30 September 2018
Note: Gross exposures also include reserves at central banks and demand deposits at banks.
Figure 19: Structure of NLB Group credit portfolio by client credit ratings
SME22%
Corporates19%
Consumer19%
Mortgages20%
State14%
Institutions6%
56%
12%7%
25%
57%
18%
6%
19%
58%
23%
5%14%
61%
25%
5%9%
61%
26%
5% 8%
A B C D and E
2014
2015
2016
2017
2018
(Highest quality) (Default)

42 NLB Group Interim Report Q3 2018
The Group’s primary objective is to provide comprehensive services to clients by utilising prudent risk
management principles. The Group is constantly developing a wide range of advanced approaches supported by
mathematical and statistical models in the area of credit risk assessment in line with best banking practices to
further enhance existing risk management tools, while at the same time enabling faster responsiveness towards
clients. In Q3 2018, efforts led to cumulatively very low new NPLs formation in the amount of EUR 17.6 million, of
which only EUR 2.5 million comes from new business11, which represents less than 0.03% of the total portfolio. In
addition, a favorable macroeconomic environment across the region resulted in the negative cost of risk (arising
from the release of pool provisions and successful restructuring and recovery of non-performing loans), whose
evolution was otherwise very stable and sustainable and in line with strategic orientations.
The restructuring approaches built in the past are focused on the early detection of clients with potential financial
difficulties (early warning mechanism) and their proactive treatment. The Group’s strong commitment to reduce the
NPE legacy is supported by precisely set targets and constantly monitoring progress. The existing non-performing
credit portfolio stock in the Group was additionally reduced in the Q3 2018 (in comparison with YE 2017) from
EUR 844 million to EUR 706 million. The share of NPLs decreased in the Q3 2018 (in comparison with YE 2017)
from 9.2% to 7.6%, while the internationally more comparable NPE ratio based on EBA methodology fell from
6.7% to 5.3%.
The NPL coverage ratio 112, which remains high at 76.4%, represents an important strength for the Group. The
Group’s NPL coverage ratio 213 stands at 65.5%, which is well above the EU average published by the EBA
(46.0% for Q2 2018). This means, similar as in the previous years, a further reduction of NPLs can be made
without significantly influencing the cost of risk in the years ahead.
Figure 20: NLB Group NPE (NPE % by the EBA) and NPL ratio
Notes:
11 Refers to corporate loans issued since 2014 and retail loans issued since 2015.
12 The coverage of the gross NPL portfolio with impairments on the entire loan portfolio. 13 The coverage of the gross NPL portfolio with impairments on the NPL portfolio.
19%
14%
10%
7%5%
25%
19%
14%
9%8%
2014 2015 2016 2017 2018
NPE % in accordance with EBA methodology Share of non-performing loans (NPL) in all loans

43 NLB Group Interim Report Q3 2018
Figure 21: NLB Group NPL Coverage ratio 114 and NPL Coverage ratio 215
Figure 22: NLB Group NPL volume (in EUR million)
When considering market risks, the Group pursues the orientation that such risks should not significantly affect a
single Group subsidiary or the whole Group’s operations. The Group’s net open FX position arising from
transactional risk is very low and amounts to less than 1.06% of the total capital.
The exposure to interest rate risk on the Group level is relatively low, but has increased moderately in the recent
period as a result of an excess liquidity position and a low interest rate environment. The Group’s net interest
income sensitivity in the case of a Euribor increase of 50 bps would amount to EUR 14.0 million, whereas a Notes:
14 The coverage of the gross NPL portfolio with impairments on the entire loan portfolio. 15 The coverage of the gross NPL portfolio with impairments on the NPL portfolio.
69%72%
76% 78% 76%
62% 63% 65% 62% 66%
2014 2015 2016 2017 2018
NPL coverage ratio 1 NPL coverage ratio 2
2,623
1,896
1,299
844706
2014 2015 2016 2017 2018
NPL volume in EUR million

44 NLB Group Interim Report Q3 2018
decrease in exposure would be lower due to the zero floor clauses in place. Moreover, the basis point value (BPV)
sensitivity (with inclusion of sight deposit allocation) of 200 bps equals 8.3% of capital.
In the area of operational risks, additional efforts were made regarding proactive prevention and the minimisation
of potential damage in the future. Special attention was dedicated to the established stress-testing system, based
on modelling data on loss events and scenario analysis referring to potential high severity, low frequency events.
Furthermore, key risk indicators as an early warning system for the broader field of operational risks are regularly
monitored with the aim of improving the existing internal controls and reacting on time when necessary.

45 NLB Group Interim Report Q3 2018
Events after 30 September 2018
• On 18 October 2018 Fitch affirmed NLB’s a BB long-term credit rating (outlook Rating watch: evolving).
• Pursuant to ECB’s permission for distribution of the dividends, General Assembly of NLB’s Shareholders
approved the distribution and NLB paid dividends in the amount of EUR 270.6 million to the registered
shareholders of NLB on 22 October 2018. For more information see section 9 of the Notes to the
condensed interim financial statements of this report.
• On 14 November 2018 the Republic of Slovenia acting through Slovenski državni holding, d.d. concluded
the offering of no less than 10,000,001 (50% plus one share) and up to 14,999,999 (75% minus one
share) of NLB's shares held by the Republic of Slovenia. The offering was made to retail investors in
Slovenia and institutional investors in Slovenia and outside Slovenia. Assuming exercise of the
overallotment option in full the total offering size was 13,000,000 shares, where retail offering size was
385,369 shares and 1,010 GDRs, and institutional offering size was 1,614,865 shares and 10,998,756
GDRs. The offer price per share was EUR 51.50, and offer price per GDR (five GDRs represent one
share) was EUR 10.30. The shares are listed on Ljubljana Stock Exchange and GDRs on London Stock
Exchange. After the completed offering of shares and assuming exercise of the overallotment option in
full the Republic of Slovenia held 7,000,000 shares representing 35% of all NLB’s shares.
• On 23 November 2018 Fitch upgraded NLB's Long-term IDR to "BB+" from "BB" and removed it from
Rating Watch Evolving (RWE). The Outlook is stable.

46 NLB Group Interim report Q3 2018
Condensed Interim Financial Statements of NLB Group and NLB
as at 30 September 2018
Prepared in accordance with
International accounting standard 34
“Interim financial reporting”

47 NLB Group Interim report Q3 2018
Contents
Condensed income statement .......................................................................................................................................................... 49 Condensed income statement – for three months ended September for NLB Group and NLB ................................................... 50 Condensed statement of comprehensive income ........................................................................................................................... 51 Condensed statement of comprehensive income – for three months ended September for NLB Group and NLB .................... 52 Condensed statement of financial position ..................................................................................................................................... 53 Condensed statement of changes in equity .................................................................................................................................... 54 Condensed statement of cash flows ................................................................................................................................................ 56 Notes to the condensed interim financial statements..................................................................................................................... 58 1. General information .............................................................................................................................................................. 58 2. Summary of significant accounting policies ....................................................................................................................... 58 2.1. Statement of compliance 58 2.2. Accounting policies 58 2.3. Comparative amounts 70 3. Changes in NLB Group ......................................................................................................................................................... 71 4. Notes to the condensed income statement ......................................................................................................................... 72 4.1. Interest income and expenses 72 4.2. Dividend income 72 4.3. Fee and commission income and expenses 72 4.4. Gains less losses from financial assets and liabilities not classified as at fair value through profit or loss 73 4.5. Gains less losses from financial assets and liabilities held for trading 73 4.6. Gains less losses from non-trading financial assets mandatorily at fair value through profit or loss 73 4.7. Other operating income 73 4.8. Other operating expenses 73 4.9. Administrative expenses 74 4.10. Provisions for other liabilities and charges 74 4.11. Impairment charge 74 4.12. Gains less losses from non-current assets held for sale 75 4.13. Income tax 75 5. Notes to the condensed statement of financial position .................................................................................................... 75 5.1. Cash, cash balances at central banks, and other demand deposits at banks 75 5.2. Financial instruments held for trading 75 5.3. Non-trading financial instruments measured at fair value through profit or loss 76 5.4. Financial assets measured at fair value through other comprehensive income 76 5.5. Available-for-sale financial assets 76 5.6. Financial assets measured at amortised cost 77 5.7. Loans and advances 78 5.8. Movements in allowance for the impairment and provisions 79 5.9. Held-to-maturity financial assets 81 5.10. Investment property 81 5.11. Other assets 81 5.12. Deferred tax 82 5.13. Disposal of a subsidiary 83 5.14. Financial liabilities measured at amortised cost 84 5.15. Provisions 85 5.16. Income tax relating to components of other comprehensive income 86 5.17. Other liabilities 87 5.18. Capital adequacy ratio 87 5.19. Book value per share 88 5.20. Off-balance sheet liabilities 88 5.21. Fair value hierarchy of financial and non-financial assets and liabilities 88 6. Related-party transactions ................................................................................................................................................... 95 7. Analysis by segment for NLB Group ................................................................................................................................... 97

48 NLB Group Interim report Q3 2018
8. Subsidiaries .......................................................................................................................................................................... 99 9. Events after the end of the reporting period ..................................................................................................................... 100

49 NLB Group Interim report Q3 2018
Condensed income statement
in EUR thousand
Sep Sep Sep Sep
Notes 2018 2017 2018 2017
unaudited
unaudited
restated unaudited
unaudited
restated
Interest income, using the effective interest method 261,696 265,653 130,235 134,514
Interest income, not using the effective interest method 5,022 5,261 5,081 5,261
Interest and similar income 4.1. 266,718 270,914 135,316 139,775
Interest and similar expenses 4.1. (34,853) (42,221) (17,737) (23,412)
Net interest income 231,865 228,693 117,579 116,363
Dividend income 4.2. 109 153 49,686 48,057
Fee and commission income 4.3. 162,025 153,890 98,811 94,736
Fee and commission expenses 4.3. (42,066) (38,681) (23,412) (21,317)
Net fee and commission income 119,959 115,209 75,399 73,419
Gains less losses from financial assets and liabilities not classified as at fair value
through profit or loss4.4. 664 11,834 254 11,440
Gains less losses from financial assets and liabilities held for trading 4.5. 6,903 9,392 2,075 5,088
Gains less losses from non-trading financial assets mandatorily at fair value
through profit or loss4.6. 2,805 - 3,838 -
Gains less losses from financial assets and liabilities designated at fair value
through profit or loss (56) 49 (56) -
Fair value adjustments in hedge accounting 894 (1,148) 894 (1,148)
Foreign exchange translation gains less losses 445 2,377 (46) (517)
Gains less losses on derecognition of assets other than held for sale 2,042 1,611 114 247
Other operating income 4.7. 13,520 18,740 6,182 9,508
Other operating expenses 4.8. (22,045) (19,579) (12,314) (10,421)
Administrative expenses 4.9. (189,874) (187,016) (116,129) (114,853)
Depreciation and amortisation (20,500) (20,827) (13,084) (13,515)
Provisions for other liabilities and charges 4.10. 3,383 8,361 1,638 5,469
Impairment charge 4.11. 15,586 28,911 16,583 15,430
Share of profit from investments in associates and joint ventures (accounted for
using the equity method)4,105 3,738 - -
Gains less losses from non-current assets held for sale 4.12. 11,857 (2,051) 11,458 577
Profit before income tax 181,662 198,447 144,071 145,144
Income tax 4.13. (16,625) (7,170) (9,497) 124
Profit for the period 165,037 191,277 134,574 145,268
Attributable to owners of the parent 158,326 183,991 134,574 145,268
Attributable to non-controlling interests 6,711 7,286 - -
Earnings per share/diluted earnings per share (in EUR per share) 7.92 9.20 6.73 7.26
nine months endednine months ended
NLBNLB Group

50 NLB Group Interim report Q3 2018
Condensed income statement – for three months ended September for NLB
Group and NLB
in EUR thousand
Sep Sep Sep Sep
Notes 2018 2017 2018 2017
unaudited
unaudited
restated unaudited
unaudited
restated
Interest income, using the effective interest method 90,190 90,786 44,867 45,085
Interest income, not using the effective interest method 1,397 1,382 1,418 1,382
Interest and similar income 4.1. 91,590 92,168 46,287 46,467
Interest and similar expenses 4.1. (11,404) (12,042) (5,928) (6,034)
Net interest income 80,186 80,126 40,359 40,433
Dividend income 4.2. 12 11 6 5,975
Fee and commission income 4.3. 56,028 53,260 33,535 32,277
Fee and commission expenses 4.3. (15,628) (13,804) (8,420) (7,412)
Net fee and commission income 40,400 39,456 25,115 24,865
Gains less losses from financial assets and liabilities not classified as at fair value through profit
or loss4.4. 99 20 (28) 20
Gains less losses from financial assets and liabilities held for trading 4.5. 2,985 3,712 1,255 2,027
Gains less losses from non-trading financial assets mandatorily at fair value through profit or loss 4.6. 1,164 - 1,250 -
Gains less losses from financial assets and liabilities designated at fair value through profit or
loss- 31 - -
Fair value adjustments in hedge accounting 637 226 637 226
Foreign exchange translation gains less losses 119 1,355 (44) (687)
Gains less losses on derecognition of assets other than held for sale 672 141 58 67
Other operating income 4.7. 5,210 5,850 2,372 2,476
Other operating expenses 4.8. (5,280) (4,478) (1,954) (1,591)
Administrative expenses 4.9. (63,551) (61,748) (39,026) (37,819)
Depreciation and amortisation (6,858) (7,040) (4,369) (4,579)
Provisions for other liabilities and charges 4.10. 5 3,132 1,010 1,087
Impairment charge 4.11. 4,593 8,520 5,241 3,913
Share of profit from investments in associates and joint ventures (accounted for using the equity
method)1,567 1,002 - -
Gains less losses from non-current assets held for sale 4.12. (290) (2,253) 2,649 232
Profit before income tax 61,670 68,063 34,531 36,645
Income tax 4.13. (6,022) 923 (3,292) 3,305
Profit for the period 55,648 68,986 31,239 39,950
Attributable to owners of the parent 53,479 66,072 31,239 39,950
Attributable to non-controlling interests 2,169 2,914 - -
NLB Group
three months ended three months ended
NLB

51 NLB Group Interim report Q3 2018
Condensed statement of comprehensive income
in EUR thousand
Sep Sep Sep Sep
Note 2018 2017 2018 2017
unaudited unaudited unaudited unaudited
Net profit for the period after tax 165,037 191,277 134,574 145,268
Other comprehensive income/(loss) after tax (11,286) (4,711) (7,979) (9,276)
Items that will not be reclassified to income statement
Actuarial gains/(losses) on defined benefit pension plans - (846) - (950)
Fair value changes of equity instruments measured at fair value
through other comprehensive income1,744 - 545 -
Share of other comprehensive income/(losses) of entities
accounted for using the equity method(378) (2) - -
Income tax relating to components of other comprehensive
income5.16. (16) 90 (95) 90
Items that may be reclassified subsequently to income statement
Foreign currency translation (1,230) 3,168 - -
Translation gains/(losses) taken to equity (1,230) 3,168 - -
Debt instruments measured at fair value through other
comprehensive income(10,328) - (10,406) -
Valuation gains/(losses) taken to equity (10,202) - (10,366) -
Transferred to income statement (126) - (40) -
Available-for-sale financial assets - (8,922) - (10,390)
Valuation gains/(losses) taken to equity - 2,912 - 1,050
Transferred to income statement 4.4. and 4.11. - (11,834) - (11,440)
Share of other comprehensive income/(losses) of entities
accounted for using the equity method(3,712) (74) - -
Income tax relating to components of other comprehensive
income5.16. 2,634 1,875 1,977 1,974
Total comprehensive income for the period after tax 153,751 186,566 126,595 135,992
Attributable to owners of the parent 147,092 179,091 126,595 135,992
Attributable to non-controlling interests 6,659 7,475 - -
NLBNLB Group
nine months endednine months ended

52 NLB Group Interim report Q3 2018
Condensed statement of comprehensive income – for three months ended
September for NLB Group and NLB
in EUR thousand
Sep Sep Sep Sep
2018 2017 2018 2017
unaudited unaudited unaudited unaudited
Net profit for the period after tax 55,648 68,986 31,239 39,950
Other comprehensive income after tax (6,979) 6,678 (4,569) 3,725
Items that will not be reclassified to income statement
Actuarial gains/(losses) on defined benefit pension plans - (846) - (950)
Fair value changes of equity instruments measured at fair value through other
comprehensive income (2,020) - 220 -
Share of other comprehensive income/(losses) of entities accounted for using the
equity method(145) - - -
Income tax relating to components of other comprehensive income (36) 90 (42) 90
Items that may be reclassified subsequently to income statement
Foreign currency translation 319 1,466 - -
Translation gains/(losses) taken to equity 319 1,466 - -
Debt instruments measured at fair value through other comprehensive income (5,324) - (5,861) -
Valuation gains/(losses) taken to equity (4,956) - (5,807) -
Transferred to income statement (368) - (54) -
Available-for-sale financial assets - 6,542 - 5,660
Valuation gains/(losses) taken to equity - 6,573 - 5,680
Transferred to income statement - (31) - (20)
Share of other comprehensive income/(losses) of entities accounted for using the
equity method(1,036) 727 - -
Income tax relating to components of other comprehensive income 1,263 (1,301) 1,114 (1,075)
Total comprehensive income for the period after tax 48,669 75,664 26,670 43,675
Attributable to owners of the parent 46,463 72,641 26,670 43,675
Attributable to non-controlling interests 2,206 3,023 - -
NLB Group
three months ended
NLB
three months ended

53 NLB Group Interim report Q3 2018
Condensed statement of financial position
in EUR thousand
30 Sep 2018 1 Jan 2018 31 Dec 2017 30 Sep 2018 1 Jan 2018 31 Dec 2017
Notes unaudited unaudited audited unaudited unaudited audited
Cash, cash balances at central banks and other demand deposits at banks 5.1. 1,557,372 1,255,824 1,256,481 820,920 569,943 570,010
Financial assets held for trading 5.2.a) 45,244 72,189 72,189 45,237 72,180 72,180
Non-trading financial assets mandatorily at fair value through profit or loss 5.3.a) 26,536 31,404 - 25,796 31,239 -
Financial assets designated at fair value through profit or loss 5.3.b) - - 5,003 - - 634
Financial assets measured at fair value through other comprehensive income 5.4. 1,889,384 1,656,365 - 1,516,149 1,285,276 -
Financial assets measured at amortised cost
- debt securities 5.6.a) 1,337,165 1,301,413 - 1,197,426 1,178,088 -
- loans and advances to banks 5.6.b) 402,034 509,970 - 380,275 461,830 -
- loans and advances to customers 5.6.c) 7,059,217 6,956,362 - 4,488,698 4,594,286 -
- other financial assets 5.6.d) 51,979 67,046 - 52,582 38,915 -
Available-for-sale financial assets 5.5. - - 2,276,493 - - 1,777,762
Loans and advances
- debt securities 5.7.a) - - 82,133 - - 82,133
- loans and advances to banks 5.7.b) - - 510,107 - - 462,322
- loans and advances to customers 5.7.c) - - 6,912,333 - - 4,587,477
- other financial assets 5.7.d) - - 66,077 - - 38,389
Held-to-maturity investments 5.9. - - 609,712 - - 609,712
Derivatives - hedge accounting 1,530 1,188 1,188 1,530 1,188 1,188
Fair value changes of the hedged items in portfolio hedge of interest rate risk 748 719 719 748 719 719
Investments in subsidiaries - - - 350,445 349,945 349,945
Investments in associates and joint ventures 37,754 43,765 43,765 4,797 6,932 6,932
Tangible assets
Property and equipment 182,842 188,355 188,355 84,242 87,051 87,051
Investment property 5.10. 51,199 51,838 51,838 12,026 9,257 9,257
Intangible assets 31,093 34,974 34,974 20,533 23,911 23,911
Current income tax assets 921 599 2,795 - - 2,196
Deferred income tax assets 5.12. 22,105 19,745 18,603 22,086 20,318 19,758
Other assets 5.11. 82,214 93,349 93,349 10,536 8,692 8,692
Non-current assets classified as held for sale 4,381 11,631 11,631 1,720 2,564 2,564
TOTAL ASSETS 12,783,718 12,296,736 12,237,745 9,035,746 8,742,334 8,712,832
Trading liabilities 5.2.b) 9,987 9,502 9,502 9,991 9,398 9,398
Financial liabilities measured at fair value through profit or loss 5.3. 9,631 5,815 635 9,345 5,166 635
Financial liabilities measured at amortised cost
- deposits from banks and central banks 5.14. 43,274 40,602 40,602 57,688 72,072 72,072
- borrowings from banks and central banks 5.14.a) 267,138 279,616 279,616 252,421 260,747 260,747
- due to customers 5.14. 10,246,679 9,878,378 9,878,378 6,986,764 6,810,967 6,810,967
- borrowings from other customers 5.14.a) 62,463 74,286 74,286 4,527 5,726 5,726
- subordinated liabilities 5.14.b) 15,292 27,350 27,350 - - -
- other financial liabilities 5.14.c) 111,793 111,019 111,019 77,583 71,534 71,534
Derivatives - hedge accounting 22,747 25,529 25,529 22,747 25,529 25,529
Liabilities of disposal group classified as held for sale - 440 440 - - -
Provisions 5.15. 86,010 93,989 88,639 63,782 67,232 70,817
Current income tax liabilities 10,276 3,908 2,894 9,061 1,014 -
Deferred income tax liabilities 5.12. 2,533 2,558 1,096 - - -
Other liabilities 5.17. 11,340 9,467 9,596 6,350 4,057 4,181
TOTAL LIABILITIES 10,899,163 10,562,459 10,549,582 7,500,259 7,333,442 7,331,606
EQUITY AND RESERVES ATTRIBUTABLE TO OWNERS OF THE PARENT
Share capital 200,000 200,000 200,000 200,000 200,000 200,000
Share premium 871,378 871,378 871,378 871,378 871,378 871,378
Accumulated other comprehensive income 12,307 24,744 26,752 16,665 24,688 25,699
Profit reserves 13,522 13,522 13,522 13,522 13,522 13,522
Retained earnings 747,271 587,742 541,901 433,922 299,304 270,627
1,844,478 1,697,386 1,653,553 1,535,487 1,408,892 1,381,226
Non-controlling interests 40,077 36,891 34,610 - - -
TOTAL EQUITY 1,884,555 1,734,277 1,688,163 1,535,487 1,408,892 1,381,226
TOTAL LIABILITIES AND EQUITY 12,783,718 12,296,736 12,237,745 9,035,746 8,742,334 8,712,832
NLBNLB Group
The Management Board has approved the release of the financial statements and the accompanying notes.
Ljubljana, 30 November 2018

54 NLB Group Interim report Q3 2018
Condensed statement of changes in equity
in EUR thousand
NLB Group
Fair value reserve
of financial
assets measured
at FVOCI
Foreign
currency
translation
reserve
Other capital
reserves
Balance as at 31 December 2017 200,000 871,378 47,595 (17,248) (3,595) 13,522 541,901 1,653,553 34,610 1,688,163
Impact of adopting IFRS 9 - - (2,008) - - - 45,841 43,833 2,281 46,114
Restated opening balance under IFRS 9 200,000 871,378 45,587 (17,248) (3,595) 13,522 587,742 1,697,386 36,891 1,734,277
- Net profit for the period - - - - - - 158,326 158,326 6,711 165,037
- Other comprehensive income - - (10,162) (1,084) 12 - - (11,234) (52) (11,286)
Total comprehensive income after tax - - (10,162) (1,084) 12 - 158,326 147,092 6,659 153,751
Dividends paid - - - - - - - - (3,133) (3,133)
Transfer of fair value reserve - - (1,190) - (13) - 1,203 - - -
Other - - - - - - - - (340) (340)
Balance as at 30 September 2018 200,000 871,378 34,235 (18,332) (3,596) 13,522 747,271 1,844,478 40,077 1,884,555
Total equity
Equity
attributable to
owners of the
parent
Profit
reserves
Share
capital
Equity
attributable
to non-
controlling
interests
Retained
earnings
Share
premium
Accumulated other comprehensive income
in EUR thousand
NLB Group
Fair value reserve
of financial
assets measured
at FVOCI
Foreign
currency
translation
reserve
Other capital
reserves
Balance as at 1 January 2017 200,000 871,378 52,971 (20,140) (2,863) 13,522 380,444 1,495,312 30,347 1,525,659
- Net profit for the period - - - - - - 183,991 183,991 7,286 191,277
- Other comprehensive income - - (7,136) 2,994 (758) - - (4,900) 188 (4,712)
Total comprehensive income after tax - - (7,136) 2,994 (758) - 183,991 179,091 7,474 186,565
Dividends paid - - - - - - (63,780) (63,780) (3,725) (67,505)
Other - - - - - - 222 222 (347) (125)Balance as at 30 September 2017 200,000 871,378 45,835 (17,146) (3,621) 13,522 500,877 1,610,845 33,749 1,644,594
Equity
attributable to
owners of the
parent
Profit
reserves
Share
capital
Share
premium
Retained
earnings
Accumulated other comprehensive income
Total equity
Equity
attributable
to non-
controlling
interests

55 NLB Group Interim report Q3 2018
in EUR thousand
NLB Share capital
Share
premium
Fair value
reserve of
financial assets
measured at
FVOCI
Other
capital
reserves
Profit
reserves
Retained
earnings Total equity
Balance as at 31 December 2017 200,000 871,378 29,196 (3,497) 13,522 270,627 1,381,226
Impact of adopting IFRS 9 - - (1,011) - - 28,677 27,666
Restated opening balance under IFRS 9 200,000 871,378 28,185 (3,497) 13,522 299,304 1,408,892
- Net profit for the period - - - - - 134,574 134,574
- Other comprehensive income - - (7,979) - - (7,979)
Total comprehensive income after tax - - (7,979) - - 134,574 126,595
Transfer of fair value reserve - - (44) 44 -
Balance as at 30 September 2018 200,000 871,378 20,162 (3,497) 13,522 433,922 1,535,487
Accumulated other
comprehensive income
in EUR thousand
NLB
Fair value
reserve of
financial assets
measured at
FVOCI
Other
capital
reserves
Balance as at 1 January 2017 200,000 871,378 37,218 (2,637) 13,522 145,313 1,264,794
- Net profit for the period - - - - - 145,268 145,268
- Other comprehensive income - - (8,416) (860) - - (9,276)
Total comprehensive income after tax - - (8,416) (860) - 145,268 135,992
Dividends paid - - - - - (63,780) (63,780)
Balance as at 30 September 2017 200,000 871,378 28,802 (3,497) 13,522 226,801 1,337,006
Share capital
Share
premium
Profit
reserves
Retained
earnings
Accumulated other
comprehensive income
Total equity

56 NLB Group Interim report Q3 2018
Condensed statement of cash flows
in EUR thousand
Sep Sep Sep Sep
2018 2017 2018 2017
unaudited unaudited unaudited unaudited
CASH FLOWS FROM OPERATING ACTIVITIES
Interest received 296,029 294,844 166,874 166,603
Interest paid (34,098) (47,196) (18,071) (28,366)
Dividends received 1,821 4,368 41,156 42,102
Fee and commission receipts 161,794 154,318 97,832 93,911
Fee and commission payments (44,519) (40,581) (23,664) (21,605)
Realised gains from financial assets and financial liabilities not measured at fair
value through profit or loss 1,039 11,996 629 11,594
Net gains/(losses) from financial assets and liabilities held for trading 7,497 6,265 2,977 2,216
Payments to employees and suppliers (190,214) (187,998) (120,396) (119,360)
Other income 19,001 20,996 8,706 9,718
Other expenses (19,752) (19,100) (12,960) (10,387)
Income tax (paid)/received (8,662) (7,061) 355 786
Cash flows from operating activities before changes in operating assets
and liabilities
189,936 190,851 143,438 147,212
(Increases)/decreases in operating assets (212,822) (142,989) (87,261) (50,781)
Net (increase)/decrease in trading assets 26,577 (26,218) 26,577 (26,218)
Net (increase)/decrease in financial assets designated at fair value through profit
or loss - 1,106 - 686
Net (increase)/decrease in non-trading financial assets mandatorily at fair value
through profit or loss 11,319 - 13,775 -
Net (increase)/decrease in financial assets measured at fair value through other
comprehensive income (254,371) - (255,375) -
Net (increase)/decrease in available-for-sale financial assets - (144,790) - (146,420)
Net (increase)/decrease in loans and receivables measured at amortised cost (8,139) 22,462 126,484 120,028
Net (increase)/decrease in other assets 11,792 4,451 1,278 1,143
Increases/(decreases) in operating liabilities 344,335 (92,894) 158,194 (177,894)
Net increase/(decrease) in financial liabilities designated at fair value through profit
or loss
(691) (686) (691) (686)
Net increase/(decrease) in deposits and borrowings measured at amortised cost 345,314 176,216 158,133 96,929
Net increase/(decrease) in securities measured at amortised cost - (274,200) - (274,200)
Net increase/(decrease) in other liabilities (288) 5,776 752 63
Net cash from operating activities 321,449 (45,032) 214,371 (81,463)
CASH FLOWS FROM INVESTING ACTIVITIES
Receipts from investing activities 328,235 70,231 248,617 66,148
Proceeds from sale of property and equipment 4,963 4,093 5 10
Proceeds from disposals of subsidiaries and associates 23,271 276 14,868 276
Proceeds from disposals of debt securities measured at amortised cost 299,843 - 233,586 -Proceeds from disposals of held-to-maturity financial assets - 65,403 - 65,403
Proceeds from sale of non-current assets held for sale 158 459 158 459
Payments from investing activities (367,154) (79,276) (279,600) (84,437)
Purchase of property and equipment (12,545) (7,872) (7,866) (4,093)
Purchase of intangible assets (7,094) (8,411) (5,532) (6,567)
Purchase of subsidiaries and increase in subsidiaries' equity - (1,596) (800) (12,380)
Purchase of debt securities measured at amortised cost (347,515) - (265,402) -
Purchase of held-to-maturity financial assets - (61,397) - (61,397)
Net cash from investing activities (38,919) (9,045) (30,983) (18,289)
CASH FLOWS FROM FINANCING ACTIVITIES
Proceeds from financing activities - - - -
Issue of subordinated debt - - - -
Payments from financing activities (15,102) (67,454) - (63,780)
Dividends paid (3,131) (67,454) - (63,780)
Repayments of subordinated debt (11,971) - - -
Net cash from financing activities (15,102) (67,454) - (63,780)
Effects of exchange rate changes on cash and cash equivalents 1,991 (6,858) (508) (11,267)
Net increase/(decrease) in cash and cash equivalents 267,428 (121,531) 183,388 (163,532)
Cash and cash equivalents at beginning of period 1,475,714 1,449,275 662,419 670,682
Cash and cash equivalents at end of period 1,745,133 1,320,886 845,299 495,883
nine months ended
NLB Group NLB
nine months ended

57 NLB Group Interim report Q3 2018
in EUR thousand
30 Sep 2018 31 Dec 2017 30 Sep 2018 31 Dec 2017
Notes unaudited audited unaudited audited
Cash and cash equivalents comprise:
Cash, cash balances at central banks, and other demand deposits at banks 5.1. 1,557,937 1,256,481 821,014 570,010
Loans and advances to banks with original maturity up to 3 months 119,682 148,784 24,285 92,409
Financial assets measured at fair value through other comprehensive
income with original maturity up to 3 months 67,514 - - -
Available for sale financial assets with original maturity up to 3 months - 70,449 - -
Total 1,745,133 1,475,714 845,299 662,419
NLB Group NLB

58 NLB Group Interim report Q3 2018
Notes to the condensed interim financial statements
1. General information
Nova Ljubljanska banka d.d. Ljubljana (hereinafter: ‘NLB’) is a joint-stock entity providing universal banking
services. NLB Group consists of NLB and its subsidiaries located in nine countries.
NLB is incorporated and domiciled in Slovenia. The address of its registered office is Trg Republike 2,
Ljubljana. NLB’s shares are not listed on the stock exchange.
The ultimate controlling party of NLB is the Republic of Slovenia, which was the sole shareholder as at 30
September 2018 and 31 December 2017.
All amounts in the condensed interim financial statements and in the notes to the condensed interim
financial statements are expressed in thousands of euros unless otherwise stated.
2. Summary of significant accounting policies
2.1. Statement of compliance
These condensed interim financial statements have been prepared in accordance with IAS 34 “Interim
Financial Reporting”, and should be read in conjunction with the annual financial statements of NLB Group
and NLB for the year ended 31 December 2017, which have been prepared in accordance with the
International Financial Reporting Standards (hereinafter: ‘IFRS’), as adopted by the European Union.
2.2. Accounting policies
The same accounting policies and methods of computation were followed in the preparation of these
consolidated condensed interim financial statements as for the year ended 31 December 2017, except for
accounting standards and other amendments effective for annual periods beginning on 1 January 2018 that
were endorsed by the EU.
Accounting standards and amendments to existing standards that were endorsed by the EU, and
adopted by NLB Group from 1 January 2018
In July 2014, the IASB issued IFRS 9 Financial Instruments to replace IAS 39 Financial Instruments:
Recognition and Measurement. IFRS 9 introduces a new approach to financial instruments classification
and measurement, a new more forward-looking expected loss model, and amends the requirements for
hedge accounting. IFRS 9 is mandatorily effective for annual periods beginning on or after 1 January 2018,
with early application permitted. In October 2017, the IASB issued the Amendment to IFRS 9: Pre-payment
Features with Negative Compensation that are effective for annual periods beginning on or after 1 January
2019, with early adoption permitted. The amendment allows certain pre-payable financial assets with a
negative compensation pre-payment option to be measured at an amortised cost or fair value through other
comprehensive income, if the prepayment amount substantially represents the reasonable compensation
and unpaid principal and interest. Reasonable compensation may be positive or negative. Prior to this

59 NLB Group Interim report Q3 2018
amendment financial assets with this negative compensation feature would have failed the exclusive
payments of principal and interest test, and be mandatorily measured at fair value through profit or loss.
This amendment has not yet been endorsed by EU but nevertheless, it will not impact NLB Group’s financial
statements.
In accordance with the transition requirements of IFRS 9, comparative amounts have not been restated
(note 2.3.).
Classification and measurement under IFRS 9
From a classification and measurement perspective, IFRS 9 requires all debt financial assets to be
assessed based on a combination of the Group’s business model for managing the assets and the
instruments’ contractual cash flow characteristics. The IAS 39 measurement categories of financial assets
have been replaced by:
• financial assets, measured at amortised costs (AC),
• financial assets at fair value through other comprehensive income (FVOCI),
• financial assets held for trading (FVTPL), and
• non-trading financial assets, mandatorily at fair value through profit or loss (FVTPL).
Financial assets are measured at AC if they are held within a business model for the purpose of collecting
contractual cash flows (‘held to collect’), and if cash flows are solely payments of principal and interest on
the principal amount outstanding.
Debt financial instruments are measured at FVOCI if they are held within a business model for the purpose
of both collecting contractual cash flows and selling (‘held to collect and sell’), and if cash flows are solely
payments of principal and interest on the principal amount outstanding. FVOCI results in the debt
instruments being recognised at fair value in the statement of financial position and at AC in the income
statement. Gains and losses, except for expected credit losses and foreign currency translations, are
recognised in other comprehensive income until the instrument is derecognised. At derecognition of the
debt financial instrument, the cumulative gains and losses previously recognised in other comprehensive
income are reclassified to the income statement.
Equity instruments that are not held for trading may be irrevocably designated as FVOCI, with no
subsequent reclassification of gains or losses to the income statement, except for dividends that are
recognised in the income statement.
All other financial assets are mandatorily measured at FVTPL, including financial assets within other
business models such as financial assets managed at fair value or held for trading, and financial assets with
contractual cash flows that are not solely payments of principal and interest on the principal amount
outstanding. In the Statement of Financial Position they are presented in line “Financial assets held for
trading” or “Non-trading financial assets mandatorily at fair value through profit or loss.” In some cases, fair
value of assets can be negative (for example fair value of undrawn credit commitments). In such cases are
negative fair values included in line 'Financial liabilities at fair value through profit or loss.'
60 NLB Group Interim report Q3 2018
Like IAS 39, IFRS 9 includes an option to designate financial assets at fair value through profit or loss if
doing so eliminates or significantly reduces a measurement or recognition inconsistency that would
otherwise arise from measuring assets or liabilities, or recognising the gains or losses on them on different
bases.
The accounting for financial liabilities remained the same as the requirements of IAS 39, except for the
treatment of gains or losses arising from the bank’s own credit risk relating to liabilities designated at
FVTPL. Such movements are presented in OCI with no subsequent reclassification to the income
statement.
NLB Group and NLB elected, as a policy choice permitted under IFRS 9, to continue to apply hedge
accounting requirements in accordance with IAS 39. However, the Bank will implement the revised hedge
accounting disclosures that are required by the IFRS 9 related amendments to IFRS 7 “Financial
Instruments: Disclosures” in the 2018 Annual Report. Embedded derivatives are under IFRS 9, and are no
longer separated from the host’s financial assets. Instead, financial assets are classified based on the
business model and their contractual terms. The accounting for derivatives embedded in financial liabilities
and in non-financial host contracts has not changed.
Assessment of NLB Group’s business model
NLB Group has determined its business model separately for each reporting unit within NLB Group.It is
based on observable factors for different portfolios that best reflect how the Group manages groups of
financial assets to achieve its business objective, such as:
• how the performance of the business model and the financial assets held within that business model are
evaluated and reported to key management personnel,
• the risks that affect the performance of the business model and, in particular, the way those risks are
managed,
• how the managers of the business are compensated (e.g. whether the compensation is based on the fair
value of the assets or on collection of contractual cash flows),
• the expected frequency, value, and timing of sales.
The business model assessment is based on reasonably expected scenarios without taking worst-case and
stress case scenarios into account. In general, the business model assessment of the Group can be
summarised as follows:
• loans and deposits given are included in a business model ‘held to collect’ since the primary purpose of
NLB Group for the loan portfolio is to collect the contractual cash flows,
• debt securities are divided into three business models:
• the first group of debt securities presents “held for trading” category
• the second group of debt securities are held under a business model “held to collect and sale” with
the aim to collect the contractual cash flows and sale of financial assets, and forms part of the
Group’s liquidity reserves
• the third part of debt securities is held within the business model for holding them in order to collect
contractual cash flows.

61 NLB Group Interim report Q3 2018
With regard to debt securities within the ‘held to collect’ business model, the sales which are related to the
increase of the issuers’ credit risk, concentrations risk, sales made close to the final maturity, or sales
orders to meet liquidity needs in a stress case scenario are permitted. Other sales, which are not due to an
increase in credit risk may still be consistent with a held to collect business model if such sales are
incidental to the overall business model and;
• are insignificant in value both individually and in aggregate, even when such sales are frequent;
• are infrequent even when they are significant in value.
Review of instruments’ contractual cash flow characteristics (the SPPI test – solely payment of principal and
interest on the principal amount outstanding)
The second step in the classification of the financial assets in portfolios being ‘held to collect’ and ‘held to
collect and sell’ relates to the assessment of whether the contractual cash flows are consistent with the
SPPI test. The principal amount reflects the fair value at initial recognition less any subsequent changes,
e.g. due to repayment. The interest must represent only the consideration for the time value of money,
credit risk, other basic lending risks, and a profit margin consistent with basic lending features. If the cash
flows introduce more than de minimis exposure to risk or volatility that is not consistent with basic lending
features, the financial asset is mandatorily recognised at FVTPL.
NLB Group reviewed the portfolio within ‘held to collect’ and ‘held to collect and sale’ for standardised
products on a level of a product sample, and for non-standardised products on a single exposure level. The
Group established a procedure for SPPI identification as part of regular investment process with defined
responsibilities for primary and secondary controls. Special emphasis was put on new and non-
standardised characteristics of the loan agreements.
At transition to IFRS 9, as at 1 January 2018, NLB Group identified only a few exposures that did not pass
the SPPI test, and are therefore measured mandatorily at fair value through profit or loss.
Accounting policy for modified financial assets
The accounting policy for modified financial assets differentiates between modifications of contractual cash
flows that occur from commercial reasons and those occurring due to financial difficulties of a client.
Modifications of financial assets due to commercial reasons present the derecognition event. In relation to
clients in financial difficulties, significant modifications lead to derecognition event whereas modifications
that are not significant (where exposure to risks remains broadly the same) do not lead to derecognition. For
the latter, NLB Group recognises modification gain or loss.
Impairment of financial instruments
IFRS 9 requires the shift from an incurred loss model to an expected loss model that provides an unbiased
and probability-weighted estimate of credit losses by evaluating a range of possible outcomes that
incorporates forecasts of future economic conditions. The expected loss model requires NLB Group to
recognise not only credit losses that have already occurred, but also losses that are expected to occur in

62 NLB Group Interim report Q3 2018
the future. An allowance for expected credit losses (ECL) is required for all loans and other debt financial
assets not held at FVTPL, together with loan commitments and financial guarantee contracts.
The allowance is based on the expected credit losses associated with the probability of default in the next
12 months unless there has been a significant increase in credit risk since initial recognition, in which case,
the allowance is based on the probability of default over the life of the financial asset (LECL). When
determining whether the risk of default has increased significantly since initial recognition, the Group
considers reasonable and supportable information that is relevant and available without undue cost or
effort. This includes both quantitative and qualitative information and analysis based on the Group’s
historical data, experience, and expert credit assessment and incorporation of forward-looking information.
Classification into stages
NLB Group prepared a methodology for ECL defining the criteria for classification into stages, transition
criteria between stages, risk indicators calculation, and validation of models. The Group classifies financial
instruments into Stage 1, Stage 2, and Stage 3, based on the applied impairment methodology as
described below:
• Stage 1 – performing portfolio: no significant increase of credit risk since initial recognition, NLB Group
recognises an allowance based on a 12-month period,
• Stage 2 – underperforming portfolio: significant increase in credit risk since initial recognition, NLB
Group recognises an allowance for a lifetime period, and
• Stage 3 – impaired portfolio: NLB Group recognises lifetime allowances for these financial assets.
Definition of default is harmonised with EBA guidelines.
A significant increase in credit risk is assumed:
• when a credit rating significantly deteriorates at the reporting date, in comparison to the credit rating at
initial recognition,
• when a financial asset has material delays over 30 days (days past due are also included in the credit
rating assessment),
• if NLB Group expects to grant the borrower forbearance, or
• if the facility is placed on the watch list.
The methodology of credit rating for banks and sovereign classification depends on the existence or non-
existence of a rating from international credit rating agencies Fitch, Moody’s, or S&P. Ratings are set on a
basis of the average international credit rating. If there are no international credit ratings, the classification is
based on the internal methodology of NLB Group.
ECL for Stage 1 financial assets is calculated based on 12-month PDs (probability of default) or shorter
period PDs, if the maturity of the financial asset is shorter than 1 year. The 12-month PD already includes a
macroeconomic impact effect. Impairment losses in stage 1 are designed to reflect impairment losses that
had been incurred in the performing portfolio, but have not been identified.
LECL for Stage 2 financial assets is calculated on the basis of lifetime PDs (LPD) because their credit risk
has increased significantly since their initial recognition. This calculation is also based on a forward-looking

63 NLB Group Interim report Q3 2018
assessment that takes into account a number of economic scenarios in order to recognise the probability of
losses associated with the predicted macro-economic forecasts.
For financial instruments in Stage 3, the same treatment is applied as for those considered to be credit
impaired in accordance with IAS 39. Exposures below the materiality threshold obtain collective provisions
using PD of 100%. Financial instruments will be transferred out of Stage 3 if they no longer meet the criteria
of credit-impaired after a probation period. Special treatment applies for purchased or originated credit-
impaired financial instruments (POCI), where only the cumulative changes in the lifetime expected losses
since initial recognition is recognised a loss allowance.
The calculation of collective provisions is performed by multiplying the EAD (exposure at default) at the end
of each month with an appropriate PD and LGD (loss-given default). EAD is determined as the sum of on-
balance exposure and off-balance exposure multiplied by the CCF (credit conversion factor). The obtained
result for each month is discounted to the present time. For Stage 1 exposures ECL, only takes a 12-month
period into account, while for Stage 2 all potential losses until maturity date are included.
For the purpose of estimating the LGD parameter, NLB uses collateral HC (hair-cut) at the level of each
type of collateral and URR (unsecured recovery rate) at the level of each client segment, in accordance with
Bank of Slovenia Guidelines. Both parameters are calculated on the bank’s historical repayment data.
Expected Life
When measuring ECL, the Bank must consider the maximum contractual period over which the Bank is
exposed to credit risk. For certain revolving credit facilities that do not have a fixed maturity, the expected
life is estimated based on the period over which the Bank is exposed to credit risk and where the credit
losses would not be mitigated by management actions.
Forward-looking information
The Group incorporates forward-looking information in both the assessment of significant increase in credit
risk and the measurement of ECL. The Group considers forward-looking information such as
macroeconomic factors (e.g., unemployment rate, GDP growth, interest rates, and housing prices) and
economic forecasts. The baseline scenario represents the more likely outcome resulting from the Group’s
normal budgeting process, while the better and worse-case scenarios represent more optimistic or
pessimistic outcomes (similar as by ICAAP).
Recalculation of all parameters is performed annually or more frequently if the macro environment changes
more than it was incorporated in previous forecasts. In such a case all the parameters are recalculated
according to new forecasts.

64 NLB Group Interim report Q3 2018
Presentation of effects at transition to IFRS 9 as of 1 January 2018
An adjustment arising from the adoption of IFRS 9 was recognised in retained earnings and other
comprehensive income as at 1 January 2018. Due to the transition to IFRS 9 requirements, shareholders
equity of NLB Group increased by EUR 43.8 million and EUR 27.7 million for NLB. The Tier 1 capital ratio
for NLB Group increased by 0.4 percentage points (as at 1 January 2018). NLB Group will not apply
transitional arrangements at the transition to the expected credit loss model in accordance with Regulation
(EU) 2017/2395. A summary of the effects at the transition to IFRS 9 as at 1 January 2018 are presented
below:
in EUR thousand NLB Group NLB
Impact on equity due to transition to IFRS 9 - details
Changed methodology for impairments and provisions 58.160 37.319
Remeasurement of loans to fair value 36 (687)
Recognition of modification loss (1.049) (1.049)
Reclassification and remeasurement of securities (7.504) (5.267)
Income tax on transition (3.529) (2.650)
Total impact 46.114 27.666
Minority share (2.281) -
Total impact attributable to the owners of the parent 43.833 27.666
The following table shows the original measurement categories in accordance with IAS 39, and the new
measurement categories under IFRS 9 for the financial assets as at 1 January 2018.
in EUR thousand
Original classification
under IAS 39
New classification
under IFRS 9
Original
carrying
amount under
IAS 39
New carrying
amount under
IFRS 9
Original
carrying
amount under
IAS 39
New carrying
amount under
IFRS 9
Financial assets - 1 January 2018
Cash, cash balnaces at central banks, and other demand
deposits at banks Loans and receivables Amortised cost 1,256,481 1,255,824 570,010 569,943
Loans and advances - debt securities Loans and receivables Amortised cost 82,133 79,880 82,133 79,880
Loans and advances to banks Loans and receivables Amortised cost 510,107 509,970 462,322 461,830
Loans and advances to customers Loans and receivables Amortised cost 6,887,300 6,956,362 4,556,105 4,594,286
Loans and advances to customers Loans and receivables FVTPL mandatory 25,033 24,649 31,372 30,055
Loans and advances - other financial assets Loans and receivables Amortised cost 66,077 67,046 38,389 38,915
Trading assets FVTPL FVTPL 72,189 72,189 72,180 72,180
Financial assets designated at fair value through profit or loss FVTPL designated FVTPL mandatory 5,003 5,003 634 634
Available-for-sale financila assets - debt instruments AFS FVOCI 1,604,940 1,604,940 1,238,977 1,238,977
Available-for-sale financila assets - debt instruments AFS Amortised cost 618,376 612,317 491,936 488,992
Available-for-sale financila assets - equity instruments AFS FVTPL mandatory 1,752 1,752 550 550
Available-for-sale financila assets - equity instruments AFS FVOCI designated 51,425 51,425 46,299 46,299
Held-to-maturity financila assets HTM Amortised cost 609,712 609,216 609,712 609,216
Total 11,790,528 11,850,573 8,200,619 8,231,757
NLB Group NLB

65 NLB Group Interim report Q3 2018
The following table reconciles the carrying amounts under IAS 39 to the carrying amounts under IFRS 9 on
transition to IFRS 9 on 1 January 2018.
in EUR thousand
NLB Group Ref
IAS 39 carrying amount
31 December 2017 Reclassification Remeasurement
IFRS 9 carrying
amount
1 January 2018
Amortised Cost
Cash, cash balances at central banks, and other demand deposits at banks
Opening balance 1,256,481
Remeasurement: ECL allowance (657)
Closing balance 1,255,824
Loans and advances to banks
Opening balance 510,107
Remeasurement: ECL allowance (137)
Closing balance 509,970
Loans and advances to customers
Opening balance 6,912,333
Subtraction: to financial assets FVTPL (mandatory) (A) (25,033)
Remeasurement: ECL allowance 76,471
Remeasurement: modifications (7,409)
Closing balance 6,956,362
Other financial assets
Opening balance 66,077
Remeasurement: ECL allowance 838
Remeasurement: other adjustments 131
Closing balance 67,046
Debt securities
Opening balance 82,133
Addition: from financial assets available-for-sale (B) 618,376
Addition: from financial assets held-to-maturity (C ) 609,712
Remeasurement: from fair value to amortised cost (4,476)
Remeasurement: ECL allowance (2,096)
Remeasurement: reclassified bonds (D) (2,236)
Closing balance 1,301,413
Held-to-maturity investments
Opening balance 609,712
Subtraction: to debt securities - amortised cost (C ) (609,712)
Closing balance 0
Total financial assets measured at amortised cost 9,436,843 10,090,615
Fair value through other comprehensive income (FVOCI)
Financial assets available for sale
Opening balance 2,276,493
Subtraction: to FVOCI - debt instruments (E) (1,604,940)
Subtraction: to FVOCI - equity instruments (F) (51,425)
Subtraction: to amortised cost - debt securities (B) (618,376)
Subtraction: to FVTPL (mandatory) (G) (1,752)
Closing balance 0
FVOCI - debt instruments
Opening balance 0
Addition: from financial assets available-for-sale (E) 1,604,940
Closing balance 1,604,940
FVOCI - equity instruments
Opening balance 0
Addition: from financial assets available-for-sale (F) 51,425
Closing balance 51,425
Total financial assets measured at fair value through other comprehensive
income 2,276,493 1,656,365
Fair value through profit and loss (FVTPL)
Trading assets
Opening balance and closing balance 72,189 72,189
Financial assets FVTPL (designated)
Opening balance 5,003
Subtraction: to financial assets FVTPL (mandatory) (H) (5,003)
Closing balance 0
Financial assets FVTPL (mandatory)
Opening balance 0
Addition: from financial assets FVTPL (designated) (H) 5,003
Addition: from financial assets available-for-sale (G) 1,752
Addition: from loans and advances to customers (A) 25,033
Remeasurement: from amortised cost to fair value (384)
Closing balance 31,404
Total financial assets measured at fair value through profit and loss 77,192 103,593

66 NLB Group Interim report Q3 2018
in EUR thousand
NLB Ref
IAS 39 carrying amount
31 December 2017 Reclassification Remeasurement
IFRS 9 carrying
amount
1 January 2018
Amortised Cost
Cash, cash balances at central banks, and other demand deposits at banks
Opening balance 570,010
Remeasurement: ECL allowance (67)
Closing balance 569,943
Loans and advances to banks
Opening balance 462,322
Remeasurement: ECL allowance (492)
Closing balance 461,830
Loans and advances to customers
Opening balance 4,587,477
Subtraction: to financial assets FVTPL (mandatory) (A) (31,372)
Remeasurement: ECL allowance 45,590
Remeasurement: modifications (7,409)
Closing balance 4,594,286
Other financial assets
Opening balance 38,389
Remeasurement: ECL allowance 526
Closing balance 38,915
Debt securities
Opening balance 82,133
Addition: from financial assets available-for-sale (B) 491,936
Addition: from financial assets held-to-maturity (C ) 609,712
Remeasurement: from fair value to amortised cost (2,232)
Remeasurement: ECL allowance (1,225)
Remeasurement: reclassified bonds (D) (2,236)
Closing balance 1,178,088
Held-to-maturity investments
Opening balance 609,712
Subtraction: to debt securities - amortised cost (C ) (609,712)
Closing balance 0
Total financial assets measured at amortised cost 6,350,043 6,843,062
Fair value through other comprehensive income (FVOCI)
Financial assets available for sale
Opening balance 1,777,762
Subtraction: to FVOCI - debt instruments (E) (1,238,977)
Subtraction: to FVOCI - equity instruments (F) (46,299)
Subtraction: to amortised cost - debt securities (B) (491,936)
Subtraction: to FVTPL (mandatory) (G) (550)
Closing balance 0
FVOCI - debt instruments
Opening balance 0
Addition: from financial assets available-for-sale (E) 1,238,977
Closing balance 1,238,977
FVOCI - equity instruments
Opening balance 0
Addition: from financial assets available-for-sale (F) 46,299
Closing balance 46,299
Total financial assets measured at fair value through other comprehensive
income 1,777,762 1,285,276
Fair value through profit and loss (FVTPL)
Trading assets
Opening balance and closing balance 72,180 72,180
Financial assets FVTPL (designated)
Opening balance 634
Subtraction: to financial assets FVTPL (mandatory) (H) (634)
Closing balance 0
Financial assets FVTPL (mandatory)
Opening balance 0
Addition: from financial assets FVTPL (designated) (H) 634
Addition: from financial assets available-for-sale (G) 550
Addition: from loans and advances to customers (A) 31,372
Remeasurement: from amortised cost to fair value (1,317)
Closing balance 31,239
Total financial assets measured at fair value through profit and loss 72,814 103,419
(A) Certain loans and advances to customers that were under IAS 39 classified as Loans and advances
measured at amortised costs, under IFRS 9 meet the criteria for mandatory measurement at FVTPL
because the contractual cash flows of these assets are not solely payments of principal and interest on
the outstanding principal.
67 NLB Group Interim report Q3 2018
(B) Certain debt securities held by the Group may be sold, but such sales are not expected to be more
than infrequent or significant. These securities are held within a business model whose objective is to
hold assets to collect the contractual cash flows, and are therefore measured at amortised cost under
IFRS 9.
(C) Debt instruments previously classified as held to maturity have been reclassified to amortised cost
under IFRS 9, as their previous category under IAS 39 was diminished.
(D) During the year 2009 NLB Group reclassified certain bonds from the trading category to loans and
advances, since it had a positive intent and ability to hold them for the foreseeable future or until
maturity, rather than trade in the short term. The fair value of reclassified bonds on the date of
reclassification became their new amortised cost. At the transition to IFRS 9, NLB Group recalculated
amortised cost of these securities as if they had been measured at the amortised cost since their initial
recognition.
(E) The Group holds certain debt securities to meet everyday liquidity needs. Under IFRS 9 these
securities are held within a business model whose objective is achieved by both collecting contractual
cash flows and selling financial assets, and are threfore measured at fair falue through other
comprehensive income.
(F) Certain equity investments held by the Group have been designated under IFRS 9 as at FVOCI,
because they are not strategic and the Group can't control them. The changes in fair value of such
investments will no longer be recognised in profit or loss, not even in the case of disposal. Before the
adoption of IFRS 9, these investments were classified as available for sale.
(G) For certain equity investments, management didn't make an irrevocable election at initial recognition
that subsequent changes in fair value would be measured at fair value through other comprehensive
income. These assets are, in accordance with IFRS 9, classified as mandatorily measured at FVTPL.
(H) Before the adoption of IFRS 9, certain investments in funds were managed and evaluated on a fair
value basis. Under IFRS 9, these investments are part of an "other" business model and so required to
be classified as FVTPL. Additionally, some equity investments were designated at FVTPL in order to
reduce accounting missmatch that would otherwise arise. Under IFRS 9 these investments are
mandatorily measured at FVTPL.
The following table reconciles:
• the closing balance of the loan loss allowance for credit losses for financial assets in accordance with
IAS 39 and provisions for credit losses for loan commitments and financial guarantee contracts in
accordance with IAS 37 as at 31 December 2017; to
• the opening balance of the loan loss allowance determined in accordance with IFRS 9 as at 1 January
2018.

68 NLB Group Interim report Q3 2018
in EUR thousand
Measurement category
31 December 2017
Loan loss allowance
under IAS 39/
Provision under
IAS 37
Interest loss
allowance
31 December
2017 Reclassification Remeasurement
1 January 2018
Loan loss
allowance under
IFRS 9
Loans and receivables under IAS 39/financial assets at amortised cost under
IFRS 9
Cash, cash balnaces at central banks, and other demand deposits at banks - - - 657 657
Loans and advances - debt securities - - - 17 17
Loans and advances to banks 576 - - 137 713
Loans and advances to customers 646,752 7,347 (27,737) (76,471) 549,891
Loans and advances - other financial assets 11,705 1 - (838) 10,868
Held to maturity securities under IAS 39/financial assets at amortised cost
under IFRS 9 73 - - 496 569
Available for sale debt investment securities under IAS 39/financial assets at
amortised cost under IFRS 9 - - - 1,583 1,583
Available for sale debt investment securities under IAS 39/debt financial
assets at FVOCI under IFRS 9 - - - 4,487 4,487
Loan commitments and financial guarantee contract issued 36,915 - (5,435) 10,785 42,265
Total 696,021 7,348 (33,172) (59,147) 611,050
NLB Group
in EUR thousand
Measurement category
31 December 2017
Loan loss allowance
under IAS 39/
Provision under
IAS 37
Interest loss
allowance
31 December
2017 Reclassification Remeasurement
1 January 2018
Loan loss
allowance under
IFRS 9
Loans and receivables under IAS 39/financial assets at amortised cost under
IFRS 9
Cash, cash balnaces at central banks, and other demand deposits at banks - - - 67 67
Loans and advances - debt securities - - - 17 17
Loans and advances to banks - - - 492 492
Loans and advances to customers 317,063 6,738 (25,753) (45,590) 252,458
Loans and advances - other financial assets 3,191 1 - (526) 2,666
Held to maturity securities under IAS 39/financial assets at amortised cost
under IFRS 9 73 - - 496 569
Available for sale debt investment securities under IAS 39/financial assets at
amortised cost under IFRS 9 - - - 712 712
Available for sale debt investment securities under IAS 39/debt financial
assets at FVOCI under IFRS 9 - - - 2,190 2,190
Loan commitments and financial guarantee contract issued 34,257 - (5,037) 1,452 30,672
Total 354,584 6,739 (30,790) (40,690) 289,843
NLB
For financial assets that have been reclassified to the amortised cost category, the following table shows
their fair value as at 30 September 2018, and the fair value gain or loss that would have been recognised if
these financial assets had not been reclassified as part of the transition to IFRS 9.
in EUR thousand From available-for-sale financial assets under IAS 39 NLB Group NLB
Fair value as at 30 September 2018 364,065 303,915
Fair value gain/loss that would have been recognised during the year in OCI if
the financial assets had not been reclassified 1,318 1,030
Other accounting standards and amendments to existing standards that were endorsed by the EU, and
adopted by NLB Group from 1 January 2018, but do not have material effects on NLB Group’s financial
statements are:
• IFRS 15 (new standard) – Revenue from Contracts with Customers (effective for annual periods
beginning on or after 1 January 2018)
• IFRS 15 (clarification) – Revenue from Contracts with Customers (effective for annual periods beginning
on or after 1 January 2018)

69 NLB Group Interim report Q3 2018
• IFRS 4 (amendment) – Applying IFRS 9 Financial Instruments with IFRS 4 Insurance Contracts
(effective for annual periods beginning on or after 1 January 2018)
• IFRS 2 (amendment) – Classification and Measurement of share based Payment Transactions (effective
for annual periods beginning on or after 1 January 2018)
• Annual Improvements to IFRS’s’ 2014–2016 Cycle. The improvements comprise a mixture of
substantive changes and clarifications, and are effective for annual periods beginning on or after 1
January 2017 or 1 January 2018
• IAS 40 (amendment) – Investment Property (effective for annual periods beginning on or after 1 January
2018)
• IFRIC Interpretation 22 Foreign Currency Transactions and Advance Consideration (effective for annual
periods beginning on or after 1 January 2018)
Accounting standards and amendments to existing standards that were endorsed by the EU, but not
adopted early by NLB Group
• IFRS 16 (new standard) – Leases (effective for annual periods beginning on or after 1 January 2019)
• IFRS 9 (amendment) – Prepayment Features with Negative Compensation (effective for annual periods
beginning on or after 1 January 2019)
Accounting standards and amendments to existing standards issued but not endorsed by the EU
• IFRS 17 (new standard) – Insurance Contracts (effective for annual periods beginning on or after 1
January 2021)
• IFRIC 23 Uncertainty over Income Tax Treatments (effective for annual periods beginning on or after 1
January 2019)
• Annual Improvements to IFRS’s’ 2015–2017 Cycle. The improvements comprise a mixture of
substantive changes and clarifications, and are effective for annual periods beginning on or after 1
January 2019
• IAS 28 (amendment) – Long-term Interests in Associates and Joint Ventures (effective for annual
periods beginning on or after 1 January 2019)
• IAS 19 (amendment) – Plan Amendment, Curtailment or Settlement (effective for annual periods
beginning on or after 1 January 2019)

70 NLB Group Interim report Q3 2018
2.3. Comparative amounts
Compared to the presentation of the financial statements for the year ended 31 December 2017, the
schemes for presentation of the Income Statement and Statement of Financial Position changed due to
implementation of IFRS 9, and due to changed schemes prescribed by the Bank of Slovenia. Since
comparative figures have not been restated on transition to IFRS 9, the presentation of financial statements
in these condensed financial statements is a combination of classification and measurement categories as
required by IAS 39 (for balances as of 31 December 2017 and effects for nine months ended 30 September
2017), and classification and IFRS 9 (for balances as of 1 January 2018 and 30 September 2018 and
effects for nine months ended 30 September 2018). Due to implementation of IFRS 9, IAS 1also changed
and requires “interest revenue calculated using the effective interest method” to be shown separately.
Comparative amounts in the Income statement have been adjusted to reflect this change.
Changes of the schemes prescribed by the Bank of Slovenia relate to presentation of effects related to
investments in subsidiaries, associates, and joint ventures in the Income Statements. Comparative amounts
have been adjusted to reflect these changes in presentation.
in EUR thousand
old
presentation
current
presentation change
old
presentation
current
presentation change
Dividend income 153 153 - 28 48,057 48,029
Gains less losses from capital investment in subsidiaries,
associates and joint ventures 2,816 - (2,816) 48,188 - (48,188)
Share of profit from investment in associates and joint ventures
(accounted for using the equity method) - 3,738 3,738 - - -
Gains less losses from non-current assets held for sale (1,129) (2,051) (922) 418 577 159
Sep 2017 Sep 2017
nine months ended nine months ended
NLB Group NLB
More specifically, in the Income Statement for the year ended 31 December 2017 line “Gains less losses
from capital investments in subsidiaries, associates, and joint ventures” included dividends and effects from
the sale of investments in subsidiaries, associates, and the joint ventures, and effects from the equity
method from investments in associates and joint ventures. In these interim financial statements the
dividends from subsidiaries, associates, and joint ventures are included in line “Dividend income” and the
effects from sale of investments in subsidiaries, associates, and joint ventures are included in line “Net gain
or losses from non-current assets held for sale.”

71 NLB Group Interim report Q3 2018
3. Changes in NLB Group
Nine months ended 30 September 2018
Capital changes
• An increase in share capital in the form of a cash contribution in the amount of EUR 300 thousand in
NLB Prospera Plus d.o.o, Ljubljana for covering operating costs.
Other changes
• In March 2018, NLB Group sold its core subsidiary NLB Nov Penziski Fond, Skopje (note 4.12. and
5.13.).
• NLB Interfinanz, Praga – v likvidaci and NLB Interfinanz, Belgrade – u likvidaciji are formally in
liquidation.
• In May 2018 S-REAM, poslovanje z nepremičninami, d.o.o. Ljubljana was established and will manage
certain real estate in NLB Group. NLB’s ownership is 100%.
• In June 2018 NLB Propria d.o.o., Ljubljana was liquidated. In accordance with a court order, the
company was removed from the court register.
• In September 2018, NLB sold its associate Skupna pokojninska družba d. d., Ljubljana (note 4.12.).
Changes in 2017
Capital changes
• An increase in share capital in the form of a cash contribution in the amount of EUR 10,909 thousand in
NLB Banka Belgrade, REAM d.o.o. Belgrade and REAM d.o.o. Zagreb to ensure an increase in
business operations.
• An increase in share capital in the form of cash contributions in the amount of EUR 75 thousand in CBS
Invest, Sarajevo to ensure capital adequacy until the end of liquidation.
• NLB acquired shares of NLB Banka, Podgorica, and thereby increased its ownership from 99.36% to
99.83%. The increase in the capital investment was recognised in the amount of EUR 125 thousand.
• An increase in share capital in the form of a cash contribution in the amount of EUR 212 thousand in
Prvi Faktor d.o.o., Belgrade – u likvidaciji to ensure capital adequacy until the end of the liquidation. Now
NLB has directly 5% ownership in the company.
Other changes
• Kreditni biro SISBON was liquidated. In accordance with a court order, the company was removed from
the court register.
• SPV 2 d.o.o., Novi Sad was established and will manage certain real estate in NLB Group. NLB’s
ownership is 100%. In August 2017 headquarters of the company was moved to Belgrade, and so the
company is now called SPV 2 d.o.o., Belgrade.
• In July 2017, NLB sold its non-core subsidiary NLB Factoring – “v likvidaci,” Brno.
• NLB Prospera Plus d.o.o., Ljubljana – v likvidaciji and NLB Leasing d.o.o. – v likvidaciji, Ljubljana are
formally in liquidation.

72 NLB Group Interim report Q3 2018
4. Notes to the condensed income statement
4.1. Interest income and expenses
in EUR thousand
Sep Sep Sep Sep Sep Sep Sep Sep
2018 2017 2018 2017 2018 2017 2018 2017
Interest and similar income
Interest income, using the effective interest method 90,193 90,786 261,696 265,653 -1% 44,869 45,085 130,235 134,514 -3%
Loans and advances to customers at amortised cost 78,337 - 226,635 - - 36,066 - 104,215 - -
Securities measured at amortised cost 5,697 - 17,035 - - 4,710 - 14,087 - -
Financial assets measured at fair value through other comprehensive income 5,308 - 15,475 - - 3,285 - 9,589 - -
Loans and advances to banks measured at amortised cost 562 - 1,709 - - 660 - 1,925 - -
Loans and advances to customers - 80,002 - 231,441 - - 37,253 - 109,403 -
Available-for-sale financial assets - 6,266 - 20,095 - - 3,261 - 10,696 -
Held-to-maturity investments - 3,802 - 12,339 - - 3,802 - 12,339 -
Loans and advances to banks and central banks - 489 - 1,165 - - 661 - 1,787 -
Deposits with banks and central banks 289 227 842 613 37% 148 108 419 289 45%
Interest income, not using the effective interest method 1,397 1,382 5,022 5,261 -5% 1,418 1,382 5,081 5,261 -3%
Financial assets held for trading 1,338 1,382 4,186 5,261 -20% 1,338 1,382 4,186 5,261 -20%
Non-trading financial assets mandatorily at fair value through profit or loss 59 - 836 - - 80 - 895 - -
Total 91,590 92,168 266,718 270,914 -2% 46,287 46,467 135,316 139,775 -3%
Interest and similar expenses
Due to customers 6,165 6,971 19,089 22,453 -15% 1,329 2,054 4,439 6,961 -36%
Derivatives - hedge accounting 2,142 1,686 6,163 4,366 41% 2,142 1,686 6,163 4,366 41%
Financial liabilities held for trading 1,146 1,343 3,648 4,562 -20% 1,146 1,343 3,648 4,562 -20%
Borrowings from banks and central banks 390 617 1,121 1,861 -40% 331 428 895 1,367 -35%
Subordinated liabilities 244 380 1,031 1,194 -14% - - - - -
Borrowings from other customers 263 418 900 1,264 -29% - - - - -
Deposits from banks and central banks 33 63 139 142 -2% 74 52 186 113 65%
Debt securities in issue - 48 - 4,357 -100% - 48 - 4,357 -100%
Other financial liabilities 1,021 516 2,762 2,022 37% 906 423 2,406 1,686 43%
Total 11,404 12,042 34,853 42,221 -17% 5,928 6,034 17,737 23,412 -24%
Net interest income 80,186 80,126 231,865 228,693 1% 40,359 40,433 117,579 116,363 1%
three months ended three months ended
NLB Group NLB
nine months endednine months ended
change change
4.2. Dividend income
in EUR thousand
Sep Sep Sep Sep Sep Sep Sep Sep
2018 2017 2018 2017 2018 2017 2018 2017
Financial assets measured at fair value through other comprehensive income 12 - 109 - - 6 - 17 - -
Investments in subsidiaries, associates, and joint ventures - - - - - - 5,971 49,669 48,029 3%
Available-for-sale financial assets - 11 - 153 - - 4 - 28 -
Total 12 11 109 153 -29% 6 5,975 49,686 48,057 3%
changechange
three months ended three months ended
NLB Group NLB
nine months ended nine months ended
4.3. Fee and commission income and expenses
in EUR thousand
Sep Sep Sep Sep Sep Sep Sep Sep
2018 2017 2018 2017 2018 2017 2018 2017
Fee and commission income
Credit cards and ATMs 17,790 16,448 49,770 45,296 10% 10,485 10,487 30,909 29,317 5%
Payments 13,937 14,206 41,620 42,127 -1% 6,618 6,967 20,423 21,105 -3%
Customer transaction accounts 12,459 11,097 35,643 32,286 10% 9,295 8,217 26,517 24,364 9%
Investment funds 4,189 4,309 12,387 12,591 -2% 1,319 1,169 3,708 3,606 3%
Guarantees 2,742 2,755 8,023 8,299 -3% 1,807 1,808 5,245 5,459 -4%
Investment banking 2,115 2,158 6,802 5,814 17% 1,738 1,804 5,686 4,768 19%
Agency of insurance products 1,366 987 3,488 3,074 13% 1,044 984 3,161 3,063 3%
Other services 1,430 1,300 4,292 4,403 -3% 1,229 841 3,162 3,054 4%
Total 56,028 53,260 162,025 153,890 5% 33,535 32,277 98,811 94,736 4%
Fee and commission expenses
Credit cards and ATMs 11,928 10,146 31,663 28,155 12% 6,907 5,844 18,986 16,814 13%
Payments 1,661 1,518 4,464 4,193 6% 195 182 590 593 -1%
Investment banking 1,172 1,062 3,116 2,827 10% 822 789 2,141 2,024 6%
Insurance for holders of personal accounts and golden cards 279 346 1,004 1,274 -21% 214 240 821 878 -6%
Guarantees 38 45 153 166 -8% 9 30 32 119 -73%
Other services 550 687 1,666 2,066 -19% 273 327 842 889 -5%
Total 15,628 13,804 42,066 38,681 9% 8,420 7,412 23,412 21,317 10%
Net fee and commission income 40,400 39,456 119,959 115,209 4% 25,115 24,865 75,399 73,419 3%
change change
three months ended
NLB Group
three months ended
NLB
nine months endednine months ended

73 NLB Group Interim report Q3 2018
4.4. Gains less losses from financial assets and liabilities not classified as at fair value through
profit or loss
in EUR thousand
Sep Sep Sep Sep Sep Sep Sep Sep
2018 2017 2018 2017 2018 2017 2018 2017
Financial assets measured at fair value through other comprehensive income 99 - 416 - (28) - 260 -
Financial assets measured at amortised cost - - (6) - - - (6) -
Available-for-sale financial assets - 20 - 11,834 - 20 - 11,440
Financial liabilities measured at amortised cost - - 254 - - - - -
Total 99 20 664 11,834 (28) 20 254 11,440
nine months ended three months ended
NLBNLB Group
three months ended nine months ended
4.5. Gains less losses from financial assets and liabilities held for trading
in EUR thousand
Sep Sep Sep Sep Sep Sep Sep Sep
2018 2017 2018 2017 2018 2017 2018 2017
Foreign exchange trading 2,951 2,972 7,774 7,945 1,255 1,288 2,959 3,272
Derivatives 95 755 (497) 1,472 61 754 (510) 1,841
Debt instruments (61) (15) (374) (25) (61) (15) (374) (25)
Total 2,985 3,712 6,903 9,392 1,255 2,027 2,075 5,088
nine months ended
NLB Group NLB
three months ended three months ended nine months ended
4.6. Gains less losses from non-trading financial assets mandatorily at fair value through profit
or loss
in EUR thousand
Sep Sep Sep Sep Sep Sep Sep Sep
2018 2017 2018 2017 2018 2017 2018 2017
Equity securities 114 - 189 - 67 - 209 -
Loans and advances to customers 1,050 - 2,616 - 1,183 - 3,629 -
Total 1,164 - 2,805 - 1,250 - 3,838 -
three months ended
NLB Group NLB
three months endednine months ended nine months ended
4.7. Other operating income
in EUR thousand
Sep Sep Sep Sep Sep Sep Sep Sep
2018 2017 2018 2017 2018 2017 2018 2017
Income from non-banking services 1,924 2,987 6,502 9,099 -29% 1,506 2,088 4,228 6,166 -31%
Rental income from investment property 1,716 1,467 3,802 4,358 -13% 120 109 366 294 24%
Other operating income 1,570 1,396 3,216 5,283 -39% 746 279 1,588 3,048 -48%
Total 5,210 5,850 13,520 18,740 -28% 2,372 2,476 6,182 9,508 -35%
NLB Group NLB
nine months endednine months endedthree months ended three months ended
change change
4.8. Other operating expenses
in EUR thousand
Sep Sep Sep Sep Sep Sep Sep Sep
2018 2017 2018 2017 2018 2017 2018 2017
Deposit guarantee 2,023 2,228 11,722 11,394 3% - - 5,746 4,731 21%
Single Resolution Fund - - 2,506 2,590 -3% - - 2,506 2,590 -3%
Other taxes and compulsory public levies 740 710 2,292 2,160 6% 271 269 757 843 -10%
Membership fees and similar fees 177 279 549 801 -31% 66 170 216 492 -56%
Expenses related to issued service guarantees 1,293 98 1,461 281 420% 1,293 98 1,461 281 420%
Revaluation of investment property to fair value 197 750 289 798 -64% 20 750 65 750 -91%
Other operating expenses 850 413 3,226 1,555 107% 304 304 1,563 734 113%
Total 5,280 4,478 22,045 19,579 13% 1,954 1,591 12,314 10,421 18%
NLB Group NLB
nine months endednine months endedthree months ended three months ended
change change

74 NLB Group Interim report Q3 2018
4.9. Administrative expenses
in EUR thousand
Sep Sep Sep Sep Sep Sep Sep Sep
2018 2017 2018 2017 2018 2017 2018 2017
Employee costs 41,075 40,143 121,955 120,557 1% 25,792 25,221 76,218 75,662 1%
Other general and administrative expenses 22,476 21,605 67,919 66,459 2% 13,234 12,598 39,911 39,191 2%
Total 63,551 61,748 189,874 187,016 2% 39,026 37,819 116,129 114,853 1%
change change
three months ended
NLB Group
three months ended
NLB
nine months endednine months ended
4.10. Provisions for other liabilities and charges
in EUR thousand
Sep Sep Sep Sep Sep Sep Sep Sep
2018 2017 2018 2017 2018 2017 2018 2017
Guarantees and commitments (846) 165 (4,769) (5,830) (1,009) (556) (1,663) (5,003)
Provisions for legal issues 859 (2,760) 1,410 (2,043) (1) - 25 65
Provisions for restructuring (18) - (24) 17 - - - -
Other provisions - (537) - (505) - (531) - (531)
Total (5) (3,132) (3,383) (8,361) (1,010) (1,087) (1,638) (5,469)
three months ended
NLB Group NLB
nine months endednine months ended three months ended
4.11. Impairment charge
in EUR thousand
Sep Sep Sep Sep Sep Sep Sep Sep
2018 2017 2018 2017 2018 2017 2018 2017
Impairment of financial assets
Cash balances at central banks, and other demand deposits at banks (13) - (25) - 18 - 27 -
Loans and advances to banks measured at amortised cost (note 5.8.a) 44 - (341) - (122) - (348) -
Loans and advances to customers measured at amortised cost (note 5.8.a) (9,264) - (21,335) - (5,590) - (16,128) -
Debt securities measured at fair value through other comprehensive income (note 5.8.b) (269) - 290 - (82) - 220 -
Debt securities measured at amortised cost (note 5.8.b) 204 - 483 - 53 - (25) -
Other financial assets measured at amortised cost (note 5.8.a) 2,543 - 2,491 - 67 - (210) -
Loans and advances to customers (note 5.8.d) - (9,615) - (31,752) - (4,037) - (16,028)
Loans and advances to banks (note 5.8.d) - 386 - 257 - - - -
Held-to-maturity financial assets - 1 - (10) - 1 - (10)
Available-for-sale financial assets - (14) - (3) - (3) - (3)
Other financial assets (note 5.8.d) - 161 - 440 - 84 - 491
Impairment of investments in subsidiaries, associates, and joint ventures
Investments in subsidiaries - - - - 300 (38) (76) 37
Impairment of other assets
Property and equipment (50) - 70 - - - - -
Other assets 2,212 561 2,781 2,157 115 80 (43) 83
Total (4,593) (8,520) (15,586) (28,911) (5,241) (3,913) (16,583) (15,430)
three months ended
NLB Group NLB
nine months endednine months ended three months ended
NLB re-calculated risk parameters in the second quarter of 2018. The risk parameters were re-calculated by
including the 2017 historical data. As 2017 was a favourable period in terms of macroeconomic movements,
the impact on through-the-cycle (TTC) risk parameters was mainly favourable, which explains the release of
collective provisions in the amount of EUR 1.6 million on NLB Group level. The effect of recalculation of
PDs for collective provisions in 2017 in the segment of corporate clients amounted to approximately EUR 21
million. The volume of the impact in respective years are not directly comparable due to the change of the
models for estimating the risk parameters and increased data quality with the implementation of the IFRS 9.
In addition, IFRS 9 calculation based on one year or lifetime ECL varies significantly from the previous
methodology.
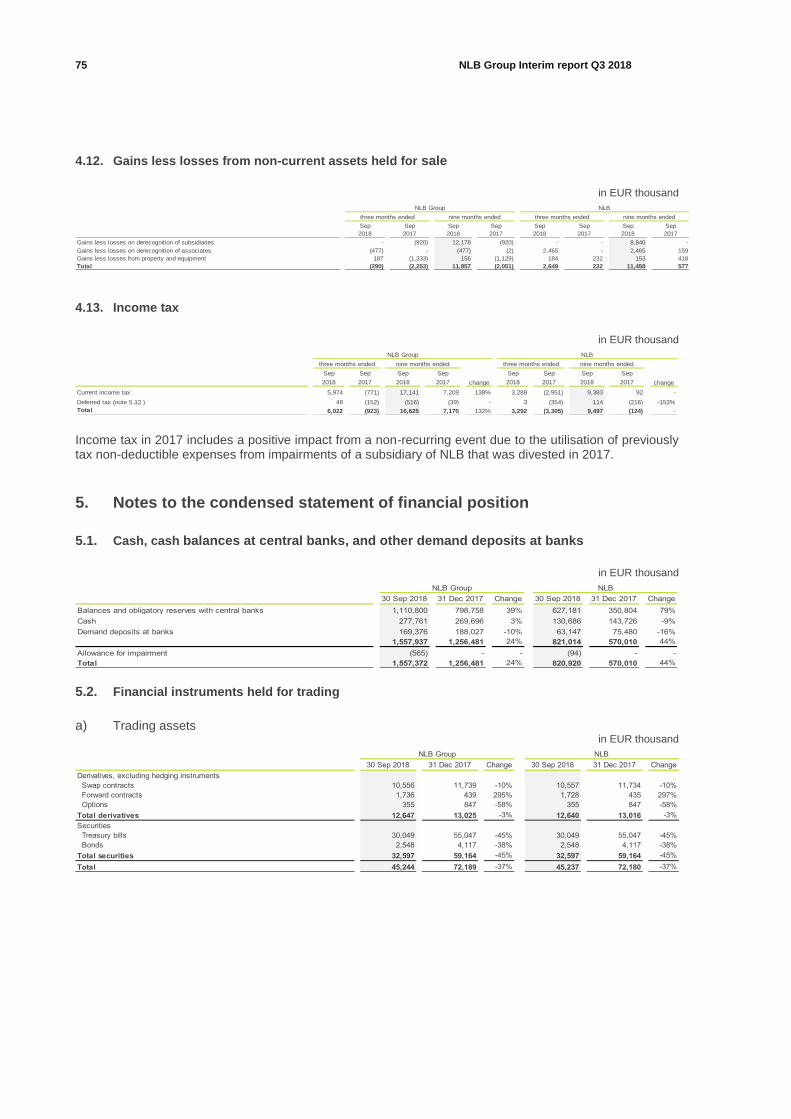
75 NLB Group Interim report Q3 2018
4.12. Gains less losses from non-current assets held for sale
in EUR thousand
Sep Sep Sep Sep Sep Sep Sep Sep
2018 2017 2018 2017 2018 2017 2018 2017
Gains less losses on derecognition of subsidiaries - (920) 12,178 (920) - - 8,840 -
Gains less losses on derecognition of associates (477) - (477) (2) 2,465 - 2,465 159
Gains less losses from property and equipment 187 (1,333) 156 (1,129) 184 232 153 418
Total (290) (2,253) 11,857 (2,051) 2,649 232 11,458 577
three months ended
NLB Group NLB
nine months ended nine months endedthree months ended
4.13. Income tax
in EUR thousand
Income tax in 2017 includes a positive impact from a non-recurring event due to the utilisation of previously tax non-deductible expenses from impairments of a subsidiary of NLB that was divested in 2017.
5. Notes to the condensed statement of financial position
5.1. Cash, cash balances at central banks, and other demand deposits at banks
in EUR thousand
30 Sep 2018 31 Dec 2017 Change 30 Sep 2018 31 Dec 2017 Change
Balances and obligatory reserves with central banks 1,110,800 798,758 39% 627,181 350,804 79%
Cash 277,761 269,696 3% 130,686 143,726 -9%
Demand deposits at banks 169,376 188,027 -10% 63,147 75,480 -16%
1,557,937 1,256,481 24% 821,014 570,010 44%
Allowance for impairment (565) - - (94) - -
Total 1,557,372 1,256,481 24% 820,920 570,010 44%
NLBNLB Group
5.2. Financial instruments held for trading
a) Trading assets in EUR thousand
30 Sep 2018 31 Dec 2017 Change 30 Sep 2018 31 Dec 2017 Change
Derivatives, excluding hedging instruments
Swap contracts 10,556 11,739 -10% 10,557 11,734 -10%
Forward contracts 1,736 439 295% 1,728 435 297%
Options 355 847 -58% 355 847 -58%
Total derivatives 12,647 13,025 -3% 12,640 13,016 -3%
Securities
Treasury bills 30,049 55,047 -45% 30,049 55,047 -45%
Bonds 2,548 4,117 -38% 2,548 4,117 -38%
Total securities 32,597 59,164 -45% 32,597 59,164 -45%
Total 45,244 72,189 -37% 45,237 72,180 -37%
NLBNLB Group
Sep Sep Sep Sep Sep Sep Sep Sep
2018 2017 2018 2017 2018 2017 2018 2017
Current income tax 5,974 (771) 17,141 7,209 138% 3,289 (2,951) 9,383 92 -
Deferred tax (note 5.12.) 48 (152) (516) (39) - 3 (354) 114 (216) -153%
Total 6,022 (923) 16,625 7,170 132% 3,292 (3,305) 9,497 (124) -
change change
three months ended
NLB Group NLB
nine months endednine months ended three months ended

76 NLB Group Interim report Q3 2018
b) Trading liabilities in EUR thousand
30 Sep 2018 31 Dec 2017 Change 30 Sep 2018 31 Dec 2017 Change
Derivatives, excluding hedging instruments
Swap contracts 8,163 8,855 -8% 8,172 8,751 -7%
Forward contracts 1,632 371 340% 1,627 371 339%
Options 192 276 -30% 192 276 -30%
Total 9,987 9,502 5% 9,991 9,398 6%
NLBNLB Group
5.3. Non-trading financial instruments measured at fair value through profit or loss
a) Financial instruments mandatorily at fair value through profit or loss in EUR thousand
NLB Group NLB
30 Sep 2018 30 Sep 2018
Assets
Equity securities 4,756 702
Debt securities 101 -
Loans and advances to companies 21,679 25,094
Total 26,536 25,796
Liabilities
Loans and advances to companies 9,631 9,345
b) Finacial instruments designated at fair value through profit or loss in EUR thousand
30 Sep 2018 31 Dec 2017 30 Sep 2018 31 Dec 2017
Assets - 5,003 - 634
Liabilities - 635 - 635
NLB Group NLB
5.4. Financial assets measured at fair value through other comprehensive income
in EUR thousand
NLB Group NLB
30 Sep 2018 30 Sep 2018
Bonds 1,586,178 1,404,217
Commercial bills 137,568 -
Treasury bills 113,252 65,135
National Resolution Fund 44,443 44,443
Shares 7,943 2,354
Total 1,889,384 1,516,149
Allowance for impairment (4,782) (2,411)
5.5. Available-for-sale financial assets
in EUR thousand
NLB Group NLB
31 Dec 2017 31 Dec 2017
Bonds 1,805,250 1,554,565
Commercial bills 281,877 136,279
Treasury bills 136,182 40,070
National Resolution Fund 44,514 44,514
Shares 8,670 2,334
Total 2,276,493 1,777,762

77 NLB Group Interim report Q3 2018
5.6. Financial assets measured at amortised cost
Analysis by type
in EUR thousand
NLB Group NLB
30 Sep 2018 30 Sep 2018
Debt securities 1,337,165 1,197,426
Loans and advances to banks 402,034 380,275
Loans and advances to customers 7,059,217 4,488,698
Other financial assets 51,979 52,582
Total 8,850,395 6,118,981
a) Debt securities in EUR thousand
b) Loans and advances to banks in EUR thousand
NLB Group NLB
30 Sep 2018 30 Sep 2018
Time deposits 398,426 348,011
Purchased receivables 1,421 1,421
Loans 2,559 30,987
402,406 380,419
Allowance for impairment (note 5.8.a) (372) (144)
Total 402,034 380,275
c) Loans and advances to customers in EUR thousand
NLB Group NLB
30 Sep 2018 30 Sep 2018
Loans 6,996,244 4,470,456
Overdrafts 329,077 184,484
Finance lease receivables 128,506 -
Credit card business 113,419 55,067
Called guarantees 8,601 6,739
7,575,847 4,716,746
Allowance for impairment (note 5.8.a) (516,630) (228,048)
Total 7,059,217 4,488,698
NLB Group NLB
30 Sep 2018 30 Sep 2018
Government 993,528 852,410
Companies 88,131 88,131
Banks 250,581 250,581
Other 7,577 7,577
1,339,817 1,198,699
Allowance for impairment (note 5.8.b) (2,652) (1,273)
Total 1,337,165 1,197,426

78 NLB Group Interim report Q3 2018
d) Other financial assets in EUR thousand
NLB Group NLB
30 Sep 2018 30 Sep 2018
Receivables in the course of collection 13,450 10,261
Credit card receivables 23,537 20,141
Debtors 6,404 367
Fees and commissions 5,015 2,888
Receivables to brokerage firms and others for the sale of securities and custody services 2,668 8,283
Prepayments 2,109 -
Accrued income 1,246 1,640
Receivables from purchase agreements for equity securities 163 163
Dividends 44 8,574
Other financial assets 7,850 2,723
62,486 55,040
Allowance for impairment (note 5.8.a) (10,507) (2,458)
Total 51,979 52,582
5.7. Loans and advances
Analysis by type
in EUR thousand
NLB Group NLB
31 Dec 2017 31 Dec 2017
Debt securities 82,133 82,133
Loans and advances to banks 510,107 462,322
Loans and advances to customers 6,912,333 4,587,477
Other financial assets 66,077 38,389
Total 7,570,650 5,170,321
a) Debt securities in EUR thousand
NLB Group and NLB 31 Dec 2017
Companies 82,133
Total 82,133
b) Loans and advances to banks in EUR thousand
NLB Group NLB
31 Dec 2017 31 Dec 2017
Time deposits 506,322 437,427
Purchased receivables 1,505 1,505
Loans 2,856 23,390
510,683 462,322
Allowance for impairment (576) -
Total 510,107 462,322
c) Loans and advances to customers in EUR thousand
NLB Group NLB
31 Dec 2017 31 Dec 2017
Loans 6,958,796 4,661,317
Overdrafts 305,600 176,171
Finance lease receivables 169,806 -
Credit card business 115,225 59,394
Called guarantees 9,658 7,658
7,559,085 4,904,540
Allowance for impairment (646,752) (317,063)
Total 6,912,333 4,587,477

79 NLB Group Interim report Q3 2018
d) Other financial assets in EUR thousand
NLB Group NLB
31 Dec 2017 31 Dec 2017
Receivables in the course of collection 13,398 10,467
Credit card receivables 24,522 19,642
Debtors 8,018 1,029
Fees and commissions 6,170 4,723
Receivables to brokerage firms and others for the sale of securities and custody services 632 627
Prepayments 2,204 -
Accrued income 178 168
Receivables from purchase agreements for equity securities 163 163
Dividends 44 44
Other financial assets 22,453 4,717
77,782 41,580
Allowance for impairment (11,705) (3,191)
Total 66,077 38,389
5.8. Movements in allowance for the impairment and provisions
a) Movements in allowance for the impairment of loans and advances measured at amortised cost
in EUR thousand
12-month
expected
credit
losses
12-month
expected credit
losses
Lifetime ECL
not credit -
impaired
Lifetime ECL
credit-impaired
12-month
expected credit
losses
Lifetime
ECL not
credit -
impaired
Lifetime
ECL
credit-
impaired
Balance as at 1 January 2018 713 34,618 34,203 481,070 171 25 10,672
Exchange differences on opening balance - 7 6 1,262 - - -
Transfers - 15,252 1,186 (16,438) - - -
Impairment (note 4.11.) (341) (11,935) 2,298 7,389 92 52 2,765
Write-offs - (220) (199) (32,492) (18) (3) (3,249)
Exchange differences - 15 2 606 - - -
Balance as at 30 September 2018 372 37,737 37,496 441,397 245 74 10,188
Repayment of write-offs (note 4.11.) - - - 19,101 - - 409
NLB Group
Banks Customers Other financial assets
in EUR thousand
12-month
expected
credit
losses
12-month
expected credit
losses
Lifetime ECL
not credit -
impaired
Lifetime ECL
credit-impaired
12-month
expected credit
losses
Lifetime
ECL not
credit -
impaired
Lifetime
ECL
credit-
impaired
Balance as at 1 January 2018 492 15,812 6,316 230,330 24 5 2,637
Transfers - 2,940 11,609 (14,549) - - -
Impairment (note 4.11.) (348) (2,128) (5,201) (779) 20 7 184
Write-offs - (26) (6) (16,332) (3) - (416)
Exchange differences - 23 3 36 - - -
Balance as at 30 September 2018 144 16,621 12,721 198,706 41 12 2,405
Repayment of write-offs (note 4.11.) - - - 8,032 - - 409
Other financial assets
NLB
Banks Customers

80 NLB Group Interim report Q3 2018
b) Movements in allowance for the impairment of debt securities
in EUR thousand
12-month
expected credit
losses
12-month
expected credit
losses
Lifetime ECL
not credit -
impaired
Lifetime ECL
credit-impaired
Balance as at 1 January 2018 2,169 3,689 - 798
Exchange differences on opening balance (5) 4 - -
Impairment (note 4.11.) 488 208 82 -
Exhange differences - 1 - -
Balance as at 30 Septembra 2018 2,652 3,902 82 798
NLB Group
Debt securities
measured at
amortised cost
Debt securities measured ar fair value through other
comprehensive income
in EUR thousand
12-month
expected credit
losses
12-month
expected credit
losses
Lifetime ECL
not credit -
impaired
Lifetime ECL
credit-impaired
Balance as at 1 January 2018 1,298 1,392 - 798
Impairment (note 4.11.) (25) 220 - -
Exhange differences - 1 - -
Balance as at 30 September 2018 1,273 1,613 - 798
NLB
Debt securities
measured at
amortised cost
Debt securities measured at fair value through other
comprehensive income
c) Movements in provisions for commitments and guarantees in EUR thousand
12-month
expected
credit
losses
Lifetime ECL
not credit -
impaired
Lifetime ECL
credit-
impaired
Balance as at 1 January 2018 6,928 4,833 30,504
Exchange differences on opening balance (12) (14) (7)
Transfers 2,123 (1,521) (602)
Impairment (note 4.10.) (928) (17) (3,824)
Balance as at 30 Septembra 2018 8,111 3,281 26,071
NLB Group
in EUR thousand
12-month
expected
credit
losses
Lifetime ECL
not credit -
impaired
Lifetime ECL
credit-
impaired
Balance as at 1 January 2018 2,946 450 27,276
Transfers 235 (35) (200)
Impairment (note 4.10.) 672 209 (2,544)
Balance as at 30 September 2018 3,853 624 24,532
NLB
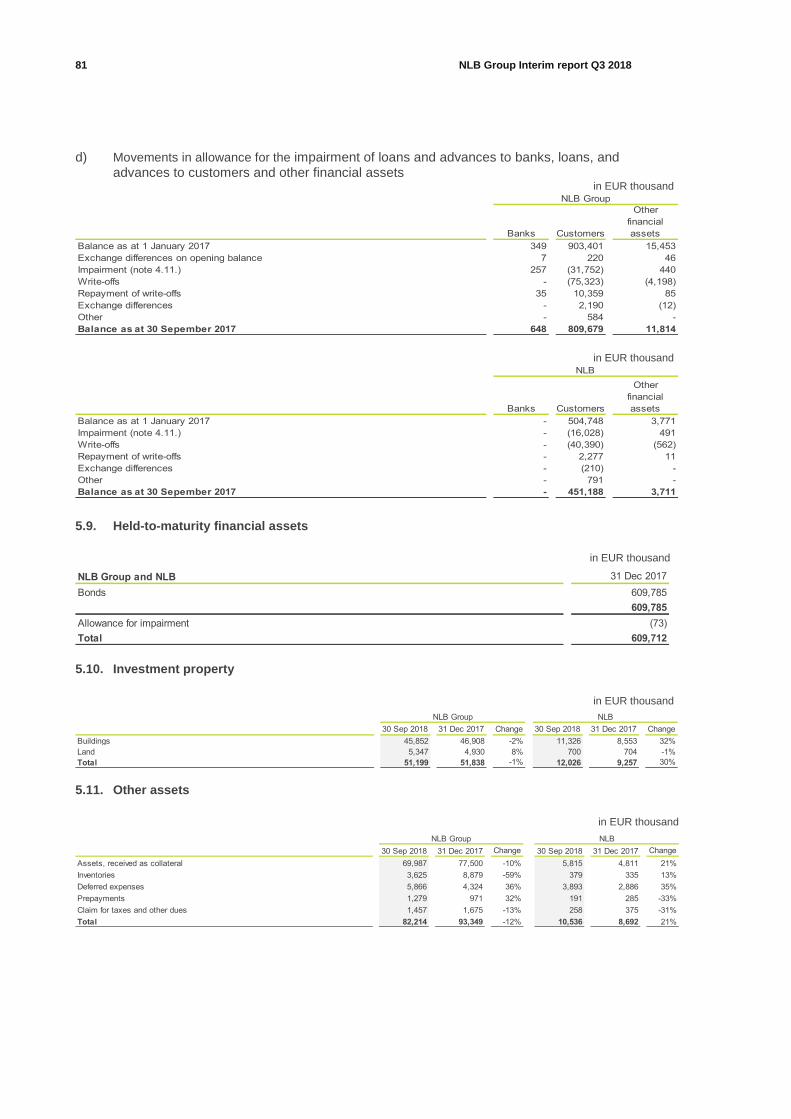
81 NLB Group Interim report Q3 2018
d) Movements in allowance for the impairment of loans and advances to banks, loans, and advances to customers and other financial assets
in EUR thousand
Banks
Balance as at 1 January 2017 349 903,401 15,453
Exchange differences on opening balance 7 220 46
Impairment (note 4.11.) 257 (31,752) 440
Write-offs - (75,323) (4,198)
Repayment of write-offs 35 10,359 85
Exchange differences - 2,190 (12)
Other - 584 -
Balance as at 30 Sepember 2017 648 809,679 11,814
Customers
Other
financial
assets
NLB Group
in EUR thousand
Banks
Balance as at 1 January 2017 - 504,748 3,771
Impairment (note 4.11.) - (16,028) 491
Write-offs - (40,390) (562)
Repayment of write-offs - 2,277 11
Exchange differences - (210) -
Other - 791 -
Balance as at 30 Sepember 2017 - 451,188 3,711
Customers
Other
financial
assets
NLB
5.9. Held-to-maturity financial assets
in EUR thousand
NLB Group and NLB 31 Dec 2017
Bonds 609,785
609,785
Allowance for impairment (73)
Total 609,712
5.10. Investment property
in EUR thousand
30 Sep 2018 31 Dec 2017 Change 30 Sep 2018 31 Dec 2017 Change
Buildings 45,852 46,908 -2% 11,326 8,553 32%
Land 5,347 4,930 8% 700 704 -1%
Total 51,199 51,838 -1% 12,026 9,257 30%
NLBNLB Group
5.11. Other assets
in EUR thousand
30 Sep 2018 31 Dec 2017 Change 30 Sep 2018 31 Dec 2017 Change
Assets, received as collateral 69,987 77,500 -10% 5,815 4,811 21%
Inventories 3,625 8,879 -59% 379 335 13%
Deferred expenses 5,866 4,324 36% 3,893 2,886 35%
Prepayments 1,279 971 32% 191 285 -33%
Claim for taxes and other dues 1,457 1,675 -13% 258 375 -31%
Total 82,214 93,349 -12% 10,536 8,692 21%
NLBNLB Group
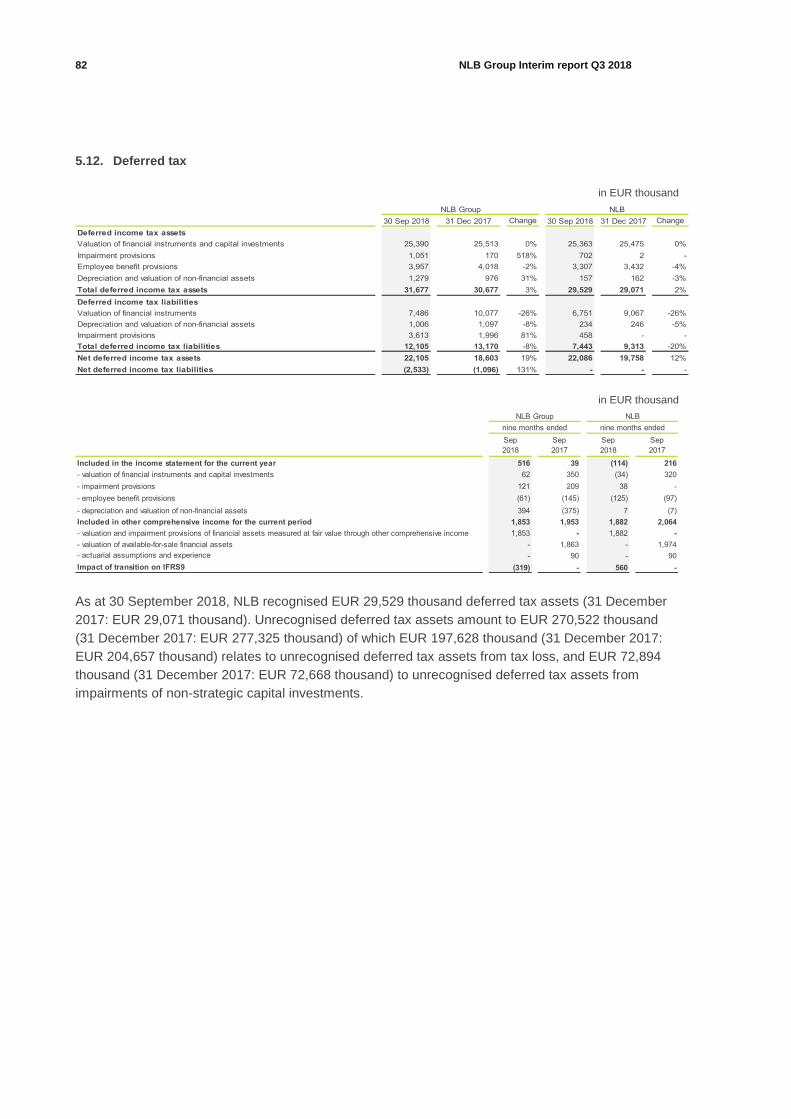
82 NLB Group Interim report Q3 2018
5.12. Deferred tax
in EUR thousand
30 Sep 2018 31 Dec 2017 Change 30 Sep 2018 31 Dec 2017 Change
Deferred income tax assets
Valuation of financial instruments and capital investments 25,390 25,513 0% 25,363 25,475 0%
Impairment provisions 1,051 170 518% 702 2 -
Employee benefit provisions 3,957 4,018 -2% 3,307 3,432 -4%
Depreciation and valuation of non-financial assets 1,279 976 31% 157 162 -3%
Total deferred income tax assets 31,677 30,677 3% 29,529 29,071 2%
Deferred income tax liabilities
Valuation of financial instruments 7,486 10,077 -26% 6,751 9,067 -26%
Depreciation and valuation of non-financial assets 1,006 1,097 -8% 234 246 -5%
Impairment provisions 3,613 1,996 81% 458 - -
Total deferred income tax liabilities 12,105 13,170 -8% 7,443 9,313 -20%
Net deferred income tax assets 22,105 18,603 19% 22,086 19,758 12%
Net deferred income tax liabilities (2,533) (1,096) 131% - - -
NLBNLB Group
in EUR thousand
Sep Sep Sep Sep
2018 2017 2018 2017
Included in the income statement for the current year 516 39 (114) 216
- valuation of financial instruments and capital investments 62 350 (34) 320
- impairment provisions 121 209 38 -
- employee benefit provisions (61) (145) (125) (97)
- depreciation and valuation of non-financial assets 394 (375) 7 (7)
Included in other comprehensive income for the current period 1,853 1,953 1,882 2,064
- valuation and impairment provisions of financial assets measured at fair value through other comprehensive income 1,853 - 1,882 -
- valuation of available-for-sale financial assets - 1,863 - 1,974
- actuarial assumptions and experience - 90 - 90
Impact of transition on IFRS9 (319) - 560 -
nine months endednine months ended
NLB Group NLB
As at 30 September 2018, NLB recognised EUR 29,529 thousand deferred tax assets (31 December
2017: EUR 29,071 thousand). Unrecognised deferred tax assets amount to EUR 270,522 thousand
(31 December 2017: EUR 277,325 thousand) of which EUR 197,628 thousand (31 December 2017:
EUR 204,657 thousand) relates to unrecognised deferred tax assets from tax loss, and EUR 72,894
thousand (31 December 2017: EUR 72,668 thousand) to unrecognised deferred tax assets from
impairments of non-strategic capital investments.

83 NLB Group Interim report Q3 2018
5.13. Disposal of a subsidiary
In March 2018, NLB Group completed the sale of 100% interest in NLB Nov Penziski Fond, Skopje to a
third party. The details of the assets and liabilities disposed of, and disposal consideration are as follows:
in EUR thousand
Cash, cash balances at cental banks, and other demand deposits at banks 12
Financial assets at fair value through other comprehensive income 3,961
Financial assets at amortised cost
Loans to banks 3,967
Other financial assets 174
Property and equipment 18
Intangible assets 41
Other assets 137
Other financial liabilities 409
Provisions 60
Other liabilities 59
Net assets of subsidiary 7,782
Non-controlling interests (496)
Carrying amount of net assets disposed of 7,286
Total disposal consideration 19,464
Cash and cash equivalents in subsidiary sold (793)
Cash inflow on disposal 18,671
The gain on disposal of the subsidiary comprises:
Consideration for disposal of the subsidiary 19,464
Carrying amount of net assets disposed of 7,286
Cumulative currency translation reserve on foreign operation recycled from other
comprehensive income to profit or loss (2)
Gains from disposal of subsidiary 12,176
Prior to disposal, NLB Nov Penziski Fond, Skopje was included in the segment ‘Foreign strategic markets’
(note 7.a).

84 NLB Group Interim report Q3 2018
5.14. Financial liabilities measured at amortised cost
Analysis by type of financial liabilities, measured at amortised cost
in EUR thousand
30 Sep 2018 31 Dec 2017 Change 30 Sep 2018 31 Dec 2017 Change
Deposits from banks and central banks 43,274 40,602 7% 57,688 72,072 -20%
- Deposits on demand 39,498 36,331 9% 57,098 71,383 -20%
- Other deposits 3,776 4,271 -12% 590 689 -14%
Borrowings from banks and central banks 267,138 279,616 -4% 252,421 260,747 -3%
Due to customers 10,246,679 9,878,378 4% 6,986,764 6,810,967 3%
- Deposits on demand 8,051,759 7,332,344 10% 5,969,248 5,455,657 9%
- Other deposits 2,194,920 2,546,034 -14% 1,017,516 1,355,310 -25%
Borrowings from other customers 62,463 74,286 -16% 4,527 5,726 -21%
Subordinated liabilities 15,292 27,350 -44% - - -
Other financial liabilities 111,793 111,019 1% 77,583 71,534 8%
Total 10,746,639 10,411,251 3% 7,378,983 7,221,046 2%
NLBNLB Group
a) Borrowings
in EUR thousand
30 Sep 2018 31 Dec 2017 Change 30 Sep 2018 31 Dec 2017 Change
Loans
- banks and central banks 267,138 279,616 -4% 252,421 260,747 -3%
- other customers 62,463 74,286 -16% 4,527 5,726 -21%
Total 329,601 353,902 -7% 256,948 266,473 -4%
NLBNLB Group
b) Subordinated liabilities in EUR thousand
NLB Group Currency Due date Interest rate
Carrying
amount
Nominal
value
Carrying
amount
Nominal
value
Subordinated loans
EUR 30.6.2018 6-month EURIBOR + 5 % p. a. - - 12,221 12,000
EUR 30.6.2020 6-month EURIBOR + 7.7% p. a. 5,211 5,000 5,132 5,000
EUR 26.6.2025 6-month EURIBOR + 6.25% p. a. 10,081 10,000 9,997 10,000
Total 15,292 15,000 27,350 27,000
30 Sep 2018 31 Dec 2017
c) Other financial liabilities in EUR thousand
30 Sep 2018 31 Dec 2017 Change 30 Sep 2018 31 Dec 2017 Change
Items in the course of payment 25,509 20,931 22% 13,730 4,393 213%
Debit or credit card payables 33,387 36,578 -9% 30,886 32,132 -4%
Accrued expenses 14,037 11,343 24% 7,238 4,456 62%
Accrued salaries 12,057 9,665 25% 6,499 6,662 -2%
Liabilities to brokerage firms and others for securities purchase and custody services 6,313 1,327 376% 5,620 212 -
Suppliers 5,871 14,826 -60% 4,137 11,146 -63%
Fees and commissions due 131 1,682 -92% 76 1,627 -95%
Other financial liabilities 14,488 14,667 -1% 9,397 10,906 -14%
Total 111,793 111,019 1% 77,583 71,534 8%
NLBNLB Group
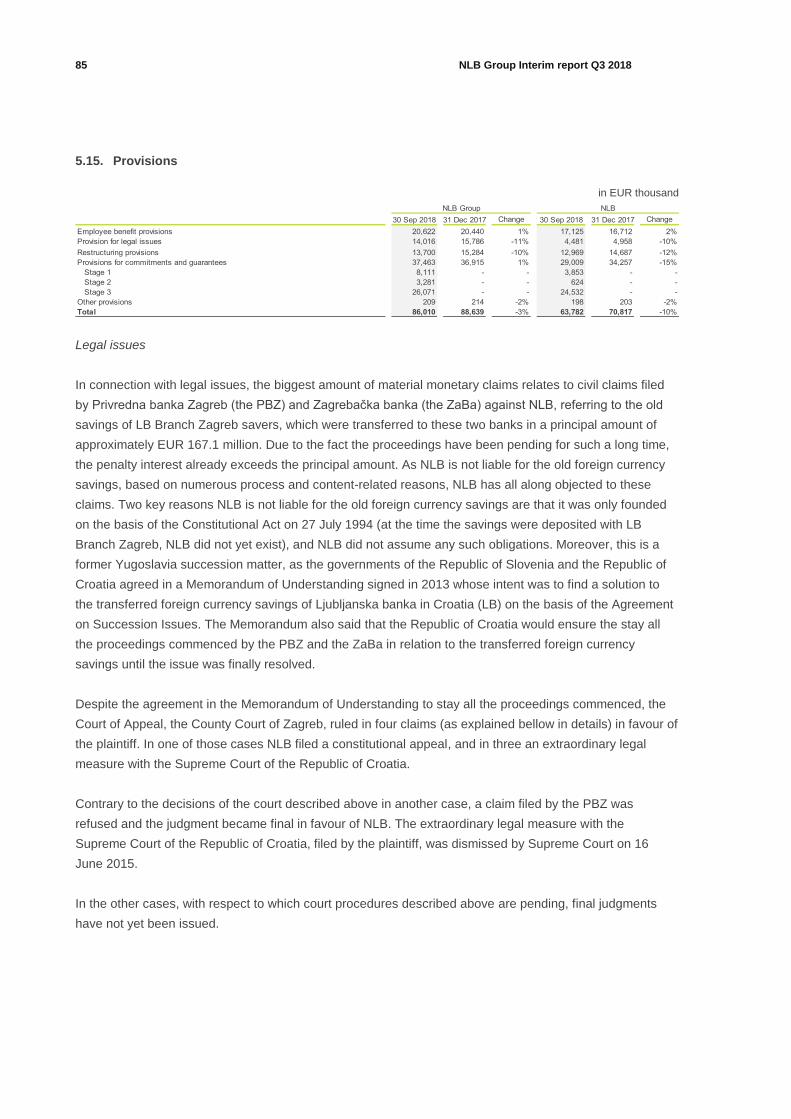
85 NLB Group Interim report Q3 2018
5.15. Provisions
in EUR thousand
30 Sep 2018 31 Dec 2017 Change 30 Sep 2018 31 Dec 2017 Change
Employee benefit provisions 20,622 20,440 1% 17,125 16,712 2%
Provision for legal issues 14,016 15,786 -11% 4,481 4,958 -10%
Restructuring provisions 13,700 15,284 -10% 12,969 14,687 -12%
Provisions for commitments and guarantees 37,463 36,915 1% 29,009 34,257 -15%
Stage 1 8,111 - - 3,853 - -
Stage 2 3,281 - - 624 - -
Stage 3 26,071 - - 24,532 - -
Other provisions 209 214 -2% 198 203 -2%
Total 86,010 88,639 -3% 63,782 70,817 -10%
NLBNLB Group
Legal issues
In connection with legal issues, the biggest amount of material monetary claims relates to civil claims filed
by Privredna banka Zagreb (the PBZ) and Zagrebačka banka (the ZaBa) against NLB, referring to the old
savings of LB Branch Zagreb savers, which were transferred to these two banks in a principal amount of
approximately EUR 167.1 million. Due to the fact the proceedings have been pending for such a long time,
the penalty interest already exceeds the principal amount. As NLB is not liable for the old foreign currency
savings, based on numerous process and content-related reasons, NLB has all along objected to these
claims. Two key reasons NLB is not liable for the old foreign currency savings are that it was only founded
on the basis of the Constitutional Act on 27 July 1994 (at the time the savings were deposited with LB
Branch Zagreb, NLB did not yet exist), and NLB did not assume any such obligations. Moreover, this is a
former Yugoslavia succession matter, as the governments of the Republic of Slovenia and the Republic of
Croatia agreed in a Memorandum of Understanding signed in 2013 whose intent was to find a solution to
the transferred foreign currency savings of Ljubljanska banka in Croatia (LB) on the basis of the Agreement
on Succession Issues. The Memorandum also said that the Republic of Croatia would ensure the stay all
the proceedings commenced by the PBZ and the ZaBa in relation to the transferred foreign currency
savings until the issue was finally resolved.
Despite the agreement in the Memorandum of Understanding to stay all the proceedings commenced, the
Court of Appeal, the County Court of Zagreb, ruled in four claims (as explained bellow in details) in favour of
the plaintiff. In one of those cases NLB filed a constitutional appeal, and in three an extraordinary legal
measure with the Supreme Court of the Republic of Croatia.
Contrary to the decisions of the court described above in another case, a claim filed by the PBZ was
refused and the judgment became final in favour of NLB. The extraordinary legal measure with the
Supreme Court of the Republic of Croatia, filed by the plaintiff, was dismissed by Supreme Court on 16
June 2015.
In the other cases, with respect to which court procedures described above are pending, final judgments
have not yet been issued.

86 NLB Group Interim report Q3 2018
The table below summarises amounts according to final judgements (not including penalty interest).
Date of
the rulingPlaintiff
Principal
amount in
EUR
Costs of the
proceedings
in HRK
Measures taken by NLB
May 2015 PBZ 254.76 15,781.25
Constitutional appeal against the final judgement, as NLB found the court decision contrary to the
legislation in force, as well as the Memorandum concluded between the Republic of Slovenia and
the Republic of Croatia. Constitutional Court of the Republic of Croatia rejected the constitutional
appeal of NLB d.d. on 21 May 2018. NLB is considering possibilities to challenge decisions of
Croatian courts with European forums (ECHR, Court of Justice of the European Union etc.).
September
2017ZaBa 492,430.53 748,583.75
November
2017PBZ 220,115.98 688,268.12
April 2018 PBZ 222,426.39 253,283.37
NLB challenged the judgments with the extraordinary legal measure on the Supreme Court of the
Republic of Croatia and later, if necessary, will also challenge the judgment with all other available
remedies, as the obligations of the old foreign currency savings in accordance with Slovenian
Constitutional Law are not the liabilities of the NLB.
The NLB Shareholders’ Meeting provided on 9 April 2018 and on 12 October 2018 the Management Board
of NLB with instructions how to act in the event of existing or potential new final judgements by Croatian
courts against LB and NLB regarding the transferred foreign currency deposits and especially not to
voluntarily settle the adjudicated amounts, and also gave some additional instructions on the usage of legal
remedies.
On 19 July 2018 the National Assembly of the Republic of Slovenia passed the Act for Value Protection of
Republic of Slovenia's Capital Investment in Nova Ljubljanska banka d.d., Ljubljana (Zakon za zaščito
vrednosti kapitalske naložbe Republike Slovenije v Novi Ljubljanski banki d.d., Ljubljana, hereinafter: the
ZVKNNLB), which entered into force on 14 August 2018. In accordance with the ZVKNNLB the Succession
Fund of the Republic of Slovenia (Sklad Republike Slovenije za nasledstvo, javni sklad, hereinafter: the
Fund) shall compensate NLB for the sums recovered from NLB by enforcement of final judgements
delivered by Croatian courts with regard to the transferred foreign currency deposits, that is the principle
amount, accrued interest, expenses of court, Attorney's expenses and other expenses of the plaintiff and
expenses related to enforcement with the accrued interest. There shall be no compensation for any
voluntarily made payments by NLB. In accordance with the ZVKNNLB and pursuant to the agreement
between NLB and the Fund, as envisaged by the ZVKNNLB (which was concluded on 14 August 2018),
NLB has to contest the claims made against it in court proceedings in relation to transferred foreign
currency deposits, and for use against court decisions that are disadvantageous for NLB, all reasonable
legal remedies, and to continue to actively challenge the judicial decisions of the courts of the Republic of
Croatia in relation to transferred foreign currency deposits on the basis of which enforcement took place,
leading, on the basis of ZVKNNLB, to the compensation of the sums recovered from NLB by enforcement.
In the above mentioned case from May 2015, the Succession Fund of the Republic of Slovenia has already
compensated the sums recovered from NLB by enforcement.
Provisions for these claims are not formed, since NLB believes that based on the factual and legal
evaluation there are greater prospects for the legal proceedings to end in favour of NLB than the opposite.
5.16. Income tax relating to components of other comprehensive income
in EUR thousand
Before tax
amount
Tax
expense
Net of tax
amount
Before tax
amount
Tax
expense
Net of tax
amount
Financial assets measured at fair value through other comprehensive income (8,584) 1,853 (6,731) - - -
Available-for-sale financial assets - - - (8,922) 1,863 (7,059)
Share of associates and joint ventures (4,090) 765 (3,325) (74) 12 (62)
Actuarial gains and losses - - - (846) 90 (756)
Total (12,674) 2,618 (10,056) (9,842) 1,965 (7,877)
NLB Group
30 Sep 2018 30 Sep 2017

87 NLB Group Interim report Q3 2018
in EUR thousand
Before tax
amount
Tax
expense
Net of tax
amount
Before tax
amount
Tax
expense
Net of tax
amount
Financial assets measured at fair value through other comprehensive income (9,861) 1,882 (7,979) - - -
Available-for-sale financial assets - - - (10,390) 1,974 (8,416)
Actuarial gains and losses - - - (950) 90 (860)
Total (9,861) 1,882 (7,979) (11,340) 2,064 (9,276)
NLB
30 Sep 2018 30 Sep 2017
5.17. Other liabilities
in EUR thousand
30 Sep 2018 31 Dec 2017 Change 30 Sep 2018 31 Dec 2017 Change
Taxes payable 3,371 3,409 -1% 2,452 2,770 -11%
Deferred income 5,431 3,101 75% 3,355 1,034 224%
Payments received in advance 2,498 3,086 -19% 543 377 44%
Total 11,340 9,596 18% 6,350 4,181 52%
NLBNLB Group
5.18. Capital adequacy ratio
in EUR thousand
30 Sep 2018 31 Dec 2017 30 Sep 2018 31 Dec 2017
Paid-up capital instruments 200,000 200,000 200,000 200,000
Share premium 871,378 871,378 871,378 871,378
Retained earnings - from previous years 291,525 296,773 28,748 81,533
Profit or loss eligible - from current year 108,829 29,280 103,335 -
Accumulated other comprehensive income 6,129 (11,450) 16,665 (20)
Other reserves 13,522 13,522 13,522 13,522
Minority interest - - - -
Prudential filters: Cash flow hedge reserve - - - -
Prudential filters: Value adjustments due to the requirements for prudent valuation (1,972) (2,389) (1,595) (1,886)
(-) Goodwill (3,529) (3,529) - -
(-) Other intangible assets (27,564) (31,445) (20,533) (23,911)
(-) Deferred tax assets that rely on future profitability and do not arise from temporary differences net of
associated tax liabilities - - - -
(-) Investments in CET1 instruments of financial sector - significant share - -
COMMON EQUITY TIER 1 CAPITAL (CET1) 1,458,318 1,362,140 1,211,520 1,140,616
Additional Tier 1 capital - - - -
TIER 1 CAPITAL 1,458,318 1,362,140 1,211,520 1,140,616
Tier 2 capital - - - -
TOTAL CAPITAL (OWN FUNDS) 1,458,318 1,362,140 1,211,520 1,140,616
RWA for credit risk 7,101,587 7,096,413 4,194,284 4,369,557
RWA for market risks 551,113 499,726 271,738 269,988
RWA for credit valuation adjustment risk 1,238 850 1,238 850
RWA for operational risk 953,482 949,493 596,586 593,750
TOTAL RISK EXPOSURE AMOUNT (RWA) 8,607,420 8,546,482 5,063,846 5,234,145
Common Equity Tier 1 Ratio 16.9% 15.9% 23.9% 21.8%
Tier 1 Ratio 16.9% 15.9% 23.9% 21.8%
Total Capital Ratio 16.9% 15,9% 23.9% 21.8%
NLBNLB Group
At the end of September 2018, the capital ratios for NLB Group stood at 16.9% (or 1.0 percentage points
higher than at the end of 2017), and for NLB at 23.9% (or 2.1 percentage point higher than at the end of
2017). The improvement of capital adequacy derives from higher capital, mainly due to inclusion of H1 2018
result (EUR 108.8 million for NLB Group), lower retained earnings (EUR - 81.5 million) as part of dividend
pay out, the inclusion of the positive effect from the implementation of IFRS 9 (EUR 43.8 million for NLB
Group and EUR 27.7 million for NLB), and the conclusion of transitional arrangements relevant until the end
of 2017.
In September 2018 NLB applied for formal approval with ECB to pay-out the dividends in the total amount
of EUR 270.6 million which consists of: EUR 189.1 million of profit for fiscal year 2017 and EUR 81.5 million
of retained profit from previous years. Pursuant to ECB’s permission for distribution of the dividends,
General Assembly of NLB’s Shareholders approved the distribution and NLB paid dividends in the amount
of EUR 270.6 million to the registered shareholders of NLB on 22 October 2018.

88 NLB Group Interim report Q3 2018
5.19. Book value per share
30 Sep 2018 31 Dec 2017 30 Sep 2018 31 Dec 2017
Total equity including non-controlling interests (in EUR thousand) 1,844,478 1,653,553 1,535,487 1,381,226
Number of shares 20,000,000 20,000,000 20,000,000 20,000,000
Book value per share (in EUR) 92.2 82.7 76.8 69.1
NLBNLB Group
The book value per share is calculated as the ratio of net assets’ book value without other equity
instruments issued and the number of shares. NLB Group and NLB do not have any other equity
instruments issued or treasury shares.
The book value of a NLB share after dividends distribution on a consolidated level would be EUR 78.7, and
on NLB level would be EUR 63.2.
5.20. Off-balance sheet liabilities
in EUR thousand
30 Sep 2018 31 Dec 2017 Change 30 Sep 2018 31 Dec 2017 Change
Commitments to extend credit 1,162,613 1,130,250 3% 918,316 898,927 2%
Non-financial guarantees 444,476 427,028 4% 340,526 339,669 0%
Financial guarantees 356,808 314,512 13% 221,268 178,335 24%
Letters of credit 16,371 14,614 12% 4,477 375 -
Other 4,667 4,109 14% 1,775 69 -
1,984,935 1,890,513 5% 1,486,362 1,417,375 5%
Provisions (note 5.15.) (37,463) (36,915) 1% (29,009) (34,257) -15%
Total 1,947,472 1,853,598 5% 1,457,353 1,383,118 5%
NLBNLB Group
5.21. Fair value hierarchy of financial and non-financial assets and liabilities
Fair value is the price that would be received upon the sale of an asset or paid to transfer a liability in an
orderly transaction between market participants at the measurement date. NLB Group uses various
valuation techniques to determine fair value. IFRS 13 specifies a fair value hierarchy with respect to the
inputs and assumptions used to measure financial and non-financial assets and liabilities at fair value.
Observable inputs reflect market data obtained from independent sources, while unobservable inputs reflect
the assumptions of NLB Group and NLB. This hierarchy gives the highest priority to observable market data
when available, and the lowest priority to unobservable market data. NLB Group considers relevant and
observable market prices in its valuations where possible. The fair value hierarchy comprises the following
levels:
• Level 1 – Quoted prices (unadjusted) on active markets. This level includes listed equities, debt
instruments, derivatives, units of investment funds, and other unadjusted market prices of assets and
liabilities. When an asset or liability may be exchanged on multiple active markets, the principal market
for the asset or liability must be determined. In the absence of a principal market, the most
advantageous market for the asset or liability must be determined.
• Level 2 – A valuation technique where inputs are observable, either directly (i.e. prices) or indirectly (i.e.
derived from prices). Level 2 includes quoted prices for similar assets or liabilities on active markets and
quoted prices for identical or similar assets and liabilities on markets that are not active. The sources of
input parameters for financial instruments, such as yield curves, credit spreads, foreign exchange rates,
and the volatility of interest rates and foreign exchange rates, are Reuters and Bloomberg.

89 NLB Group Interim report Q3 2018
• Level 3 – A valuation technique where inputs are not based on observable market data. Unobservable
inputs are used to the extent that relevant observable inputs are not available. Unobservable inputs must
reflect the assumptions that market participants would use when pricing an asset or liability. This level
includes non-tradable shares and bonds and derivatives associated with these investments and other
assets and liabilities for which fair value cannot be determined with observable market inputs.
Where possible, fair value is determined as an observable market price on an active market for an identical
asset or liability. An active market is a market on which transactions for an asset or liability are executed
with sufficient frequency and volume to provide pricing information on an ongoing basis. Assets and
liabilities measured at fair value on active markets are determined as the market price of a unit (e.g. a
share) at the measurement date, multiplied by the quantity of units owned by NLB Group. The fair value of
assets and liabilities whose market is not active is determined using valuation techniques. Valuation
techniques bear a different intensity level of estimates and assumptions, depending on the availability of
observable market inputs associated with the asset or liability that is the subject of valuation. Unobservable
inputs shall reflect the estimates and assumptions that other market participants would use when pricing the
asset or liability.
For non-financial assets measured at fair value and not classified on Level 1, fair value is determined based
on valuation reports provided by certified valuators. Valuations are prepared in accordance with the
International Valuation Standards (IVS).
a) Financial and non-financial assets and liabilities, measured at fair value in the financial statements
in EUR thousand
30 Sep 2018 Level 1 Level 2 Level 3 Total Level 1 Level 2 Level 3 Total
Financial assets
Financial instruments held for trading 32,597 12,483 164 45,244 32,597 12,476 164 45,237
Debt instruments 32,597 - - 32,597 32,597 - - 32,597
Derivatives - 12,483 164 12,647 - 12,476 164 12,640
Derivatives - hedge accounting - 1,530 - 1,530 - 1,530 - 1,530
Non-trading financial assets mandatorily at fair value through profit or loss 4,803 21,679 54 26,536 648 25,094 54 25,796
Loans and advances to customers - 21,679 - 21,679 - 25,094 - 25,094
Debt instruments 101 - - 101 - - - -
Equity instruments 4,702 - 54 4,756 648 - 54 702
Financial assets measured at fair value through other comprehensive income 1,663,387 219,957 6,040 1,889,384 1,461,502 52,293 2,354 1,516,149
Debt instruments 1,663,225 173,773 - 1,836,998 1,461,502 7,850 - 1,469,352
Equity instruments 162 46,184 6,040 52,386 - 44,443 2,354 46,797
Financial liabilities -
Financial instruments held for trading - 9,987 - 9,987 - 9,991 - 9,991
Derivatives - 9,987 - 9,987 - 9,991 - 9,991
Derivatives - hedge accounting - 22,747 - 22,747 - 22,747 - 22,747
Financial liabilities measured at fair value through profit or loss - 9,631 - 9,631 - 9,345 - 9,345
Non-financial assets
Investment properties - 51,199 - 51,199 - 12,026 - 12,026
Non-current assets classified as held for sale - 4,381 - 4,381 - 1,720 - 1,720
NLB NLB Group

90 NLB Group Interim report Q3 2018
in EUR thousand
31 Dec 2017 Level 1 Level 2 Level 3 Total Level 1 Level 2 Level 3 Total
Financial assets
Financial instruments held for trading 59,164 12,454 571 72,189 59,164 12,445 571 72,180
Debt instruments 59,164 - - 59,164 59,164 - - 59,164
Derivatives - 12,454 571 13,025 - 12,445 571 13,016
Derivatives - hedge accounting - 1,188 - 1,188 - 1,188 - 1,188
Financial assets designated at fair value through profit or loss 5,003 - - 5,003 634 - - 634
Debt instruments 102 - - 102 - - - -
Equity instruments 4,901 - - 4,901 634 - - 634
Financial assets available-for-sale 1,915,634 355,428 5,431 2,276,493 1,586,927 188,982 1,853 1,777,762
Debt instruments 1,914,963 308,346 - 2,223,309 1,586,447 144,467 - 1,730,914
Equity instruments 671 47,082 5,431 53,184 480 44,515 1,853 46,848
Financial liabilities
Financial instruments held for trading - 9,502 - 9,502 - 9,398 - 9,398
Derivatives - 9,502 - 9,502 - 9,398 - 9,398
Derivatives - hedge accounting - 25,529 - 25,529 - 25,529 - 25,529
Financial liabilities designated at fair value through profit or loss - 635 - 635 - 635 - 635
Non-financial assets -
Investment properties - 51,838 - 51,838 - 9,257 - 9,257
Non-current assets classified as held for sale - 11,631 - 11,631 - 2,564 - 2,564
NLBNLB Group
b) Significant transfers of financial instruments between levels of valuation
NLB Group’s policy of transfers of financial instruments between levels of valuation is illustrated in the table
below.
For the nine months ended 30 September 2018 and 30 September 2017, NLB Group nor NLB had any
significant transfers of financial instruments between levels of valuation.
Equities Currency Interest
1 market value from
exchange market
regular valuation by fund
management company
market value from exchange
market
2 valuation model valuation model
(underlying
instrument on level 1)
valuation model valuation model
3 valuation model valuation model valuation model valuation model valuation model
(underlying
instrument on level 3)
Transfers from level 1 to 3 from level 1 to 3 from level 1 to 2 from level 2 to 3
equity excluded from
exchange market
fund management stops
publishing regular
valuation
fixed income excluded from
exchange market
underlying excluded
from exchange
market
from level 1 to 3 from level 3 to 1 from level 1 to 2 from level 3 to 2
companies in insolvency
proceedings
fund management starts
publishing regular
valuation
fixed income not liquid (not
trading for 6 months)
underlying included in
exchange market
from level 3 to 1 from level 1 to 3 and from 2 to 3
equity included in
exchange market
companies in insolvency
proceedings
from level 2 to 1 and from 3 to 1
start trading with fixed income on
exchange market
from level 3 to 2
until valuation parameters are
confirmed on ALCO (at least on a
quarterly basis)
DerivativesFair value
hierarchy Equities Equity stake Funds Debt securities

91 NLB Group Interim report Q3 2018
c) Financial and non-financial assets and liabilities at Level 2 regarding the fair value hierarchy
Financial instruments on Level 2 of the fair value hierarchy at NLB Group and NLB include:
• debt securities: bonds not quoted on active markets and valuated by valuation model;
• equities;
• derivatives: derivatives except forward derivatives and options on equity instruments that are not quoted
on active markets;
• the National Resolution Fund, and
• structured deposits.
When valuing bonds classified on Level 2, NLB Group primarily uses the income approach based on an
estimation of future cash flows discounted to the present value. The input parameters used in the income
approach are the risk-free yield curve and the spread over the yield curve (credit, liquidity, country).
Fair values for derivatives are determined using a discounted cash flow model based on the risk-free yield
curve. Fair values for options are determined using valuation models for options (Garman and Kohlhagen
model, binomial model, and Black-Scholes model).
At least three valuation methods are used for the valuation of investment property. The majority of
investment property is valued using the income approach, where the present value of future expected
returns is assessed. When valuing an investment property, average rents at similar locations and
capitalisation ratios, such as the risk-free yield, risk premium, liquidity premium, risk premium to account for
the management of the investment, and risk premium to account for capital preservation are used. Rents at
similar locations are generated from various sources, like data from lessors and lessees, web databases,
and own databases. NLB Group has observable data for all investment property at its disposal. If
observable data for similar locations are not available, NLB Group uses data from wider locations and
appropriately adjusts such data.
Non-current assets held for sale represent property, plant, and equipment that are measured at fair value
less costs to sell, because this is lower than the previous carrying amount of those assets.
d) Financial and non-financial assets and liabilities at Level 3 of the fair value hierarchy Financial instruments on Level 3 of the fair value hierarchy in NLB Group and NLB include:
• debt securities: structured debt securities from inactive emerging markets;
• equities: corporate and financial equities that are not quoted on active markets; and
• derivative financial instruments: forward derivatives and options on equity instruments that are not
quoted on an active organised market. Fair values for forward derivatives are determined using the
discounted cash flow model. Fair values for equity options are determined using valuation models for
options (the Garman and Kohlhagen, binomial and Black-Scholes model). Unobservable inputs include
the fair values of underlying instruments determined using valuation models. The source of observable
market inputs is the Reuters information system.
NLB Group uses three valuation methods for the valuation of equity financial assets: the income approach,
market approach, and cost approach.

92 NLB Group Interim report Q3 2018
The most commonly used valuation technique is the income approach. The income approach is based on
an estimation of future cash flows discounted to the present value. One of the key elements of the valuation
is the projection of the cash flows that the company is able to generate in the future. Based on that, the
projection of the future cash flow is generated. The key variables that affect the amount of cash flows, and
thus the estimated fair value of the financial asset, also include an assumption regarding the long-term
EBITDA margin. A discount rate that is appropriate for the risks associated with the realisation of these
benefits is used to discount cash flows. The discount rate is determined as the weighted average cost of
capital. A forecast of future cash flows and a calculation of the weighted average cost of capital is prepared
for an accurate forecasting period (usually 10 years from the date of the prediction value), and for a period
following the period of accurate forecasting. Assumptions of long-term stable growth in the amount of 2.5%
are used for the period following the period of accurate forecasting. NLB Group can select values of
unobservable input data within a reasonable possible range, but uses those input data that other market
participants would use.
Movements of financial assets and liabilities on Level 3
in EUR thousand
Trading
assets
Financial assets
available-for-sale
Financial
assets
measured at
fair value
through OCI
Non-trading
financial
assets
mandatorily at
fair value
through profit
or loss
Total
financial
assets
NLB Group Derivatives
Equity
instruments
Equity
instruments
Equity
instruments
Balance as at 31 December 2017 571 5,431 - - 6,002
Transition to IFRS 9 - (5,431) 5,362 69 -
Balance as at 1 January 2018 571 - 5,362 69 6,002
Effects of translation of foreign operations to presentation currency - - 102 - 102
Valuation:
- through profit or loss (407) - - (15) (422)
- recognised in other comprehensive income - - 589 - 589
Decreases - - (3) - (3)
Balance as at 30 September 2018 164 - 6,050 54 6,268
in EUR thousand
Available-for-
sale financial
assets
Total
financial
assets
NLB Group Derivatives
Equity
instruments
Balance as at 1 January 2017 405 5,903 6,308
Effects of translation of foreign operations to presentation currency - (204) (204)
Valuation:
- through profit or loss 5 - 5
- recognised in other comprehensive income - 244 244
Decreases - (65) (65)
Balance as at 30 September 2017 410 5,878 6,288
Trading
assets

93 NLB Group Interim report Q3 2018
in EUR thousand
Financial assets
available-for-sale
Total
financial
assets
NLB Derivatives
Equity
instruments
Equity
instruments
Equity
instruments
Balance as at 31 December 2017 571 1,853 - - 2,424
Transition to IFRS 9 - (1,853) 1,784 69 -
Balance as at 1 January 2018 571 - 1,784 69 2,424
Valuation:
- through profit or loss (407) - - (15) (422)
- recognised in other comprehensive income - - 573 - 573
Decreases - - (3) - (3)
Balance as at 30 September 2018 164 - 2,354 54 2,572
Trading
assets
Financial
assets
measured at
fair value
through OCI
Non-trading
financial assets
mandatorily at
fair value through
profit or loss
in EUR thousand
Available-for-
sale financial
assets
Total
financial
assets
NLB Derivatives
Equity
instruments
Balance as at 1 January 2017 405 1,810 2,215
Valuation:
- through profit or loss 5 - 5
- recognised in other comprehensive income - 246 246
Decreases - (65) (65)
Balance as at 30 September 2017 410 1,991 2,401
Trading
assets
e) Fair value of financial instruments not measured at fair value in financial statements
in EUR thousand
Loans and advances to banks
The estimated fair value of deposits is based on discounted cash flows using prevailing money market
interest rates for debts with similar credit risk and residual maturities. The fair value of overnight deposits
equals their carrying value.
Loans and advances to customers
Loans and advances are the net of the allowance for impairment. The estimated fair value of loans and
advances represents the discounted amount of estimated future cash flows expected to be received.
Carrying
value Fair value
Carrying
value Fair value
Carrying
value Fair value
Carrying
value Fair value
Financial assets measured at amortised cost
- debt securities 1,337,165 1,348,633 - - 1,197,426 1,233,115 - -
- loans and advances to banks 402,034 410,599 - - 380,275 388,197 - -
- loans and advances to customers 7,059,217 7,110,239 - - 4,488,698 4,497,415 - -
- other financial assets 51,979 51,979 - - 52,582 52,582 - -
Loans and advances
- debt securities - - 82,133 79,974 - - 82,133 79,974
- loans and advances to banks - - 510,107 523,943 - - 462,322 468,599
- loans and advances to customers - - 6,912,333 6,494,021 - - 4,587,477 4,584,217
- other financial assets - - 66,077 66,077 - - 38,389 38,389
Held-to-maturity investments - - 609,712 658,029 - - 609,712 658,029
Financial liabilities measured at amortised cost
- deposits from banks and central banks 43,274 43,253 40,602 40,608 57,688 57,688 72,072 72,072
- borrowings from banks and central banks 267,138 274,679 279,616 287,165 252,421 259,665 260,747 267,866
- due to customers 10,246,679 10,251,253 9,878,378 9,892,052 6,986,764 6,990,935 6,810,967 6,817,618
- borrowings from other customers 62,463 61,979 74,286 74,677 4,527 4,526 5,726 5,728
- subordinated liabilities 15,292 15,492 27,350 26,923 - - - -
- other financial liabilities 111,793 111,793 111,019 111,019 77,583 77,583 71,534 71,534
NLBNLB Group
30 Sep 2018 31 Dec 201730 Sep 2018 31 Dec 2017

94 NLB Group Interim report Q3 2018
Expected cash flows are discounted at current market rates for debts with similar credit risk and residual
maturities to determine their fair value.
Deposits and borrowings
The fair value of sight deposits and overnight deposits equals their carrying value. However, their actual
value for NLB Group depends on the timing and amounts of cash flows, current market rates, and the credit
risk of the depository institution itself. A portion of sight deposits is stable, similar to term deposits.
Therefore, their economic value for NLB Group differs from the carrying amount.
The estimated fair value of other deposits and borrowings from customers is based on discounted cash
flows using interest rates for new deposits with similar residual maturities.
Debt securities measured at amortised cost and issued debt securities
The fair value of debt securities measured at amortised cost and issued debt securities is based on their
quoted market price or value calculated by using a discounted cash flow method, and the prevailing money
market interest rates.
Loan commitments
For credit facilities that are drawn soon after NLB Group grants loans (drawn at market rates) and loan
commitments to those clients that are not impaired, the fair value is close to zero. For loan commitments to
clients that are impaired, fair value represents the amount of the created provisions.
Other financial assets and liabilities
The carrying amount of other financial assets and liabilities is a reasonable approximation of their fair value
as they mainly relate to short-term receivables and payables.
Fair value hierarchy of financial instruments not measured at fair value in financial statements
in EUR thousand
30 Sep 2018 Level 1 Level 2 Level 3 Total Level 1 Level 2 Level 3 Total
Financial assets measured at amortised cost
- debt securities 1,208,994 139,639 - 1,348,633 1,065,892 167,223 - 1,233,115
- loans to banks - 410,599 - 410,599 - 388,197 - 388,197
- loans and advances to customers - 7,110,239 - 7,110,239 - 4,497,415 - 4,497,415
- other financial assets - 51,979 - 51,979 - 52,582 - 52,582
Financial liabilities measured at amortised cost
- deposits from banks and central banks - 43,253 - 43,253 - 57,688 - 57,688
- borrowings from banks and central banks - 274,679 - 274,679 - 259,665 - 259,665
- due to customers - 10,251,253 - 10,251,253 - 6,990,935 - 6,990,935
- borrowings from other customers - 61,979 - 61,979 - 4,526 - 4,526
- subordinated liabilities - 15,492 - 15,492 - - - -
- other financial liabilities - 111,793 - 111,793 - 77,583 - 77,583
NLBNLB Group

95 NLB Group Interim report Q3 2018
in EUR thousand
6. Related-party transactions
Related-party transactions with Management Board and other key management personnel, their
family members and companies these related parties have control, joint control or significant
influence
in EUR thousand
NLB Group and NLB 30 Sep 2018 31 Dec 2017 30 Sep 2018 31 Dec 2017 30 Sep 2018 31 Dec 2017 30 Sep 2018 31 Dec 2017
Loans and deposits issued 1,840 2,021 365 413 254 242 418 435
Loans and deposits received 2,088 1,981 540 769 647 593 364 240
Other financial liabilities 2,552 2,408 - - 5 7 - -
Guarantees issued and commitments to extend credit 239 224 89 76 62 116 26 31
September September September September September September September September
2018 2017 2018 2017 2018 2017 2018 2017
Interest income 26 27 6 6 3 5 8 8
Interest expenses (3) (6) (1) (3) - - - -
Fee income 8 7 4 3 7 7 2 1
Other income 1 - - - - - - -
Administrative and other operating expenses (2) (3) - - (41) (57) - -
nine months ended nine months ended nine months ended nine months ended
Management Board and
other Key management
personnel
Family members of the
Management Board and
other key management
personnel
Companies in which members of
the Management Board, key
management personnel, or their
family members have control,
joint control or a significant
influence Supervisory Board
Key management compensation – payments in the period
in EUR thousand
September September September September
NLB Group and NLB 2018 2017 2018 2017
Short-term benefits 496 474 3,520 3,451
Cost refunds 3 4 66 81
Long-term bonuses
- severance pay - - - 34
- other benefits 4 4 55 56
Variable part of payments 143 63 1,352 673
Total 646 545 4,993 4,295
Management BoardOther key management
personnel
nine months ended nine months ended
Short-term benefits include:
• monetary benefits (gross salaries, supplementary insurance, holiday bonus, other bonus); and
• non-monetary benefits (company cars, health care, apartments, etc.).
The reimbursement of costs is comprised of food allowances and travel expenses, other long-term bonuses
include supplementary voluntary pension insurance and jubilee bonuses and variable part of payments is
paid in accordance with the Remuneration Policy for employees with a special nature of work.
31 Dec 2017 Level 1 Level 2 Level 3 Total Level 1 Level 2 Level 3 Total
Loans and advances
- debt securities - 79,974 - 79,974 - 79,974 - 79,974
- loans and advances to banks - 523,943 - 523,943 - 468,599 - 468,599
- loans and advances to customers - 6,494,021 - 6,494,021 - 4,584,217 - 4,584,217
- other financial assets - 66,077 - 66,077 - 38,389 - 38,389
Held-to-maturity investments 658,029 - - 658,029 658,029 - - 658,029
Financial liabilities measured at amortised cost
- deposits from banks and central banks - 40,608 - 40,608 - 72,072 - 72,072
- borrowings from banks and central banks - 287,165 - 287,165 - 267,866 - 267,866
- due to customers - 9,892,052 - 9,892,052 - 6,817,618 - 6,817,618
- borrowings from other customers - 74,677 - 74,677 - 5,728 - 5,728
- subordinated liabilities - 26,923 - 26,923 - - - -
- other financial liabilities - 111,019 - 111,019 - 71,534 - 71,534
NLBNLB Group

96 NLB Group Interim report Q3 2018
Related-party transactions with subsidiaries, associates and joint ventures
in EUR thousand
30 Sep 2018 31 Dec 2017 30 Sep 2018 31 Dec 2017
Loans and deposits issued 1,205 1,296 3,752 4,333
Loans and deposits received 1,657 4,958 5,890 6,856
Other financial assets 7 27 194 347
Other financial liabilities 128 1,109 282 103
Guarantees issued and commitments to extend credit 33 38 29 29
September September September September
2018 2017 2018 2017
Interest income 28 32 32 47
Interest expenses - - (25) (50)
Fee income 103 100 3,058 2,922
Fee expenses (8,357) (7,823) (904) (1,544)
Other income 139 161 101 92
Administrative and other operating expenses (590) (741) (25) (13)
Gains less losses from financial assets and liabilities held for trading (1) - - -
NLB Group
nine months ended nine months ended
Associates Joint ventures
in EUR thousand
30 Sep 2018 31 Dec 2017 30 Sep 2018 31 Dec 2017 30 Sep 2018 31 Dec 2017
Loans and deposits issued 275,647 314,534 1,205 1,296 3,707 4,272
Loans and deposits received 43,869 56,129 1,657 4,958 4,313 4,855
Derivatives
Fair value (21) - - - - -
Contractual amount 2,399 - - - - -
Other financial assets 6,095 730 7 27 194 347
Other financial liabilities 36 61 41 1,008 188 25
Guarantees issued and commitments to extend credit 26,168 25,718 33 38 28 28
Received loan commitments and financial guarantees 4,244 1,000 - - - -
September September September September September September
2018 2017 2018 2017 2018 2017
Interest income 3,444 4,942 28 32 30 46
Interest expenses (145) (60) - - - (43)
Fee income 4,242 4,107 103 100 2,967 2,838
Fee expenses (24) (30) (7,210) (6,708) (821) (878)
Other income 435 362 139 161 101 92
Administrative and other operating expenses (534) (1,062) (364) (531) (25) (13)
Gains less losses from financial assets and liabilities held for trading (40) - (1) - - -
Gains less losses from non-trading financial assets mandatorily at fair value through profit or loss 1,161 - - - - -
nine months ended nine months ended
NLB
nine months ended
Subsidiaries Associates Joint ventures
Related-party transactions with the ultimate controlling party and other government-related entities
in EUR thousand
30 Sep 2018 31 Dec 2017 30 Sep 2018 31 Dec 2017
Loans and deposits issued measured at amortised cost 102,360 127,781 99,240 123,659
Investments in securities (banking book) 847,751 901,511 777,697 826,362
Investments in securities (trading book) 30,049 - 30,049 -
Other financial assets 700 18 700 18
Other financial liabilities 10 8 10 8
Guarantees issued and commitments to extend credit 1,089 932 1,089 932
September September September September
2018 2017 2018 2017
Interest income 15,891 19,271 16,005 18,943
Interest expenses - (5) - (5)
Fee income 558 128 558 128
Fee expenses (24) (28) (24) (28)
Other income 132 8 132 8
Administrative and other operating expenses (8) (19) (8) (19)
Gains less losses from financial assets and liabilities not classified as at fair value through profit or loss 217 - 217 -
Gains less losses from financial assets and liabilities held for trading (303) - (303) -
NLB Group NLB
nine months ended nine months ended
Ultimate parent Ultimate parent

97 NLB Group Interim report Q3 2018
NLB Group discloses all transactions with the ultimate controlling party. For transactions with other
government-related entities, NLB Group discloses individually significant transactions.
in EUR thousand
NLB Group and NLB
1.1. -
30.9.2018
1. 1. -
31.12.2017
1.1. -
30.9.2018
1. 1. -
31.12.2017
Loans - 117,924 - 1
30 Sep 2018 31 Dec 2017 30 Sep 2018 31 Dec 2017
Loans 526,614 575,024 5 5
Debt securities classified as loans and advances 75,501 82,133 1 1
Borrowings, deposits, and business accounts 135,066 135,006 2 2
Sep 2018 Sep 2017
Interest income from loans 2,010 3,853
Effects from net interest income and net valuation from debt securities classified as loans and
receivables437 528
Interest expense from borrowings, deposits and business accounts (179) (83)
nine months ended
Amount of significant
transactions concluded during
the period
Number of significant
transactions concluded during
the period
Balance of all significant
transactions at end of the
period
Number of significant
transactions at end of the
period
Effects in income statement
during the period
7. Analysis by segment for NLB Group
a) Segments
The nine months ended 30 September 2018
in EUR thousand
NLB Group
Corporate
banking in
Slovenia
Retail
banking in
Slovenia
Financial
markets and
investment
banking in
Slovenia
Foreign
strategic
markets
Non-strategic
markets and
activities
Other
activities Unallocated Total
Total net income 56,451 106,160 31,921 160,855 13,382 1,557 370,326
Net income from external customers 59,363 108,733 24,368 161,668 13,309 1,520 - 368,962
Intersegment net income (2,912) (2,573) 7,552 (813) 73 37 - 1,364
Net interest income 31,792 56,793 25,339 110,560 7,456 (75) - 231,865
Net interest income from external customers 34,704 59,626 17,907 111,815 7,925 (112) - 231,865
Intersegment net interest income (2,912) (2,833) 7,432 (1,255) (469) 37 - -
Administrative expenses (28,827) (70,001) (8,522) (66,861) (12,730) (4,297) - (191,238)
Depreciation and amortisation (3,071) (7,889) (833) (6,954) (1,095) (658) - (20,500)
Reportable segment profit/(loss) before impairment
and provision charge 24,553 28,270 22,566 87,040 (443) (3,398) - 158,588
Gains less losses from capital investment in associates
and joint ventures - 4,105 - - - - 4,105
Impairment and provisions charge 15,800 (3,004) 117 (3,354) 9,273 137 - 18,969
Profit/(loss) before income tax 40,353 29,371 22,682 83,686 8,831 (3,260) - 181,662
Owners of the parent 40,353 29,371 22,682 76,975 8,831 (3,260) - 174,951
Non-controlling interests - - - 6,711 - - - 6,711
Income tax - (16,625) (16,625)
Profit for the period - - - - - - - 158,326
30.9.2018
Reportable segment assets 1,985,382 2,305,993 3,859,055 4,118,410 310,630 166,494 - 12,745,964
Investments in associates and joint ventures - 37,754 - - - - - 37,754
Reportable segment liabilities 1,172,036 5,740,211 438,127 3,433,644 16,959 98,187 - 10,899,163

98 NLB Group Interim report Q3 2018
The nine months ended 30 September 2017
in EUR thousand
Total net income 53,056 103,922 29,135 141,999 33,951 5,161 367,223
Net income from external customers 56,561 104,079 22,329 143,293 33,744 5,275 - 365,280
Intersegment net income (3,506) (157) 6,806 (1,294) 207 (113) - 1,943
Net interest income 30,290 53,832 24,000 108,187 12,566 (181) - 228,693
Net interest income from external customers 33,796 54,204 17,128 109,720 13,913 (68) - 228,693
Intersegment net interest income (3,506) (373) 6,872 (1,533) (1,347) (113) - -
Administrative expenses (29,053) (66,146) (8,491) (63,616) (15,317) (6,334) - (188,959)
Depreciation and amortisation (3,304) (7,778) (768) (6,945) (977) (1,056) - (20,827)
Reportable segment profit/(loss) before impairment
and provision charge 20,699 29,997 19,875 71,438 17,657 (2,229) - 157,437
Gains less losses from capital investment in subsidiaries,
associates and joint ventures - 3,738 - - - - 3,738
Impairment and provisions charge 8,193 (1,210) (55) 16,851 13,002 491 - 37,272
Profit/(loss) before income tax 28,892 32,525 19,820 88,289 30,659 (1,737) - 198,447
Owners of the parent 28,892 32,525 19,820 81,003 30,659 (1,737) - 191,161
Non-controlling interests - - - 7,286 - - - 7,286
Income tax - (7,170) (7,170)
Profit for the period 183,991
31.12.2017
Reportable segment assets 2,055,734 2,204,045 3,508,467 3,851,214 391,308 183,212 - 12,193,980
Investments in associates and joint ventures - 43,765 - - - - - 43,765
Reportable segment liabilities 1,122,742 5,542,818 501,609 3,264,781 19,287 98,346 - 10,549,582
Additions to non-current assets 5,357 12,768 778 8,722 1,357 1,627 - 30,609
Other
activities Unallocated TotalNLB Group
Corporate
banking in
Slovenia
Retail
banking in
Slovenia
Financial
markets and
investment
banking in
Slovenia
Foreign
strategic
markets
Non-strategic
markets and
activities
b) Geographical information in EUR thousand
September September September September
NLB Group 2018 2017 2018 2017 30 Sept 2018 31 Dec 2017 30 Sept 2018 31 Dec 2017
Slovenia 244,290 243,559 213,158 218,759 175,679 189,928 8,581,282 8,293,381
South East Europe 184,031 181,035 155,341 144,904 126,982 128,768 4,176,516 3,913,015
Macedonia 61,661 64,944 52,576 50,174 31,055 32,320 1,260,911 1,235,163
Serbia 21,669 18,450 18,322 16,398 23,378 24,394 473,165 406,959
Montenegro 22,145 21,530 18,226 16,416 28,361 29,686 507,391 466,155
Croatia 17 171 1,284 331 2,865 1,923 26,787 29,312
Bosnia and Herzegovina 50,290 50,180 41,067 40,012 28,244 26,876 1,261,604 1,190,435
Kosovo 28,249 25,760 23,866 21,573 13,079 13,569 646,658 584,991
Western Europe 531 359 462 (98) 227 236 25,738 31,140
Germany 4 11 (136) 88 214 218 1,452 1,876
Switzerland 527 348 598 (186) 13 18 24,286 29,264
Czech Republic - 4 1 1,715 - - 182 209
Total 428,852 424,957 368,962 365,280 302,888 318,932 12,783,718 12,237,745
Revenues Net income Non-current assets Total assets
nine months ended nine months ended
The geographical analysis includes a breakdown of items with respect to the country in which individual
NLB Group entities are located.

99 NLB Group Interim report Q3 2018
8. Subsidiaries
NLB Group’s subsidiaries as at 30 September 2018 were:
Core members
NLB Banka a.d., Skopje Banking Republic of Macedonia 86.97 86.97
NLB Banka a.d., Podgorica Banking Republic of Montenegro 99.83 99.83
NLB Banka a.d., Banja Luka Banking Republic of Bosnia and Herzegovina 99.85 99.85
NLB Banka sh.a., Prishtina Banking Republic of Kosovo 81.21 81.21
NLB Banka d.d., Sarajevo Banking Republic of Bosnia and Herzegovina 97.34 97.34
NLB Banka a.d., Belgrade Banking Republic of Serbia 99.997 99.997
NLB Srbija d.o.o., Belgrade Real estate Republic of Serbia 100 100
NLB Skladi d.o.o., Ljubljana Finance Republic of Slovenia 100 100
NLB Crna Gora d.o.o., Podgorica Real estate Republic of Montenegro 100 100
Non-core members
NLB Leasing d.o.o. - v likvidaciji, Ljubljana Finance Republic of Slovenia 100 100
Optima Leasing d.o.o., Zagreb - "u likvidaciji" Finance Republic of Croatia 100 -
NLB Leasing Podgorica d.o.o., Podgorica - "u likvidaciji" Finance Republic of Montenegro 100 100
NLB Leasing d.o.o., Belgrade - u likvidaciji Finance Republic of Serbia 100 100
NLB Leasing d.o.o., Sarajevo Finance Republic of Bosnia and Herzegovina 100 100
NLB Lizing d.o.o.e.l., Skopje - vo likvidacija Finance Republic of Macedonia 100 100
Tara Hotel d.o.o., Budva Real estate Republic of Montenegro 100 12.71
PRO-REM d.o.o., Ljubljana - v likvidaciji Real estate Republic of Slovenia 100 100
OL Nekretnine d.o.o., Zagreb - u likvidaciji Real estate Republic of Croatia 100 -
BH-RE d.o.o., Sarajevo Real estate Republic of Bosnia and Herzegovina 100 -
REAM d.o.o., Zagreb Real estate Republic of Croatia 100 100
REAM d.o.o., Podgorica Real estate Republic of Montenegro 100 100
REAM d.o.o., Belgrade Real estate Republic of Serbia 100 100
SR-RE d.o.o., Belgrade Real estate Republic of Serbia 100 100
SPV 2 d.o.o., Belgrade Real estate Republic of Serbia 100 100
S-REAM d.o.o., Ljubljana Real estate Republic of Slovenia 100 100
CBS Invest d.o.o., Sarajevo Real estate Republic of Bosnia and Herzegovina 100 100
NLB InterFinanz AG, Zürich in Liquidation Finance Sw itzerland 100 100
NLB InterFinanz Praha s.r.o., Prague - v likvidaci Finance Czech Republic 100 -
NLB InterFinanz d.o.o., Belgrade - u likvidaciji Finance Republic of Serbia 100 -
Prospera plus d.o.o., Ljubljana - v likvidaciji Tourist and catering trade Republic of Slovenia 100 100
LHB AG, Frankfurt Finance Republic of Germany 100 100
NLB Group’s
shareholding
%Nature of Business Country of Incorporation
NLB’s
shareholding
%

100 NLB Group Interim report Q3 2018
NLB Group’s subsidiaries as at 31 December 2017 were:
Core members
NLB Banka a.d., Skopje Banking Republic of Macedonia 86.97 86.97
NLB Banka a.d., Podgorica Banking Republic of Montenegro 99.83 99.83
NLB Banka a.d., Banja Luka Banking Republic of Bosnia and Herzegovina 99.85 99.85
NLB Banka sh.a., Prishtina Banking Republic of Kosovo 81.21 81.21
NLB Banka d.d., Sarajevo Banking Republic of Bosnia and Herzegovina 97.34 97.34
NLB Banka a.d., Belgrade Banking Republic of Serbia 99.997 99.997
NLB Srbija d.o.o., Belgrade Real estate Republic of Serbia 100 100
NLB Skladi d.o.o., Ljubljana Finance Republic of Slovenia 100 100
NLB Nov penziski fond a.d., Skopje Insurance Republic of Macedonia 100 51
NLB Crna Gora d.o.o., Podgorica Real estate Republic of Montenegro 100 100
Non-core members
NLB Leasing d.o.o. - v likvidaciji, Ljubljana Finance Republic of Slovenia 100 100
Optima Leasing d.o.o., Zagreb - "u likvidaciji" Finance Republic of Croatia 100 -
NLB Leasing Podgorica d.o.o., Podgorica - "u likvidaciji" Finance Republic of Montenegro 100 100
NLB Leasing d.o.o., Belgrade - u likvidaciji Finance Republic of Serbia 100 100
NLB Leasing d.o.o., Sarajevo Finance Republic of Bosnia and Herzegovina 100 100
NLB Lizing d.o.o.e.l., Skopje - vo likvidacija Finance Republic of Macedonia 100 100
Tara Hotel d.o.o., Budva Real estate Republic of Montenegro 100 12.71
PRO-REM d.o.o., Ljubljana - v likvidaciji Real estate Republic of Slovenia 100 100
OL Nekretnine d.o.o., Zagreb - u likvidaciji Real estate Republic of Croatia 100 -
BH-RE d.o.o., Sarajevo Real estate Republic of Bosnia and Herzegovina 100 -
REAM d.o.o., Zagreb Real estate Republic of Croatia 100 100
REAM d.o.o., Podgorica Real estate Republic of Montenegro 100 100
REAM d.o.o., Belgrade Real estate Republic of Serbia 100 100
SR-RE d.o.o., Belgrade Real estate Republic of Serbia 100 100
SPV 2 d.o.o., Belgrade Real estate Republic of Serbia 100 100
NLB Propria d.o.o., Ljubljana - v likvidaciji Real estate Republic of Slovenia 100 100
CBS Invest d.o.o., Sarajevo Real estate Republic of Bosnia and Herzegovina 100 100
NLB InterFinanz AG, Zürich in Liquidation Finance Sw itzerland 100 100
NLB InterFinanz Praha s.r.o., Prague Finance Czech Republic 100 -
NLB InterFinanz d.o.o., Belgrade Finance Republic of Serbia 100 -
Prospera plus d.o.o., Ljubljana - v likvidaciji Tourist and catering trade Republic of Slovenia 100 100
LHB AG, Frankfurt Finance Republic of Germany 100 100
Nature of Business Country of Incorporation
NLB's
shareholding
%
NLB Group’s
shareholding
%
9. Events after the end of the reporting period
In September 2018 NLB applied for formal approval with ECB to pay out dividends in a total amount of EUR
270.6 million, which consists of: EUR 189.1 million of profit for fiscal year 2017 and EUR 81.5 million of
retained profit from previous years. Pursuant to ECB’s permission for distribution of the dividends, General
Assembly of NLB’s Shareholders approved the distribution and NLB d.d. paid dividends in the amount of
EUR 270.6 million to the registered shareholders of NLB on 22 October 2018.
On 14 November 2018 the Republic of Slovenia acting through Slovenski državni holding, d.d. concluded
the offering of no less than 10,000,001 (50% plus one share) and up to 14,999,999 (75% minus one share)
of NLB's shares held by the Republic of Slovenia. The offering was made to retail investors in Slovenia and
institutional investors in Slovenia and outside Slovenia. Assuming exercise of the overallotment option in full
the total offering size was 13,000,000 shares, where retail offering size was 385,369 shares and 1,010
GDRs, and institutional offering size was 1,614,865 shares and 10,998,756 GDRs. The offer price per share
was EUR 51.50, and offer price per GDR (five GDRs represent one share) was EUR 10.30. The shares are
listed on Ljubljana Stock Exchange and GDRs on London Stock Exchange. After the completed offering of
shares and assuming exercise of the overallotment option in full the Republic of Slovenia held 7,000,000
shares representing 35% of all NLB's shares.