Embed Size (px)
Citation preview

1 NEWS Colmar Brunton Poll
7-11 April 2018
Attention: Television New Zealand
Contact: (04) 913-3000
Release date: 16 April 2018
Level One
46 Sale Street, Auckland CBD PO Box 33690 Takapuna
Auckland 0740 Ph: (09) 919-9200
Level 9, Legal House
101 Lambton Quay PO Box 3622, Wellington 6011
Ph: (04) 913-3000
www.colmarbrunton.co.nz
1 NEWS Colmar Brunton Poll - Page 1
‹#›
Contents
Contents .......................................................................................................................................................... 1
Methodology summary ................................................................................................................................... 2
Summary of results .......................................................................................................................................... 3
Key political events .......................................................................................................................................... 4
Question order and wording ............................................................................................................................ 5
Party vote ........................................................................................................................................................ 6
Preferred Prime Minister ................................................................................................................................. 8
Economic outlook .......................................................................................................................................... 10
PM’s management of recent political events ................................................................................................. 12
Impact of parenthood on the Prime Minister’s performance ......................................................................... 13
Continued value in New Zealand being part of the Commonwealth .............................................................. 14
Top priorities for any additional spending in the 2018 budget ....................................................................... 15
Parliamentary seat entitlement ..................................................................................................................... 17
Method for calculating parliamentary seat entitlement ................................................................................ 17
1 NEWS Colmar Brunton Poll - Page 2
‹#›
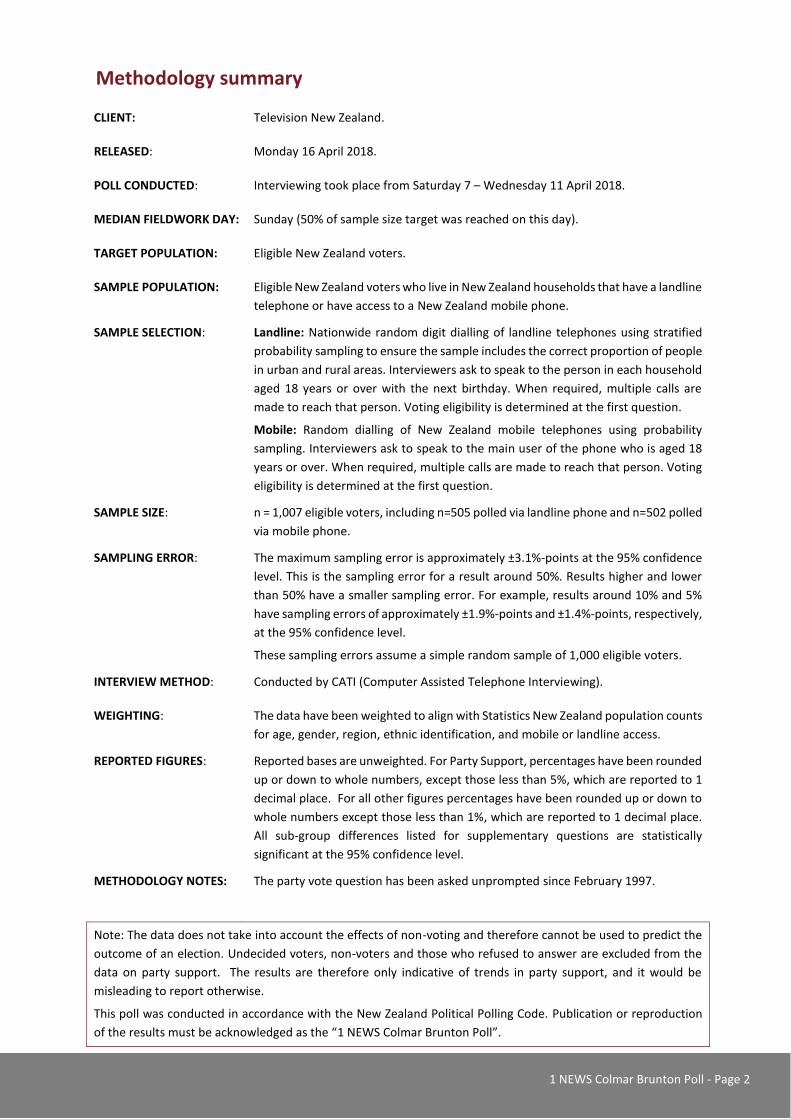
Methodology summary
CLIENT: Television New Zealand.
RELEASED: Monday 16 April 2018.
POLL CONDUCTED: Interviewing took place from Saturday 7 – Wednesday 11 April 2018.
MEDIAN FIELDWORK DAY: Sunday (50% of sample size target was reached on this day).
TARGET POPULATION: Eligible New Zealand voters.
SAMPLE POPULATION: Eligible New Zealand voters who live in New Zealand households that have a landline
telephone or have access to a New Zealand mobile phone.
SAMPLE SELECTION: Landline: Nationwide random digit dialling of landline telephones using stratified
probability sampling to ensure the sample includes the correct proportion of people
in urban and rural areas. Interviewers ask to speak to the person in each household
aged 18 years or over with the next birthday. When required, multiple calls are
made to reach that person. Voting eligibility is determined at the first question.
Mobile: Random dialling of New Zealand mobile telephones using probability
sampling. Interviewers ask to speak to the main user of the phone who is aged 18
years or over. When required, multiple calls are made to reach that person. Voting
eligibility is determined at the first question.
SAMPLE SIZE: n = 1,007 eligible voters, including n=505 polled via landline phone and n=502 polled
via mobile phone.
SAMPLING ERROR: The maximum sampling error is approximately ±3.1%-points at the 95% confidence
level. This is the sampling error for a result around 50%. Results higher and lower
than 50% have a smaller sampling error. For example, results around 10% and 5%
have sampling errors of approximately ±1.9%-points and ±1.4%-points, respectively,
at the 95% confidence level.
These sampling errors assume a simple random sample of 1,000 eligible voters.
INTERVIEW METHOD: Conducted by CATI (Computer Assisted Telephone Interviewing).
WEIGHTING: The data have been weighted to align with Statistics New Zealand population counts
for age, gender, region, ethnic identification, and mobile or landline access.
REPORTED FIGURES: Reported bases are unweighted. For Party Support, percentages have been rounded
up or down to whole numbers, except those less than 5%, which are reported to 1
decimal place. For all other figures percentages have been rounded up or down to
whole numbers except those less than 1%, which are reported to 1 decimal place.
All sub-group differences listed for supplementary questions are statistically
significant at the 95% confidence level.
METHODOLOGY NOTES: The party vote question has been asked unprompted since February 1997.
Note: The data does not take into account the effects of non-voting and therefore cannot be used to predict the
outcome of an election. Undecided voters, non-voters and those who refused to answer are excluded from the
data on party support. The results are therefore only indicative of trends in party support, and it would be
misleading to report otherwise.
This poll was conducted in accordance with the New Zealand Political Polling Code. Publication or reproduction
of the results must be acknowledged as the “1 NEWS Colmar Brunton Poll”.
1 NEWS Colmar Brunton Poll - Page 3
‹#›
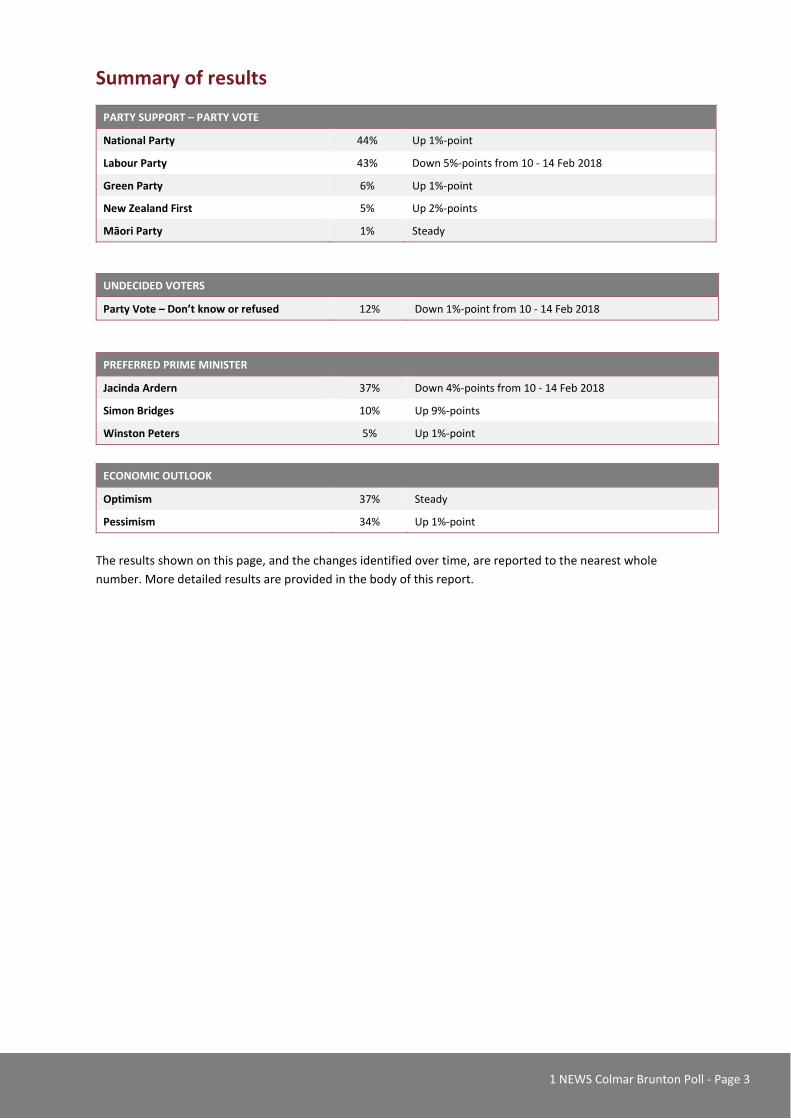
Summary of results
PARTY SUPPORT – PARTY VOTE
National Party 44% Up 1%-point
Labour Party 43% Down 5%-points from 10 - 14 Feb 2018
Green Party 6% Up 1%-point
New Zealand First 5% Up 2%-points
Māori Party 1% Steady
UNDECIDED VOTERS
Party Vote – Don’t know or refused 12% Down 1%-point from 10 - 14 Feb 2018
PREFERRED PRIME MINISTER
Jacinda Ardern 37% Down 4%-points from 10 - 14 Feb 2018
Simon Bridges 10% Up 9%-points
Winston Peters 5% Up 1%-point
ECONOMIC OUTLOOK
Optimism 37% Steady
Pessimism 34% Up 1%-point
The results shown on this page, and the changes identified over time, are reported to the nearest whole
number. More detailed results are provided in the body of this report.
1 NEWS Colmar Brunton Poll - Page 4
‹#›
Key political events
28 March – 11 April 2018
▪ Deputy Prime Minister Winston Peters confirmed that there was Russian intelligence activity in New Zealand, with the National Party later questioning his interest in Russia.
▪ The Government imposed travel bans on Russian diplomats expelled from other countries in the wake of the Salisbury nerve agent attack.
▪ Parliament unanimously passed a bill that allows the convictions of men for homosexual offences to be expunged from the public record.
▪ Prime Minister Jacinda Ardern has had to defend Broadcasting Minister Clare Curran over allegations that she (Curran) instructed RNZ chairman Richard Griffin not to attend the Economic Development select committee hearing.
▪ It was reported that hospitals around the country have building issues needing to be dealt with, but Health Minister Dr David Clark said that he cannot do much unless DHBs are frank about the issues.
▪ DHBs have warned the Government that a new regime for treating addicts is so underfunded that it risks unethical ‘revolving door’ treatment, potentially leading to chronic homelessness, seizures, and death.
▪ Former Green Party activist and leadership contender Vernon Tava confirmed he was seeking the National Party nomination in the Northcote byelection.
▪ It was reported that taxpayers have paid $3.4 million to five proposed charter schools that may never open, with Education Minister Chris Hipkins stating that the Government was bound by contracts signed before the election, despite the recent bill abolishing charter schools.
▪ Defence Force chief, Lieutenant-General Tim Keating, announced that he would not be seeking reappointment at the end of his term on June 30th.
▪ The Government has been urged to extend a legal defence for medicinal cannabis to non-terminal patients and people growing cannabis for pain relief, with submitters telling the health committee that the exemption should extend to covering patients with “severe and debilitating conditions”.
▪ The Government’s proposal to lift petrol taxes and scrap state highways in order to cover its transport plans led to a robust debate in Parliament, with National accusing the Government of giving up on provincial New Zealand and piling new costs on families.
1 NEWS Colmar Brunton Poll - Page 5
‹#›
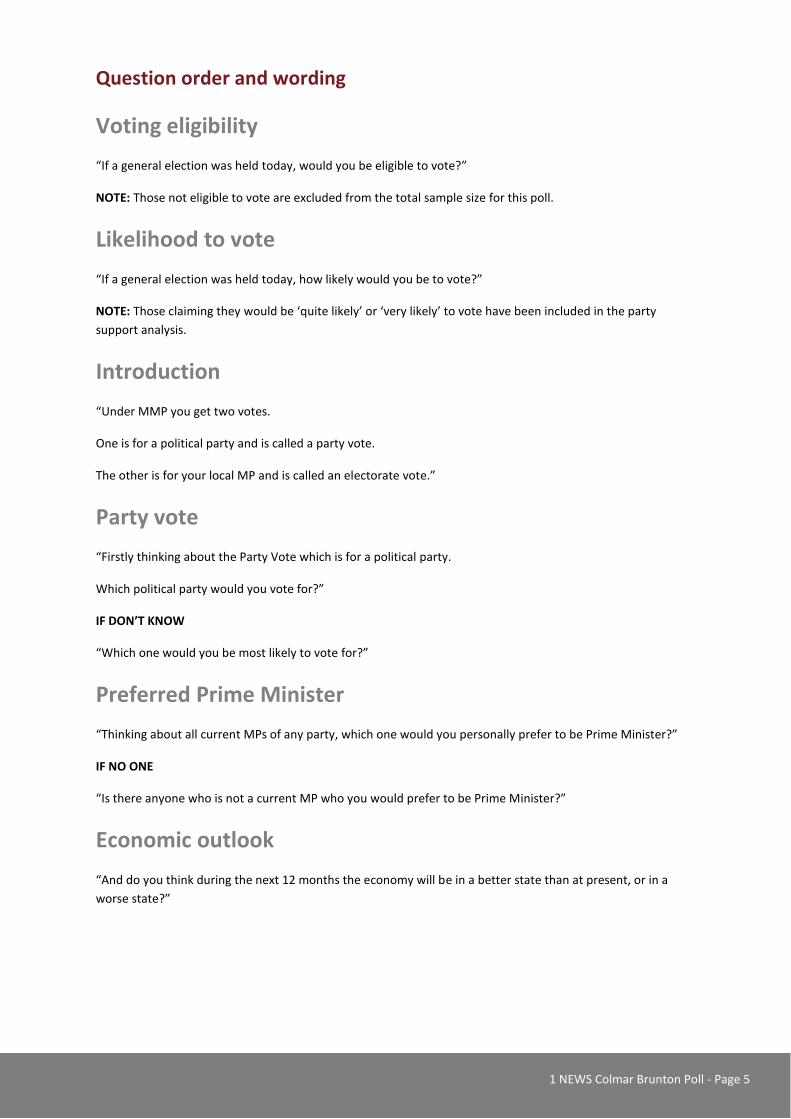
Question order and wording
Voting eligibility
“If a general election was held today, would you be eligible to vote?”
NOTE: Those not eligible to vote are excluded from the total sample size for this poll.
Likelihood to vote
“If a general election was held today, how likely would you be to vote?”
NOTE: Those claiming they would be ‘quite likely’ or ‘very likely’ to vote have been included in the party
support analysis.
Introduction
“Under MMP you get two votes.
One is for a political party and is called a party vote.
The other is for your local MP and is called an electorate vote.”
Party vote
“Firstly thinking about the Party Vote which is for a political party.
Which political party would you vote for?”
IF DON’T KNOW
“Which one would you be most likely to vote for?”
Preferred Prime Minister
“Thinking about all current MPs of any party, which one would you personally prefer to be Prime Minister?”
IF NO ONE
“Is there anyone who is not a current MP who you would prefer to be Prime Minister?”
Economic outlook
“And do you think during the next 12 months the economy will be in a better state than at present, or in a
worse state?”
1 NEWS Colmar Brunton Poll - Page 6
‹#›
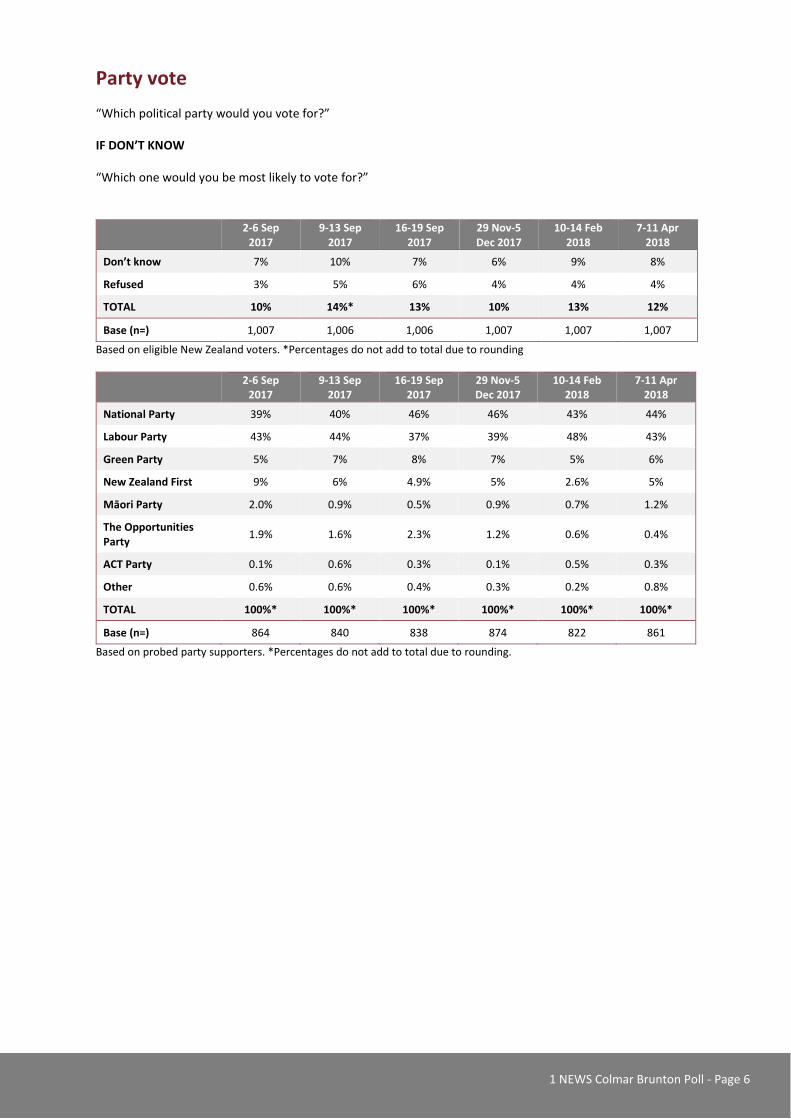
Party vote
“Which political party would you vote for?”
IF DON’T KNOW
“Which one would you be most likely to vote for?”
2-6 Sep
2017 9-13 Sep
2017 16-19 Sep
2017 29 Nov-5 Dec 2017
10-14 Feb 2018
7-11 Apr 2018
Don’t know 7% 10% 7% 6% 9% 8%
Refused 3% 5% 6% 4% 4% 4%
TOTAL 10% 14%* 13% 10% 13% 12%
Base (n=) 1,007 1,006 1,006 1,007 1,007 1,007
Based on eligible New Zealand voters. *Percentages do not add to total due to rounding
2-6 Sep
2017 9-13 Sep
2017 16-19 Sep
2017 29 Nov-5 Dec 2017
10-14 Feb 2018
7-11 Apr 2018
National Party 39% 40% 46% 46% 43% 44%
Labour Party 43% 44% 37% 39% 48% 43%
Green Party 5% 7% 8% 7% 5% 6%
New Zealand First 9% 6% 4.9% 5% 2.6% 5%
Māori Party 2.0% 0.9% 0.5% 0.9% 0.7% 1.2%
The Opportunities Party
1.9% 1.6% 2.3% 1.2% 0.6% 0.4%
ACT Party 0.1% 0.6% 0.3% 0.1% 0.5% 0.3%
Other 0.6% 0.6% 0.4% 0.3% 0.2% 0.8%
TOTAL 100%* 100%* 100%* 100%* 100%* 100%*
Base (n=) 864 840 838 874 822 861
Based on probed party supporters. *Percentages do not add to total due to rounding.
0%
10%
20%
30%
40%
50%
60%
2009 2010 2011 2012 2013 2014 2015 2016 2017 2018
National Labour NZ First Green
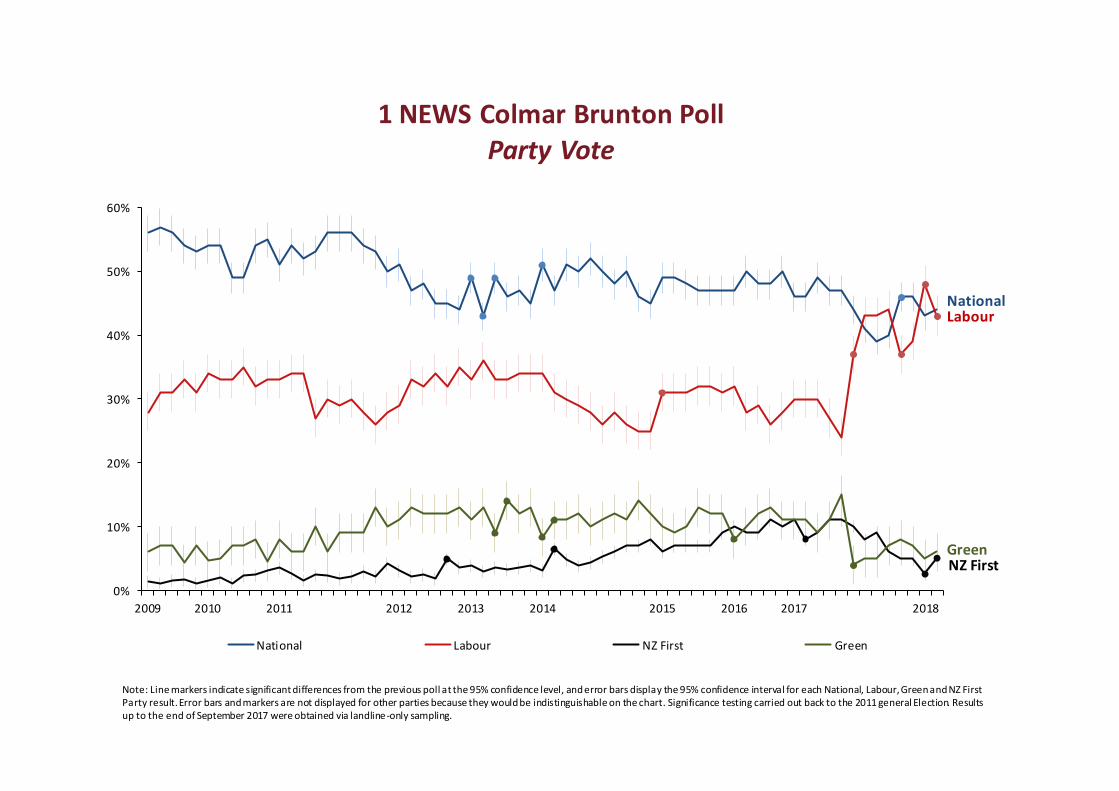
1 NEWS Colmar Brunton PollParty Vote
NationalLabour
GreenNZ First
Note: Line markers indicate significant differences from the previous poll at the 95% confidence level, and error bars display the 95% confidence interval for each National, Labour, Green and NZ First Party result. Error bars and markers are not displayed for other parties because they would be indistinguishable on the chart. Significance testing carried out back to the 2011 general Election. Results up to the end of September 2017 were obtained via landline-only sampling.
1 NEWS Colmar Brunton Poll - Page 8
‹#›
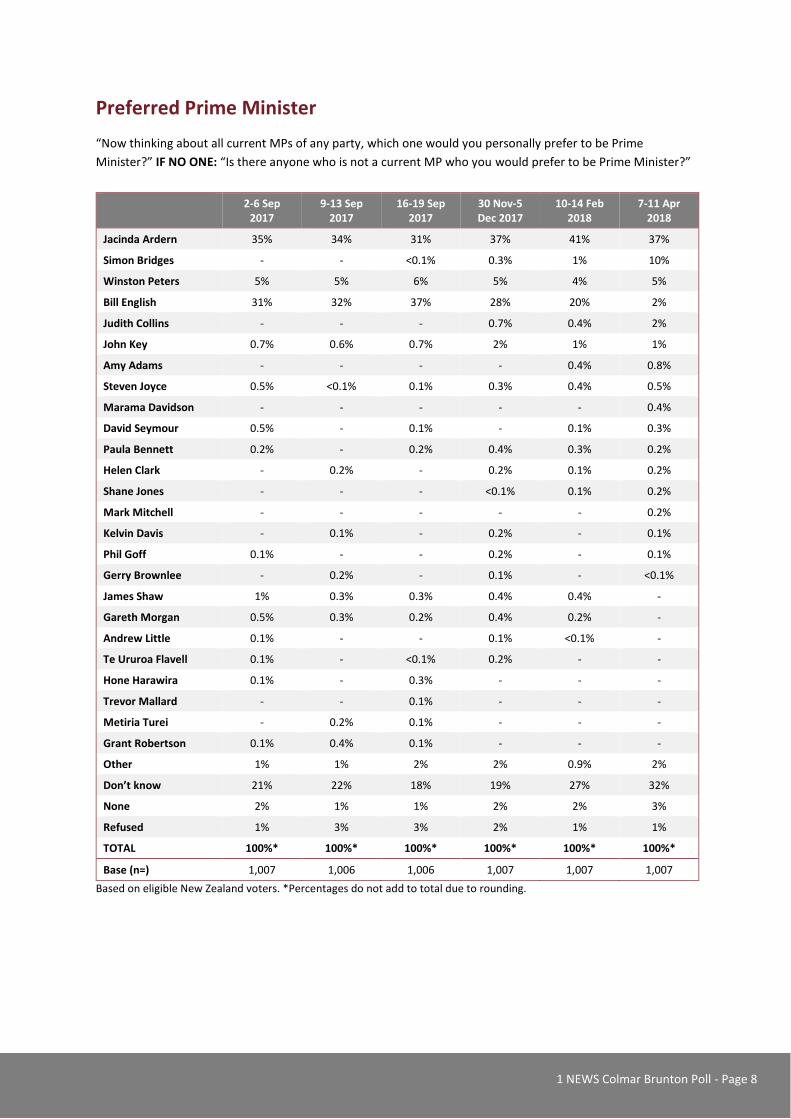
Preferred Prime Minister
“Now thinking about all current MPs of any party, which one would you personally prefer to be Prime
Minister?” IF NO ONE: “Is there anyone who is not a current MP who you would prefer to be Prime Minister?”
2-6 Sep
2017 9-13 Sep
2017 16-19 Sep
2017 30 Nov-5 Dec 2017
10-14 Feb 2018
7-11 Apr 2018
Jacinda Ardern 35% 34% 31% 37% 41% 37%
Simon Bridges - - <0.1% 0.3% 1% 10%
Winston Peters 5% 5% 6% 5% 4% 5%
Bill English 31% 32% 37% 28% 20% 2%
Judith Collins - - - 0.7% 0.4% 2%
John Key 0.7% 0.6% 0.7% 2% 1% 1%
Amy Adams - - - - 0.4% 0.8%
Steven Joyce 0.5% <0.1% 0.1% 0.3% 0.4% 0.5%
Marama Davidson - - - - - 0.4%
David Seymour 0.5% - 0.1% - 0.1% 0.3%
Paula Bennett 0.2% - 0.2% 0.4% 0.3% 0.2%
Helen Clark - 0.2% - 0.2% 0.1% 0.2%
Shane Jones - - - <0.1% 0.1% 0.2%
Mark Mitchell - - - - - 0.2%
Kelvin Davis - 0.1% - 0.2% - 0.1%
Phil Goff 0.1% - - 0.2% - 0.1%
Gerry Brownlee - 0.2% - 0.1% - <0.1%
James Shaw 1% 0.3% 0.3% 0.4% 0.4% -
Gareth Morgan 0.5% 0.3% 0.2% 0.4% 0.2% -
Andrew Little 0.1% - - 0.1% <0.1% -
Te Ururoa Flavell 0.1% - <0.1% 0.2% - -
Hone Harawira 0.1% - 0.3% - - -
Trevor Mallard - - 0.1% - - -
Metiria Turei - 0.2% 0.1% - - -
Grant Robertson 0.1% 0.4% 0.1% - - -
Other 1% 1% 2% 2% 0.9% 2%
Don’t know 21% 22% 18% 19% 27% 32%
None 2% 1% 1% 2% 2% 3%
Refused 1% 3% 3% 2% 1% 1%
TOTAL 100%* 100%* 100%* 100%* 100%* 100%*
Base (n=) 1,007 1,006 1,006 1,007 1,007 1,007
Based on eligible New Zealand voters. *Percentages do not add to total due to rounding.

1 NEWS Colmar Brunton PollPreferred Prime Minister
0%
10%
20%
30%
40%
50%
60%
2009 2010 2011 2012 2013 2014 2015 2016 2017 2018
Bill English Jacinda Ardern Winston Peters Andrew Little John Key
David Cunliffe David Shearer Phil Goff Simon Bridges

1 NEWS Colmar Brunton Poll - Page 10
‹#›
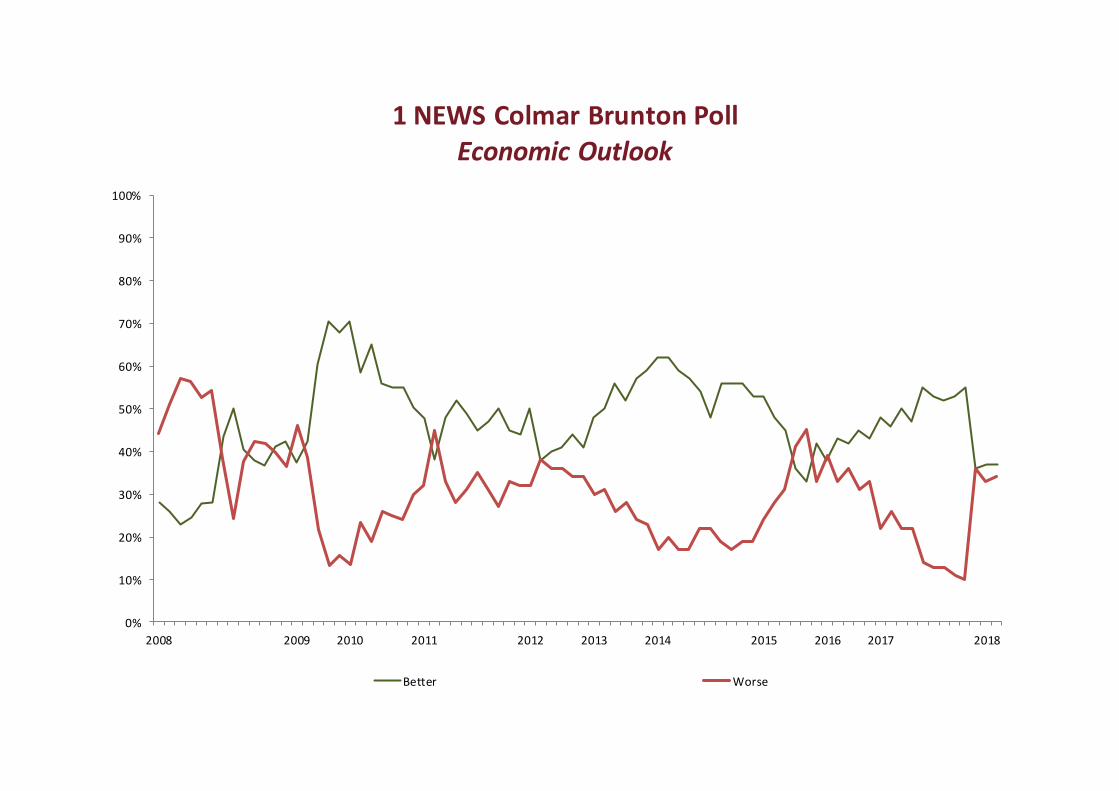
Economic outlook
“And do you think during the next 12 months the economy will be in a better state than at present, or in a
worse state?”
2-6 Sep
2017 9-13 Sep
2017 16-19 Sep
2017 30 Nov-5 Dec
2017 10-14 Feb
2018 7-11 Apr
2018
Better 52% 53% 55% 36% 37% 37%
Same 35% 36% 35% 28% 30% 29%
Worse 13% 11% 10% 36% 33% 34%
TOTAL 100% 100% 100% 100% 100% 100%
Base (n=) 1,007 1,006 1,006 1,007 1,007 1,007
Based on eligible New Zealand voters. *Percentages do not add to total due to rounding
1 NEWS Colmar Brunton PollEconomic Outlook
0%
10%
20%
30%
40%
50%
60%
70%
80%
90%
100%
2008 2009 2010 2011 2012 2013 2014 2015 2016 2017 2018
Better Worse
1 NEWS Colmar Brunton Poll - Page 12
‹#›
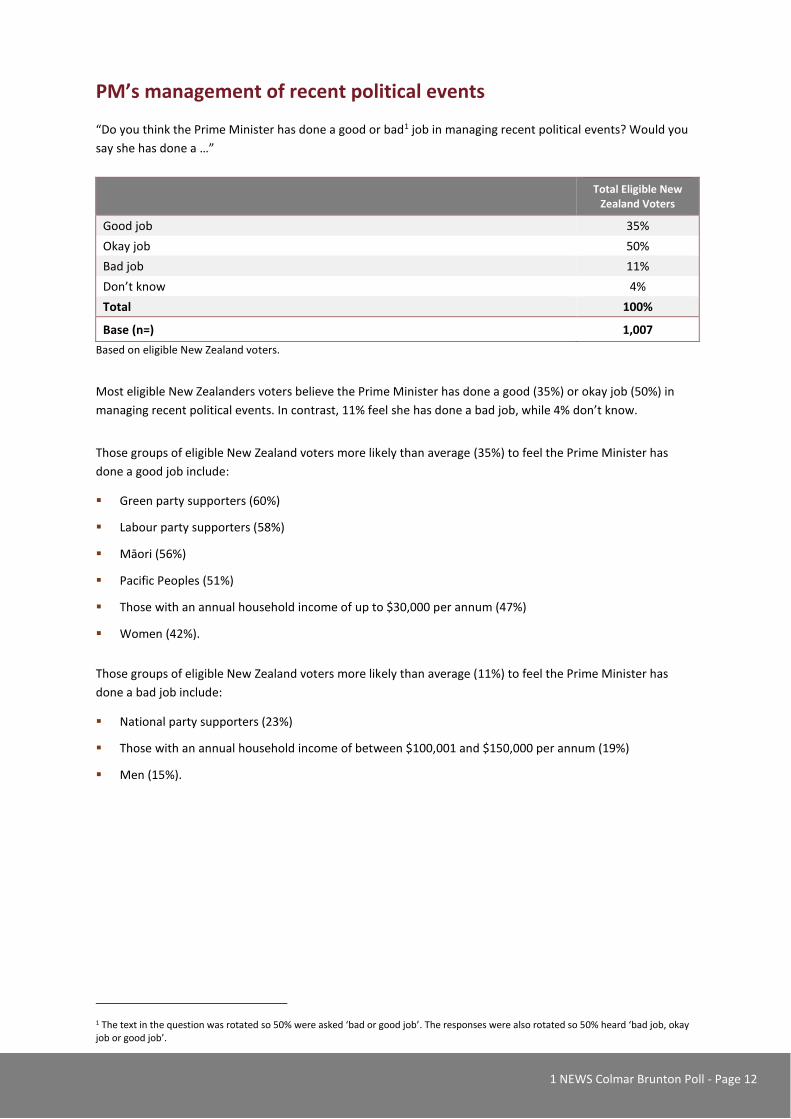
PM’s management of recent political events
“Do you think the Prime Minister has done a good or bad1 job in managing recent political events? Would you
say she has done a …”
Total Eligible New
Zealand Voters
Good job 35%
Okay job 50%
Bad job 11%
Don’t know 4%
Total 100%
Base (n=) 1,007
Based on eligible New Zealand voters.
Most eligible New Zealanders voters believe the Prime Minister has done a good (35%) or okay job (50%) in
managing recent political events. In contrast, 11% feel she has done a bad job, while 4% don’t know.
Those groups of eligible New Zealand voters more likely than average (35%) to feel the Prime Minister has
done a good job include:
▪ Green party supporters (60%)
▪ Labour party supporters (58%)
▪ Māori (56%)
▪ Pacific Peoples (51%)
▪ Those with an annual household income of up to $30,000 per annum (47%)
▪ Women (42%).
Those groups of eligible New Zealand voters more likely than average (11%) to feel the Prime Minister has
done a bad job include:
▪ National party supporters (23%)
▪ Those with an annual household income of between $100,001 and $150,000 per annum (19%)
▪ Men (15%).
1 The text in the question was rotated so 50% were asked ‘bad or good job’. The responses were also rotated so 50% heard ‘bad job, okay job or good job’.
1 NEWS Colmar Brunton Poll - Page 13
‹#›
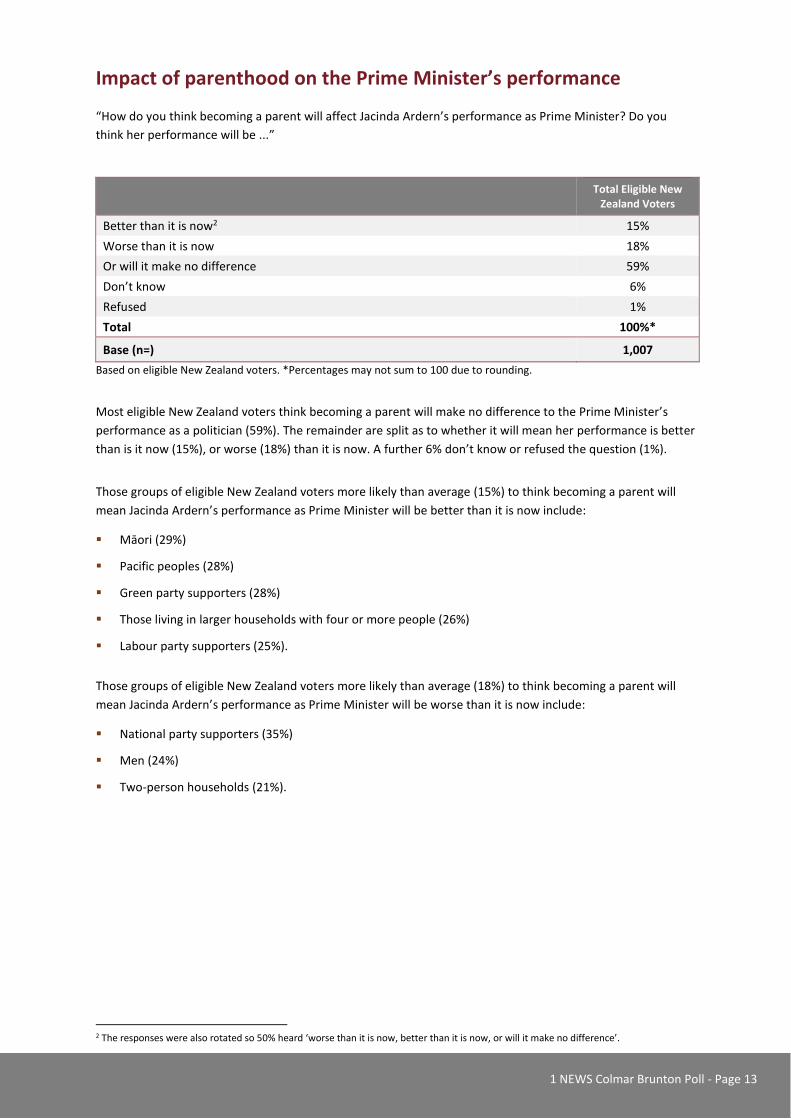
Impact of parenthood on the Prime Minister’s performance
“How do you think becoming a parent will affect Jacinda Ardern’s performance as Prime Minister? Do you
think her performance will be ...”
Total Eligible New
Zealand Voters
Better than it is now2 15%
Worse than it is now 18%
Or will it make no difference 59%
Don’t know 6%
Refused 1%
Total 100%*
Base (n=) 1,007
Based on eligible New Zealand voters. *Percentages may not sum to 100 due to rounding.
Most eligible New Zealand voters think becoming a parent will make no difference to the Prime Minister’s
performance as a politician (59%). The remainder are split as to whether it will mean her performance is better
than is it now (15%), or worse (18%) than it is now. A further 6% don’t know or refused the question (1%).
Those groups of eligible New Zealand voters more likely than average (15%) to think becoming a parent will
mean Jacinda Ardern’s performance as Prime Minister will be better than it is now include:
▪ Māori (29%)
▪ Pacific peoples (28%)
▪ Green party supporters (28%)
▪ Those living in larger households with four or more people (26%)
▪ Labour party supporters (25%).
Those groups of eligible New Zealand voters more likely than average (18%) to think becoming a parent will
mean Jacinda Ardern’s performance as Prime Minister will be worse than it is now include:
▪ National party supporters (35%)
▪ Men (24%)
▪ Two-person households (21%).
2 The responses were also rotated so 50% heard ‘worse than it is now, better than it is now, or will it make no difference’.

1 NEWS Colmar Brunton Poll - Page 14
‹#›
Continued value in New Zealand being part of the Commonwealth
“Do you think there is still value for New Zealand in being part of the Commonwealth?”
Total Eligible New
Zealand Voters
Yes 80%
No 12%
Don’t know 8%
Don’t know what the Commonwealth is <1%
Total 100%
Base (n=) 1,007
Based on eligible New Zealand voters.
Most eligible New Zealand voters see value in New Zealand being part of the Commonwealth (80% think so). A
minority (12%) do not see value in this, while the remaining 8% don’t know.
Those groups of eligible New Zealand voters more likely than average (80%) to think there is value in New
Zealand being part of the Commonwealth include:
▪ National party supporters (84%)
▪ Women (83%).
Those groups of eligible New Zealand voters more likely than average (12%) to think there is no longer value in
New Zealand being part of the Commonwealth include:
▪ Green party supporters (26%)
▪ Men (17%).
1 NEWS Colmar Brunton Poll - Page 15
‹#›
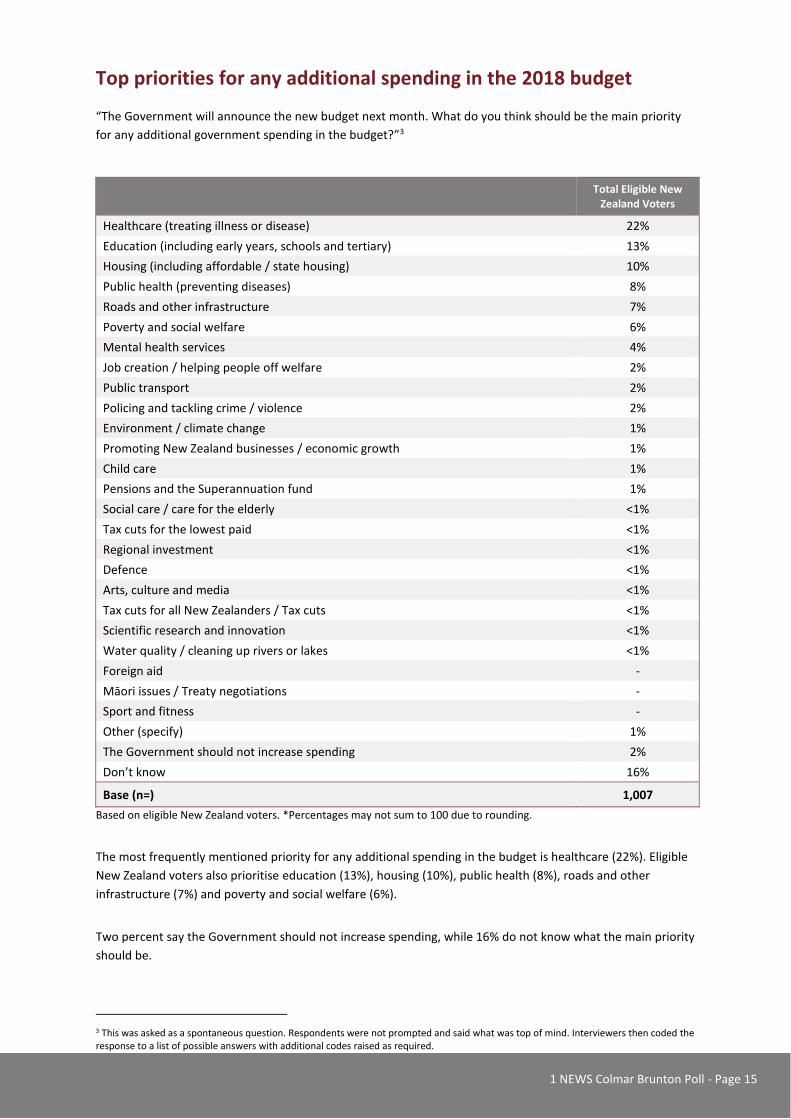
Top priorities for any additional spending in the 2018 budget
“The Government will announce the new budget next month. What do you think should be the main priority
for any additional government spending in the budget?”3
Total Eligible New
Zealand Voters
Healthcare (treating illness or disease) 22%
Education (including early years, schools and tertiary) 13%
Housing (including affordable / state housing) 10%
Public health (preventing diseases) 8%
Roads and other infrastructure 7%
Poverty and social welfare 6%
Mental health services 4%
Job creation / helping people off welfare 2%
Public transport 2%
Policing and tackling crime / violence 2%
Environment / climate change 1%
Promoting New Zealand businesses / economic growth 1%
Child care 1%
Pensions and the Superannuation fund 1%
Social care / care for the elderly <1%
Tax cuts for the lowest paid <1%
Regional investment <1%
Defence <1%
Arts, culture and media <1%
Tax cuts for all New Zealanders / Tax cuts <1%
Scientific research and innovation <1%
Water quality / cleaning up rivers or lakes <1%
Foreign aid -
Māori issues / Treaty negotiations -
Sport and fitness -
Other (specify) 1%
The Government should not increase spending 2%
Don’t know 16%
Base (n=) 1,007
Based on eligible New Zealand voters. *Percentages may not sum to 100 due to rounding.
The most frequently mentioned priority for any additional spending in the budget is healthcare (22%). Eligible
New Zealand voters also prioritise education (13%), housing (10%), public health (8%), roads and other
infrastructure (7%) and poverty and social welfare (6%).
Two percent say the Government should not increase spending, while 16% do not know what the main priority
should be.
3 This was asked as a spontaneous question. Respondents were not prompted and said what was top of mind. Interviewers then coded the response to a list of possible answers with additional codes raised as required.
1 NEWS Colmar Brunton Poll - Page 16
‹#›
Those groups of eligible New Zealand voters more likely than average (22%) to think healthcare should be the
main priority for any additional spending in the budget include:
▪ Older people, aged 55 and over (28%)
▪ Those with an annual household income of between $70,001 and $100,000 (28%)
▪ Two-person households (27%)
▪ New Zealand Europeans (25%).
Those groups of eligible New Zealand voters more likely than average (13%) to think education should be the
main priority for any additional spending in the budget include:
▪ Asian New Zealanders (24%)
▪ Those with an annual household income of more than $150,000 (20%)
▪ Middle-aged people, aged 35-54 (18%)
▪ Women (16%).
Those groups of eligible New Zealand voters more likely than average (10%) to think housing should be the
main priority for any additional spending in the budget include:
▪ Pacific peoples (18%)
▪ Labour party supporters (16%)
▪ Those with an annual household income of between $100,001 and $150,000 (16%).
Those groups of eligible New Zealand voters more likely than average (8%) to think public health should be the
main priority for any additional spending in the budget include:
▪ Women (10%).
Those groups of eligible New Zealand voters more likely than average (7%) to think roads and infrastructure
should be the main priority for any additional spending in the budget include:
▪ National party supporters (12%)
▪ Men (10%).
Those groups of eligible New Zealand voters more likely than average (6%) to think poverty and social welfare
should be the main priority for any additional spending in the budget include:
▪ Green party supporters (21%).
1 NEWS Colmar Brunton Poll - Page 17
‹#›
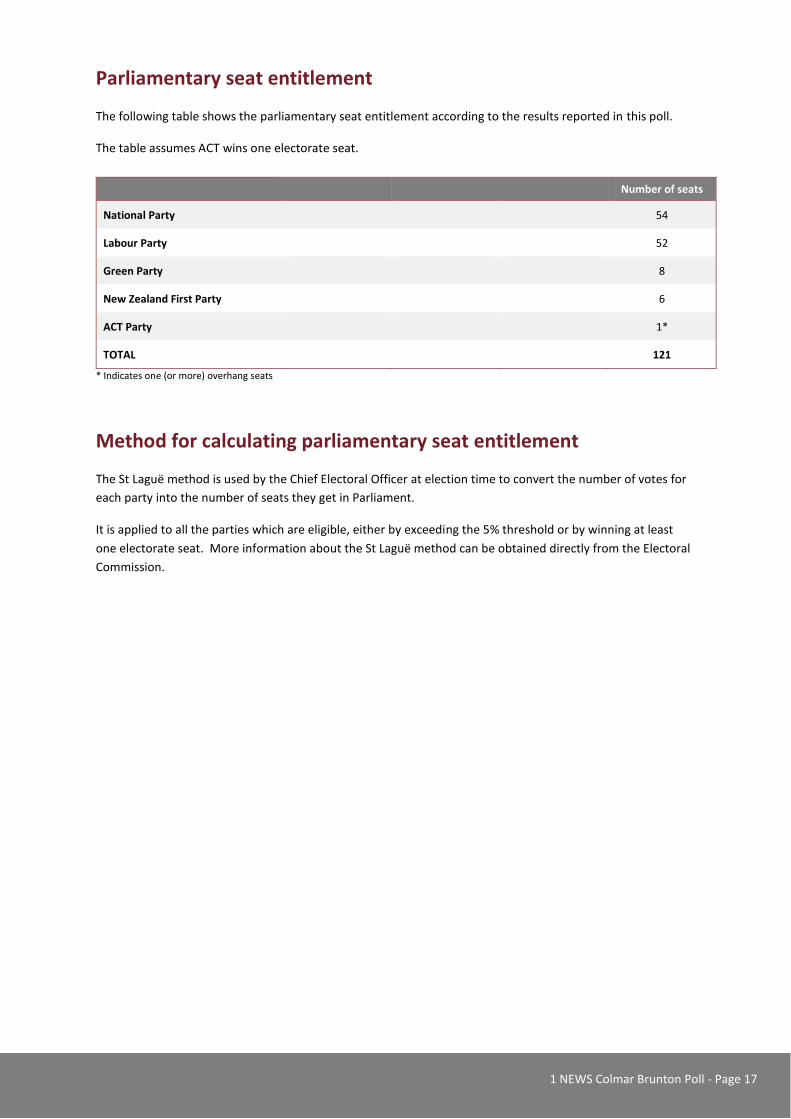
Parliamentary seat entitlement
The following table shows the parliamentary seat entitlement according to the results reported in this poll.
The table assumes ACT wins one electorate seat.
Number of seats
National Party
54
Labour Party
52
Green Party
8
New Zealand First Party
6
ACT Party
1*
TOTAL
121
* Indicates one (or more) overhang seats
Method for calculating parliamentary seat entitlement
The St Laguë method is used by the Chief Electoral Officer at election time to convert the number of votes for
each party into the number of seats they get in Parliament.
It is applied to all the parties which are eligible, either by exceeding the 5% threshold or by winning at least
one electorate seat. More information about the St Laguë method can be obtained directly from the Electoral
Commission.