Embed Size (px)
Citation preview

1
New Formulation and Optimization Methods
for Water Sensor Placement
Yue Zhao, Rafi Schwartz, Elad Salomons, Avi Ostfeld and H. Vincent Poor
Abstract
Optimal sensor placement for detecting contamination events in water distribution systems is a well
explored problem in water distribution systems security. We study herein the problem of sensor placement
in water networks to minimize the consumption of contaminated water prior to contamination detection.
For any sensor placement, the average consumption of contaminated water prior to event detection
amongst all simulated events is employed as the sensing performance metric. A branch and bound
sensor placement algorithm is proposed based on greedy heuristics and convex relaxation. Compared
to the state of the art results of the battle of the water sensor networks (BWSN) study, the proposed
methodology demonstrated a significant performance enhancement, in particular by applying greedy
heuristics to repeated sampling of random subsets of events.
I. INTRODUCTION
A water distribution system (WDS) is a basic infrastructure in modern society. Contamination
events generated in the network can risk many lives within minutes. This underlines the impor-
tance of gaining knowledge regarding detection of such events within a WDS. Contamination of
water networks can be caused by intentional and unintentional events. The necessity to connect to
Y. Zhao is an Assistant Professor with the Department of Electrical and Computer Engineering, Stony Brook University, Stony
Brook, NY, 11794 USA (e-mail: [email protected]).
R. Schwartz is an MSc student with the Faculty of Civil and Environmental Engineering, Technion - Israel Institute of
Technology, Haifa 32000, ISRAEL (e-mail: [email protected]).
E. Salomons is the director of OptiWater (http://www.optiwater.com), 6 Amikam Israel St., Haifa, 3438561, Israel, (e-mail:
A. Ostfeld is a Professor with the Faculty of Civil and Environmental Engineering, Technion - Israel Institute of Technology,
Haifa 32000, ISRAEL (e-mail: [email protected]).
H. V. Poor is the Michael Henry Strater University Professor of Electrical Engineering and the Dean of School of Engineering
and Applied Science, Princeton University, Princeton, NJ 08544 USA (e-mail: [email protected]).

2
all consumers causes WDSs to be spatially dispersed so that supervision and control over central
pipelines is not economically viable. In addition, many unintentional contamination events may
not be identified by only grab sampling monitoring. These demonstrate the need to place sensors,
which measure quality parameters in water distribution systems, to allow detection of such cases
and prevent further consumption of contaminated water.
Currently, there are limited predefined actions in case of a contamination event in water
networks (Hart and Murray, 2010). The assumption is that in case of an event a “Do Not Use”
order will likely be declared first which can evolve to a shutdown of the entire system in extreme
circumstances. The evolution of sensor deployment and assessment in the network may lead to
the option of isolating the contaminant and shutting off only the polluted region. This would
allow solving for the optimal performance of a network with specific links and consumers taken
out of the network operation.
Optimal sensor placement integrates two conflicting intentions: insuring the health and safety
of the population, on the one hand, and satisfying the budget and other constraints which define
the number of sensors assigned to the project, on the other (Berry et al., 2005; Ostfeld et al.,
2008; Berry et. al., 2008b; Hart 2008). As a result, sensor placement optimization can be used
to lower the degree of impact on consumers, keeping it to a minimum.
We study placing sensors to minimize the consumption of contaminated water prior to detection
of the contamination. Given any sensor placement, the average consumption of contaminated
water prior to event detection among all simulated events is employed as the sensing performance
metric. We then transform the sensor placement problem into a mixed integer-convex program-
ming (MICP) problem. A greedy heuristic and a branch and bound algorithm are developed
and implemented on two benchmark battle of the water sensor networks (BWSN) example
applications (Ostfeld et al., 2008). We discovered that our method is greatly competitive, and
improves the state of the art results.
II. LITERATURE REVIEW
Intentional injection of contaminants in WDSs can be attained with relatively simple equip-
ment. The only constraint is to be able to overcome the relatively low pressure in the network.
Contamination events in water distribution systems are not particularly common, yet several have
been reported (Hickman, 1999; Denininger, 2000; Craun et al., 1991; Clark et al., 1996; HACH,
2011; Whelton et al., 2014; Ha’aretz, 2014).

3
As an example, one such recent event is the West Virginia’s Elk River contamination incident
(Whelton et al., 2014). In that occurrence an industrial solvent contaminated the Elk River,
causing about 300,000 residents to detach from access to potable water. The chemical spill
originated upstream from the principal water distribution system treatment plant intake. A Do Not
Use order was called shortly after the event, which lasted for about ten days. Post the immediate
consequences, investigations were still ongoing and the communities were still recovering more
than eleven months after the incident.
Contamination events can be detected by sensors placed within the network. The state of the
art sensor packages include a set of sensors and a device with computational and analytical
capabilities. The sensors measure indicative water quality parameters such as pH, residual
chlorine, turbidity, and electrical conductivity. The data collected by the sensors is then analyzed
to determine if there is an indication of an event alert. This is the so called event detection
problem which attracted substantial interest in recent years (e.g., EPA, 2012 through CANARY;
Perelman et al., 2012; Arad et al., 2013; Oliker and Ostfeld, 2014a, 2014b).
As sensors cannot be placed at every system node as of budget and other constraints, only a
small set of monitoring stations can be deployed. This reality led to the development of numerous
algorithms which attempt to find the optimal locations of a limited number of sensors within a
WDS.
The first study on sensor placement is attributed to Lee et al. (1991). Lee et al. (1991), Lee
and Deininger (1992), and Kumar et al. (1997) solved the sensor placement problem with use of
mixed integer linear programming (MILP). The objective function was defined as the maximum
demand coverage and steady state flows were assumed in the network. Later on Harmant et. al
(1999), Woo et. al (2001), Propato et. Al (2005) and Berry et. al (2005) modified the demand
coverage to include water quality and time dependence in the demands. With the introduction
of heuristic optimization, Al-Zahrani et al. (2001, 2003) employed genetic algorithms to solve
the same problem formulation.
Following Lee et al. (1991), Kessler et al. (1998) added to the coverage problem an all shortest
path algorithm and the construction of a pollution matrix. The pollution matrix contained data
regarding the nodes which are contaminated by many possible contamination events. The defini-
tion of a contaminated node in their study refers to a contaminant concentration which is above
a predefined threshold. Ostfeld and Salomons (2004) expanded the study of Kessler et al. (1998)

4
by introducing a randomized pollution matrix (RPM) which holds a set of randomly generated
multiple injection locations and times. The values in the matrix are binary and determine if a
node was contaminated at a specific random event. The RPM concept is also used in this study.
Other studies suggested different concepts for sensor placement. Cozzolino et. al (2006)
formulated a Lagrangian advection method which estimates the time of each flow path in the
network. Chastain (2006) created a database of responses to contamination events at each node in
the network. Berry et al. (2008a) formulated a low memory Lagrangian relaxation method which
simplified the original problem by assigning a penalty to constraint violation. Berry et al. (2008b)
and Hart (2008) presented the Teva Spot toolkit which combines general purpose heuristics with
integer programming and bounding algorithms. Several others are based on risk assessment to
the consumers (Propato, 2006; Kraus et al. 2006, 2008), data uncertainties (Chastain, 2004; Carr
et al., 2004, 2006), imperfect sensors (Wu et al., 2008; Preis and Ostfeld, 2008a; Berry et al.,
2006), and multi-objective formulations (Aral et al., 2008; Dorini et al., 2006; Preis and Ostfeld,
2008b).
A benchmark in sensor placement modeling development is the battle of the water sensor
networks (BWSN) study held in Cincinnati in 2006 (Ostfeld et al., 2008). The BWSN compared
fifteen different approaches of optimal sensor placement in water distribution systems. The
approaches considered four objectives: (1) the time of detection; (2) affected population prior
to detection; (3) consumption of contaminated water prior to detection; and (4) likelihood of
detection. This work is using the networks and outcomes of the BWSN for comparing and
evaluating the current developed model and algorithms.
Research on sensor placement is still ongoing: Chang et. al (2012) formulated a rule-based
decision support system which consists of two rules: (1) Accessibility; and (2) complexity which
is parallel to the optional path calculations from previous articles. Diao and Rauch (2013)
presented a controllability analysis of the network which determines the nodes that have an
outcome indication over a maximum number of downstream nodes.
III. PROBLEM FORMULATION
We consider placing sensors in water distribution networks for detecting water contamination.
For any contamination event, we are interested in the consumption of the contaminated water
prior to detection of the event. The RPM which is constructed as part of the problem, holds a risk

5
assessment for many contamination events. Each column in the matrix represents a contamination
event and each row, a network node. Each value of the matrix represents an assessment of the
consumption of the contaminated water assuming that a sensor in the related node is the first
to detect the event. For example: if the value in row two column four is 100, then the fourth
event will have 100 gallons of the contaminated water consumed before the contaminated water
flows into node two and then would immediately be detected by the sensor located there. The
matrix results are according to simultaneous simulations with EPANET and EPANET-MSX
which calculate the contaminant concentration within the network over time. No assumptions
were made as to the risk injection locations to this network and therefore all network nodes
were assumed to have an even probability for a contamination event.
We denote the set of all possible sensor locations by N = {1, 2, . . . , N}, and a set of simulated
contamination events by E = {E1, E2, . . . , EK}. We define a matrix G ∈ RN×K , in which gnk
is the consumption of the contaminated water prior to detection of contamination event Ek at
node n, if Ek happens.
A. Optimal Sensor Placement
Given a set of M sensors M ⊆ N , for any event Ek, we consider the detection time of
this event to be the minimum detection time among these sensors. This is because, Ek will be
detected as long as it is detected by any one of the sensors inM. Consequently, the consumption
of the contaminated water prior to event detection by the sensors in M is minm∈M gmk. For
evaluating the performance by the set of sensors M on detecting all the K events, we employ
an average-impact criterion as follows:
gavg(M) =1
K
∑Ek∈E
minm∈M
gmk. (1)
In other words, we consider the average consumption of the contaminated water among all events
as the performance metric.
With a limited number of sensors, we investigate which M among the N locations to place
sensors in order to optimize contamination detection performance. Based on the average-impact
metric (1), we formulate the optimal sensor placement problem as follows:
minM⊆N
gavg(M) (2)
s.t. |M| ≤M, (3)

6
where | · | denotes the cardinality of a set. Clearly, (2) is a combinatorial optimization problem,
for which an exhaustive search will render a exponential computational complexity of(NM
).
B. Approximation of the Optimization Problem
To overcome the combinatorial complexity of (2), we first employ the following approximation
of minm∈M
gmk in (1), setting up for a mixed binary integer convex programming (MICP) that
follows. Specifically,
minm∈M
gmk ≈ −β log
(∑m∈M
exp
(−gmk
β
)). (4)
where β > 0 is a tunable parameter. The rationale of this approximation is that the log-sum-
exp function is a differentiable approximation of the non-differentiable max function (Boyd and
Vandenberghe (2004)). In particular, the lower β is, the better approximation we have, and as
β goes to zero, this approximation becomes exact. In practice, however, β cannot be chosen
arbitrarily close to zero for algorithmic reasons (Boyd and Vandenberghe (2004)). In addition,
we need a minimum numerical precision of exp(−gmk
β
): if β is too small, exp
(−gmk
β
)will
go below machine precision and be rounded to exactly zero. A comprehensive discussion of the
choice of β is given later in Section V-C.
Next, we introduce a sensor location indicator vector w ∈ RN×1, in which
∀n = 1, 2, . . . , N, wn =
1, if n ∈M, i.e., there is a sensor at location n,
0, otherwise.(5)
Accordingly, we have ∑m∈M
exp
(−gmk
β
)=
N∑n=1
wn exp
(−gnkβ
). (6)
Substituting (6) and (4) into (1) and (2), and rewriting the constraint on the number of sensors
(3) in terms of w, we arrive at the following optimization problem,
minw− β
K
∑Ek∈E
log
(N∑n=1
wn exp
(−gnkβ
))(7)
s.t.
N∑n=1
wn ≤M, wn ∈ {0, 1}.
Note that the objective (7) is convex in w. Because w is a binary vector, solving (7) is a MICP
which requires a worst-case exponential computational complexity. In the next section, we will

7
Algorithm 1: Greedy Sensor Placement
Initialize the set of sensor locations M0 = ∅,
and the number of sensors m = 0.
Repeat
m← m+ 1,
Mm =Mm−1 ∪
{argmin
n∈N\Mm−1
gavg (Mm−1 ∪ {n})
}(9)
Until m =M .
see that it allows a convex relaxation, and eventually a branch and bound algorithm that can
effectively solve for its global optimum.
IV. SENSOR PLACEMENT ALGORITHM DESIGN
A. A Greedy Heuristic
We first develop a low-complexity greedy sensor placement heuristic as in Algorithm 1 for
optimizing the original objective (2). It generates a series of sensor locationsM1,M2, . . . ,MN
for M = 1, 2, . . . , N , respectively, that satisfy the following consistency property:
M1 ⊂M2 ⊂ . . . ⊂MN . (8)
In other words, given the total number of sensors M , we choose sensor locations one by one:
At each step, we keep the already chosen locations; from the remaining locations, we choose
the one that minimizes the current step’s average consumption of the contaminated water prior
to contamination event detection, and include it in the set of the chosen locations. We note that
this greedy heuristic can also be applied to the approximate formulation (7), which will be used
as a building block in the branch and bound algorithm development next.
B. A Branch and Bound Algorithm
Toward finding globally optimal sensor locations with low computational complexity, we begin
with the approximate formulation (7). Since (7) has a convex objective function in w, it has the
following relaxation as a convex optimization:

8
minw− β
K
∑Ek∈E
log
(N∑n=1
wn exp
(−gnkβ
))(10)
s.t.N∑n=1
wn ≤M, 0 ≤ wn ≤ 1.
Accordingly, the optimal value of (10) serves as a lower bound, denoted by L1, on the global
optimum of (7). Meanwhile, the same as in Algorithm 1, a greedy heuristic applied to (7)
provides an upper bound on its global optimum, denoted by U1.
For any location j, (7) can be split into two sub-problems by fixing wj to be either 0 or 1:
minw− β
K
∑Ek∈E
log
(N∑n=1
wn exp
(−gnkβ
))(11)
s.t.N∑n=1
wn ≤M, wn ∈ {0, 1},
wj = 0.
and
minw− β
K
∑Ek∈E
log
(N∑n=1
wn exp
(−gnkβ
))(12)
s.t.N∑n=1
wn ≤M, wn ∈ {0, 1},
wj = 1.
Similarly to (10), relaxations of these two sub-problems can be formed by replacing wn ∈ {0, 1}
with 0 ≤ wn ≤ 1, and they provide lower bounds, denoted by l(0)2 and l(1)
2 , on the global optima
of (11) and (12) respectively. Meanwhile, applying the greedy heuristic under the constraint
wj = 0 or wj = 1 provides upper bounds, denoted by u(0)2 and u
(1)2 , on these sub-problems’
global optima. Define
L2 , max{l(0)2 , l
(1)2 }, and U2 , max{u(0)
2 , u(1)2 }. (13)
Then, L2 and U2 are new lower and upper bounds on the global optimum of (7) (Balakrishnan
et al. (1991)).
More generally, the above splitting procedure with relaxations and greedy heuristics can be
applied on the sub-problems themselves to form more children sub-problems with lower and

9
upper bounds. For example, for any location s, (s 6= j), (11) can be further split into two
sub-problems by adding yet another constraint ws = 0 or ws = 1 respectively.
We define the following lower and upper bounding oracles, as well as an oracle that returns
the next location to split:
Definition 1: Oracle LB(C) takes a constraint set C as input, where C specifies a set of
locations whose sensor indicator variables are pre-determined to be either 0 or 1. An MICP
under the constraints C is formed, a relaxation is solved, and the optimum of this relaxation is
output by LB(C) as a lower bound on the optimum of the constrained MICP.
For example, in (11) and (12), the constraint sets are C(0) = {wj = 0} and C(1) = {wj = 1},
respectively.
Definition 2: Oracle UB(C) takes a constraint set C as input. An MICP under the constraints
C is formed, a feasible sensor placement solution is found by a greedy heuristic, and the achieved
objective value is output by UB(C) as an upper bound on the optimum of the constrained MICP.
Definition 3: Based on the order of the locations chosen by the greedy heuristic, Oracle
next(C) outputs the first location that is chosen by this heuristic.
When a sub-problem with constraints C needs to be split further, next(C) is the location we
choose to perform the splitting by fixing wnext(C) to be either 0 or 1.
We now provide a branch and bound algorithm as in Algorithm 2 where imax is the maximum
number of iterations allowed. As the algorithm progresses, a binary tree is developed where
each node represents a constraint set. The leaf nodes are kept in S . The tree starts with a single
node, {∅}, corresponding to no initial constraint. When a sub-problem corresponding to a leaf
node C∗ is split into two new sub-problems, the two new constraint sets C(0) and C(1) become
the children of the parent constraint set C∗.
In Algorithm 2, (15) is a generalization of (13). It means that the current global lower bound
equals the lowest lower bound among all the leaf node constraint sets. This is true because all
the leaf nodes S represent a complete partition of the original parameter space. At the beginning
of every iteration, in choosing which leaf node to split (14), we select the one that gives the
lowest lower bound (i.e., the current global lower bound). It is a heuristic based on the reasoning
that, by further splitting this critical leaf node, a higher global lower bound may be obtained,
(whereas splitting any other node will leave the global lower bound unchanged.) At iteration i,
the current lower and upper bounds on the global optimum are available as Li and Ui. When

10
Algorithm 2:
Sensor Placement using Branch and Bound
Initial step: i = 1,
the initial constraint set: C1 = ∅,
the initial set of leaves of the tree of constraint sets
(initially a single node): S = {C1}.
Compute L1 = LB(C1), U1 = UB(C1).
While Ui − Li > ε or i < imax, repeat
Choose which leaf node constraint set to split:
C∗ = argminC∈S
{LB(C)}. (14)
Choose the next location to split, j = next(C∗),
Form two new constraint sets,
C(0)i+1 = C∗ ∪ {wj = 0}, C(1)i+1 = C∗ ∪ {wj = 1}.
In the set of leaves S, replace the parent constraint set C∗ with
the two children C(0)i+1 and C(1)i+1:
S ← (S\{C∗}) ∪ {C(0)i+1} ∪ {C(1)i+1}.
Compute new lower and upper bounds for the two new
constrained MICP:
LB(C(0)i+1), LB(C(1)i+1), UB(C(0)i+1), UB(C(1)i+1),
Update the global lower and upper bounds,
Li+1 = minC∈S{LB(C)}, Ui+1 = min
C∈S{UB(C)}. (15)
i← i+ 1.
Choose the best achieved solution so far:
C = argminC∈S UB(C).
Return the greedy solution under the constraint set C.
these two bounds meet, i.e., Ui − Li < ε, the solution that achieves the current upper bound is
guaranteed to be globally optimal.
As the total number of possible constraint sets is 2N (corresponding to the 2N sensor location
indicator vectors w), Algorithm 2 is guaranteed to converge in 2N iterations (and in practice
much less as will be shown later.) To limit the algorithm’s run time, a maximum number of

11
iterations imax can be enforced as in Algorithm 2.
Finally, we define iachieve to be the number of iterations used to achieve the globally optimal
solution, and iprove the number of iterations used to prove its global optimality. In other words,
it takes iachieve iterations for the upper bound to reach the global optimum, while it takes iprove
iterations for both the upper and lower bounds to reach the global optimum.
V. PERFORMANCE EVALUATION
In this section, we evaluate the proposed sensor placement algorithms in two representative
water networks that have served as the benchmarks in the Battle of the Water Sensor Networks
(BWSN) (Ostfeld et al., 2008), a previously held sensor placement design competition that
represents the state of the art.
A. Network and Event Data Description
The BWSN competition provides two benchmark systems: a 129-node network (BWSN1) and
a 12527-node network (BWSN2). The topologies of the two networks are depicted in Figure 1.
More than 37000 events are simulated for the 129-node network, and more than 25000 events
for the 12527-node network. All further details are summarized in Ostfeld et al. (2008). We
also attach as supplementary files the two BWSN network example applications we used as .inp
EPANET files. The reader can thus follow all the detailed results presented below.
Fig. 1: Topology of the two networks of the battle of the water sensor networks (BWSN) (Ostfeld et al., 2008)
BWSN1 network BWSN2 network
Fig. 1. Topology of the two networks of the battle of the water sensor networks (BWSN) (Ostfeld et al., 2008).

12
The problem data is the matrix G. For each pair of sensor m and event Ek, the entry gmk
can take two types of values: i) a nonnegative number that represents the consumption of the
contaminated water (gallons) before sensor m detects event Ek, as described in Section III, ii)
“-1”, meaning that that sensor does not detect the event at all. The performance metric for any
sensor placement solution consists of two numbers:
• The average consumption of the contaminated water for all detected events: gavg:
gavg =
∑Ek∈E I (minm∈M gmk ≥ 0) ·minm∈M gmk∑
Ek∈E I (minm∈M gmk ≥ 0), (16)
where I (minm∈M gmk ≥ 0) is the indicator function on whether event Ek is detected at all.
• The event detection likelihood, i.e., the number of events being detected by at least one
sensor, divided by the number of all events: P(detect):
P(detect) =
∑Ek∈E I (minm∈M gmk ≥ 0)
K. (17)
Clearly, these two objectives must be considered simultaneously. For example, one can have
close to zero detection likelihood but a small average consumption of the contaminated water
among the few detected events; this would not be a desirable result. The problem is thus a
bi-criterion optimization, and there is a Pareto optimal boundary of (P(detect), pavg).
Our problem formulation (cf. Section III) is minimizing the average consumption of the
contaminated water among all events, detected and undetected. Thus, we need to employ a
number value in terms of the consumption of the contaminated water for estimating the impact
of undetected events. A natural choice of this number value is provided later in Section V-C,
in which we will define a “ceiling” denoted by p. Our formulation can then be understood as
a “scalarization” of this bi-criterion optimization problem considered in BWSN, as it scalarizes
optimizing two objectives in a program with a single objective (Boyd and Vandenberghe (2004),
Section 4.7.4).
B. Solutions and Evaluation Results
We now demonstrate our findings for the two BWSN benchmark networks. We present in
Tables I, II III and IV the 5, 5, 4 and 6 sets of representative sensor locations found based on
the proposed algorithms (and a technique of sampling subsets of events to be described later
in Section V-D) for the 129-node and 12527-node networks, each with either 5 or 20 sensors
as in the BWSN competition. The resulting average consumption of the contaminated water

13
and detection likelihood for each set of sensor locations are also given. These results are then
compared with all the previous results presented in the BWSN competition representing the state
of the art, as shown in Figures 2, 3, 4 and 5. As higher detection likelihood and lower average
consumption of the contaminated water are preferred, points to the right and lower in the plots
represent more desirable performance.
TABLE I
OPTIMIZED SENSOR LOCATIONS, 129-NODE NETWORK, 5 SENSORS
Sets Sensor locations gavg P(detect)
1st set 18, 50, 69, 84, 99 1830 0.6839
2nd set 11, 22, 69, 84, 116 2956 0.7286
3rd set 11, 18, 32, 84, 101 3682 0.7519
4th set 11, 18, 32, 84, 121 3951 0.7624
5th set 11, 18, 46, 84, 121 7841 0.8004
TABLE II
OPTIMIZED SENSOR LOCATIONS, 129-NODE NETWORK, 20 SENSORS
Sets Sensor locations gavg P(detect)
1st set 5 , 11, 18, 19, 22, 26, 31, 32, 35, 38, 43, 47, 69, 78, 83, 84, 91, 100, 103, 120 363 0.8070
2nd set 5, 11, 18, 25, 31, 32, 35, 36, 47, 69, 78, 83, 84, 91, 99, 101, 103, 104, 115, 122 405 0.8443
3rd set 6, 11, 18, 22, 25, 32, 35, 36, 46, 69, 78, 83, 84, 91, 99, 101, 103, 117, 121, 123 441 0.8675
4th set 11, 18, 22, 28, 32, 35, 36, 46, 69, 77, 83, 84, 91, 99, 101, 103, 113, 117, 122, 123 540 0.8830
5th set 11, 18, 20, 22, 32, 35, 36, 46, 69, 75, 81, 84, 98, 101, 103, 113, 117, 122, 123, 125 678 0.8981
TABLE III
OPTIMIZED SENSOR LOCATIONS, 12527-NODE NETWORK, 5 SENSORS
Sets Sensor locations gavg P(detect)
1st set 3358, 3771, 10875, 11185, 11305 1830 0.2556
2nd set 1480, 3358, 3771, 10875, 11305 2956 0.2794
3rd set 637, 1487, 3230, 3771, 11305 3682 0.3048
4th set 637, 1487, 3230, 3771, 3837 3951 0.3156
14
TABLE IV
OPTIMIZED SENSOR LOCATIONS, 12527-NODE NETWORK, 20 SENSORS
Sets Sensor locations gavg P(detect)
1st set 637, 1918, 2531, 3230, 3358, 3585, 3771, 4033, 4116, 4137, 4241, 5115, 6584, 8845,
9000, 9143, 9723, 10477, 10615, 11178
21512 0.3746
2nd set 74, 1905, 1918, 2531, 3358, 3627, 3771, 3782, 4116, 4133, 4241, 4553, 6584, 7933,
8847, 9000, 9143, 9365, 10615, 11272
25798 0.3924
3rd set 123, 1905, 1918, 2531, 3358, 3636, 3771, 3837, 4116, 4133, 4241, 6584, 7665, 7933,
8845, 9000, 9143, 9365, 11178, 11305
28007 0.3986
4th set 1487, 1905, 2593, 3236, 3358, 3676, 3771, 3782, 4033, 4150, 4241, 4307, 7665,
8835, 9000, 9143, 9365, 10875, 11178, 11305
32330 0.4072
5th set 74, 619, 1487, 1905, 2074, 2593, 3125, 3236, 3358, 3676, 3771, 3780, 4241, 7437,
7665, 9365, 10408, 10615, 10875, 11185
38059 0.4174
6th set 552, 1487, 2074, 2593, 3125, 3236, 3358, 3679, 3771, 3785, 4241, 4278, 5329, 7437,
7665, 8090, 9365, 10875, 11185, 11305
45708 0.4276
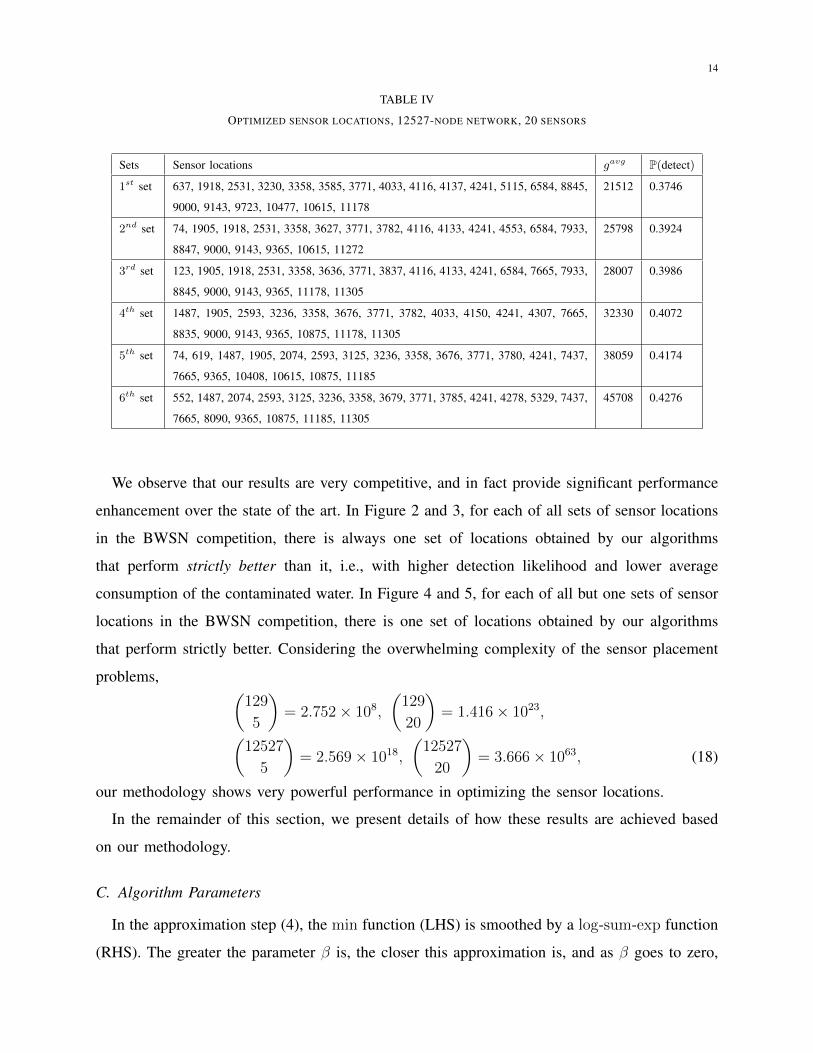
We observe that our results are very competitive, and in fact provide significant performance
enhancement over the state of the art. In Figure 2 and 3, for each of all sets of sensor locations
in the BWSN competition, there is always one set of locations obtained by our algorithms
that perform strictly better than it, i.e., with higher detection likelihood and lower average
consumption of the contaminated water. In Figure 4 and 5, for each of all but one sets of sensor
locations in the BWSN competition, there is one set of locations obtained by our algorithms
that perform strictly better. Considering the overwhelming complexity of the sensor placement
problems, (129
5
)= 2.752× 10⁸,
(129
20
)= 1.416× 10²³,(
12527
5
)= 2.569× 10¹⁸,
(12527
20
)= 3.666× 1063, (18)
our methodology shows very powerful performance in optimizing the sensor locations.
In the remainder of this section, we present details of how these results are achieved based
on our methodology.
C. Algorithm Parameters
In the approximation step (4), the min function (LHS) is smoothed by a log-sum-exp function
(RHS). The greater the parameter β is, the closer this approximation is, and as β goes to zero,

15
Detection Likelihood0.2 0.3 0.4 0.5 0.6 0.7 0.8 0.9
Aver
age
Affe
cted
Pop
ulat
ion
1000
2000
3000
4000
5000
6000
7000
8000
9000
10000
11000
Results from BWSNResults from this work
4
13
5
11
7
10 8
3
1
612
9
142
aver
age
cons
umpt
ion
of th
e co
ntam
inat
ed w
ater(gallons)
Fig. 2. Detection likelihood and average consumption of the contaminated water with 5 sensors in the 129-Node Network.
BWSN labels: 1 = Berry et al.; 2 = Dorini et al.; 3 = Eliades and Polycarpou; 4 = Ghimire and Barkdoll (demand); 5 = Ghimire
and Barkdoll (mass); 6 = Guan et al.; 7 = Gueli; 8 = Huang et al.; 9 = Krause et al.; 10 = Ostfeld and Salomons; 11 = Preis
and Ostfeld; 12 = Propato and Piller; 13 = Trachtman; 14 = Wu and Walski.
the RHS of (4) converges to the LHS. However, β cannot be set arbitrarily small due to the
following numerical reason. Specifically, if gmk is large but β is relatively small, exp(−gmk
β
)in
(4) can fall below machine precision and be rounded to zero. For an event Ek, if gmk is too large
(compared to β) for every m ∈M,∑
m∈M exp(−gmk
β
)and log
(∑m∈M exp
(−gmk
β
))will be
computed as 0 and −∞, respectively. This will then lead to a −∞ objective in (7). This situation
can in fact happen very frequently, or even at all times, when selecting just a small number of
sensors but evaluating a large number of events, as considered in the BWSN benchmarks. This
is because, it can happens that, no matter where the sensors are located, there is always some
“worst-case” event (among all) that is poorly detected and leads to large consumption of the
contaminated water, driving exp(−gmk
β
)to zero.
To overcome this issue, for any chosen β, we impose a ceiling g on the entries in G: gmk ←
min (gmk, g) ,∀m, k, where g is set so that exp(− gβ
)is above machine precision. Clearly, both
parameters β and g affect the approximation of the original problem, which becomes more
precise with a smaller β and a larger g. From the above, however, the ratio gβ
cannot exceed
a level determined by the machine precision. There is thus a trade off between the choices of
β and g. With a machine precision around 5 × 10−324 (as on the laptop used for most of the

16
Detection Likelihood0.55 0.6 0.65 0.7 0.75 0.8 0.85 0.9 0.95
Aver
age
Affe
cted
Pop
ulat
ion
200
400
600
800
1000
1200
1400
1600
1800Results from BWSNResults from this work
4
135
7
10
8
3
16
129
14
2
aver
age
cons
umpt
ion
of th
e co
ntam
inat
ed w
ater(gallons)
Fig. 3. Detection likelihood and average consumption of the contaminated water with 20 sensors in the 129-Node Network.
BWSN labels: 1 = Berry et al.; 2 = Dorini et al.; 3 = Eliades and Polycarpou; 4 = Ghimire and Barkdoll (demand); 5 = Ghimire
and Barkdoll (mass); 6 = Guan et al.; 7 = Gueli; 8 = Huang et al.; 9 = Krause et al.; 10 = Ostfeld and Salomons; 11 = Preis
and Ostfeld; 12 = Propato and Piller; 13 = Trachtman; 14 = Wu and Walski.
simulations in this section), gβ
cannot exceed − log(5× 10−324) = 744.44.
With this limit in mind, the choice of β (and correspondingly g) depends on a rough knowledge
of the problem data G: in particular, we make a rough guess on the ballpark of the optimal
objective value of the original problem (2), namely the minimum achievable average consumption
of the contaminated water. The idea is that, as long as β is somewhat small relative to this value,
it needs not be too small. This ballpark value can be obtained by simply evaluating any sensor
placement heuristics at hand. As we employ the BWSN benchmarks in this paper, we take the
best results achieved in the BWSN competition as indicators of this ballpark value. Specifically,
• For selecting 5 sensor locations in the 129-node network, the lowest average consumption
of the contaminated water achieved in the BWSN competition is 2459 gallons. Accordingly,
we choose β = 1000.
• For selecting 20 sensor locations in the 129-node network, the lowest average consumption
of the contaminated water achieved in the BWSN competition is 408 gallons. Accordingly,
we choose β = 200.
• For selecting 5 sensor locations in the 12527-node network, the lowest average consumption

17
Detection Likelihood0.1 0.15 0.2 0.25 0.3 0.35
Aver
age
Affe
cted
Pop
ulat
ion
#105
0
1
2
3
4
5
6
7Results from BWSNResults from this work
4 and 5
13
11
8
3
1 and 96
1014
2
aver
age
cons
umpt
ion
of th
e co
ntam
inat
ed w
ater
(gallons)
Fig. 4. Detection likelihood and average consumption of the contaminated water with 5 sensors in the 12527-Node Network.
BWSN labels: 1 = Berry et al.; 2 = Dorini et al.; 3 = Eliades and Polycarpou; 4 = Ghimire and Barkdoll (demand); 5 = Ghimire
and Barkdoll (mass); 6 = Guan et al.; 7 = Gueli; 8 = Huang et al.; 9 = Krause et al.; 10 = Ostfeld and Salomons; 11 = Preis
and Ostfeld; 12 = Propato and Piller; 13 = Trachtman; 14 = Wu and Walski.
of the contaminated water achieved in the BWSN competition is 95403 gallons. Accordingly,
we choose β = 40000.
• For selecting 20 sensor locations in the 12527-node network, the lowest average con-
sumption of the contaminated water achieved in the BWSN competition is 17456 gallons.
Accordingly, we choose β = 10000.
D. Random Subsets of Events
The problem sizes for both BWSN benchmarks are exceedingly large, as we have more than
37000 events for the 129-node network, and more than 25000 events for the 12527-node network.
To speed up the proposed algorithms, we employ the following technique: Instead of running the
greedy and branch and bound algorithms for the entire set of events, we randomly sample subsets
of the events for running the algorithms. We then repeat this random sampling for a considerable
number of trials, and pick the best achieved results. Interestingly, repeatedly sampling a very
small number of events, on the order of 20 to 200, can already lead to great performance (as
demonstrated in the evaluation results above).

18
Detection Likelihood0.2 0.25 0.3 0.35 0.4 0.45
Aver
age
Affe
cted
Pop
ulat
ion
#105
0
0.2
0.4
0.6
0.8
1
1.2
1.4
1.6
1.8
2Results from BWSNResults from this work
4 and 5
13
1
8
3
6
10
14
2
9aver
age
cons
umpt
ion
of th
e co
ntam
inat
ed w
ater(gallons)
Fig. 5. Detection likelihood and average consumption of the contaminated water with 20 sensors in the 12527-Node Network.
BWSN labels: 1 = Berry et al.; 2 = Dorini et al.; 3 = Eliades and Polycarpou; 4 = Ghimire and Barkdoll (demand); 5 = Ghimire
and Barkdoll (mass); 6 = Guan et al.; 7 = Gueli; 8 = Huang et al.; 9 = Krause et al.; 10 = Ostfeld and Salomons; 11 = Preis
and Ostfeld; 12 = Propato and Piller; 13 = Trachtman; 14 = Wu and Walski.
Moreover, randomly selecting subsets of events also allows us to explore the Pareto optimal
boundary (the lower-right frontier in Figures 2, 3, 4 and 5) of average consumption of the
contaminated water vs. detection likelihood. Note that, for each fixed set of parameters and
subset of events, our algorithm runs deterministically, and the optimal value is unique. The
vastly different random subsets of events provide a diversity in the input data for exploring
different points on the Pareto optimal boundary. The choice of the ceiling parameter g also
provides a degree of freedom for exploring different points on the Pareto optimal boundary.
E. Power of Greedy Heuristic
Surprisingly, we found that, with the above parameter choices and random sampling of small
subsets of events, the proposed greedy heuristic can already perform extremely well. In fact, all
the results shown in Section V-B are achieved simply by greedy heuristic applied to different
subsets of events (but of course evaluated using the entire set of events). Moreover, we used the
proposed branch and bound algorithm beyond the greedy heuristic for the 129-node network,
and observed the following interesting fact: For the cases that generate the solutions in Table
I, although it took a few hundreds of iterations for the upper bound and lower bound to meet,

19
i.e., proving the global optimality of the solution, the optimal solution is always found in just 1
iteration, i.e., by the greedy heuristic. In other words, while iprove (defined at the end of Section
IV-B) can be a few hundred, iachieve is just 1. A representative plot for the progression of the
lower and upper bounds is given in Figure 6.
Iteration0 50 100 150 200 250
Obj
ectiv
e va
lue
of th
e ap
prox
imat
e pr
oble
m
-1508
-1506
-1504
-1502
-1500
-1498
-1496
-1494
-1492
-1490Lower boundUpper bound
Fig. 6. Progression of the lower and upper bounds with the branch and bound algorithm.
This discovered power of the proposed greedy heuristic is greatly useful in practice, particularly
for networks of very large sizes such as the 12527-node benchmark network. For networks of
such sizes, continuous optimization based approaches can take exceedingly long times to finish,
and the proposed simple but powerful greedy heuristic becomes very appealing.
VI. CONCLUSIONS
We have studied optimal sensor placement in water distribution systems for detecting contam-
ination events and reducing consumption of the contaminated water. We employ two benchmark
networks of 129 nodes and 12527 nodes and the corresponding contamination events from
the Battle of Water Sensor Networks for performance evaluation and comparison to the state
of the art. We employ the performance metric determined by the average consumption of the
contaminated water among all events, and optimize the sensor placement to minimize this metric.
Novel modeling and approximation techniques are developed to transform the combinatorial

20
optimization of sensor placement into a mixed integer-convex programming problem. A greedy
heuristic is first developed. We have then developed a branch and bound algorithm to find the
global optimum of the MICP, based on convex relaxation and the greedy heuristic. The branch
and bound algorithm allows us to keep improving sensor placement solutions as long as run-time
constraints permit, and provides bounds that indicate the gap to the global optimum. We have
further developed a technique of repeatedly and randomly sampling subsets of events for running
the algorithms. It has been demonstrated that significant performance enhancement of the state
of the art is achieved by the proposed algorithms, in particular by the greedy heuristic applied to
repeatedly sampled random subsets of events. The developed methodology is broadly applicable
to employing other metrics for optimizing water sensor placement. In general, to achieve different
points on the Pareto optimal boundary under different metrics, tuning the algorithm parameters
will play an important role, and a systematic way of parameter tuning is left for future research.
VII. ACKNOWLEDGEMENTS
This study was supported by the Technion Grand Water Research Institute, by the Technion
Funds for Security research, by the joint Israeli Office of the Chief Scientist (OCS) Ministry of
Science, Technology and Space (MOST), and by the Germany Federal Ministry of Education
and Research (BMBF), under project no. 02WA1298.
REFERENCES
[1] M.A. Al-Zahrani and K. Moeid. Locating optimum water quality monitoring stations in water distribution system. Proc.,
World Water and Environmental Resources Congress, ASCE, Reston, Va., 393402, 2001.
[2] M.A. Al-Zahrani and K. Moeid. Optimizing water quality monitoring stations using genetic algorithms. Arabian Journal
for Science and Engineering, 28(1B):57-75, 2003.
[3] Arad J., Housh M., Perelman L., and Ostfeld A. (2013). A dynamic thresholds scheme for contaminant event detection in
water distribution systems. Water Research, Vol. 47, No. 5, pp. 1899-1908.
[4] M.M. Aral, J. Guan, and M.L. Maslia. A multi-objective optimization algorithm for sensor placement in water distribution
systems. Proc., World Environmental and Water Resources Congress, ASCE, Reston, Va., 2008.
[5] V. Balakrishnan, S. Boyd, and S. Balemi. Branch and bound algorithm for computing the minimum stability degree of
parameter-dependent linear systems. Int. J. Robust and Nonlinear Control, 1(4):295 - 317, October - December 1991.
[6] J. Berry, E. Boman, C.A. Phillips, and L. Riesen. Low memory lagrangian relaxation methods for sensor placement in
municipal water networks. Proc., World Environmental and Water Resources Congress, ASCE, Reston, Va., 2008a.
[7] J. Berry, R.D. Carr, W.E. Hart, V.J. Leung, C.A. Phillips, and J.P. Watson. On the placement of imperfect sensors in
municipal water networks. Proc., Water Distribution System Symp., ASCE, Reston, Va., 2006.

21
[8] J. Berry, L. Fleischer, W.E. Hart, C.A. Phillips, and J.P. Watson. Sensor placement in municipal water networks. J. Water
Planning and Resources Management, 131(3):237-243, 2005.
[9] J.W. Berry, E. Boman, L.A. Riesen, W.E. Hart, C.A. Phillips, and J.P. Watson. User’s manual: Teva-spot toolkit 2.0. Sandia
National Laboratories, Albuquerque, N.M., 2008b.
[10] S.P. Boyd and L. Vandenberghe. Convex Optimization. Cambridge University Press, Cambridge, UK, 2004.
[11] R.D. Carr, H.J. Greenberg, W.E. Hart, and C.A. Phillips. Addressing modeling uncertainties in sensor placement for
community water systems. Proc., World Water and Environment Resources Conf., ASCE, Reston, Va., 2004.
[12] R. Carr et al. Robust optimization of contaminant sensor placement for community water systems. Math. Program. Ser.
B, 107:337-356, 2006.
[13] N.B. Chang, N.P. Pongsanone, and A. Ernest. Optimal sensor deployment in a large-scale complex drinking water
distribution network: comparisons between a rule-based decision support system and optimization models. Comput Chem
Eng, 43:191-199, 2012.
[14] J.R. Chastain Jr. A heuristic methodology for locating monitoring stations to detect contamination events in potable water
distribution systems. University South Florida, Tampa, Fla., 2004.
[15] J.R. Chastain Jr. Methodology for locating monitoring stations to detect contamination in potable water distribution systems.
J. Infrastruct. Syst., 124:252-259, 2006.
[16] R.M. Clark, E.E. Geldreich, K.R. Fox, E.W. Rice, C.W. Johnson, J.A. Goodrich, J.A. Barnick, and F. Abdesaken. Tracking
a salmonella serovar typhimurium outbreak in gideon, missouri: Role of contaminant propagation modeling. J. of Water
Supply and Technology - Aqua, 45(4):171-183, 1996.
[17] L. Cozzolino, C. Mucherino, D. Pianese, and F. Pirozzi. Positioning, within water distribution networks, of monitoring
stations aiming at an early detection of intentional contamination. Civ. Eng. Environ. Syst., 23(3):161-174, 2006.
[18] G. Craun, D. Swerdlow, R. Tauxe, R. Clark, K. Fox, E. Geldreich, D. Reasoner, and E. Rice. Prevention of waterbone
cholera in the united states. J. American Water Works Association, 83(11):43-48, 1991. R.A. Denininger and P.G. Meier.
Sabotage of public water supply systems. Security of public water supplies, 66, 2000.
[19] K. Diao and W. Rauch. Controllability analysis as a pre-selection method for sensor placement in water distribution
systems. Water Research, 47(16):6097-6108, 2013.
[20] G. Dorini, P. Jonkergouw, Z. Kapelan, F. di Pierro, S.T. Khu, and D. Savic. An efficient algorithm for sensor placement
in water distribution systems. Proc., 8th Annual Water Distribution Systems Analysis Symp., ASCE, Reston, Va., 2006.
[21] EPA (2012). CANARY User’s Manual version 4.3.2. U.S. Environmental Protection Agency, Washington, DC, EPA/600/R-
08/040B, 2012. (accessed 5 June 2015).
[22] F. Eyadat. 3,000 in safed left without water after diesel fuel contaminates supply. Ha’aretz, 2014.
[23] P. Harmant, A. Nace, L. Kiene, and F. Fotoohi. Optimal supervision of drinking water distribution network. Proc., 26th
Annual Water Resources Planning and Management Conf. ASCE, Reston, Va, 1999.
[24] W.E Hart. The teva-spot toolkit for drinking water contaminant warning system design. Proc., World Environmental and
Water Resources Congress. ASCE, Reston, Va, 2008.
[25] W.E. Hart and R. Murray. Review of sensor placement strategies for contamination warning systems in drinking water
distribution systems. J. Water Resour. Plann. Manage., 136(6):611-619, 2010.
[26] D.C. Hickman. A chemical and biological warfare threat; usaf water systems at risk. Counter proliferation paper, 3, 1999.
[27] A. Kessler, A. Ostfeld, and G. Sinai. Detecting accidental contaminations in municipal water networks. J. Water Resour.
Plann. Manage., 124(4):192-198, 1998.
[28] J. Khoury. Safed residents turn on tap, only to find diesel fuel. HACH, 2011.

22
[29] A. Krause et al. Optimizing sensor placements in water distribution systems using sub modular function maximization.
Proc., 8th Annual Water Distribution Systems Analysis Symp., ASCE, Reston, Va., 2006.
[30] A. Krause, J. Leskovec, C. Guestrin, J. VanBriesen, and C. Faloutsos. Efficient sensor placement optimization for securing
large water distribution networks. J. Water Resour. Plann. Manage., 134(6):516-526, 2008.
[31] A. Kumar, M.L. Kansal, and G. Arora. Identification of monitoring stations in water distribution system. J. Environ. Eng.,
123(8):746-752, 1997.
[32] B.H. Lee and R.A. Deininger. Optimal locations of monitoring stations in water distribution systems. J. Environ. Eng.,
118(1):4-16, 1992.
[33] B.H. Lee, R.A. Deininger, and R.M. Clark. Locating monitoring stations in water distribution-systems. J. Am. Water Works
Assoc., 83(7):60-66, 1991.
[34] Oliker N. and Ostfeld A. (2014a). A coupled classification-evolutionary optimization model for contamination event
detection in water distribution systems. Water Research, Vol. 51, No. 15, pp. 234-245.
[35] Oliker N. and Ostfeld A. (2014b). Minimum volume ellipsoid classification model for contamination event detection in
water distribution systems. Journal of Environmental Modelling and Software, Vol. 57, pp. 1-12.
[36] A. Ostfeld and E. Solomons. Optimal layout of early warning detection stations for water distribution systems security. J.
Water Resour. Plann. Manage., 130(5):377-385, 2004.
[37] A. Ostfeld et al. The battle of the water sensor networks (BWSN): A design challenge for engineers and algorithms. J.
Water Resour. Plann. Manage., 134(6):556-568, 2008.
[38] Perelman L., Arad J., Housh M., and Ostfeld A. (2012). Event detection in water distribution systems from multivariate
water quality time series. Environmental science and technology, Vol. 46, No. 15, pp. 8212-8219.
[39] A. Preis and A. Ostfeld. Genetic algorithm for contaminant source characterization using imperfect sensors. Civ. Eng.
Environ. Syst., 25(1):29-39, 2008a.
[40] A. Preis and A. Ostfeld. Multiobjective contaminant sensor network design for water distribution systems. J. Water Resour.
Plann. Manage., 134(4):366-377, 2008b.
[41] M. Propato. Contamination warning in water networks: General mixed-integer linear models for sensor location design. J.
Water Resour. Plann. Manage., 132(4):225-233, 2006.
[42] M. Propato, O. Piller, and J. Uber. A sensor location model to detect contaminations in water distribution networks. Proc.,
World Water and Environmental Resources Congress, ASCE, Reston, Va., 2005.
[43] A.J. Whelton, L. McMillan, M. Connell, K.M. Kelley, J.P. Gill, K.D. White, R. Gupta, R. Dey, and C. Novy. Residential
tap water contamination following the freedom industries chemical spill: Perceptions, water quality, and health impacts. J.
Environmental Science and Technology, 2014.
[44] H.M. Woo, J.H. Yoon, and D.Y. Choi. Optimal monitoring sites based on water quality and quantity in water distribution
systems. World Water and Environmental Resources Congress, CD-ROM, ASCE, Reston, Va., 2001.
[45] X.G. Wu, T.Q. Zhang, and Y.D. Huang. Optimal algorithm for determining locations of water quality sensors in water
supply networks under multi-objective constraints. J. Hydraul. Eng., 39(4):433-439, 2008.