Embed Size (px)
Citation preview

1
Multilevel beamforming for high data rate
communication in 5G networks
Abdoulaye Tall∗, Zwi Altman∗ and Eitan Altman†
∗ Orange Labs 38/40 rue du General Leclerc,92794 Issy-les-Moulineaux
Email: {abdoulaye.tall,zwi.altman}@orange.com†INRIA Sophia Antipolis, 06902 Sophia Antipolis, France,
Email:[email protected]
Abstract
Large antenna arrays can be used to generate highly focused beams that support very high data rates
and reduced energy consumption. However, optimal beam focusing requires large amount of feedback
from the users in order to choose the best beam, especially in Frequency Division Duplex (FDD) mode.
This paper develops a methodology for designing a multilevel codebook of beams in an environment
with low number of multipaths. The antenna design supporting the focused beams is formulated as
an optimization problem. A multilevel codebook of beams is constructed according to the coverage
requirements. An iterative beam scheduling is proposed that searches through the codebook to select
the best beam for a given user. The methodology is applied to a mass event and to a rural scenario, both
analyzed using an event-based network simulator. Very significant gains are obtained for both scenarios.
It is shown that the more dominant the Line of Sight (LoS) component, the higher the gain achieved
by the multilevel beamforming.
Keywords
Beamforming, multilevel codebook, Antenna Array, beam focusing, scheduling, 5G network
I. INTRODUCTION
Different solutions and technologies have been developed for focusing transmitted beams on
users’ receivers, in order to achieve high bit rate communication or tracking capabilities. The
technological challenge is twofold: design antenna systems that support narrow beams for large
coverage area, and allow to locate users with tight delay constraints for either scheduling or
arX
iv:1
504.
0028
0v2
[cs
.IT
] 5
Oct
201
5

2
target tracking. The considerable regain of interest in focusing antennas is related to 5G systems
which are in the process of definition in different research frameworks and fora. It is expected
that 5G spectrum evolutions will benefit from higher frequency bands [1] making it possible to
reduce the size of large antenna arrays.
Different techniques have been developed to focus energy close to the receiver. In an environ-
ment rich of multipaths which is typically encountered in dense urban or indoor environment,
Time Reversal (TR), also known as the Transmit Matched Filter, is receiving increasing interest,
particularly for the internet of things [2]. TR is a pre-filtering technique for Multiple Input
Multiple Output (MIMO) wireless systems [3]. The channel state information at several transmit
antennas is used to precode transmitted symbols with the time reversed version of their respective
channel impulse responses. These ”time reversed” waves propagate in the channel, resulting in
power focusing in space and time at the receiver. TR can be efficiently used for low complexity
receivers such as those expected in future connected objects [4], and even for high mobility
scenarios [5]. The drawback of this technique is that it requires Time Division Duplex (TDD)
and full Channel State Information (CSI) at the transmitter side.
The problem of focusing the beam on moving targets has been addressed for decades in the
context of radar applications, and more specifically, in millimeter wave phase array technology.
Recently, the use of millimeter adaptive antenna array, operating at the 70/80 GHz bands, has
been proposed for serving a high data rate moving user [6]. The antenna array consists of analog
sub-arrays behind a digital beamformer that estimates the Angle of Arrival (AoA) for the moving
user.
Multilevel beamforming has been proposed in [7] for millimeter wave backhaul serving urban
pico-cells. To ensure the link quality, an efficient search algorithm is performed to maintain the
alignment of the transmit and receive beams. The search is performed on a multilevel codebook
thus reducing considerably the number of beam couples to be tested. The channel gain matrix
is not required, making this technology cheaper and suitable for FDD systems.
Recently, the concepts of Virtual Small Cell (VSC) [8] and Virtual Sectorization (ViS) [9]
have been proposed, with the aim of creating a small cell or a sector using an antenna array
located at the base station. To manage interference between the macro cell and ViS, a self-
optimizing frequency splitting algorithm has been proposed that dynamically shares the frequency
bandwidth between the two cells. The main technological challenge for both VSC and ViS is
3
how to optimally focus the beam at the area where traffic is present. This issue is implicitly
solved by the multilevel beamforming proposed in this paper.
The present work adapts the concept of multilevel beamforming to the context of multi-user
communication. In terms of implementation complexity, the proposed approach is particularly
attractive. It can be implemented in a FDD system where the beam selection only depends on
the mobile feedback, namely on the Channel Quality Indicator (CQI). Different scenarios can
be envisaged for the multilevel beamforming, such as cellular coverage (in the sense of service
provisioning) in a low level or multipath propagation environment or the coverage of mass events
and crowded area. Unlike the backhaul problem described above, the multilevel beamforming
in this paper is generated at the transmitter only. Cell coverage should be guaranteed with low
level inter-cell interference. The projection of beams (particularly high gain narrow beams) may
strongly spread out and overshoot neighboring cells. Hence the generation of the set of multi-
level beams (or codebook) should take into account geometrical parameters of the cell (e.g. cell
size, antenna height) and can be performed off-line.
The contributions of the paper can be summarized as follows:
• An antenna optimization framework for generating beams with reduced interference from
side-lobes for large angular domain.
• A beamforming codebook design strategy which avoids overshooting at neighboring cells.
• A beam selection algorithm for efficient search through the multilevel beamforming code-
book.
• Performance analysis of the multilevel beamforming for two Long Term Evolution (LTE)
use cases taking into account different channel and traffic models.
The rest of the paper is organized as follows. Section II presents the antenna array design and
optimization for the multilevel beamforming. Section III describes the multilevel beam construc-
tion and their selection algorithm. The performance of the proposed multilevel beamforming for
different channel models is analyzed in Section IV for a mass event and a rural scenario using
an event-based LTE network simulator. Section V concludes the paper.
II. ANTENNA ARRAY DESIGN
This Section presents the guidelines for the antenna array design supporting multilevel beam-
forming. The antenna array modeling is first introduced and then the design of the beam diagrams
4
is formulated as an optimization problem.
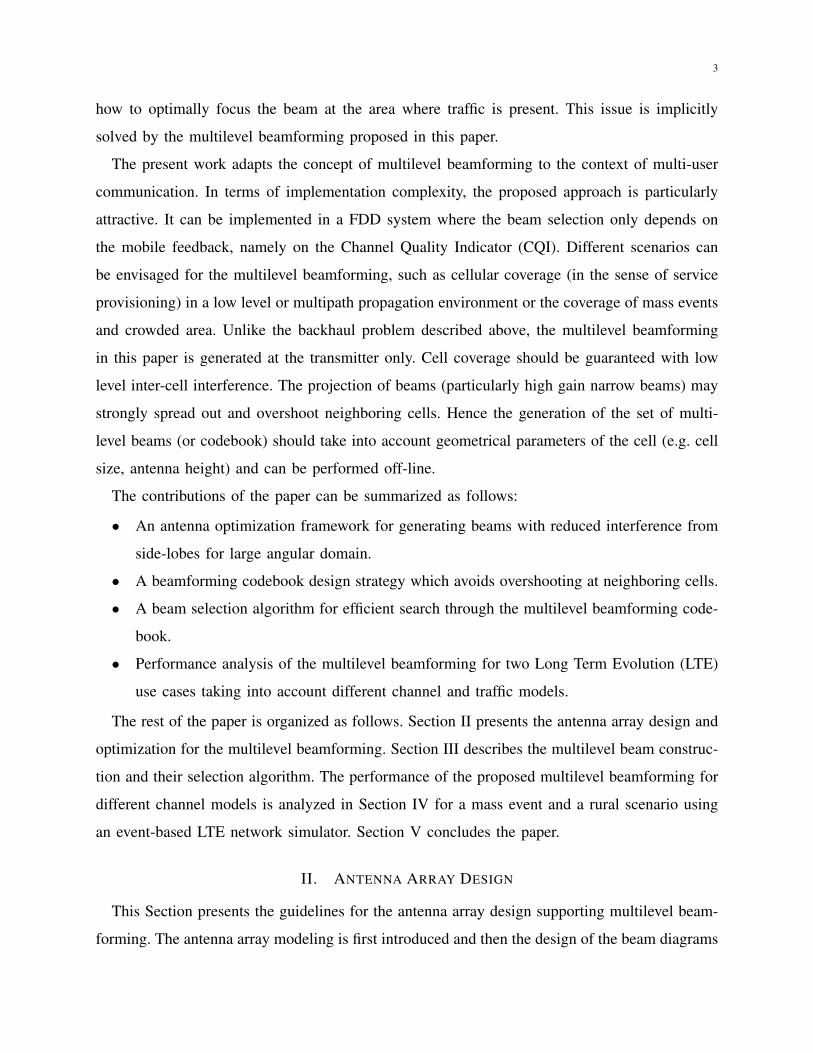
A. Antenna model
Consider a Nx ×Nz (sub) antenna array of vertical dipoles, at a distance of λ4
from a square
metallic conductor, with λ being the wavelength. The full antenna array generates the highest
level (narrowest) beams, whereas lower level beams correspond to smaller (rectangular) sub
arrays size (see Figure 2). If another type of radiating element is chosen, only its radiation
pattern should be modified. To simplify the model, we approximate hereafter the reflector as an
infinite perfect electrical conductor (PEC). The Nx and Nz elements in each row and column
are equally spaced with distances dx and dz, respectively (Figure 1).
Fig. 1. Antenna array with dipole radiating elements.
The direction of a beam is determined by the angle (θe, φe) in the spherical coordinates θ and
φ. The antenna gain for a given beam defined by (θe, φe) in a given direction (θ, φ) is written
as
G(θ, φ, θe, φe) = G0f(θ, φ, θe, φe) (1)
where f is a normalized gain function and G0 the maximum gain in the (θe, φe) direction. A
separable excitation in the x and z directions is assumed, resulting in the following separable
5
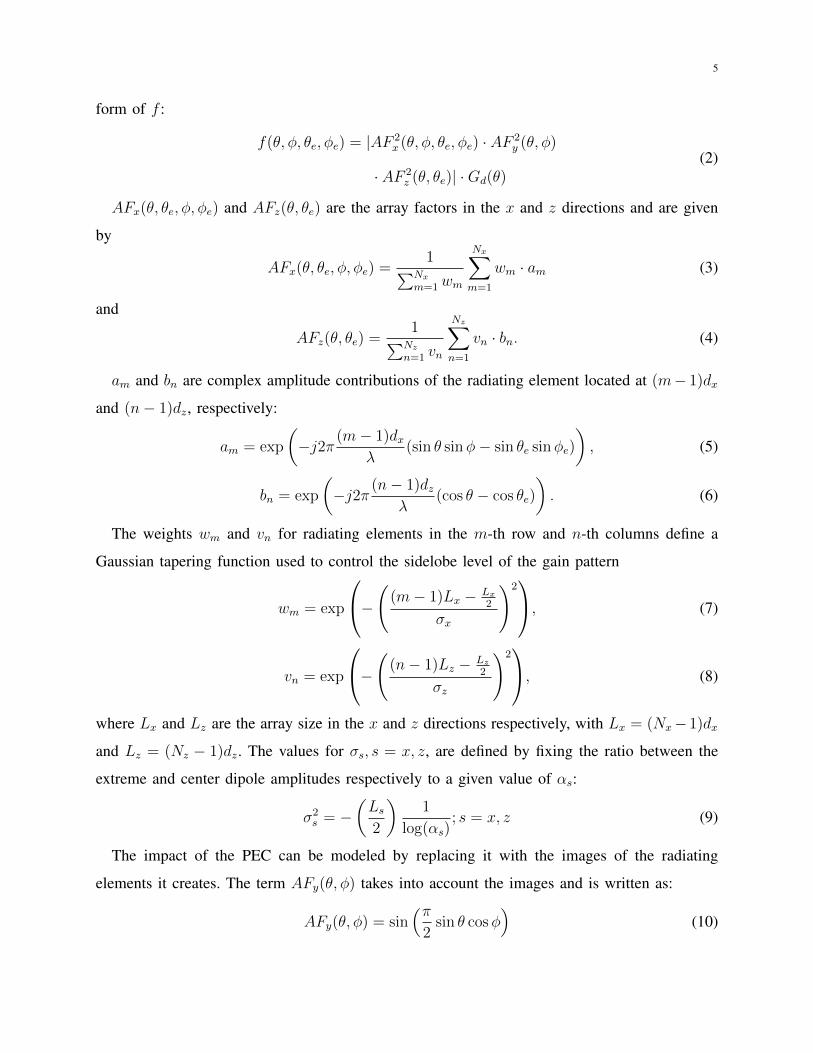
form of f :
f(θ, φ, θe, φe) = |AF 2x (θ, φ, θe, φe) · AF 2
y (θ, φ)
· AF 2z (θ, θe)| ·Gd(θ)
(2)
AFx(θ, θe, φ, φe) and AFz(θ, θe) are the array factors in the x and z directions and are given
by
AFx(θ, θe, φ, φe) =1∑Nx
m=1wm
Nx∑m=1
wm · am (3)
and
AFz(θ, θe) =1∑Nz
n=1 vn
Nz∑n=1
vn · bn. (4)
am and bn are complex amplitude contributions of the radiating element located at (m− 1)dx
and (n− 1)dz, respectively:
am = exp
(−j2π (m− 1)dx
λ(sin θ sinφ− sin θe sinφe)
), (5)
bn = exp
(−j2π (n− 1)dz
λ(cos θ − cos θe)
). (6)
The weights wm and vn for radiating elements in the m-th row and n-th columns define a
Gaussian tapering function used to control the sidelobe level of the gain pattern
wm = exp
−((m− 1)Lx − Lx2
σx
)2, (7)
vn = exp
−((n− 1)Lz − Lz2
σz
)2, (8)
where Lx and Lz are the array size in the x and z directions respectively, with Lx = (Nx−1)dx
and Lz = (Nz − 1)dz. The values for σs, s = x, z, are defined by fixing the ratio between the
extreme and center dipole amplitudes respectively to a given value of αs:
σ2s = −
(Ls2
)1
log(αs); s = x, z (9)
The impact of the PEC can be modeled by replacing it with the images of the radiating
elements it creates. The term AFy(θ, φ) takes into account the images and is written as:
AFy(θ, φ) = sin(π2sin θ cosφ
)(10)
6
The normalized gain pattern of the dipoles, Gd(θ), is approximated as
Gd(θ) = sin3 θ. (11)
The term G0 is obtained from the power conservation equation:
G0 =4π∫ π
2
−π2
∫ π0f(θ, φ) sin θ dθdφ
. (12)
A beam is defined by the (rectangular) sub-array size, and the couple (θe, φe) defines its
direction. The generation of the beams is discussed in Section III. The antenna modeling for all
the beams remains unchanged.
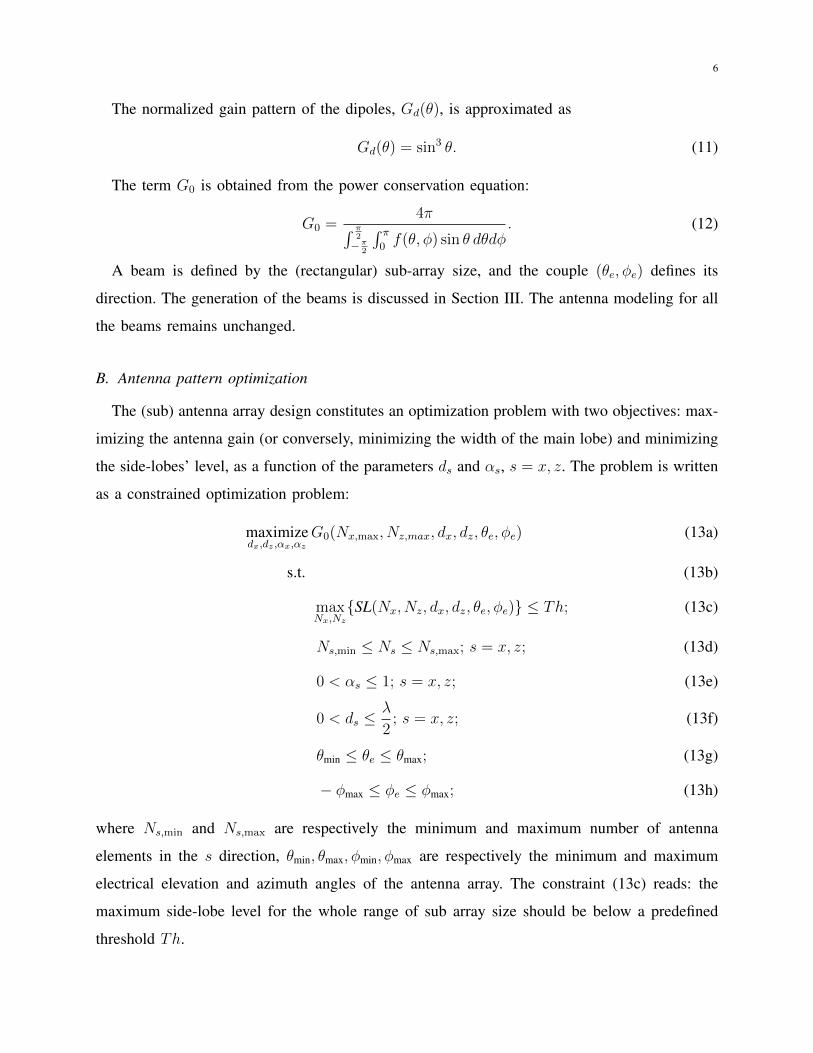
B. Antenna pattern optimization
The (sub) antenna array design constitutes an optimization problem with two objectives: max-
imizing the antenna gain (or conversely, minimizing the width of the main lobe) and minimizing
the side-lobes’ level, as a function of the parameters ds and αs, s = x, z. The problem is written
as a constrained optimization problem:
maximizedx,dz ,αx,αz
G0(Nx,max, Nz,max, dx, dz, θe, φe) (13a)
s.t. (13b)
maxNx,Nz
{SL(Nx, Nz, dx, dz, θe, φe)} ≤ Th; (13c)
Ns,min ≤ Ns ≤ Ns,max; s = x, z; (13d)
0 < αs ≤ 1; s = x, z; (13e)
0 < ds ≤λ
2; s = x, z; (13f)
θmin ≤ θe ≤ θmax; (13g)
− φmax ≤ φe ≤ φmax; (13h)
where Ns,min and Ns,max are respectively the minimum and maximum number of antenna
elements in the s direction, θmin, θmax, φmin, φmax are respectively the minimum and maximum
electrical elevation and azimuth angles of the antenna array. The constraint (13c) reads: the
maximum side-lobe level for the whole range of sub array size should be below a predefined
threshold Th.

7
It is noted that for small elevation electrical tilt values, the projection of the beams on the plane
is likely to spread out. Special care should be taken when setting the θmin, φmin, φmax angles in
order to avoid overshooting on neighboring cells. These angles will depend on the geometrical
characteristics of the cell (original coverage area of the considered Base Station (BS) before
deploying the antenna array), such as the cell shape, size, and antenna height. One can consider
optimizing the antenna for a wide range of elevation and azimuth angles, and then, according
to the cell geometry, construct a codebook of beams for a desired angular range. Furthermore,
a database with a set of codebooks can be pre-optimized for a set of cell geometries and then,
according to the specific cell deployment, the most suitable codebook can be selected.
III. MULTILEVEL BEAMFORMING
A. Beams structure
Consider a multilevel codebook as shown in Figure 2, with L levels and Jl beams at the level
l, l = 0, ..., L. The jth beam at level l is written as Bl,j(θ, θl,j, φ, φl,j), j = 1, ..., Jl, and for
brevity of notation - as Bl(j). It is noted that the angles (θl,j, φl,j) correspond to (θe, φe) defined
in section II.
Fig. 2. Example of beam hierarchy
The beam of the first level, namely level 0 in Figure 2, B0(1), covers the entire cell. Beams
at level l are generated by the same sub-array, i.e. with the same number of array elements,

8
and differ from each other by the angles (θl,j, φl,j). Denote by C a coverage operator which
receives as argument a beam, and outputs its coverage area (often denoted as the best server
area), where the beam provides the strongest signal with respect to other cell or beam coverage.
By construction we assume that for a given level l, the beams’ coverage do not overlap:
C(Bl(i)) ∧ C(Bl(j)) = ∅ ,∀i 6= j. (14)
The multilevel structure of the beams in the codebook means that a given beam Bl(j) at level
l where l < L has two children beams Bl+1(2j − 1) and Bl+1(2j) with
C(Bl+1(2j − 1)) ∪ C(Bl+1(2j)) ⊂ C(Bl(j)) (15)
The beams at level L are the narrowest that can be obtained given the Nx,max×Nz,max antenna
array.
B. Beam selection algorithm
The beam selection algorithm consists in finding the best beam available by navigating through
the multilevel codebook. It starts with B0(1) which covers the entire cell and keeps track of the
overall best beam up till now (B∗). Assuming the beam selection algorithm is at level l with
l < L, the best beam is updated as follows
B∗ = argmaxB∈{B∗,Bl+1(j),j=(2jl+1−1,2jl+1)}
S(B, u) (16)
where S(B, u) is the Signal to Interference plus Noise Ratio (SINR) of user u served by the
beam B, and jl denotes index of the beam at level l.
The algorithm stops when the best beam does not change in a given iteration, i.e. the parent
beam provides better SINR than the children beams, or the highest level of beams L is reached.
The complexity of such an algorithm is of the order of log(N), N being the total number of
beams, hence convergence is obtained in a very small number of iterations.
It is noted that condition (15) can be relaxed so that narrower beams can cover regions not
covered by their parent beams. In this case the beam selection algorithm should continue until
level L. The multilevel beam structure presented in this section is just one illustration of how a
multilevel codebook structure can be designed. Other approaches can be adopted regarding the
relation between parent and children beams in terms of coverage. The only requirement is to be
able to easily navigate through the codebook in an iterative manner.
9
The beam selection algorithm runs in parallel with the scheduling algorithm. A user is first
scheduled based on its SINR obtained with the level 0 beam. During the scheduling period, the
user’s best beam is updated based on the received feedback using equation (16). If the scheduling
period is long enough, the beam selection algorithm can converge. Otherwise the beam selection
resumes at the next scheduling period based on the SINR of the best beam tested so far. It is
noted that other scheduling strategies can be considered.
C. Implementation issues
The beam codebook can be precalculated for a given cell and stored in a database of a self-
configuration server at the management plane. Upon deployment of the multilevel beamforming
feature, the multilevel codebook is downloaded from the server to the BS. As mentioned previ-
ously, the codebook selection can be based on geometrical characteristics of the cell.
The antenna array can be dynamically configured using different approaches. The classical
approach would be to feed each antenna element by a distinct amplifier which receives the
appropriate input signal necessary to excite the selected beam from the codebook. More recently,
the load modulated massive MIMO approach has been reported [10] in which the base band input
signal is used to adapt a load behind each antenna element which controls its complex input
impedance. This approach which utilizes a single amplifier aims at further reducing the antenna
size and cost, and could be a candidate technology for the multilayer beamforming (further
studies are still necessary).
The size of the antenna array depends on the number of antenna elements and the spacing
between them. In Section IV-A, we use Nx,max = 12 and Nz,max = 32 antenna elements with
spacings of dx = 0.5λ and dz = 0.7λ. For the LTE technology with a 2.6 GHz carrier, the
antenna size is of 0.69 m × 2.58 m. Multilevel beamforming will be particularly attractive
in 5G technology where higher frequency bands will be available, allowing moderate size of
antenna array with a large number of radiating elements.
IV. NUMERICAL RESULTS
We present in this section numerical results for the multilevel beamforming. Two scenarios
are considered: a mass event type of scenario in an urban environment with a crowded open
area, e.g. an esplanade, and a rural environment in which the users have a LoS path component
10
from the BS. The multilevel beamforming is applied to one cell which is interfered by two rings
of neighboring BSs.
A LTE event-based simulator coded in Matlab is used. Users (data sessions) arrive according
to a Poisson process, download a file of exponential size with mean of 4 Mbits, and leave the
network as soon as their download is complete. We focus on the case where there is no mobility.
The channel coherence time of several milliseconds is assumed (which is typically the case for
low mobility), and so the beam selection algorithm converges within this coherence time. Hence
beam selection errors due to fast-fading are not considered.
The main simulation parameters used for the two scenarios are summarized in Table I.
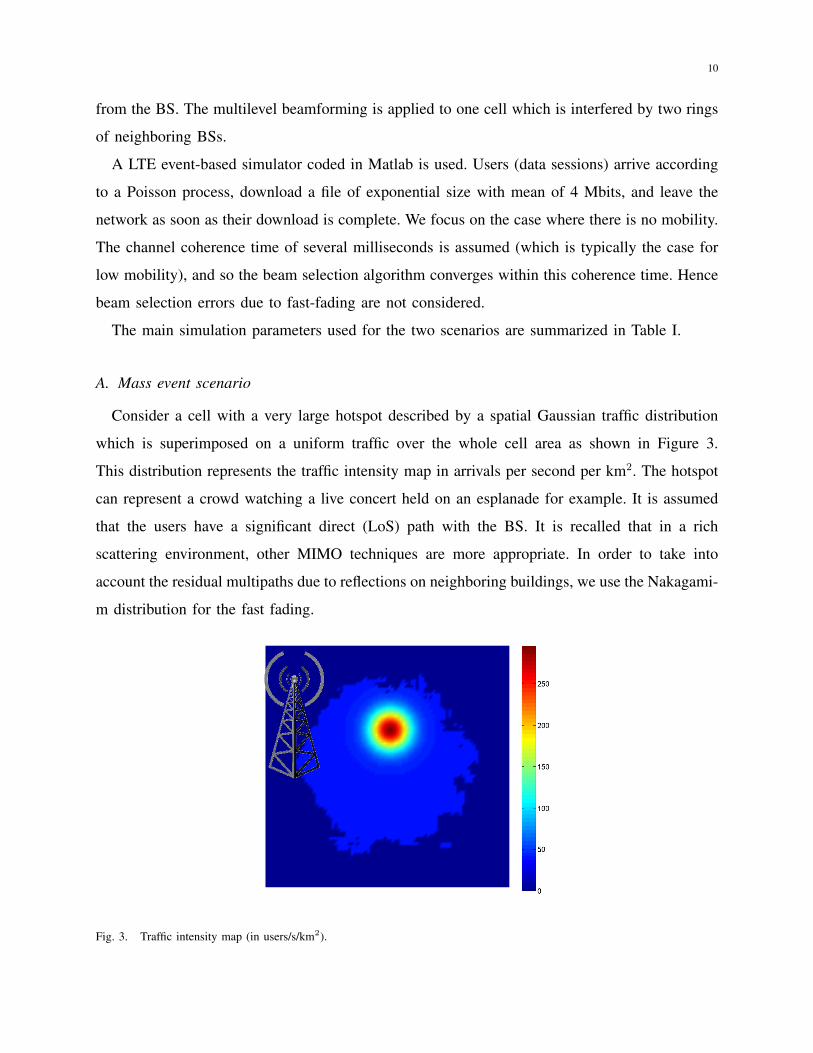
A. Mass event scenario
Consider a cell with a very large hotspot described by a spatial Gaussian traffic distribution
which is superimposed on a uniform traffic over the whole cell area as shown in Figure 3.
This distribution represents the traffic intensity map in arrivals per second per km2. The hotspot
can represent a crowd watching a live concert held on an esplanade for example. It is assumed
that the users have a significant direct (LoS) path with the BS. It is recalled that in a rich
scattering environment, other MIMO techniques are more appropriate. In order to take into
account the residual multipaths due to reflections on neighboring buildings, we use the Nakagami-
m distribution for the fast fading.
Fig. 3. Traffic intensity map (in users/s/km2).

11
TABLE I. NETWORK AND TRAFFIC CHARACTERISTICS
Network parameters
Number of sectors with
multilevel beamforming1
Number of interfering
macros2 rings, 20 sectors
Macro Cell layout hexagonal trisector
Antenna height 30 m
Bandwidth 10MHz
Scheduling Type Proportional Fair
Channel characteristics
Thermal noise -174 dBm/Hz
Path loss (d in km)128.1 + 37.6
log10(d) dB
Shadowing Log-normal (6dB)
Traffic characteristics
Service type FTP
Average file size 4 Mbits
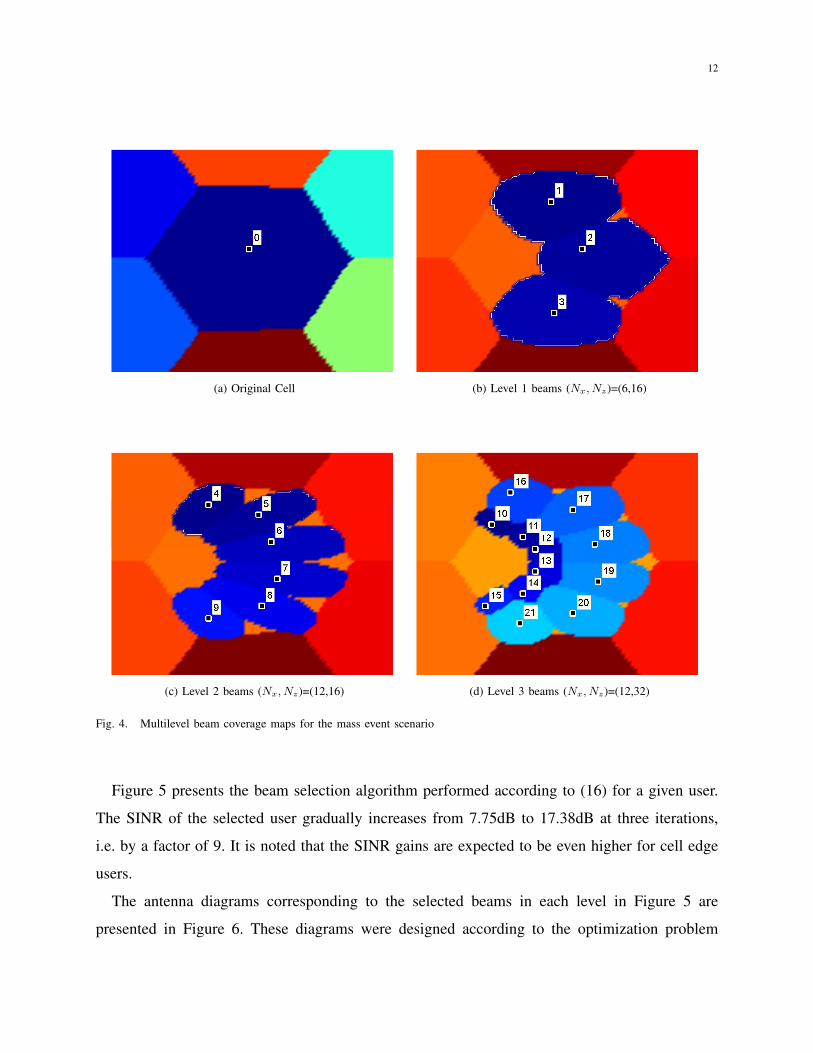
1) Illustration of the multilevel beamforming: Figures 4, 5 and 6 represent the coverage maps
of the beams in each level, the best beam chosen at each level for a user located at the center of
the hotspot area (yellow square in Figure 5) and the corresponding antenna diagrams, respectively,
as described below.
The multilevel beam structure presented in Section III is illustrated in Figure 4. Here, the
condition (14) is met by definition of the coverage areas. However, condition (15) is relaxed in
order to allow narrower beams (level 3 in Figure 4d) to cover blank spaces left by wider beams
(level 2 in Figure 4c).
12
(a) Original Cell (b) Level 1 beams (Nx, Nz)=(6,16)
(c) Level 2 beams (Nx, Nz)=(12,16) (d) Level 3 beams (Nx, Nz)=(12,32)
Fig. 4. Multilevel beam coverage maps for the mass event scenario
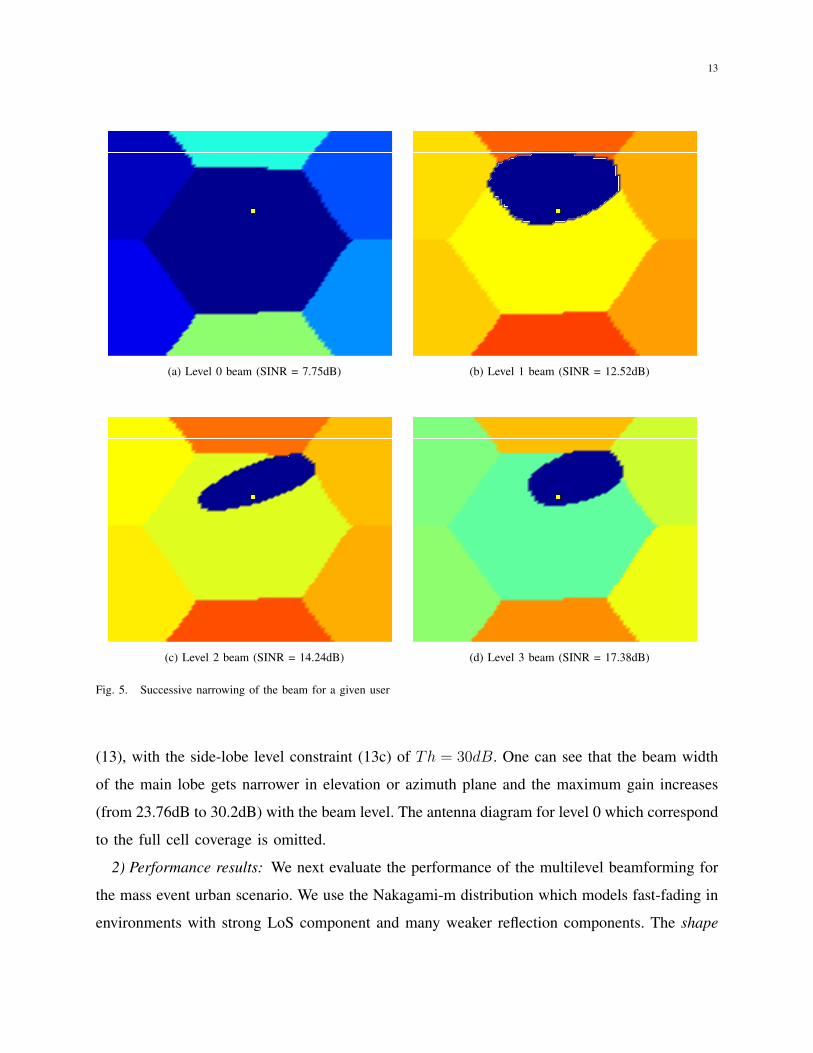
Figure 5 presents the beam selection algorithm performed according to (16) for a given user.
The SINR of the selected user gradually increases from 7.75dB to 17.38dB at three iterations,
i.e. by a factor of 9. It is noted that the SINR gains are expected to be even higher for cell edge
users.
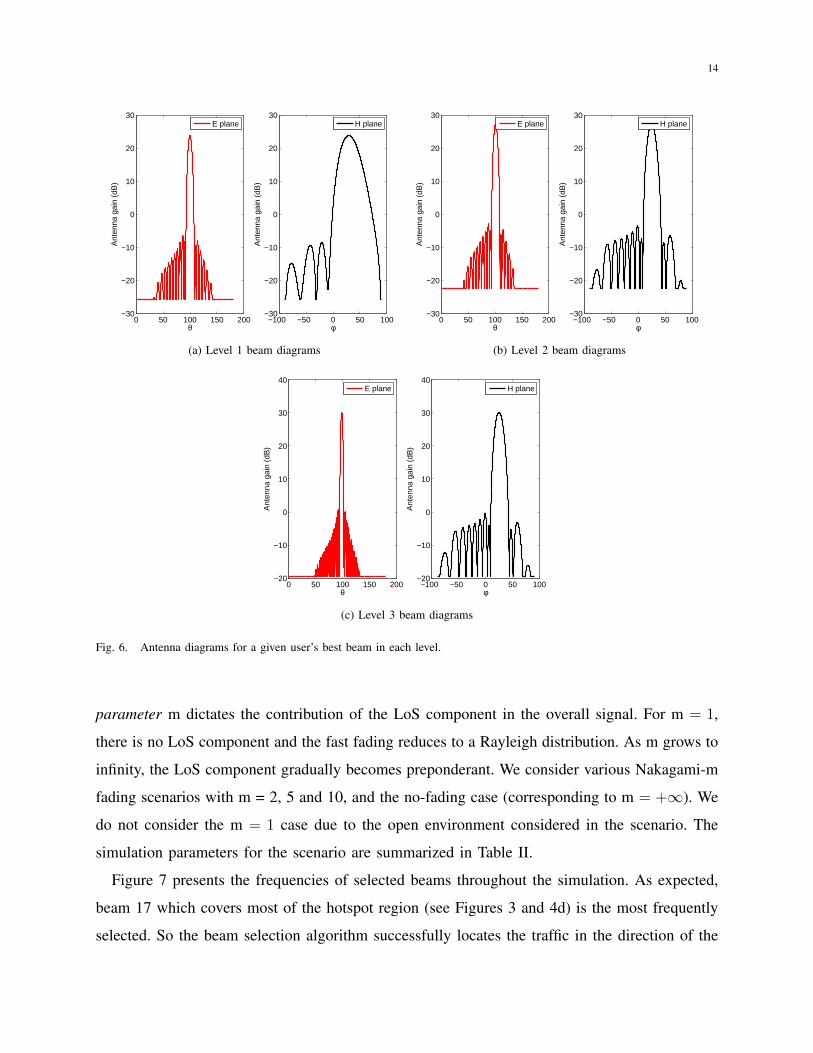
The antenna diagrams corresponding to the selected beams in each level in Figure 5 are
presented in Figure 6. These diagrams were designed according to the optimization problem
13
(a) Level 0 beam (SINR = 7.75dB) (b) Level 1 beam (SINR = 12.52dB)
(c) Level 2 beam (SINR = 14.24dB) (d) Level 3 beam (SINR = 17.38dB)
Fig. 5. Successive narrowing of the beam for a given user
(13), with the side-lobe level constraint (13c) of Th = 30dB. One can see that the beam width
of the main lobe gets narrower in elevation or azimuth plane and the maximum gain increases
(from 23.76dB to 30.2dB) with the beam level. The antenna diagram for level 0 which correspond
to the full cell coverage is omitted.
2) Performance results: We next evaluate the performance of the multilevel beamforming for
the mass event urban scenario. We use the Nakagami-m distribution which models fast-fading in
environments with strong LoS component and many weaker reflection components. The shape
14
0 50 100 150 200−30
−20
−10
0
10
20
30
θ
Ant
enna
gai
n (d
B)
E plane
−100 −50 0 50 100−30
−20
−10
0
10
20
30
φ
Ant
enna
gai
n (d
B)
H plane
(a) Level 1 beam diagrams
0 50 100 150 200−30
−20
−10
0
10
20
30
θ
Ant
enna
gai
n (d
B)
E plane
−100 −50 0 50 100−30
−20
−10
0
10
20
30
φ
Ant
enna
gai
n (d
B)
H plane
(b) Level 2 beam diagrams
0 50 100 150 200−20
−10
0
10
20
30
40
θ
Ant
enna
gai
n (d
B)
E plane
−100 −50 0 50 100−20
−10
0
10
20
30
40
φ
Ant
enna
gai
n (d
B)
H plane
(c) Level 3 beam diagrams
Fig. 6. Antenna diagrams for a given user’s best beam in each level.
parameter m dictates the contribution of the LoS component in the overall signal. For m = 1,
there is no LoS component and the fast fading reduces to a Rayleigh distribution. As m grows to
infinity, the LoS component gradually becomes preponderant. We consider various Nakagami-m
fading scenarios with m = 2, 5 and 10, and the no-fading case (corresponding to m = +∞). We
do not consider the m = 1 case due to the open environment considered in the scenario. The
simulation parameters for the scenario are summarized in Table II.
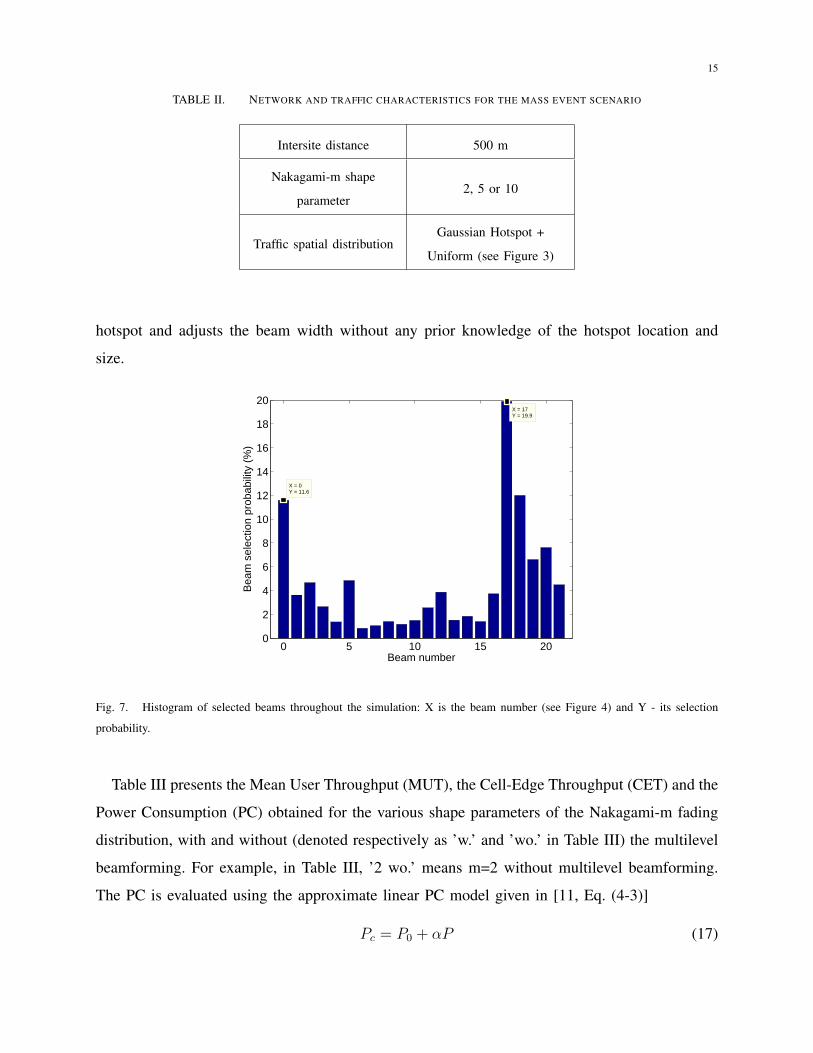
Figure 7 presents the frequencies of selected beams throughout the simulation. As expected,
beam 17 which covers most of the hotspot region (see Figures 3 and 4d) is the most frequently
selected. So the beam selection algorithm successfully locates the traffic in the direction of the
15
TABLE II. NETWORK AND TRAFFIC CHARACTERISTICS FOR THE MASS EVENT SCENARIO
Intersite distance 500 m
Nakagami-m shape
parameter2, 5 or 10
Traffic spatial distributionGaussian Hotspot +
Uniform (see Figure 3)
hotspot and adjusts the beam width without any prior knowledge of the hotspot location and
size.
0 5 10 15 200
2
4
6
8
10
12
14
16
18
20
X = 0Y = 11.6
Beam number
Bea
m s
elec
tion
prob
abili
ty (
%)
X = 17Y = 19.9
Fig. 7. Histogram of selected beams throughout the simulation: X is the beam number (see Figure 4) and Y - its selection
probability.
Table III presents the Mean User Throughput (MUT), the Cell-Edge Throughput (CET) and the
Power Consumption (PC) obtained for the various shape parameters of the Nakagami-m fading
distribution, with and without (denoted respectively as ’w.’ and ’wo.’ in Table III) the multilevel
beamforming. For example, in Table III, ’2 wo.’ means m=2 without multilevel beamforming.
The PC is evaluated using the approximate linear PC model given in [11, Eq. (4-3)]
Pc = P0 + αP (17)

16
TABLE III. PERFORMANCE GAIN USING MULTILEVEL BEAMFORMING FOR THE MASS EVENT SCENARIO
m MUT (Mbps) CET (Mbps) PC (W)
2 wo. 7.64 1.78 397
2 w. 21.49 (181%) 5.52 (210%) 334 (-15.92%)
5 wo. 7.21 1.35 400
5 w. 22.33 (210%) 5.59 (312%) 331 (-17.24%)
10 wo. 6.97 1.18 402
10 w. 22.43 (222%) 5.31 (349%) 331 (-17.51%)
+∞ wo. 4.99 0.51 417
+∞ w. 21.85 (337%) 4.75 (822%) 334 (-19.98%)
where P0 = 260W is the PC for zero-load, α = 2× 4.7 is the scaling factor term for an antenna
with two-transmission chains and P is the total transmit power when serving a user with the
entire bandwidth.
The performance results show particularly high gain brought about by multilevel beamforming.
The MUT is improved by a factor varying from 2.81 to 4.38, the CET - from 3.1 to 9.22, and the
PC is reduced by 15.9 to 20 percent for m varying from 2 to +∞ respectively. The difference
in performance gain between MUT and CET is due to the fact that cell edge users have initially
low SINR and their SINR gain with beam focusing is larger. The PC is reduced due to the
significant reduction in the sojourn time of the users so the BS transmits less often.
The performance gains increase with the value of m, namely with the importance of the LoS
component relative to the multipaths’ components. It is recalled that in an environment rich of
scatterers, the initial level of beams (i.e. level 0 in Figure 2) will benefit from higher diversity
gain by using an opportunistic scheduler (e.g. Proportional Fair (PF)) and therefore the gain
obtained by the multilevel beamforming is smaller. This observation further supports the claim
that the the multilayer beamforming is of particular interest for open type of environment having
a significant LoS propagation.
17
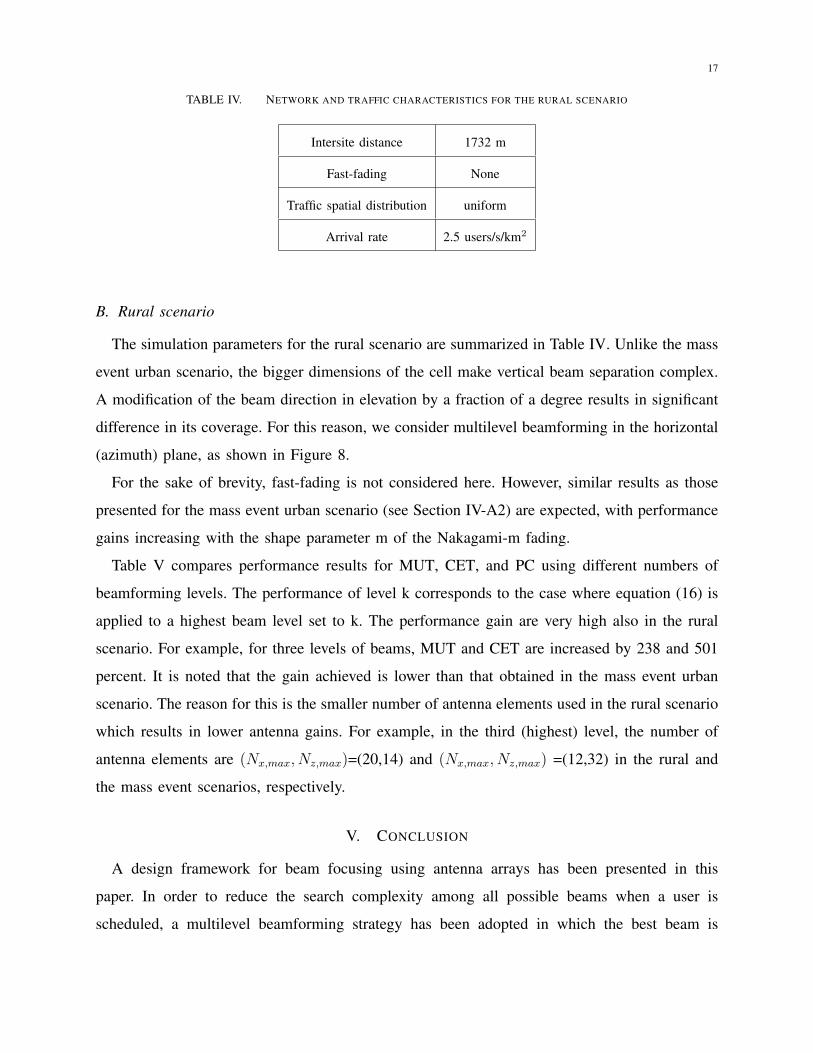
TABLE IV. NETWORK AND TRAFFIC CHARACTERISTICS FOR THE RURAL SCENARIO
Intersite distance 1732 m
Fast-fading None
Traffic spatial distribution uniform
Arrival rate 2.5 users/s/km2
B. Rural scenario
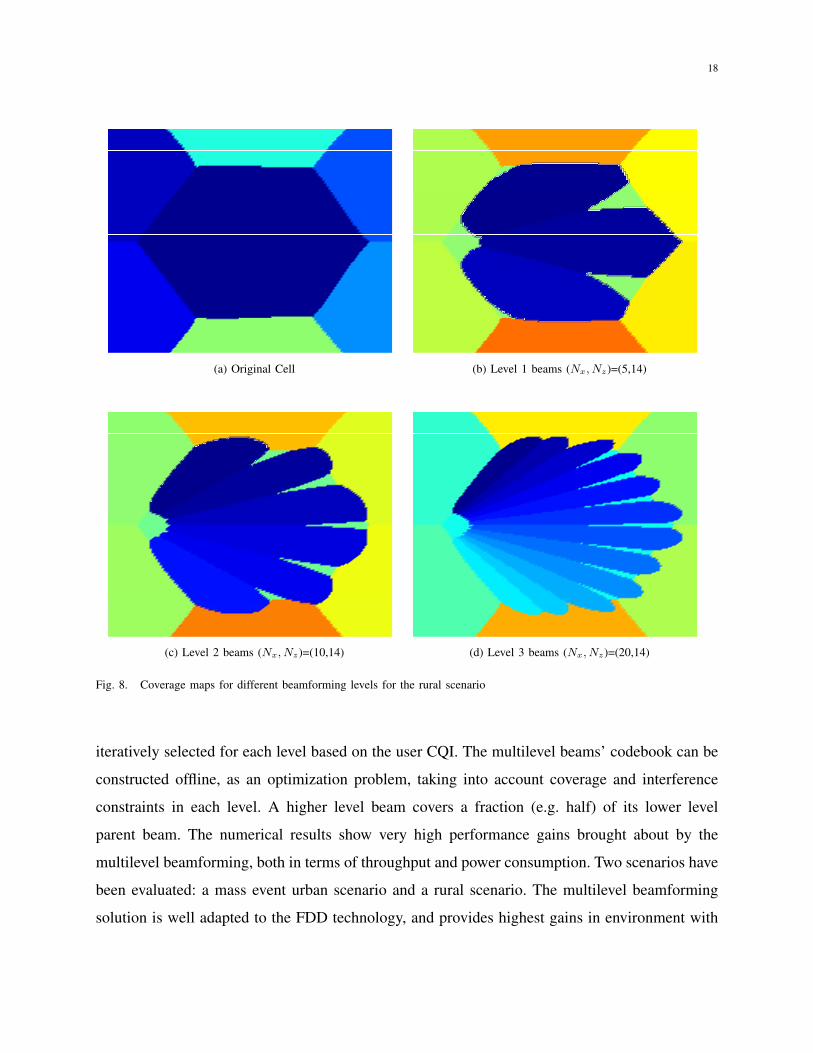
The simulation parameters for the rural scenario are summarized in Table IV. Unlike the mass
event urban scenario, the bigger dimensions of the cell make vertical beam separation complex.
A modification of the beam direction in elevation by a fraction of a degree results in significant
difference in its coverage. For this reason, we consider multilevel beamforming in the horizontal
(azimuth) plane, as shown in Figure 8.
For the sake of brevity, fast-fading is not considered here. However, similar results as those
presented for the mass event urban scenario (see Section IV-A2) are expected, with performance
gains increasing with the shape parameter m of the Nakagami-m fading.
Table V compares performance results for MUT, CET, and PC using different numbers of
beamforming levels. The performance of level k corresponds to the case where equation (16) is
applied to a highest beam level set to k. The performance gain are very high also in the rural
scenario. For example, for three levels of beams, MUT and CET are increased by 238 and 501
percent. It is noted that the gain achieved is lower than that obtained in the mass event urban
scenario. The reason for this is the smaller number of antenna elements used in the rural scenario
which results in lower antenna gains. For example, in the third (highest) level, the number of
antenna elements are (Nx,max, Nz,max)=(20,14) and (Nx,max, Nz,max) =(12,32) in the rural and
the mass event scenarios, respectively.
V. CONCLUSION
A design framework for beam focusing using antenna arrays has been presented in this
paper. In order to reduce the search complexity among all possible beams when a user is
scheduled, a multilevel beamforming strategy has been adopted in which the best beam is
18
(a) Original Cell (b) Level 1 beams (Nx, Nz)=(5,14)
(c) Level 2 beams (Nx, Nz)=(10,14) (d) Level 3 beams (Nx, Nz)=(20,14)
Fig. 8. Coverage maps for different beamforming levels for the rural scenario
iteratively selected for each level based on the user CQI. The multilevel beams’ codebook can be
constructed offline, as an optimization problem, taking into account coverage and interference
constraints in each level. A higher level beam covers a fraction (e.g. half) of its lower level
parent beam. The numerical results show very high performance gains brought about by the
multilevel beamforming, both in terms of throughput and power consumption. Two scenarios have
been evaluated: a mass event urban scenario and a rural scenario. The multilevel beamforming
solution is well adapted to the FDD technology, and provides highest gains in environment with

19
TABLE V. PERFORMANCE GAIN USING MULTILEVEL BEAMFORMING FOR THE RURAL SCENARIO FOR DIFFERENT BEAM
LEVELS
MUT (Mbps) CET (Mbps) PC (W)
Level 0 4.66 0.43 421
Level 1 9.9 (112%) 1.15 (168%) 388 (-7.93%)
Level 2 13.23 (184%) 1.96 (360%) 369 (-12.3%)
Level 3 15.78 (238%) 2.57 (501%) 356 (-15.42%)
significant LoS component and low level of multipath propagation. To achieve highly focused
beams, antenna arrays with a large number of radiating elements is required. Hence higher
frequency envisaged in 5G spectrum evolution will make this technology particularly attractive.
REFERENCES
[1] A. Osseiran, F. Boccardi, V. Braun, K. Kusume, P. Marsch, M. Maternia, O. Queseth, M. Schellmann, H. Schotten,
H. Taoka et al., “Scenarios for 5G mobile and wireless communications: the vision of the METIS project,” Communications
Magazine, IEEE, vol. 52, no. 5, pp. 26–35, 2014.
[2] Y. Chen, F. Han, Y.-H. Yang, H. Ma, Y. Han, C. Jiang, H.-Q. Lai, D. Claffey, Z. Safar, and K. Liu, “Time-Reversal
Wireless Paradigm for Green Internet of Things: An Overview,” Internet of Things Journal, IEEE, vol. 1, pp. 81–98, Feb
2014.
[3] C. Oestges, J. Hansen, S. M. Emami, A. D. Kim, G. Papanicolaou, and A. J. Paulraj, “Time reversal techniques
for broadband wireless communication systems,” in European Microwave Conference (Workshop), Amsterdam, The
Netherlands, 2004, pp. 49–66.
[4] D.-T. Phan-Huy, S. Ben Halima, and M. Helard, “Dumb-to-perfect receiver throughput ratio maps of a time reversal
wireless indoor system,” in Telecommunications (ICT), 2013 20th International Conference on. IEEE, 2013, pp. 1–5.
[5] D.-T. Phan-Huy, M. Sternad, and T. Svensson, “Adaptive large MISO downlink with Predictor Antenna array for very
fast moving vehicles,” in Connected Vehicles and Expo (ICCVE), 2013 International Conference on. IEEE, 2013, pp.
331–336.
[6] X. Huang, Y. J. Guo, and J. D. Bunton, “A hybrid adaptive antenna array,” Wireless Communications, IEEE Transactions
on, vol. 9, no. 5, pp. 1770–1779, 2010.
[7] S. Hur, T. Kim, D. J. Love, J. V. Krogmeier, T. A. Thomas, and A. Ghosh, “Multilevel millimeter wave beamforming for
wireless backhaul,” in GLOBECOM Workshops (GC Wkshps), 2011 IEEE. IEEE, 2011, pp. 253–257.
[8] A. Galindo-Serrano, S. Martinez Lopez, and A. Gati, “Virtual small cells using large antenna arrays as an alternative to
classical HetNets,” in First International Workshop on Intelligent Design and Performance Evaluation of LTE-Advanced
Networks, Glasgow, Scotland, May 2015.

20
[9] A. Tall, Z. Altman, and E. Altman, “Virtual sectorization: design and self-optimization,” in 5th International Workshop
on Self-Organizing Networks (IWSON 2015), Glasgow, Scotland, May 2015.
[10] R. R. Muller, M. A. Sedaghat, and G. Fischer, “Load modulated massive MIMO,” in IEEE GlobalSIP, Atlanta, Dec. 2015.
[11] M. Imran, E. Katranaras, G. Auer, O. Blume, V. Giannini, I. Godor, Y. Jading, M. Olsson, D. Sabella, P. Skillermark, and
others, “Energy efficiency analysis of the reference systems, areas of improvements and target breakdown,” Tech. Rep.
ICT-EARTH deliverable, Tech. Rep., 2011.


![[R. J. Zwi Werblowsky, Geoffrey Wigoder] the Oxfor(Bookos.org)](https://img.pdfslide.us/doc/110x75/55cf9b38550346d033a52ddd/r-j-zwi-werblowsky-geoffrey-wigoder-the-oxforbookosorg.jpg)