Embed Size (px)
Citation preview
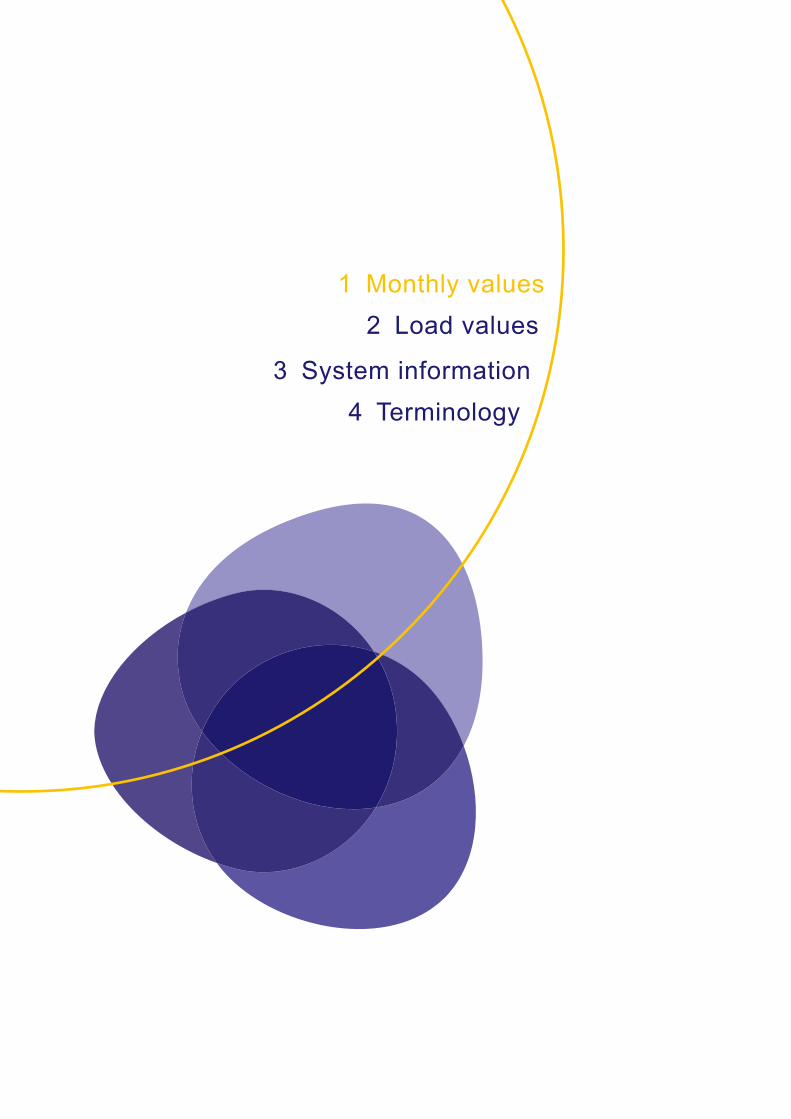
1 Monthly values 2 Load values
3 System information 4 Terminology

9 Statistical Yearbook (UCTE) 2008
Monthly values IOPERATION AND PHYSICAL EXCHANGE BALANCE PER COUNTRY FOR THE YEARS 1998, 2007, 2008
Page
Overview UCTE in figures 2008 ...............................................................................................................................................................12Austria ( AT ) ..................................................................................................................................................................................................14Bosnia-Herzegovina ( BA ) .........................................................................................................................................................................17Belgium ( BE ) ..............................................................................................................................................................................................20Bulgaria ( BG ) ..............................................................................................................................................................................................23Switzerland ( CH ) ........................................................................................................................................................................................26Czech Republic ( CZ ) .................................................................................................................................................................................29Germany ( DE ) .............................................................................................................................................................................................32Denmark West 1 ( DK_W ) .........................................................................................................................................................................35Spain ( ES ) ...................................................................................................................................................................................................38France ( FR ) .................................................................................................................................................................................................41Greece ( GR ) ................................................................................................................................................................................................44Croatia ( HR ) ................................................................................................................................................................................................47Hungary ( HU ) ..............................................................................................................................................................................................50Italy ( IT ) .........................................................................................................................................................................................................53Luxembourg ( LU ) ......................................................................................................................................................................................56Montenegro ( ME ) .......................................................................................................................................................................................59FYROM 2 ( MK ) .............................................................................................................................................................................................62The Netherlands ( NL ) ...............................................................................................................................................................................65Poland 3 ( PL ) ..............................................................................................................................................................................................68Portugal ( PT ) ...............................................................................................................................................................................................71Romania ( RO ) ............................................................................................................................................................................................74Serbia ( RS ) .................................................................................................................................................................................................77Slovenia ( SI ) ................................................................................................................................................................................................80Slovak Republic ( SK ) ................................................................................................................................................................................83UCTE 4 ............................................................................................................................................................................................................86Ukraine West 5 ( UA_W) .............................................................................................................................................................................90
Third countries 1998 2007 2008Bulgaria ( BG ) BGCzech Republic ( CZ ) CZHungary ( HU ) HUPoland ( PL ) PLRomania ( RO ) ROSlovak Republic ( SK ) SKDenmark West ( DK_W ) DK_WUkraine West ( UA_W ) UA_W UA_WAlbania ( AL ) AL AL ALBelarus ( BY ) BY BYDenmark ( DK ) DKDenmark East ( DK_E ) DK_E DK_EGreat Britain ( GB ) GB GB GBMorocco ( MA ) MA MA MARepublic of Moldavia ( MD ) MD MDNorway ( NO ) NO NOSweden ( SE ) SE SE SERepublic of Turkey ( TR ) TR TRUkraine ( UA ) UA UA
Remark: When summing up the values, rounding deviations may occur._______________________________________________________
1 Denmark West represents the Western part of Denmark synchronously interconnected with UCTE (Jutland and Funen); from June 2007 full member of the UCTE association2 FYROM = Former Yugoslav Republic of Macedonia3 Generation and load values are operational data4 The country code UCTE represents the ENTSO-E Regional Group Continental Europe (former all countries of the Union for the Co-ordination of Transmission of Electricity)5 Ukraine West represents the so-called Burshtyn Island synchronously interconnected with UCTE

11 Statistical Yearbook (UCTE) 2008
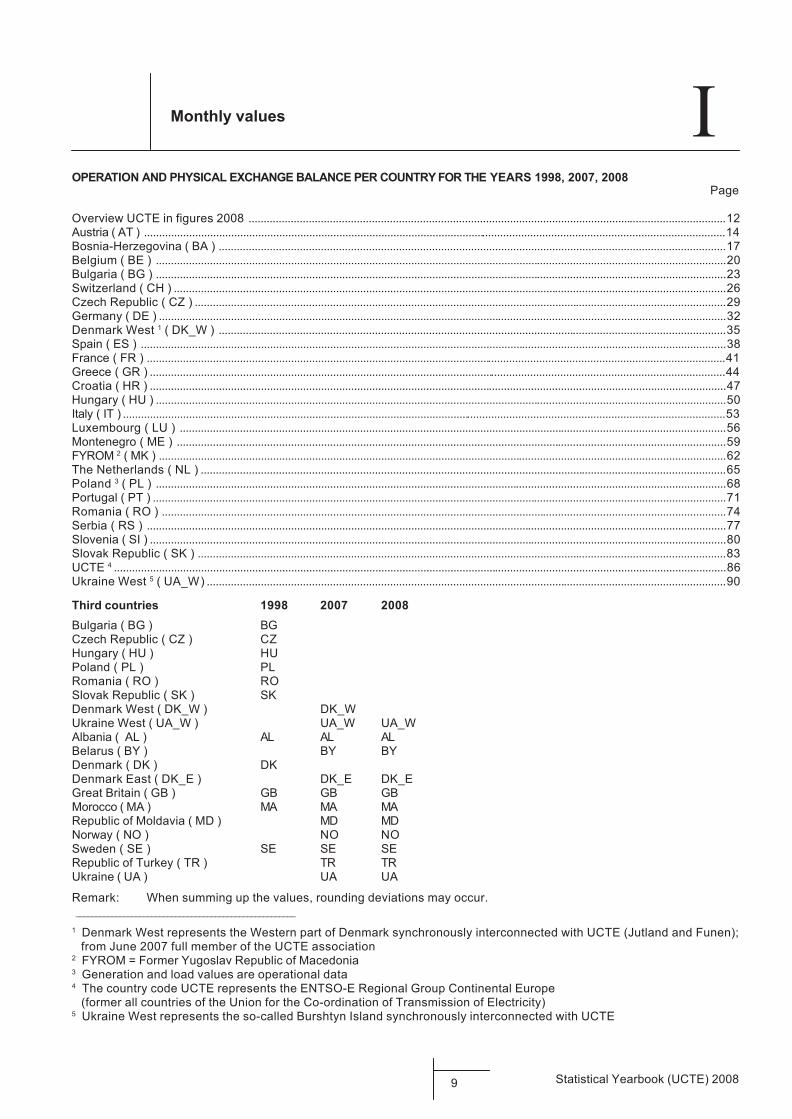
Monthly values / Operation IThe following information for the individual countries is presented on the next pages:
Thermal nuclear net generation (national values)
Fossil fuels net generation (national values)
Hydraulic net generation (national values)
Other renewable net generation (national values)- of which wind
Non-identifiable net generation (national values)
Total net electrical energy generation,calculated to represent 100% of the national values
Physical import
Physical export
Total physical import/export balance,described as index 2.15 of the statistical Terminology 1
Consumption of pumps
National electrical consumption,calculated to represent 100% of the national values
Consumption load at 3:00 a.m. on the 3rd Wednesday,calculated to represent 100% of the national values
Consumption load at 11:00 a.m. on the 3rd Wednesday,calculated to represent 100% of the national values
Highest load on the 3rd Wednesday,calculated to represent 100% of the national values
Time of the highest load on the 3rd Wednesday
Power produced in parallel operation on the 3rd Wednesday at 11:00 a.m.( collected and published until year 2006 )
Physical exchanges in interconnected operation:The exchanges CS, HR and SI in the year 1998 are corresponded to the historical country code YUGO andSIHR.
1 The imports/exports refer to values, that take into account the physical exchanges on the cross-frontier transmissionlines, but in addition also: - exchange values on lines < 110 kV outside of the interconnected transmission system.
- on the other hand values resulting with regard to international contracts (water claim).For presenting the operation of the interconnected transmission system only interconnected transmission lines, whichare registrered in these terms, are taken into consideration.
Statistical Yearbook (UCTE) 2008 12 Values as of 15.8.2009 / Edition September 2009
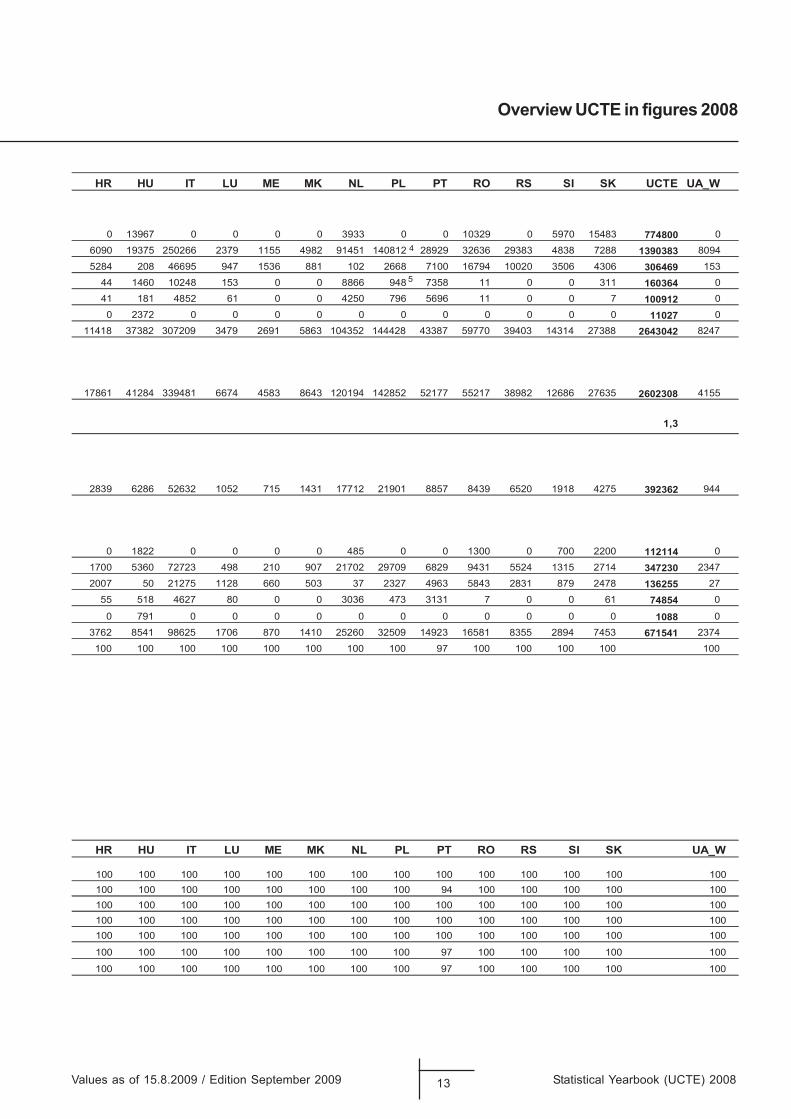
Overview UCTE in figures 2008
Percentage as referred to the national values
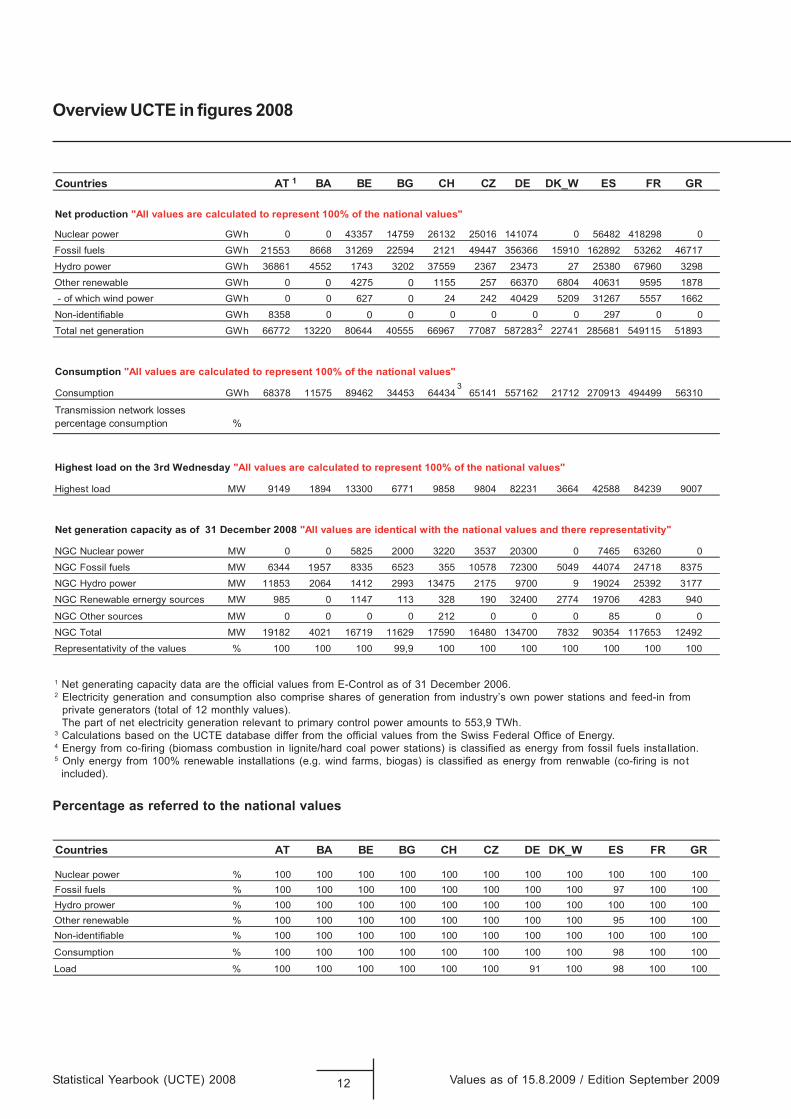
1 Net generating capacity data are the official values from E-Control as of 31 December 2006.2 Electricity generation and consumption also comprise shares of generation from industry’s own power stations and feed-in from private generators (total of 12 monthly values). The part of net electricity generation relevant to primary control power amounts to 553,9 TWh.3 Calculations based on the UCTE database differ from the official values from the Swiss Federal Office of Energy.4 Energy from co-firing (biomass combustion in lignite/hard coal power stations) is classified as energy from fossil fuels installation.5 Only energy from 100% renewable installations (e.g. wind farms, biogas) is classified as energy from renwable (co-firing is not included).
RGRFSEW_KDEDZCHCGBEBABTAseirtnuoC
001001001001001001001001001001001%rewop raelcuN00100179001001001001001001001001%sleuf lissoF001001001001001001001001001001001%reworp ordyH00100159001001001001001001001001% elbawener rehtO001001001001001001001001001001001% elbaifitnedi-noN
00100189001001001001001001001001%noitpmusnoC
0010018900119001001001001001001%daoL
RGRF SEW_KD EDZCHCGBEBABTAseirtnuoC
Net production "All values are calculated to represent 100% of the national values"
08928142846504701416105223162957417533400hWGrewop raelcuN
hWGsleuf lissoF 21553 8668 31269 22594 2121 49447 356366 15910 162892 53262 46717
89230697608352723743276329557320233471255416863hWGrewop ordyH
Other renewable GWh 0 0 4275 0 1155 257 66370 6804 40631 9595 1878 - of which wind power GWh 0 0 627 0 24 242 40429 5209 31267 5557 1662
Non-identifiable GWh 8358 0 0 0 0 0 0 0 297 0 0
Total net generation GWh 66772 13220 80644 40555 66967 77087 587283 22741 285681 549115 51893
Consumption "All values are calculated to represent 100% of the national values"
0136599449431907221712261755141564344635443264985751187386hWGnoitpmusnoC
Transmission network lossespercentage consumption %
Highest load on the 3rd Wednesday "All values are calculated to represent 100% of the national values"
700993248885244663132284089858917760033149819419WM daol tsehgiH
Net generation capacity as of 31 December 2008 "All values are identical with the national values and there representativity"
NGC Nuclear power MW 0 0 5825 2000 3220 3537 20300 0 7465 63260 0
NGC Fossil fuels MW 6344 1957 8335 6523 355 10578 72300 5049 44074 24718 8375
NGC Hydro power MW 11853 2064 1412 2993 13475 2175 9700 9 19024 25392 3177
NGC Renewable ernergy sources MW 985 0 1147 113 328 190 32400 2774 19706 4283 940
NGC Other sources MW 0 0 0 0 212 0 0 0 85 0 0
2942135671145309238700743108461095719261191761120428191WMlatoT CGN
Representativity of the values % 100 100 100 99,9 100 100 100 100 100 100 100
3
1
2
Values as of 15.8.2009 / Edition September 2009 13 Statistical Yearbook (UCTE) 2008
Overview UCTE in figures 2008
HR HU IT LU ME MK NL PL PT RO RS SI SK UA_W
100 100 100 100 100 100 100 100 100 100 100 100 100 100100 100 100 100 100 100 100 100 94 100 100 100 100 100100 100 100 100 100 100 100 100 100 100 100 100 100 100100 100 100 100 100 100 100 100 100 100 100 100 100 100100 100 100 100 100 100 100 100 100 100 100 100 100 100
100 100 100 100 100 100 100 100 97 100 100 100 100 100
100 100 100 100 100 100 100 100 97 100 100 100 100 100
HR HU IT LU ME MK NL PL PT RO RS SI SK UCTE UA_W
0 13967 0 0 0 0 3933 0 0 10329 0 5970 15483 774800 0
6090 19375 250266 2379 1155 4982 91451 140812 28929 32636 29383 4838 7288 1390383 8094
5284 208 46695 947 1536 881 102 2668 7100 16794 10020 3506 4306 306469 153
44 1460 10248 153 0 0 8866 948 7358 11 0 0 311 160364 041 181 4852 61 0 0 4250 796 5696 11 0 0 7 100912 0
0 2372 0 0 0 0 0 0 0 0 0 0 0 11027 0
11418 37382 307209 3479 2691 5863 104352 144428 43387 59770 39403 14314 27388 2643042 8247
17861 41284 339481 6674 4583 8643 120194 142852 52177 55217 38982 12686 27635 2602308 4155
1,3
2839 6286 52632 1052 715 1431 17712 21901 8857 8439 6520 1918 4275 392362 944
0 1822 0 0 0 0 485 0 0 1300 0 700 2200 112114 0
1700 5360 72723 498 210 907 21702 29709 6829 9431 5524 1315 2714 347230 2347
2007 50 21275 1128 660 503 37 2327 4963 5843 2831 879 2478 136255 27
55 518 4627 80 0 0 3036 473 3131 7 0 0 61 74854 0
0 791 0 0 0 0 0 0 0 0 0 0 0 1088 0
3762 8541 98625 1706 870 1410 25260 32509 14923 16581 8355 2894 7453 671541 2374
100 100 100 100 100 100 100 100 97 100 100 100 100 100
5
4
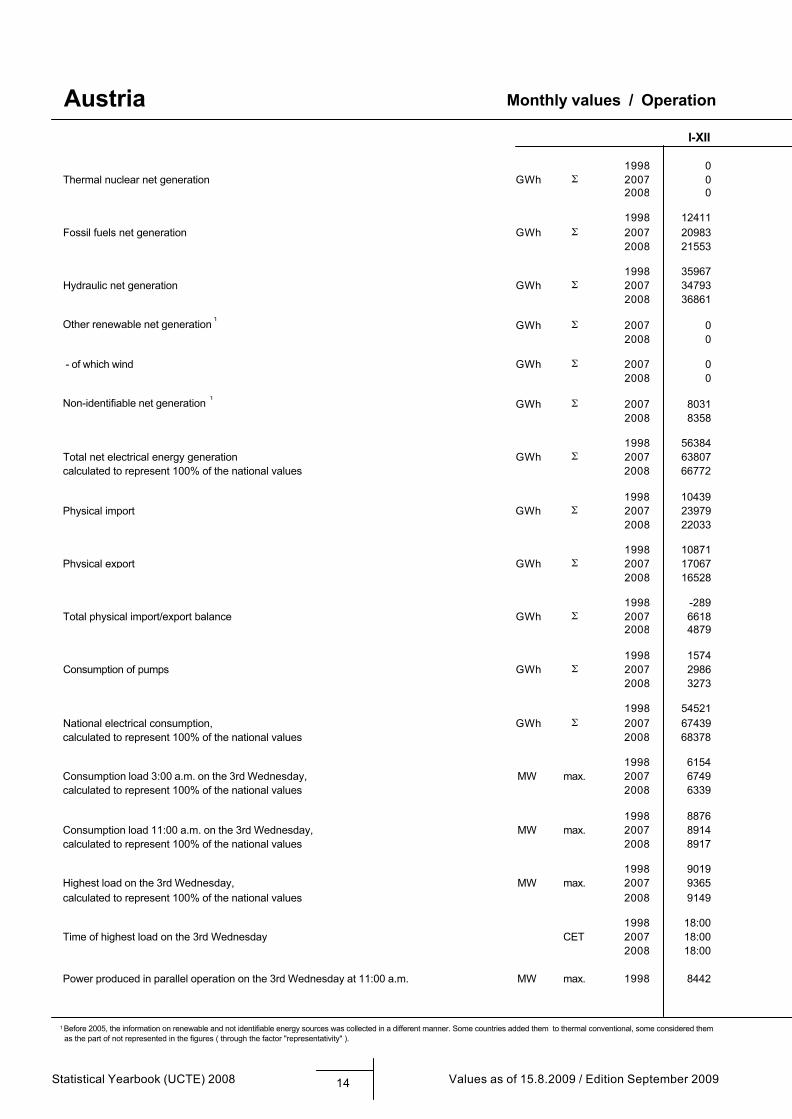
1 Before 2005, the information on renewable and not identifiable energy sources was collected in a different manner. Some countries added them to thermal conventional, some considered them as the part of not represented in the figures ( through the factor "representativity" ).
Monthly values / Operation
Statistical Yearbook (UCTE) 2008 14 Values as of 15.8.2009 / Edition September 2009
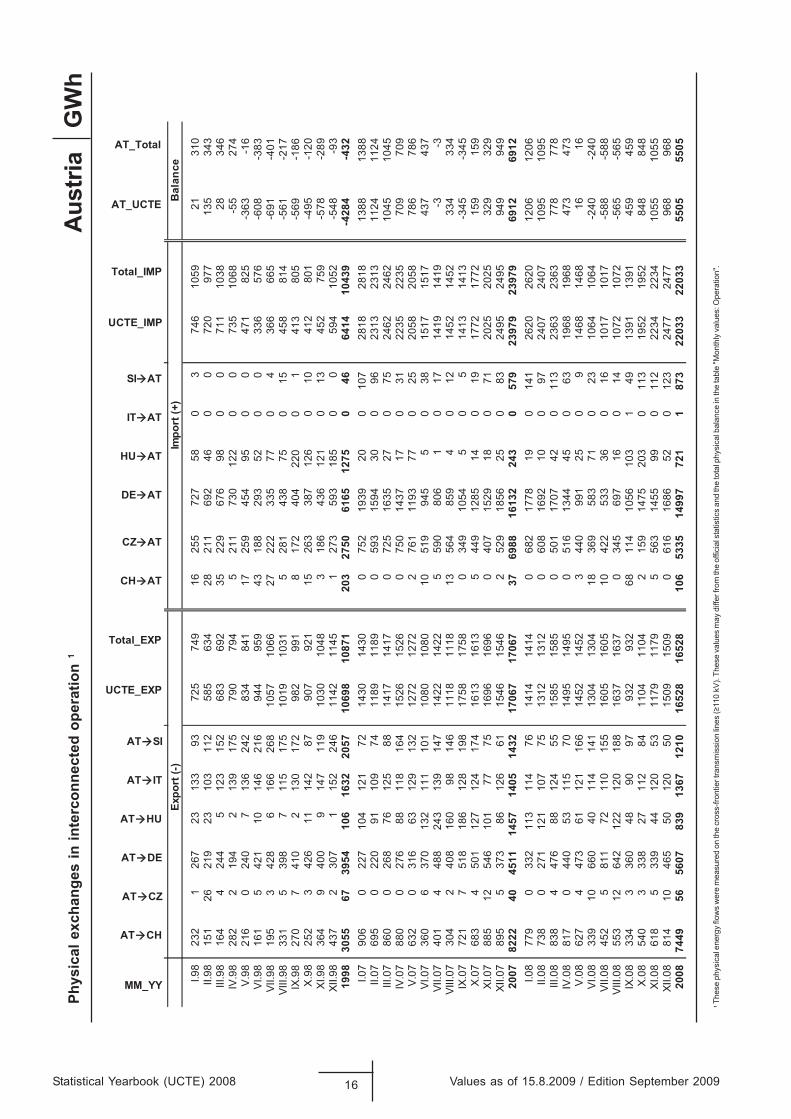
AustriaI-XII
1998 0Thermal nuclear net generation GWh Σ 2007 0
2008 0
1998 12411Fossil fuels net generation GWh Σ 2007 20983
2008 21553
1998 35967Hydraulic net generation GWh Σ 2007 34793
2008 36861
Other renewable net generation 1 GWh Σ 2007 02008 0
- of which wind GWh Σ 2007 02008 0
Non-identifiable net generation 1GWh Σ 2007 8031
2008 8358
1998 56384Total net electrical energy generation GWh Σ 2007 63807calculated to represent 100% of the national values 2008 66772
1998 10439Physical import GWh Σ 2007 23979
2008 22033
1998 10871Physical export GWh Σ 2007 17067
2008 16528
1998 -289Total physical import/export balance GWh Σ 2007 6618
2008 4879
1998 1574Consumption of pumps GWh Σ 2007 2986
2008 3273
1998 54521National electrical consumption, GWh Σ 2007 67439calculated to represent 100% of the national values 2008 68378
1998 6154Consumption load 3:00 a.m. on the 3rd Wednesday, MW max. 2007 6749calculated to represent 100% of the national values 2008 6339
1998 8876Consumption load 11:00 a.m. on the 3rd Wednesday, MW max. 2007 8914calculated to represent 100% of the national values 2008 8917
1998 9019Highest load on the 3rd Wednesday, MW max. 2007 9365calculated to represent 100% of the national values 2008 9149
1998 18:00Time of highest load on the 3rd Wednesday CET 2007 18:00
2008 18:00
Power produced in parallel operation on the 3rd Wednesday at 11:00 a.m. MW max. 1998 8442
Monthly values / Operation
Values as of 15.8.2009 / Edition September 2009 15 Statistical Yearbook (UCTE) 2008
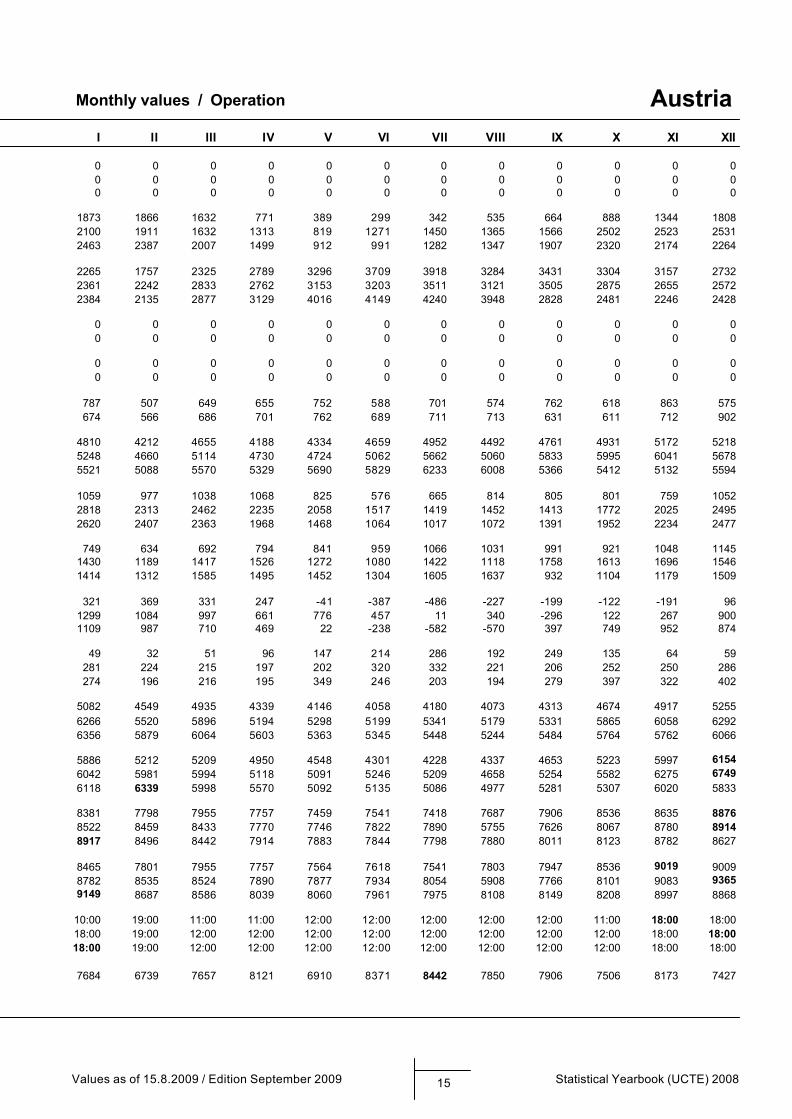
AustriaI II III IV V VI VII VIII IX X XI XII
0 0 0 0 0 0 0 0 0 0 0 00 0 0 0 0 0 0 0 0 0 0 00 0 0 0 0 0 0 0 0 0 0 0
1873 1866 1632 771 389 299 342 535 664 888 1344 18082100 1911 1632 1313 819 1271 1450 1365 1566 2502 2523 25312463 2387 2007 1499 912 991 1282 1347 1907 2320 2174 2264
2265 1757 2325 2789 3296 3709 3918 3284 3431 3304 3157 27322361 2242 2833 2762 3153 3203 3511 3121 3505 2875 2655 25722384 2135 2877 3129 4016 4149 4240 3948 2828 2481 2246 2428
0 0 0 0 0 0 0 0 0 0 0 00 0 0 0 0 0 0 0 0 0 0 0
0 0 0 0 0 0 0 0 0 0 0 00 0 0 0 0 0 0 0 0 0 0 0
787 507 649 655 752 588 701 574 762 618 863 575674 566 686 701 762 689 711 713 631 611 712 902
4810 4212 4655 4188 4334 4659 4952 4492 4761 4931 5172 52185248 4660 5114 4730 4724 5062 5662 5060 5833 5995 6041 56785521 5088 5570 5329 5690 5829 6233 6008 5366 5412 5132 5594
1059 977 1038 1068 825 576 665 814 805 801 759 10522818 2313 2462 2235 2058 1517 1419 1452 1413 1772 2025 24952620 2407 2363 1968 1468 1064 1017 1072 1391 1952 2234 2477
749 634 692 794 841 959 1066 1031 991 921 1048 11451430 1189 1417 1526 1272 1080 1422 1118 1758 1613 1696 15461414 1312 1585 1495 1452 1304 1605 1637 932 1104 1179 1509
321 369 331 247 -41 -387 -486 -227 -199 -122 -191 961299 1084 997 661 776 457 11 340 -296 122 267 9001109 987 710 469 22 -238 -582 -570 397 749 952 874
49 32 51 96 147 214 286 192 249 135 64 59281 224 215 197 202 320 332 221 206 252 250 286274 196 216 195 349 246 203 194 279 397 322 402
5082 4549 4935 4339 4146 4058 4180 4073 4313 4674 4917 52556266 5520 5896 5194 5298 5199 5341 5179 5331 5865 6058 62926356 5879 6064 5603 5363 5345 5448 5244 5484 5764 5762 6066
5886 5212 5209 4950 4548 4301 4228 4337 4653 5223 5997 61546042 5981 5994 5118 5091 5246 5209 4658 5254 5582 6275 67496118 6339 5998 5570 5092 5135 5086 4977 5281 5307 6020 5833
8381 7798 7955 7757 7459 7541 7418 7687 7906 8536 8635 88768522 8459 8433 7770 7746 7822 7890 5755 7626 8067 8780 89148917 8496 8442 7914 7883 7844 7798 7880 8011 8123 8782 8627
8465 7801 7955 7757 7564 7618 7541 7803 7947 8536 9019 90098782 8535 8524 7890 7877 7934 8054 5908 7766 8101 9083 93659149 8687 8586 8039 8060 7961 7975 8108 8149 8208 8997 8868
10:00 19:00 11:00 11:00 12:00 12:00 12:00 12:00 12:00 11:00 18:00 18:0018:00 19:00 12:00 12:00 12:00 12:00 12:00 12:00 12:00 12:00 18:00 18:0018:00 19:00 12:00 12:00 12:00 12:00 12:00 12:00 12:00 12:00 18:00 18:00
7684 6739 7657 8121 6910 8371 8442 7850 7906 7506 8173 7427
Statistical Yearbook (UCTE) 2008 16 Values as of 15.8.2009 / Edition September 2009
GW
hPh
ysic
al e
xcha
nges
in in
terc
onne
cted
ope
ratio
n 1
1
Thes
e ph
ysic
al e
nerg
y flo
ws
wer
e m
easu
red
on th
e cr
oss-
front
ier t
rans
mis
sion
lines
(≥11
0 kV
). Th
ese
valu
es m
ay d
iffer
from
the
offic
ial s
tatis
tics
and
the
tota
l phy
sica
l bal
ance
in th
e ta
ble
"Mon
thly
val
ues:
Ope
ratio
n".
Aus
tria
MM_YY
AT CH
AT CZ
AT DE
AT HU
AT IT
AT SI
UCTE_EXP
Total_EXP
CH AT
CZ AT
DE AT
HU AT
IT AT
SI AT
UCTE_IMP
Total_IMP
AT_UCTE
AT_Total
ecnalaB
)+( tropmI
)-( tropxE
I.98
232
126
723
133
9372
574
916
255
727
580
374
610
5921
310
II.98
151
2621
923
103
112
585
634
2821
169
246
00
720
977
135
343
III.9
816
44
244
512
315
268
369
235
229
676
980
071
110
3828
346
IV.9
828
22
194
213
917
579
079
45
211
730
122
00
735
1068
-55
274
V.98
216
024
07
136
242
834
841
1725
945
495
00
471
825
-363
-16
VI.9
816
15
421
1014
621
694
495
943
188
293
520
033
657
6-6
08-3
83VI
I.98
195
342
86
166
268
1057
1066
2722
233
577
04
366
665
-691
-401
VIII.
9833
15
398
711
517
510
1910
315
281
438
750
1545
881
4-5
61-2
17IX
.98
270
741
02
130
172
982
991
817
240
422
00
141
380
5-5
69-1
86X
.98
252
342
611
142
8790
792
115
263
387
126
010
412
801
-495
-120
XI.9
836
49
400
914
711
910
3010
483
186
436
121
013
452
759
-578
-289
XII.9
843
72
307
115
224
611
4211
451
273
593
185
00
594
1052
-548
-93
1998
3055
6739
5410
616
3220
5710
698
1087
120
327
5061
6512
750
4664
1410
439
-428
4-4
32I.0
790
60
227
104
121
7214
3014
300
752
1939
200
107
2818
2818
1388
1388
II.07
695
022
091
109
7411
8911
890
593
1594
300
9623
1323
1311
2411
24III
.07
860
026
876
125
8814
1714
170
725
1635
270
7524
6224
6210
4510
45IV
.07
880
027
688
118
164
1526
1526
075
014
3717
031
2235
2235
709
709
V.07
632
031
663
129
132
1272
1272
276
111
9377
025
2058
2058
786
786
VI.0
736
06
370
132
111
101
1080
1080
1051
994
55
038
1517
1517
437
437
VII.0
740
14
488
243
139
147
1422
1422
559
080
61
017
1419
1419
-3-3
VIII.
0730
42
408
160
9814
611
1811
1813
564
859
40
1214
5214
5233
433
4IX
.07
721
751
818
612
819
817
5817
580
349
1054
50
514
1314
13-3
45-3
45X.
0768
34
501
127
124
174
1613
1613
544
912
8514
019
1772
1772
159
159
XI.0
788
512
546
101
7775
1696
1696
040
715
2918
071
2025
2025
329
329
XII.0
789
55
373
8612
661
1546
1546
252
918
5625
083
2495
2495
949
949
2007
8222
4045
1114
5714
0514
3217
067
1706
737
6988
1613
224
30
579
2397
923
979
6912
6912
I.08
779
033
211
311
476
1414
1414
068
217
7819
014
126
2026
2012
0612
06II.
0873
80
271
121
107
7513
1213
120
608
1692
100
9724
0724
0710
9510
95III
.08
838
447
688
124
5515
8515
850
501
1707
420
113
2363
2363
778
778
IV.0
881
70
440
5311
570
1495
1495
051
613
4445
06 3
196 8
1968
473
473
V.08
627
447
361
121
166
1452
1452
344
099
125
09
1468
1468
1616
VI.0
833
910
660
4011
414
113
0413
0418
369
583
710
2310
6410
64-2
40-2
40VI
I.08
452
581
172
110
155
1605
1605
1042
253
336
016
1017
1017
-588
-588
VIII.
0855
312
642
122
120
188
1637
1637
034
569
716
014
1072
1072
-565
-565
IX.0
833
43
360
4890
9793
293
268
114
1056
103
149
1391
1391
459
459
X.08
540
333
827
112
8411
0411
042
159
1475
203
011
319
5219
5284
884
8XI
.08
618
533
944
120
5311
7911
795
563
1455
990
112
2234
2234
1055
1055
XII.0
881
410
465
5012
050
1509
1509
061
616
8652
012
324
7724
7796
896
820
0874
4956
5607
839
1367
1210
1652
816
528
106
5335
1499
772
11
873
2203
322
033
5505
5505
1
The
se p
hysi
cal e
nerg
y flo
ws
wer
e m
easu
red
on th
e cr
oss-
fron
tier t
rans
mis
sion
line
s (>
110
kV).
The
se v
alue
s m
ay d
iffer
from
the
offic
ial s
tatis
tics
and
the
tota
l phy
sica
l bal
ance
in th
e ta
ble
"Mon
thly
val
ues:
Ope
ratio
n".
Values as of 15.8.2009 / Edition September 2009 17 Statistical Yearbook (UCTE) 2008
GW
hP
hys
ical
exc
han
ges
in
in
terc
on
nec
ted
op
erat
ion
1B
osn
ia-H
erze
go
vin
a
MM_YY
BA HR
BA ME
BA RS
UCTE_EXP
Total_EXP
HR BA
ME BA
RS BA
UCTE_IMP
Total_IMP
BA_UCTE
BA_Total
Bal
ance
I.98
77
70
00
-7-7
II.98
2727
270
00
-27
-27
III.9
869
6969
494
949
-20
-20
IV.9
868
6868
101
010
-58
-58
V.9
810
51
0510
58
88
-97
-97
VI.9
884
8484
525
252
-32
-32
VII.
9862
6262
696
969
77
VIII
.98
6767
6741
41
41-2
6-2
6IX
.98
103
103
103
565
656
-47
-47
X.9
890
9090
88
8-8
2-8
2X
I.98
5151
518
88
-43
-43
XII.
9860
6060
99
9-5
1-5
119
9879
379
379
331
031
031
0-4
83-4
83
I.07
138
177
47
362
362
136
526
140
24
0240
40II.
0715
714
82
33
2832
856
2219
327
12
71-5
7-5
7III
.07
133
191
29
353
353
6718
130
215
215
-138
-138
IV.0
795
146
14
255
255
8219
172
273
273
1818
V.0
710
312
42
52
5225
211
220
204
336
336
8484
VI.0
762
187
28
277
277
122
419
832
43
2447
47V
II.07
7524
42
03
3933
914
16
187
334
334
-5-5
VIII
.07
6630
34
54
1441
417
21
156
329
329
-85
-85
IX.0
712
623
73
84
0140
186
220
229
02
90-1
11-1
11X
.07
189
176
39
404
404
787
246
331
331
-73
-73
XI.0
731
714
33
34
9349
354
2821
329
52
95-1
98-1
98X
II.07
241
200
25
466
466
6931
243
343
343
-123
-123
2007
1702
2276
366
4344
4344
1175
163
2405
3743
3743
-601
-601
I.08
191
213
22
426
426
6426
245
335
335
-91
-91
II.08
184
229
26
439
439
7425
220
319
319
-120
-120
III.0
828
212
32
24
2742
750
2922
330
23
02-1
25-1
25IV
.08
261
109
93
7937
933
2819
725
82
58-1
21-1
21V
.08
163
151
25
339
339
5611
180
247
247
-92
-92
VI.0
816
219
72
13
8038
055
713
820
02
00-1
80-1
80V
II.08
259
153
18
430
430
5510
215
280
280
-150
-150
VIII
.08
127
234
30
391
391
111
219
330
63
06-8
5-8
5IX
.08
176
189
53
7037
062
4114
424
72
47-1
23-1
23X
.08
280
148
17
445
445
4716
259
322
322
-123
-123
XI.0
826
316
52
14
4944
961
2121
930
13
01-1
48-1
48X
II.08
316
171
42
529
529
6923
145
237
237
-292
-292
2008
2664
2082
258
5004
5004
737
239
2378
3354
3354
-165
0-1
650
1 Before 2005, the information on renewable and not identifiable energy sources was collected in a different manner. Some countries added them to thermal conventional, some considered them as the part of not represented in the figures ( through the factor "representativity" ).
Monthly values / Operation
Statistical Yearbook (UCTE) 2008 18 Values as of 15.8.2009 / Edition September 2009
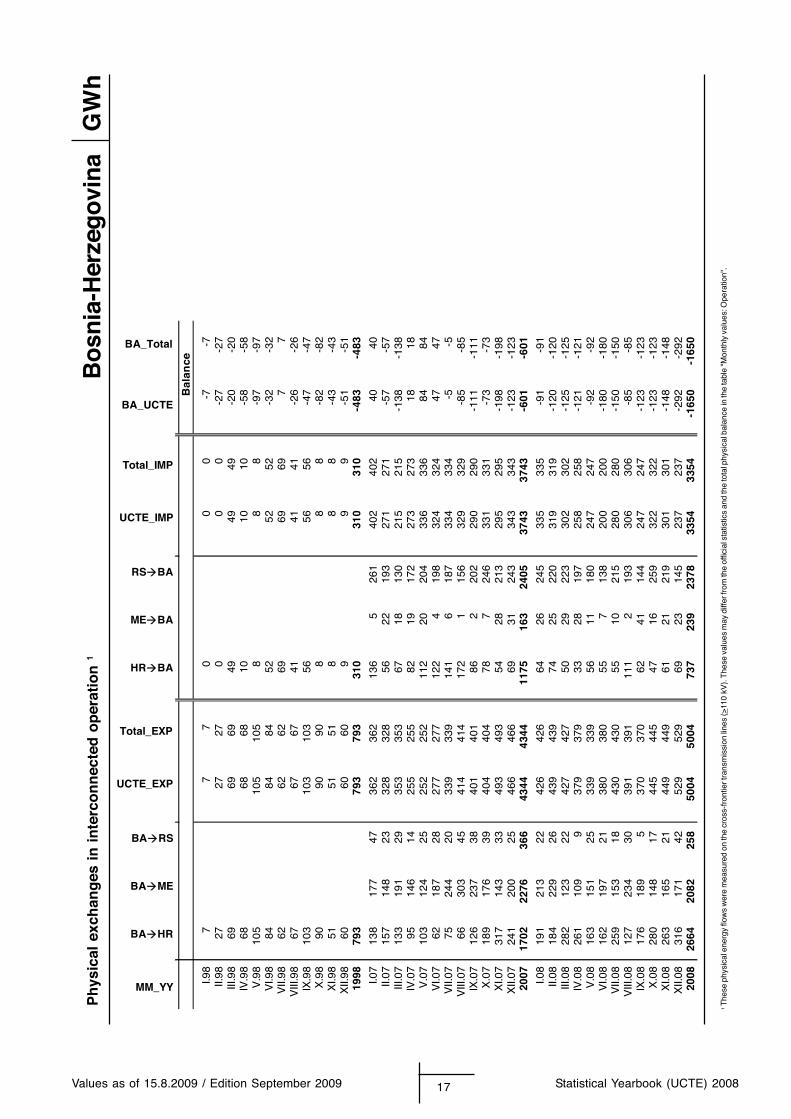
Bosnia-HerzegovinaI-XII
1998 n.a.Thermal nuclear net generation GWh 2007 0
2008 0
1998 n.a.Fossil fuels net generation GWh 2007 7782
2008 8668
1998 n.a.Hydraulic net generation GWh 2007 4001
2008 4552
Other renewable net generation 1 GWh 2007 02008 0
- of which wind GWh 2007 02008 0
Non-identifiable net generation 1 GWh 2007 02008 0
1998 n.a.Total net electrical energy generation GWh 2007 11783calculated to represent 100% of the national values 2008 13220
1998 310Physical import GWh 2007 3743
2008 3354
1998 793Physical export GWh 2007 4344
2008 5004
1998 n.a.Total physical import/export balance GWh 2007 -612
2008 -1645
1998 n.a.Consumption of pumps GWh 2007 0
2008 0
1998 n.a.National electrical consumption, GWh 2007 11171calculated to represent 100% of the national values 2008 11575
1998 n.a.Consumption load 3:00 a.m. on the 3rd Wednesday, MW max. 2007 1173calculated to represent 100% of the national values 2008 1158
1998 n.a.Consumption load 11:00 a.m. on the 3rd Wednesday, MW max. 2007 1776calculated to represent 100% of the national values 2008 1627
1998 n.a.Highest load on the 3rd Wednesday, MW max. 2007 1974calculated to represent 100% of the national values 2008 1894
1998 n.a.Time of highest load on the 3rd Wednesday CET 2007 18:00
2008 18:00
Power produced in parallel operation on the 3rd Wednesday at 11:00 a.m. MW max. 1998 n.a.
Monthly values / Operation
Values as of 15.8.2009 / Edition September 2009 19 Statistical Yearbook (UCTE) 2008
Bosnia-HerzegovinaI II III IV V VI VII VIII IX X XI XII
n.a. n.a. n.a. n.a. n.a. n.a. n.a. n.a. n.a. n.a. n.a. n.a.0 0 0 0 0 0 0 0 0 0 0 00 0 0 0 0 0 0 0 0 0 0 0
n.a. n.a. n.a. n.a. n.a. n.a. n.a. n.a. n.a. n.a. n.a. n.a.704 658 708 363 506 537 620 723 749 768 719 727706 749 701 486 638 751 853 810 737 751 800 686
n.a. n.a. n.a. n.a. n.a. n.a. n.a. n.a. n.a. n.a. n.a. n.a.283 290 383 469 280 259 273 237 226 290 495 516479 369 436 546 362 313 225 215 222 347 343 695
0 0 0 0 0 0 0 0 0 0 0 00 0 0 0 0 0 0 0 0 0 0 0
0 0 0 0 0 0 0 0 0 0 0 00 0 0 0 0 0 0 0 0 0 0 0
0 0 0 0 0 0 0 0 0 0 0 00 0 0 0 0 0 0 0 0 0 0 0
n.a. n.a. n.a. n.a. n.a. n.a. n.a. n.a. n.a. n.a. n.a. n.a.987 948 1091 832 786 796 893 960 975 1058 1214 1243
1185 1118 1137 1032 1000 1064 1078 1025 959 1098 1143 1381
0 0 49 10 8 52 69 41 56 8 8 9402 271 215 273 336 324 334 329 290 331 295 343335 319 302 258 247 200 280 306 247 322 301 237
7 27 69 68 105 84 62 67 103 90 51 60362 328 353 255 252 277 339 414 401 404 493 466426 439 427 379 339 380 430 391 370 445 449 529
n.a. n.a. n.a. n.a. n.a. n.a. n.a. n.a. n.a. n.a. n.a. n.a.37 -58 -139 19 83 46 -4 -86 -110 -73 -198 -129
-92 -120 -125 -121 -92 -176 -150 -86 -124 -115 -150 -294
n.a. n.a. n.a. n.a. n.a. n.a. n.a. n.a. n.a. n.a. n.a. n.a.0 0 0 0 0 0 0 0 0 0 0 00 0 0 0 0 0 0 0 0 0 0 0
n.a. n.a. n.a. n.a. n.a. n.a. n.a. n.a. n.a. n.a. n.a. n.a.1024 890 952 851 869 842 889 874 865 985 1016 11141093 998 1012 911 908 888 928 939 835 983 993 1087
n.a. n.a. n.a. n.a. n.a. n.a. n.a. n.a. n.a. n.a. n.a. n.a.1065 982 1033 895 928 955 932 902 892 1025 1084 11731133 1158 1100 954 955 973 998 993 985 1033 1088 1091
n.a. n.a. n.a. n.a. n.a. n.a. n.a. n.a. n.a. n.a. n.a. n.a.1567 1431 1497 1325 1299 1357 1383 1325 1326 1472 1593 17761624 1627 1588 1447 1409 1417 1465 1458 1504 1510 1601 1622
n.a. n.a. n.a. n.a. n.a. n.a. n.a. n.a. n.a. n.a. n.a. n.a.1736 1618 1649 1493 1458 1464 1491 1429 1557 1706 1781 19741793 1855 1793 1617 1510 1502 1517 1597 1682 1753 1894 1865
n.a. n.a. n.a. n.a. n.a. n.a. n.a. n.a. n.a. n.a. n.a. n.a.18:00 19:00 21:00 21:00 22:00 22:00 22:00 22:00 20:00 20:00 18:00 18:0019:00 19:00 20:00 21:00 22:00 22:00 22:00 21:00 20:00 20:00 18:00 18:00
n.a. n.a. n.a. n.a. n.a. n.a. n.a. n.a. n.a. n.a. n.a. n.a.
1 Before 2005, the information on renewable and not identifiable energy sources was collected in a different manner. Some countries added them to thermal conventional, some considered them as the part of not represented in the figures ( through the factor "representativity" ).
Monthly values / Operation
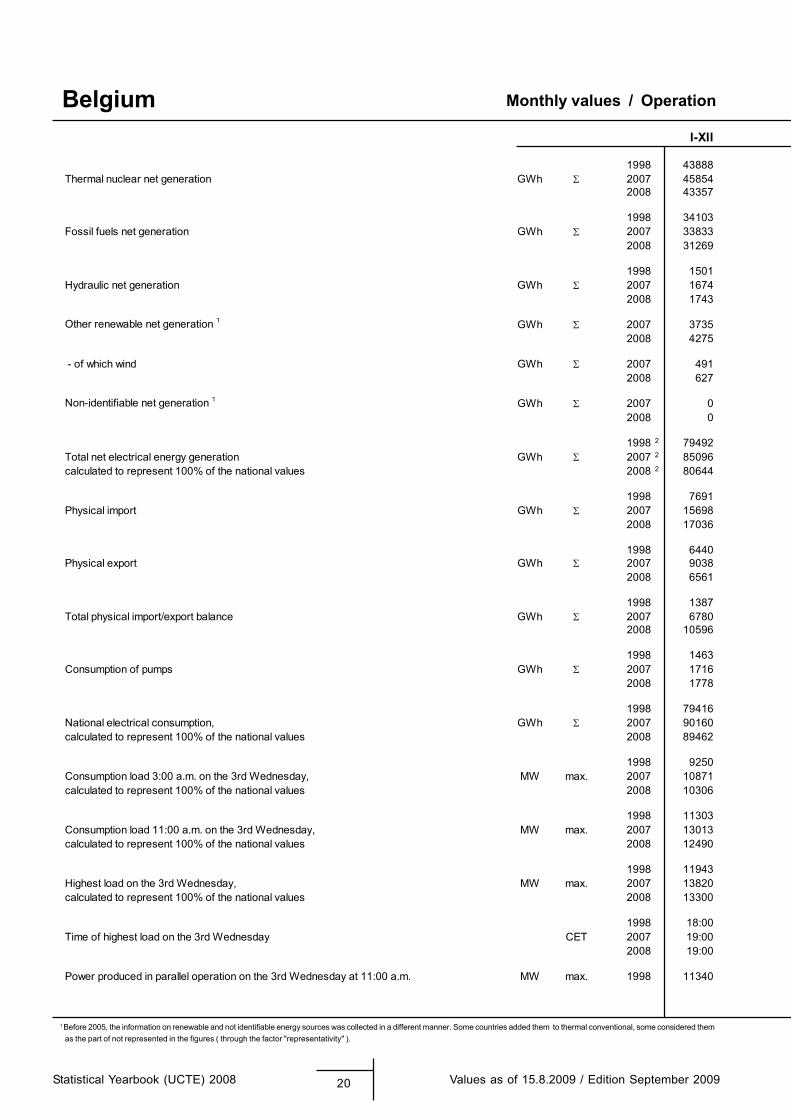
Statistical Yearbook (UCTE) 2008 20 Values as of 15.8.2009 / Edition September 2009
BelgiumI-XII
1998 43888Thermal nuclear net generation GWh 2007 45854
2008 43357
1998 34103Fossil fuels net generation GWh 2007 33833
2008 31269
1998 1501Hydraulic net generation GWh 2007 1674
2008 1743
Other renewable net generation 1 GWh 2007 37352008 4275
- of which wind GWh 2007 4912008 627
Non-identifiable net generation 1 GWh 2007 02008 0
1998 2 79492Total net electrical energy generation GWh 2007 2 85096calculated to represent 100% of the national values 2008 2 80644
1998 7691Physical import GWh 2007 15698
2008 17036
1998 6440Physical export GWh 2007 9038
2008 6561
1998 1387Total physical import/export balance GWh 2007 6780
2008 10596
1998 1463Consumption of pumps GWh 2007 1716
2008 1778
1998 79416National electrical consumption, GWh 2007 90160calculated to represent 100% of the national values 2008 89462
1998 9250Consumption load 3:00 a.m. on the 3rd Wednesday, MW max. 2007 10871calculated to represent 100% of the national values 2008 10306
1998 11303Consumption load 11:00 a.m. on the 3rd Wednesday, MW max. 2007 13013calculated to represent 100% of the national values 2008 12490
1998 11943Highest load on the 3rd Wednesday, MW max. 2007 13820calculated to represent 100% of the national values 2008 13300
1998 18:00Time of highest load on the 3rd Wednesday CET 2007 19:00
2008 19:00
Power produced in parallel operation on the 3rd Wednesday at 11:00 a.m. MW max. 1998 11340
2 including deliveries from industry
Monthly values / Operation
Values as of 15.8.2009 / Edition September 2009 21 Statistical Yearbook (UCTE) 2008
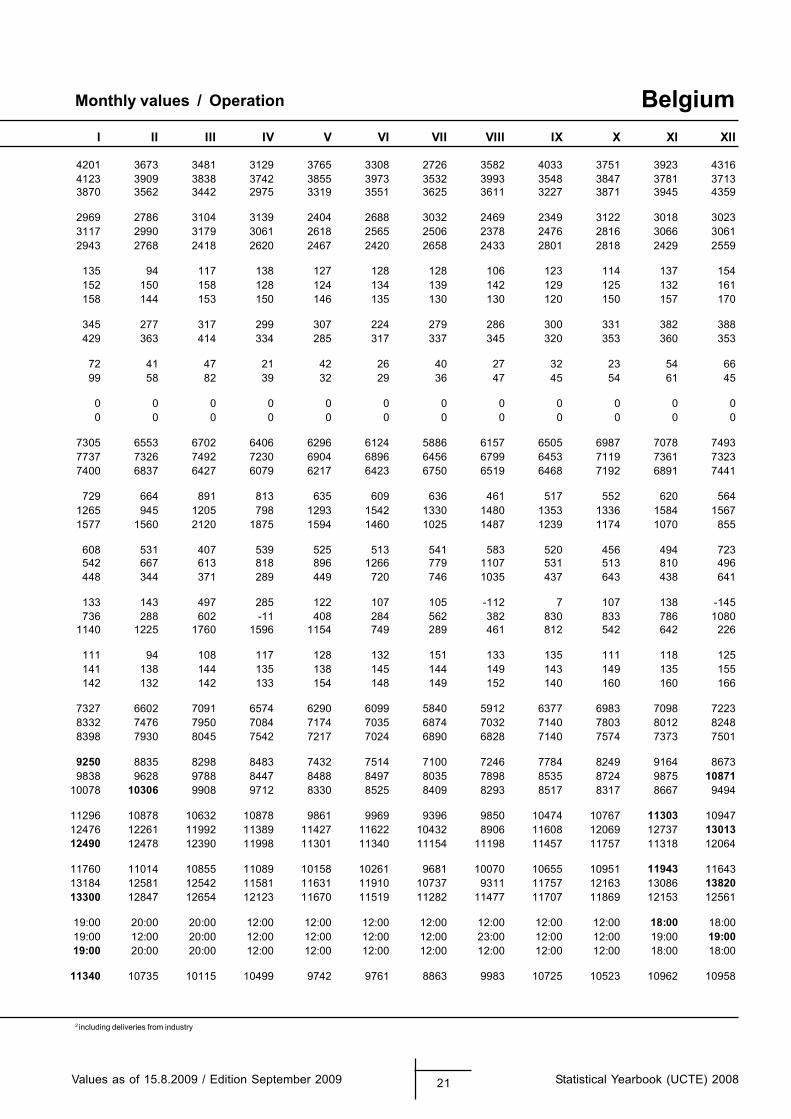
BelgiumI II III IV V VI VII VIII IX X XI XII
4201 3673 3481 3129 3765 3308 2726 3582 4033 3751 3923 43164123 3909 3838 3742 3855 3973 3532 3993 3548 3847 3781 37133870 3562 3442 2975 3319 3551 3625 3611 3227 3871 3945 4359
2969 2786 3104 3139 2404 2688 3032 2469 2349 3122 3018 30233117 2990 3179 3061 2618 2565 2506 2378 2476 2816 3066 30612943 2768 2418 2620 2467 2420 2658 2433 2801 2818 2429 2559
135 94 117 138 127 128 128 106 123 114 137 154152 150 158 128 124 134 139 142 129 125 132 161158 144 153 150 146 135 130 130 120 150 157 170
345 277 317 299 307 224 279 286 300 331 382 388429 363 414 334 285 317 337 345 320 353 360 353
72 41 47 21 42 26 40 27 32 23 54 6699 58 82 39 32 29 36 47 45 54 61 45
0 0 0 0 0 0 0 0 0 0 0 00 0 0 0 0 0 0 0 0 0 0 0
7305 6553 6702 6406 6296 6124 5886 6157 6505 6987 7078 74937737 7326 7492 7230 6904 6896 6456 6799 6453 7119 7361 73237400 6837 6427 6079 6217 6423 6750 6519 6468 7192 6891 7441
729 664 891 813 635 609 636 461 517 552 620 5641265 945 1205 798 1293 1542 1330 1480 1353 1336 1584 15671577 1560 2120 1875 1594 1460 1025 1487 1239 1174 1070 855
608 531 407 539 525 513 541 583 520 456 494 723542 667 613 818 896 1266 779 1107 531 513 810 496448 344 371 289 449 720 746 1035 437 643 438 641
133 143 497 285 122 107 105 -112 7 107 138 -145736 288 602 -11 408 284 562 382 830 833 786 1080
1140 1225 1760 1596 1154 749 289 461 812 542 642 226
111 94 108 117 128 132 151 133 135 111 118 125141 138 144 135 138 145 144 149 143 149 135 155142 132 142 133 154 148 149 152 140 160 160 166
7327 6602 7091 6574 6290 6099 5840 5912 6377 6983 7098 72238332 7476 7950 7084 7174 7035 6874 7032 7140 7803 8012 82488398 7930 8045 7542 7217 7024 6890 6828 7140 7574 7373 7501
9250 8835 8298 8483 7432 7514 7100 7246 7784 8249 9164 86739838 9628 9788 8447 8488 8497 8035 7898 8535 8724 9875 10871
10078 10306 9908 9712 8330 8525 8409 8293 8517 8317 8667 9494
11296 10878 10632 10878 9861 9969 9396 9850 10474 10767 11303 1094712476 12261 11992 11389 11427 11622 10432 8906 11608 12069 12737 1301312490 12478 12390 11998 11301 11340 11154 11198 11457 11757 11318 12064
11760 11014 10855 11089 10158 10261 9681 10070 10655 10951 11943 1164313184 12581 12542 11581 11631 11910 10737 9311 11757 12163 13086 1382013300 12847 12654 12123 11670 11519 11282 11477 11707 11869 12153 12561
19:00 20:00 20:00 12:00 12:00 12:00 12:00 12:00 12:00 12:00 18:00 18:0019:00 12:00 20:00 12:00 12:00 12:00 12:00 23:00 12:00 12:00 19:00 19:0019:00 20:00 20:00 12:00 12:00 12:00 12:00 12:00 12:00 12:00 18:00 18:00
11340 10735 10115 10499 9742 9761 8863 9983 10725 10523 10962 10958
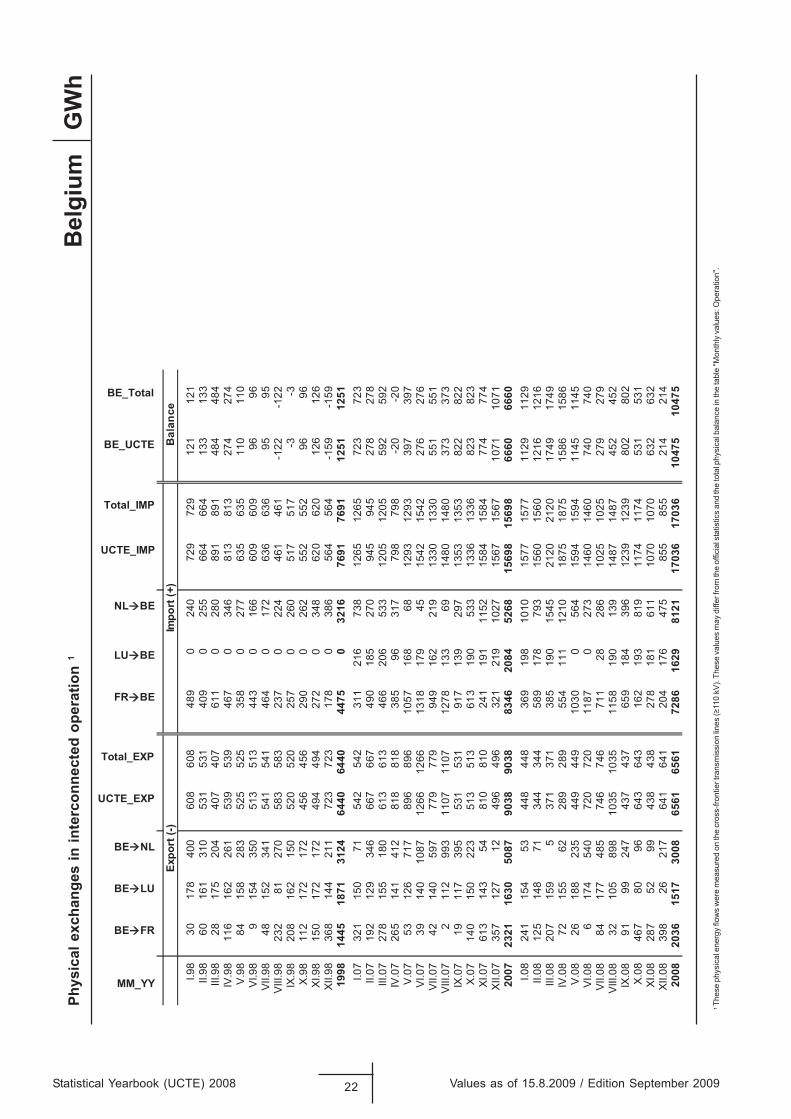
Statistical Yearbook (UCTE) 2008 22 Values as of 15.8.2009 / Edition September 2009
GW
hPh
ysic
al e
xcha
nges
in in
terc
onne
cted
ope
ratio
n 1
1
Thes
e ph
ysic
al e
nerg
y flo
ws
wer
e m
easu
red
on th
e cr
oss-
front
ier t
rans
mis
sion
lines
(≥11
0 kV
). Th
ese
valu
es m
ay d
iffer
from
the
offic
ial s
tatis
tics
and
the
tota
l phy
sica
l bal
ance
in th
e ta
ble
"Mon
thly
val
ues:
Ope
ratio
n".
Bel
gium
MM_YY
BE FR
BE LU
BE NL
UCTE_EXP
Total_EXP
FR BE
LU BE
NL BE
UCTE_IMP
Total_IMP
BE_UCTE
BE_Total
ecnalaB
)+( tropmI
)-( tropxE
I.98
3017
840
060
860
848
90
240
729
729
121
121
II.98
6016
131
053
153
140
90
255
664
664
133
133
III.9
828
175
204
407
407
611
028
089
189
148
448
4IV
.98
116
162
261
539
539
467
034
681
381
327
427
4V
.98
8415
828
352
552
535
80
277
635
635
110
110
VI.9
89
154
350
513
513
443
016
660
960
996
96VI
I.98
4815
234
154
154
146
40
172
636
636
9595
VIII
.98
232
8127
058
358
323
70
224
461
461
-122
-122
IX.9
820
816
215
052
052
025
70
260
517
517
-3-3
X.9
811
217
217
245
645
629
00
262
552
552
9696
XI.9
815
017
217
249
449
427
20
348
620
620
126
126
XII.9
836
814
421
172
372
317
80
386
564
564
-159
-159
1998
1445
1871
3124
6440
6440
4475
032
1676
9176
9112
5112
51I.0
732
115
071
542
542
311
216
738
1265
1265
723
723
II.07
192
129
346
667
667
490
185
270
945
945
278
278
III.0
727
815
518
061
361
346
620
653
312
0512
0559
259
2IV
.07
265
141
412
818
818
385
9631
779
879
8-2
0-2
0V
.07
5312
671
789
689
610
5716
868
1293
1293
397
397
VI.0
739
140
1087
1266
1266
1318
179
4515
4215
4227
627
6VI
I.07
4214
059
777
977
994
916
221
913
3013
3055
155
1V
III.0
72
112
993
1107
1107
1278
133
6914
8014
8037
337
3IX
.07
1911
739
553
153
191
713
929
713
5313
5382
282
2X
.07
140
150
223
513
513
613
190
533
1336
1336
823
823
XI.0
761
314
354
810
810
241
191
1152
1584
1584
774
774
XII.0
735
712
712
496
496
321
219
1027
1567
1567
1071
1071
2007
2321
1630
5087
9038
9038
8346
2084
5268
1569
815
698
6660
6660
I.08
241
154
5344
844
836
919
810
1015
7715
7711
2911
29II.
0812
514
871
344
344
589
178
793
1560
1560
1216
1216
III.0
820
715
95
371
371
385
190
1545
2120
2120
1749
1749
IV.0
872
155
6228
928
955
411
112
1018
7518
7515
8615
86V
.08
2618
823
544
944
910
300
564
1594
1594
1145
1145
VI.0
86
174
540
720
720
1187
027
314
6014
6074
074
0VI
I.08
8417
748
574
674
671
128
286
1025
1025
279
279
VIII
.08
3210
589
810
3510
3511
5819
013
914
8714
8745
245
2IX
.08
9 199
247
437
437
659
184
396
1239
1239
802
802
X.0
846
780
9664
364
316
219
381
911
7411
7453
153
1XI
.08
287
5299
438
438
278
181
611
1070
1070
632
632
XII.0
839
826
217
641
641
204
176
475
855
855
214
214
2008
2036
1517
3008
6561
6561
7286
1629
8121
1703
617
036
1047
510
475
1
Thes
e ph
ysic
al e
nerg
y flo
ws
wer
e m
easu
red
on th
e cr
oss-
front
ier t
rans
mis
sion
lines
(≥11
0 kV
). Th
ese
valu
es m
ay d
iffer
from
the
offic
ial s
tatis
tics
and
the
tota
l phy
sica
l bal
ance
in th
e ta
ble
"Mon
thly
val
ues:
Ope
ratio
n".
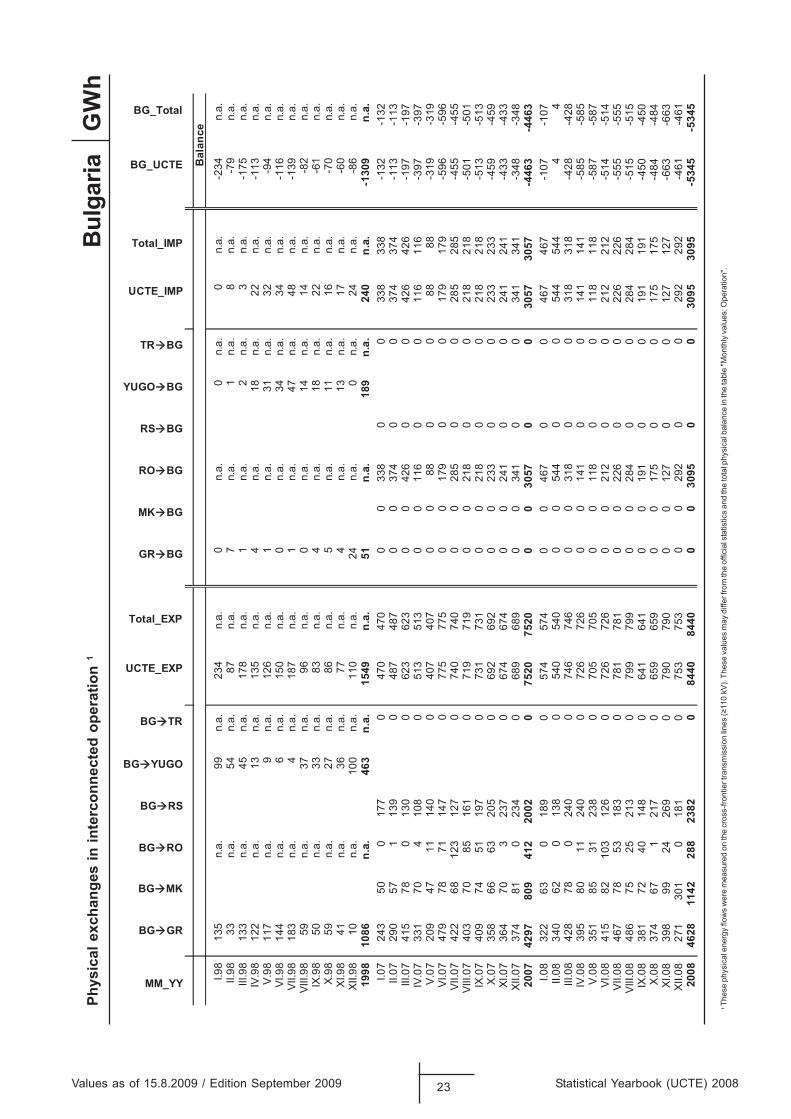
Values as of 15.8.2009 / Edition September 2009 23 Statistical Yearbook (UCTE) 2008
GW
hPh
ysic
al e
xcha
nges
in in
terc
onne
cted
ope
ratio
n 1
Bul
garia
MM_YY
BG GR
BG MK
BG RO
BG RS
BG YUGO
BG TR
UCTE_EXP
Total_EXP
GR BG
MK BG
RO BG
RS BG
YUGO BG
TR BG
UCTE_IMP
Total_IMP
BG_UCTE
BG_Total
Bal
ance
I.98
135
n.a.
99n.
a.23
4n.
a.0
n.a.
0n.
a.0
n.a.
-234
n.a.
II.98
33n.
a.54
n.a.
87n.
a.7
n.a.
1n.
a.8
n.a.
-79
n.a.
III.9
813
3n.
a.45
n.a.
178
n.a.
1n.
a.2
n.a.
3n.
a.-1
75n.
a.IV
.98
122
n.a.
13n.
a.13
5n.
a.4
n.a.
18n.
a.22
n.a.
-113
n.a.
V.98
117
n.a.
9n.
a.12
6n.
a.1
n.a.
31n.
a.32
n.a.
-94
n.a.
VI.9
814
4n.
a.6
n.a.
150
n.a.
0n.
a.34
n.a.
34n.
a.-1
16n.
a.VI
I.98
183
n.a.
4n.
a.18
7n.
a.1
n.a.
47n.
a.48
n.a.
-139
n.a.
VIII.
9859
n.a.
37n.
a.96
n.a.
0n.
a.14
n.a.
14n.
a.-8
2n.
a.IX
.98
50n.
a.33
n.a.
83n.
a.4
n.a.
18n.
a.22
n.a.
-61
n.a.
X.98
59n.
a.27
n.a.
86n.
a.5
n.a.
11n.
a.16
n.a.
-70
n.a.
XI.9
841
n.a.
36n.
a.77
n.a.
4n.
a.13
n.a.
17n.
a.-6
0n.
a.XI
I.98
10n.
a.10
0n.
a.11
0n.
a.24
n.a.
0n.
a.24
n.a.
-86
n.a.
1998
1086
n.a.
463
n.a.
1549
n.a.
51n.
a.18
9n.
a.24
0n.
a.-1
309
n.a.
I.07
243
500
177
047
047
00
033
80
033
833
8-1
32-1
32II.
0729
057
113
90
487
487
00
374
00
374
374
-113
-113
III.0
741
578
013
00
623
623
00
426
00
426
426
-197
-197
IV.0
733
170
410
80
513
513
00
116
00
116
116
-397
-397
V.07
209
4711
140
040
740
70
088
00
8888
-319
-319
VI.0
747
978
7114
70
775
775
00
179
00
179
179
-596
-596
VII.0
742
268
123
127
074
074
00
028
50
028
528
5-4
55-4
55VI
II.07
403
7085
161
071
971
90
021
80
021
821
8-5
01-5
01IX
.07
409
7451
197
073
173
10
021
80
021
821
8-5
13-5
13X.
0735
866
6320
50
692
692
00
233
00
233
233
-459
-459
XI.0
736
470
323
70
674
674
00
241
00
241
241
-433
-433
XII.0
737
481
023
40
689
689
00
341
00
341
341
-348
-348
2007
4297
809
412
2002
075
2075
200
030
570
030
5730
57-4
463
-446
3I.0
832
263
018
90
574
574
00
467
00
467
467
-107
-107
II.08
340
620
138
054
054
00
054
40
054
454
44
4III
.08
428
780
240
074
674
60
031
80
031
831
8-4
28-4
28IV
.08
395
8011
240
072
672
60
014
10
014
114
1-5
85-5
85V.
0835
185
3123
80
705
705
00
118
00
118
118
-587
-587
VI.0
841
582
103
126
072
672
60
021
20
021
221
2-5
14-5
14VI
I.08
467
7853
183
078
178
10
022
60
022
622
6-5
55-5
55VI
II.08
486
7525
213
079
979
90
028
40
028
428
4-5
15-5
15IX
.08
381
7240
148
064
164
10
019
10
019
119
1-4
50-4
50X.
0837
467
121
70
659
659
00
175
00
175
175
-484
-484
XI.0
839
899
2426
90
790
790
00
127
00
127
127
-663
-663
XII.0
827
130
10
181
075
375
30
029
20
029
229
2-4
61-4
6120
0846
2811
4228
823
820
8440
8440
00
3095
00
3095
3095
-534
5-5
345
1 Before 2005, the information on renewable and not identifiable energy sources was collected in a different manner. Some countries added them to thermal conventional, some considered them as the part of not represented in the figures ( through the factor "representativity" ).
Monthly values / Operation
Statistical Yearbook (UCTE) 2008 24 Values as of 15.8.2009 / Edition September 2009
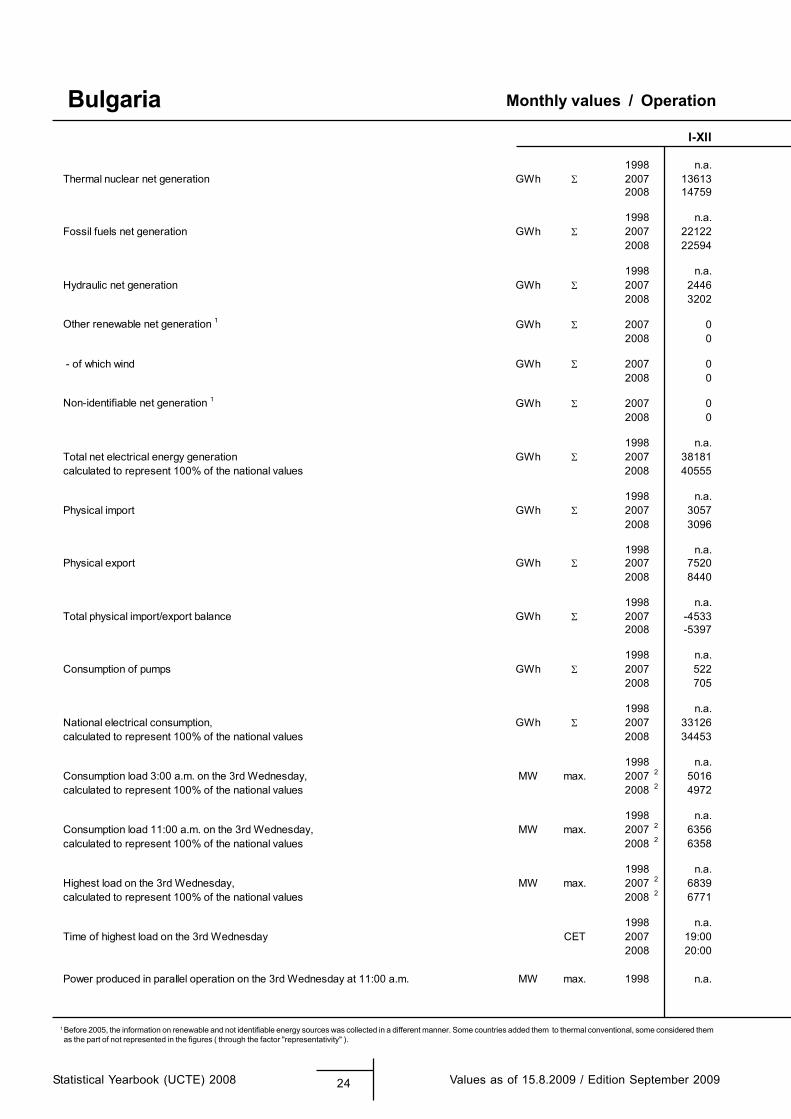
BulgariaI-XII
1998 n.a.Thermal nuclear net generation GWh 2007 13613
2008 14759
1998 n.a.Fossil fuels net generation GWh 2007 22122
2008 22594
1998 n.a.Hydraulic net generation GWh 2007 2446
2008 3202
Other renewable net generation 1 GWh 2007 02008 0
- of which wind GWh 2007 02008 0
Non-identifiable net generation 1 GWh 2007 02008 0
1998 n.a.Total net electrical energy generation GWh 2007 38181calculated to represent 100% of the national values 2008 40555
1998 n.a.Physical import GWh 2007 3057
2008 3096
1998 n.a.Physical export GWh 2007 7520
2008 8440
1998 n.a.Total physical import/export balance GWh 2007 -4533
2008 -5397
1998 n.a.Consumption of pumps GWh 2007 522
2008 705
1998 n.a.National electrical consumption, GWh 2007 33126calculated to represent 100% of the national values 2008 34453
1998 n.a.Consumption load 3:00 a.m. on the 3rd Wednesday, MW max. 2007 2 5016calculated to represent 100% of the national values 2008 2 4972
1998 n.a.Consumption load 11:00 a.m. on the 3rd Wednesday, MW max. 2007 2 6356calculated to represent 100% of the national values 2008 2 6358
1998 n.a.Highest load on the 3rd Wednesday, MW max. 2007 2 6839calculated to represent 100% of the national values 2008 2 6771
1998 n.a.Time of highest load on the 3rd Wednesday CET 2007 19:00
2008 20:00
Power produced in parallel operation on the 3rd Wednesday at 11:00 a.m. MW max. 1998 n.a.
Monthly values / Operation
Values as of 15.8.2009 / Edition September 2009 25 Statistical Yearbook (UCTE) 2008
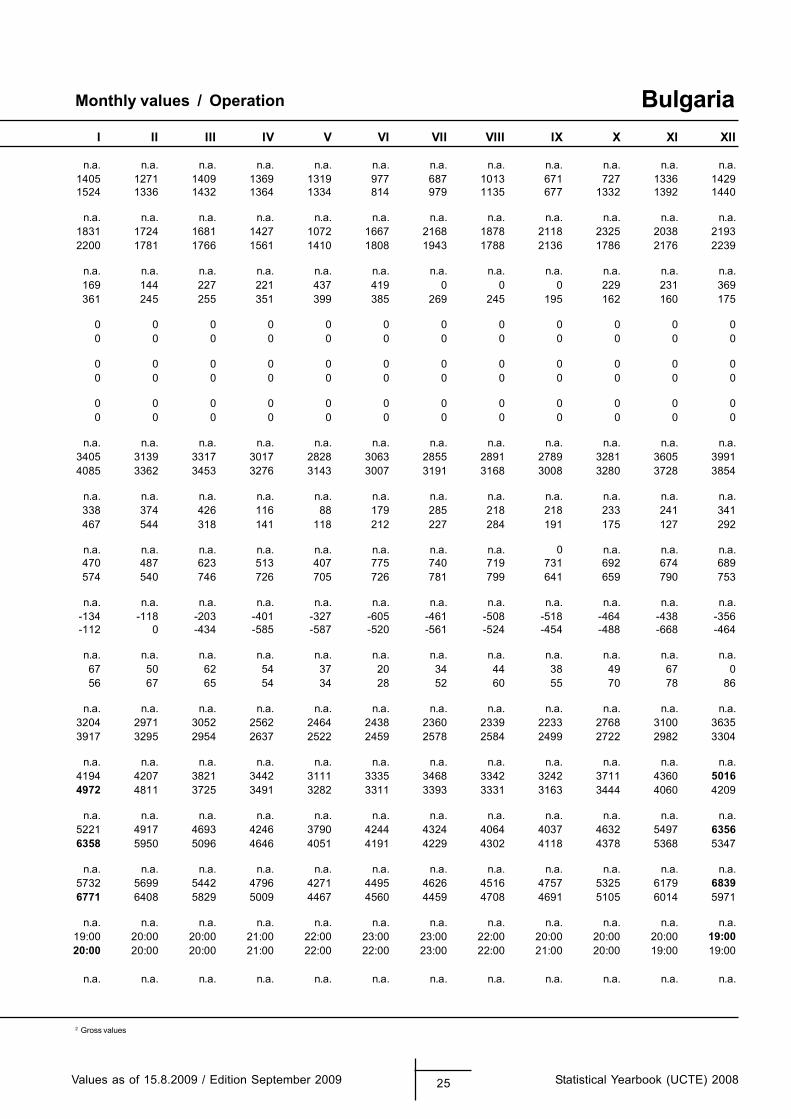
Bulgaria
2 Gross values
I II III IV V VI VII VIII IX X XI XII
n.a. n.a. n.a. n.a. n.a. n.a. n.a. n.a. n.a. n.a. n.a. n.a.1405 1271 1409 1369 1319 977 687 1013 671 727 1336 14291524 1336 1432 1364 1334 814 979 1135 677 1332 1392 1440
n.a. n.a. n.a. n.a. n.a. n.a. n.a. n.a. n.a. n.a. n.a. n.a.1831 1724 1681 1427 1072 1667 2168 1878 2118 2325 2038 21932200 1781 1766 1561 1410 1808 1943 1788 2136 1786 2176 2239
n.a. n.a. n.a. n.a. n.a. n.a. n.a. n.a. n.a. n.a. n.a. n.a.169 144 227 221 437 419 0 0 0 229 231 369361 245 255 351 399 385 269 245 195 162 160 175
0 0 0 0 0 0 0 0 0 0 0 00 0 0 0 0 0 0 0 0 0 0 0
0 0 0 0 0 0 0 0 0 0 0 00 0 0 0 0 0 0 0 0 0 0 0
0 0 0 0 0 0 0 0 0 0 0 00 0 0 0 0 0 0 0 0 0 0 0
n.a. n.a. n.a. n.a. n.a. n.a. n.a. n.a. n.a. n.a. n.a. n.a.3405 3139 3317 3017 2828 3063 2855 2891 2789 3281 3605 39914085 3362 3453 3276 3143 3007 3191 3168 3008 3280 3728 3854
n.a. n.a. n.a. n.a. n.a. n.a. n.a. n.a. n.a. n.a. n.a. n.a.338 374 426 116 88 179 285 218 218 233 241 341467 544 318 141 118 212 227 284 191 175 127 292
n.a. n.a. n.a. n.a. n.a. n.a. n.a. n.a. 0 n.a. n.a. n.a.470 487 623 513 407 775 740 719 731 692 674 689574 540 746 726 705 726 781 799 641 659 790 753
n.a. n.a. n.a. n.a. n.a. n.a. n.a. n.a. n.a. n.a. n.a. n.a.-134 -118 -203 -401 -327 -605 -461 -508 -518 -464 -438 -356-112 0 -434 -585 -587 -520 -561 -524 -454 -488 -668 -464
n.a. n.a. n.a. n.a. n.a. n.a. n.a. n.a. n.a. n.a. n.a. n.a.67 50 62 54 37 20 34 44 38 49 67 056 67 65 54 34 28 52 60 55 70 78 86
n.a. n.a. n.a. n.a. n.a. n.a. n.a. n.a. n.a. n.a. n.a. n.a.3204 2971 3052 2562 2464 2438 2360 2339 2233 2768 3100 36353917 3295 2954 2637 2522 2459 2578 2584 2499 2722 2982 3304
n.a. n.a. n.a. n.a. n.a. n.a. n.a. n.a. n.a. n.a. n.a. n.a.4194 4207 3821 3442 3111 3335 3468 3342 3242 3711 4360 50164972 4811 3725 3491 3282 3311 3393 3331 3163 3444 4060 4209
n.a. n.a. n.a. n.a. n.a. n.a. n.a. n.a. n.a. n.a. n.a. n.a.5221 4917 4693 4246 3790 4244 4324 4064 4037 4632 5497 63566358 5950 5096 4646 4051 4191 4229 4302 4118 4378 5368 5347
n.a. n.a. n.a. n.a. n.a. n.a. n.a. n.a. n.a. n.a. n.a. n.a.5732 5699 5442 4796 4271 4495 4626 4516 4757 5325 6179 68396771 6408 5829 5009 4467 4560 4459 4708 4691 5105 6014 5971
n.a. n.a. n.a. n.a. n.a. n.a. n.a. n.a. n.a. n.a. n.a. n.a.19:00 20:00 20:00 21:00 22:00 23:00 23:00 22:00 20:00 20:00 20:00 19:0020:00 20:00 20:00 21:00 22:00 22:00 23:00 22:00 21:00 20:00 19:00 19:00
n.a. n.a. n.a. n.a. n.a. n.a. n.a. n.a. n.a. n.a. n.a. n.a.
1 Before 2005, the information on renewable and not identifiable energy sources was collected in a different manner. Some countries added them to thermal conventional, some considered them as the part of not represented in the figures ( through the factor "representativity" ).
Monthly values / Operation
Statistical Yearbook (UCTE) 2008 26 Values as of 15.8.2009 / Edition September 2009
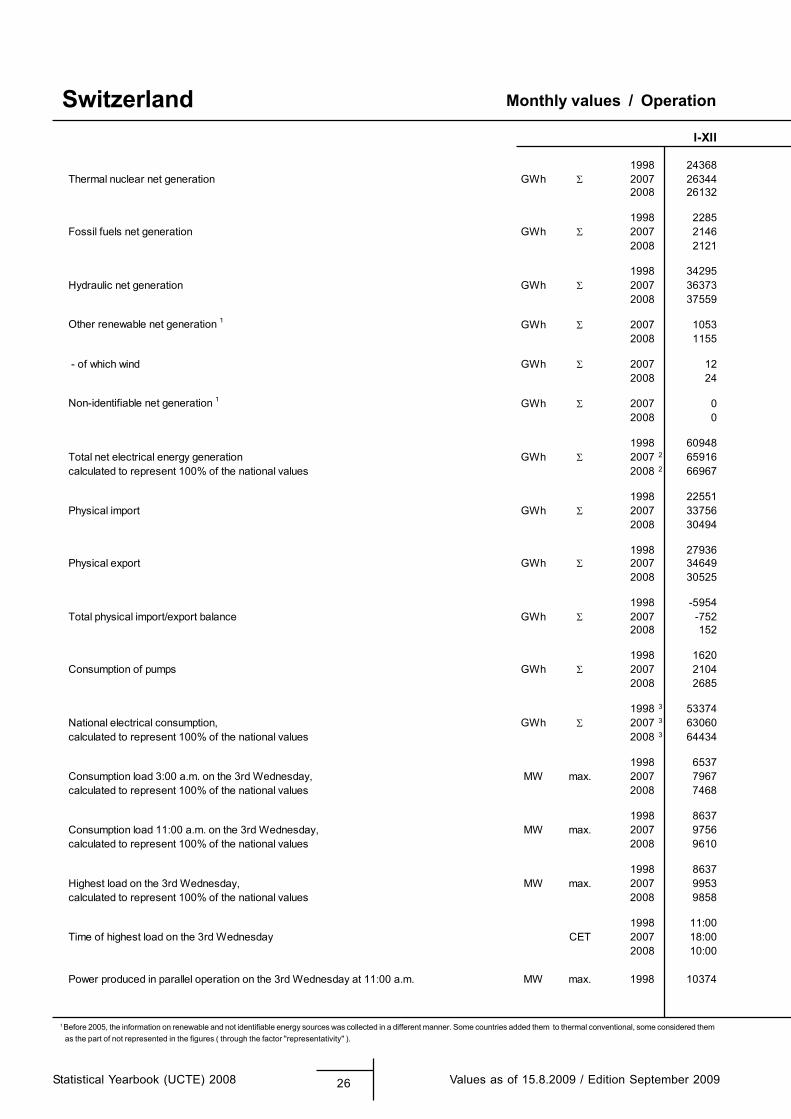
SwitzerlandI-XII
1998 24368Thermal nuclear net generation GWh 2007 26344
2008 26132
1998 2285Fossil fuels net generation GWh 2007 2146
2008 2121
1998 34295Hydraulic net generation GWh 2007 36373
2008 37559
Other renewable net generation 1 GWh 2007 10532008 1155
- of which wind GWh 2007 122008 24
Non-identifiable net generation 1 GWh 2007 02008 0
1998 60948Total net electrical energy generation GWh 2007 2 65916calculated to represent 100% of the national values 2008 2 66967
1998 22551Physical import GWh 2007 33756
2008 30494
1998 27936Physical export GWh 2007 34649
2008 30525
1998 -5954Total physical import/export balance GWh 2007 -752
2008 152
1998 1620Consumption of pumps GWh 2007 2104
2008 2685
1998 3 53374National electrical consumption, GWh 2007 3 63060calculated to represent 100% of the national values 2008 3 64434
1998 6537Consumption load 3:00 a.m. on the 3rd Wednesday, MW max. 2007 7967calculated to represent 100% of the national values 2008 7468
1998 8637Consumption load 11:00 a.m. on the 3rd Wednesday, MW max. 2007 9756calculated to represent 100% of the national values 2008 9610
1998 8637Highest load on the 3rd Wednesday, MW max. 2007 9953calculated to represent 100% of the national values 2008 9858
1998 11:00Time of highest load on the 3rd Wednesday CET 2007 18:00
2008 10:00
Power produced in parallel operation on the 3rd Wednesday at 11:00 a.m. MW max. 1998 10374
2 including deliveries from industry
Monthly values / Operation
Values as of 15.8.2009 / Edition September 2009 27 Statistical Yearbook (UCTE) 2008
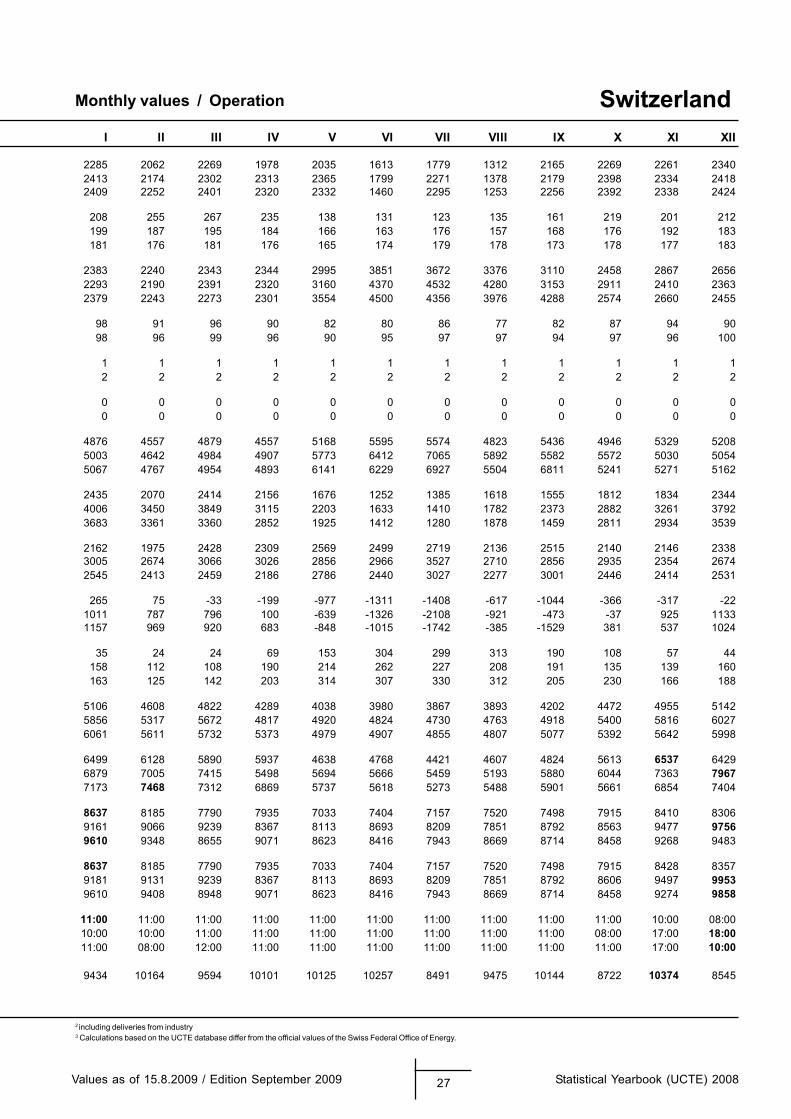
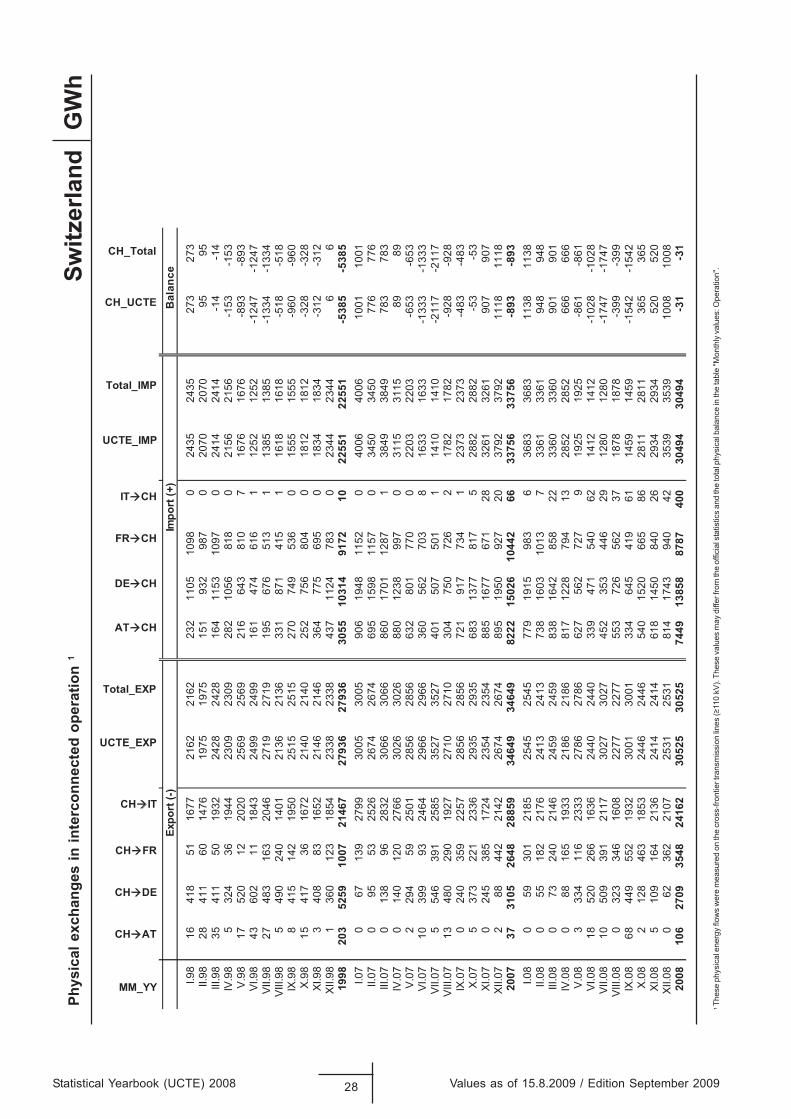
Switzerland
3 Calculations based on the UCTE database differ from the official values of the Swiss Federal Office of Energy.
I II III IV V VI VII VIII IX X XI XII
2285 2062 2269 1978 2035 1613 1779 1312 2165 2269 2261 23402413 2174 2302 2313 2365 1799 2271 1378 2179 2398 2334 24182409 2252 2401 2320 2332 1460 2295 1253 2256 2392 2338 2424
208 255 267 235 138 131 123 135 161 219 201 212199 187 195 184 166 163 176 157 168 176 192 183181 176 181 176 165 174 179 178 173 178 177 183
2383 2240 2343 2344 2995 3851 3672 3376 3110 2458 2867 26562293 2190 2391 2320 3160 4370 4532 4280 3153 2911 2410 23632379 2243 2273 2301 3554 4500 4356 3976 4288 2574 2660 2455
98 91 96 90 82 80 86 77 82 87 94 9098 96 99 96 90 95 97 97 94 97 96 100
1 1 1 1 1 1 1 1 1 1 1 12 2 2 2 2 2 2 2 2 2 2 2
0 0 0 0 0 0 0 0 0 0 0 00 0 0 0 0 0 0 0 0 0 0 0
4876 4557 4879 4557 5168 5595 5574 4823 5436 4946 5329 52085003 4642 4984 4907 5773 6412 7065 5892 5582 5572 5030 50545067 4767 4954 4893 6141 6229 6927 5504 6811 5241 5271 5162
2435 2070 2414 2156 1676 1252 1385 1618 1555 1812 1834 23444006 3450 3849 3115 2203 1633 1410 1782 2373 2882 3261 37923683 3361 3360 2852 1925 1412 1280 1878 1459 2811 2934 3539
2162 1975 2428 2309 2569 2499 2719 2136 2515 2140 2146 23383005 2674 3066 3026 2856 2966 3527 2710 2856 2935 2354 26742545 2413 2459 2186 2786 2440 3027 2277 3001 2446 2414 2531
265 75 -33 -199 -977 -1311 -1408 -617 -1044 -366 -317 -221011 787 796 100 -639 -1326 -2108 -921 -473 -37 925 11331157 969 920 683 -848 -1015 -1742 -385 -1529 381 537 1024
35 24 24 69 153 304 299 313 190 108 57 44158 112 108 190 214 262 227 208 191 135 139 160163 125 142 203 314 307 330 312 205 230 166 188
5106 4608 4822 4289 4038 3980 3867 3893 4202 4472 4955 51425856 5317 5672 4817 4920 4824 4730 4763 4918 5400 5816 60276061 5611 5732 5373 4979 4907 4855 4807 5077 5392 5642 5998
6499 6128 5890 5937 4638 4768 4421 4607 4824 5613 6537 64296879 7005 7415 5498 5694 5666 5459 5193 5880 6044 7363 79677173 7468 7312 6869 5737 5618 5273 5488 5901 5661 6854 7404
8637 8185 7790 7935 7033 7404 7157 7520 7498 7915 8410 83069161 9066 9239 8367 8113 8693 8209 7851 8792 8563 9477 97569610 9348 8655 9071 8623 8416 7943 8669 8714 8458 9268 9483
8637 8185 7790 7935 7033 7404 7157 7520 7498 7915 8428 83579181 9131 9239 8367 8113 8693 8209 7851 8792 8606 9497 99539610 9408 8948 9071 8623 8416 7943 8669 8714 8458 9274 9858
11:00 11:00 11:00 11:00 11:00 11:00 11:00 11:00 11:00 11:00 10:00 08:0010:00 10:00 11:00 11:00 11:00 11:00 11:00 11:00 11:00 08:00 17:00 18:0011:00 08:00 12:00 11:00 11:00 11:00 11:00 11:00 11:00 11:00 17:00 10:00
9434 10164 9594 10101 10125 10257 8491 9475 10144 8722 10374 8545
Statistical Yearbook (UCTE) 2008 28 Values as of 15.8.2009 / Edition September 2009
GW
hPh
ysic
al e
xcha
nges
in in
terc
onne
cted
ope
ratio
n 1
1
Thes
e ph
ysic
al e
nerg
y flo
ws
wer
e m
easu
red
on th
e cr
oss-
front
ier t
rans
mis
sion
lines
(≥11
0 kV
). Th
ese
valu
es m
ay d
iffer
from
the
offic
ial s
tatis
tics
and
the
tota
l phy
sica
l bal
ance
in th
e ta
ble
"Mon
thly
val
ues:
Ope
ratio
n".Sw
itzer
land
MM_YY
CH AT
CH DE
CH FR
CH IT
UCTE_EXP
Total_EXP
AT CH
DE CH
FR CH
IT CH
UCTE_IMP
Total_IMP
CH_UCTE
CH_Total
ecnalaB
)+( tropmI
)-( tropxE
I.98
1641
851
1677
2162
2162
232
1105
1098
024
3524
3527
327
3II.
9828
411
6014
7619
7519
7515
193
298
70
2070
2070
9595
III.9
835
411
5019
3224
2824
2816
411
5310
970
2414
2414
-14
-14
IV.9
85
324
3619
4423
0923
0928
210
5681
80
2156
2156
-153
-153
V.9
817
520
1220
2025
6925
6921
664
381
07
1676
1676
-893
-893
VI.9
843
602
1118
4324
9924
9916
147
461
61
1252
1252
-124
7-1
247
VII.9
827
483
163
2046
2719
2719
195
676
513
113
8513
85-1
334
-133
4V
III.9
85
490
240
1401
2136
2136
331
871
415
116
1816
18-5
18-5
18IX
.98
841
514
219
5025
1525
1527
074
953
60
1555
1555
-960
-960
X.9
815
417
3616
7221
4021
4025
275
680
40
1812
1812
-328
-328
XI.9
83
408
8316
5221
4621
4636
477
569
50
1834
1834
-312
-312
XII.9
81
360
123
1854
2338
2338
437
1124
783
023
4423
446
619
9820
352
5910
0721
467
2793
627
936
3055
1031
491
7210
2255
122
551
-538
5-5
385
I.07
067
139
2799
3005
3005
906
1948
1152
040
0640
0610
0110
01II.
070
9553
2526
2674
2674
695
1598
1157
034
5034
5077
677
6III
.07
013
896
2832
3066
3066
860
1701
1287
138
4938
4978
378
3IV
.07
014
012
027
6630
2630
2688
012
3899
70
3115
3115
8989
V.0
72
294
5925
0128
5628
5663
280
177
00
2203
2203
-653
-653
VI.0
710
399
9324
6429
6629
6636
056
270
38
1633
1633
-133
3-1
333
VII.0
75
546
391
2585
3527
3527
401
507
501
114
1014
1 0-2
117
-211
7V
III.0
713
480
290
1927
2710
2710
304
750
726
217
8217
82-9
28-9
28IX
.07
024
035
922
5728
5628
5672
191
773
41
2373
2373
-483
-483
X.0
75
373
221
2336
2935
2935
683
1377
817
528
8228
82-5
3-5
3XI
.07
024
538
517
2423
5423
5488
516
7767
128
3261
3261
907
907
XII.0
72
8844
221
4226
7426
7489
519
5092
720
3792
3792
1118
1118
2007
3731
0526
4828
859
3464
934
649
8222
1502
610
442
6633
756
3375
6-8
93-8
93I.0
80
5930
121
8525
4525
4577
919
1598
36
3683
3683
1138
1138
II.08
055
182
2176
2413
2413
738
1603
1013
733
6133
6194
894
8III
.08
073
240
2146
2459
2459
838
1642
858
2233
6033
6090
190
1IV
.08
088
165
1933
2186
2186
817
1228
794
1328
5228
5266
666
6V
.08
333
411
623
3327
8627
8662
756
272
79
1925
1925
-861
-861
VI.0
818
520
266
1636
2440
2440
339
471
540
6214
1214
12-1
028
-102
8VI
I.08
1050
939
121
1730
2730
2745
235
344
629
1280
1280
-174
7-1
747
VIII
.08
032
334
616
0822
7722
7755
372
656
237
1878
1878
-399
-399
IX.0
868
449
552
1932
3001
3001
334
645
419
6114
5914
59-1
542
-154
2X
.08
212
846
318
5324
4624
4654
015
2066
586
2811
2811
365
365
XI.0
85
109
164
2136
2414
2414
618
1450
840
2629
3429
3452
052
0XI
I.08
062
362
2107
2531
2531
814
1743
940
4235
3935
3910
0810
0820
0810
627
0935
4824
162
3052
530
525
7449
1385
887
8740
030
494
3049
4-3
1-3
1
1
Thes
e ph
ysic
al e
nerg
y flo
ws
wer
e m
easu
red
on th
e cr
oss-
front
ier t
rans
mis
sion
lines
(≥11
0 kV
). Th
ese
valu
es m
ay d
iffer
from
the
offic
ial s
tatis
tics
and
the
tota
l phy
sica
l bal
ance
in th
e ta
ble
"Mon
thly
val
ues:
Ope
ratio
n".
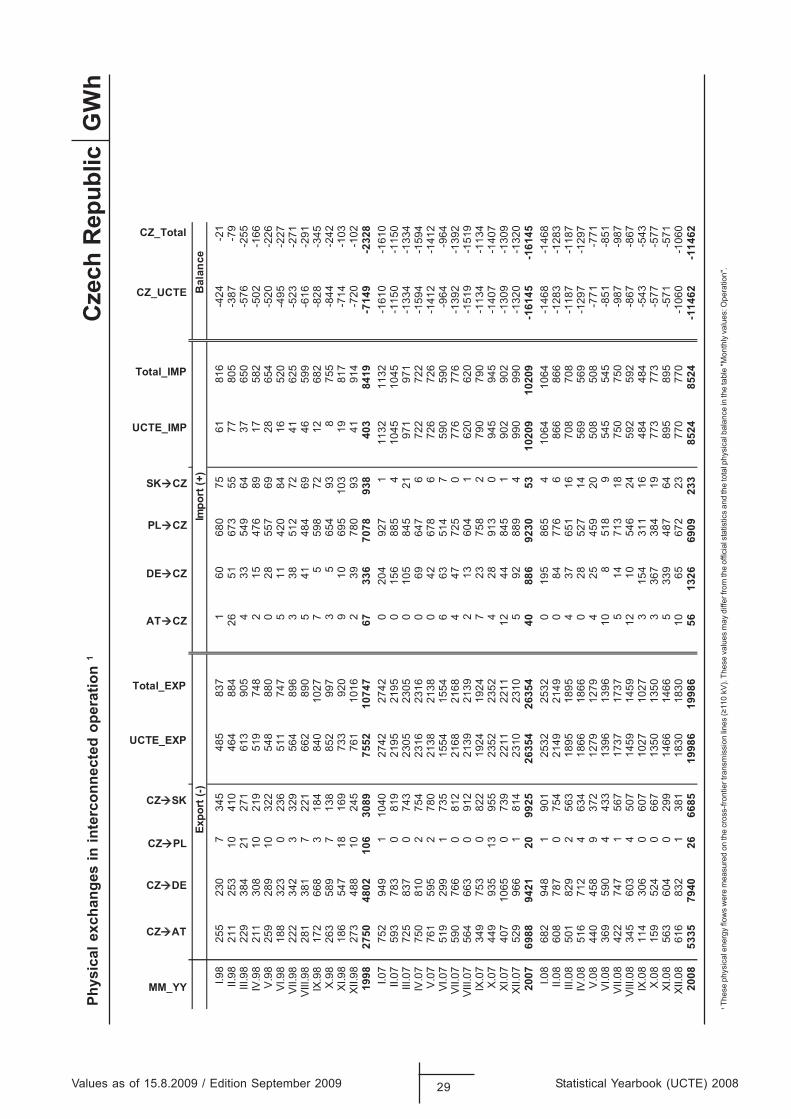
Values as of 15.8.2009 / Edition September 2009 29 Statistical Yearbook (UCTE) 2008
GW
hPh
ysic
al e
xcha
nges
in in
terc
onne
cted
ope
ratio
n 1
Cze
ch R
epub
lic
MM_YY
CZ AT
CZ DE
CZ PL
CZ SK
UCTE_EXP
Total_EXP
AT CZ
DE CZ
PL CZ
SK CZ
UCTE_IMP
Total_IMP
CZ_UCTE
CZ_Total
ecnalaB
)+( tropmI
)-( tropxE
I.98
255
230
734
548
583
71
6068
075
6181
6-4
24-2
1II.
9821
125
310
410
464
884
2651
673
5577
805
-387
-79
III.9
822
938
421
271
613
905
433
549
6437
650
-576
-255
IV.9
821
130
810
219
519
748
215
476
8917
582
-502
-166
V.9
825
928
910
322
548
880
028
557
6928
654
-520
-226
VI.9
818
832
30
236
511
747
511
420
8416
520
-495
-227
VII.9
822
234
23
329
564
896
338
512
7241
625
-523
-271
VIII
.98
281
381
722
166
289
05
4148
469
4659
9-6
16-2
91IX
.98
172
668
318
484
010
277
559
872
1268
2-8
28-3
45X
.98
263
589
713
885
299
73
565
493
875
5-8
44-2
42XI
.98
186
547
1816
973
392
09
1069
510
319
817
-714
-103
XII.9
827
348
810
245
761
1016
239
780
9341
914
-720
-102
1998
2750
4802
106
3089
7552
1074
767
336
7078
938
403
8419
-714
9-2
328
I.07
752
949
110
4027
4227
420
204
927
111
3211
32-1
610
-161
0II.
0759
378
30
819
2195
2195
015
688
54
1045
1045
-115
0-1
150
III.0
772
583
70
743
2305
2305
010
584
521
971
971
-133
4-1
334
IV.0
775
081
02
754
2316
2316
069
647
672
272
2-1
594
-159
4V
.07
761
595
278
021
3821
380
4267
86
726
726
-141
2-1
412
VI.0
751
929
91
735
1554
1554
663
514
759
059
0-9
64-9
64VI
I.07
590
766
081
221
6821
684
4772
50
776
776
-139
2-1
392
VIII
.07
564
663
091
221
3 921
392
1360
41
620
620
-151
9-1
519
IX.0
734
975
30
822
1924
1924
723
758
279
079
0-1
134
-113
4X
.07
449
935
1395
523
5223
524
2891
30
945
945
-140
7-1
407
XI.0
740
710
650
739
2211
2211
1244
845
190
290
2-1
309
-130
9XI
I.07
529
966
181
423
1023
105
9288
94
990
990
-132
0-1
320
2007
6988
9421
2099
2526
354
2635
440
886
9230
5310
209
1020
9-1
6145
-161
45I.0
868
294
81
901
2532
2532
019
586
54
1064
1064
-146
8-1
468
II.08
608
787
075
421
4921
490
8477
66
866
866
-128
3-1
283
III.0
850
182
92
563
1895
1895
437
651
1670
870
8-1
187
-118
7IV
.08
516
712
463
418
6618
660
2852
714
569
569
-129
7-1
297
V.0
844
045
89
372
1279
1279
425
459
2050
850
8-7
7 1-7
71VI
.08
369
590
443
313
9613
9610
851
89
545
545
-851
-851
VII.0
842
274
71
567
1737
1737
514
713
1875
075
0-9
87-9
87V
III.0
834
560
34
507
1459
1459
1210
546
2459
259
2-8
67-8
67IX
.08
114
306
060
710
2710
273
154
311
1648
448
4-5
43-5
43X
.08
159
524
066
713
5013
503
367
384
1977
377
3-5
77-5
77XI
.08
563
604
029
914
6614
665
339
487
6489
589
5-5
71-5
71XI
I.08
616
832
138
118
3018
3010
6567
223
770
770
-106
0-1
060
2008
5335
7940
2666
8519
986
1998
656
1326
6909
233
8524
8524
-114
62-1
1462
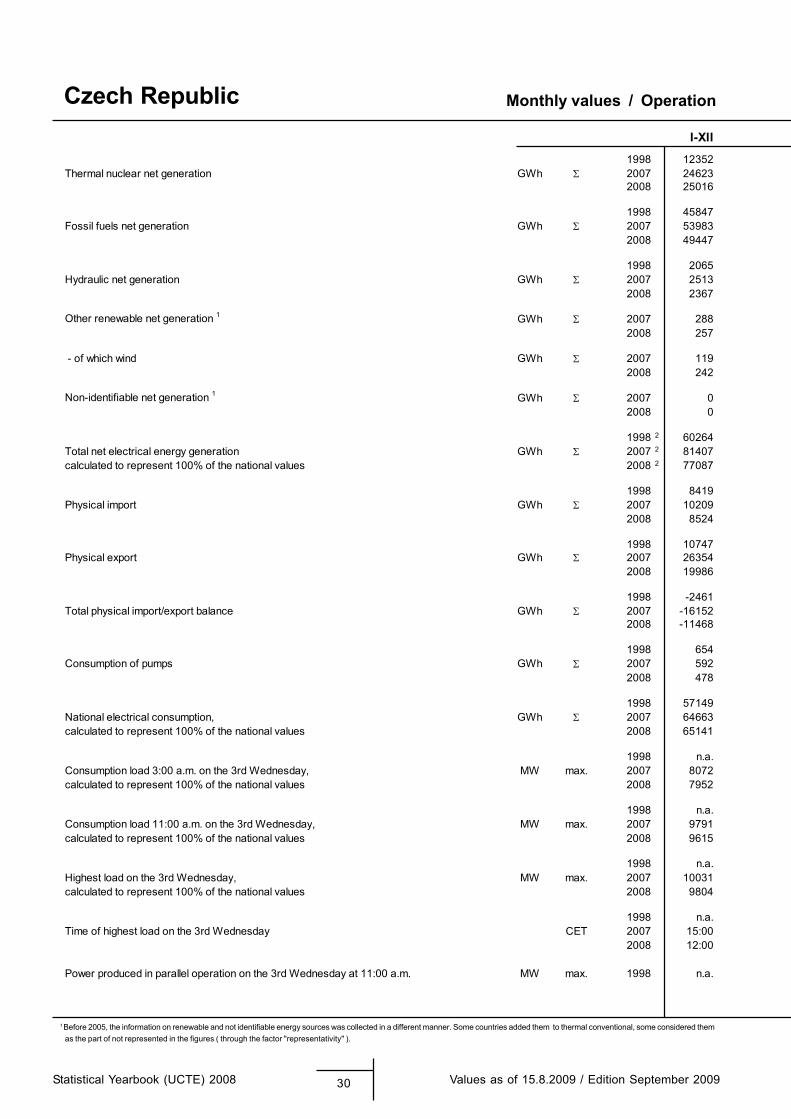
1 Before 2005, the information on renewable and not identifiable energy sources was collected in a different manner. Some countries added them to thermal conventional, some considered them as the part of not represented in the figures ( through the factor "representativity" ).
Monthly values / Operation
Statistical Yearbook (UCTE) 2008 30 Values as of 15.8.2009 / Edition September 2009
Czech RepublicI-XII
1998 12352Thermal nuclear net generation GWh 2007 24623
2008 25016
1998 45847Fossil fuels net generation GWh 2007 53983
2008 49447
1998 2065Hydraulic net generation GWh 2007 2513
2008 2367
Other renewable net generation 1 GWh 2007 2882008 257
- of which wind GWh 2007 1192008 242
Non-identifiable net generation 1 GWh 2007 02008 0
1998 2 60264Total net electrical energy generation GWh 2007 2 81407calculated to represent 100% of the national values 2008 2 77087
1998 8419Physical import GWh 2007 10209
2008 8524
1998 10747Physical export GWh 2007 26354
2008 19986
1998 -2461Total physical import/export balance GWh 2007 -16152
2008 -11468
1998 654Consumption of pumps GWh 2007 592
2008 478
1998 57149National electrical consumption, GWh 2007 64663calculated to represent 100% of the national values 2008 65141
1998 n.a.Consumption load 3:00 a.m. on the 3rd Wednesday, MW max. 2007 8072calculated to represent 100% of the national values 2008 7952
1998 n.a.Consumption load 11:00 a.m. on the 3rd Wednesday, MW max. 2007 9791calculated to represent 100% of the national values 2008 9615
1998 n.a.Highest load on the 3rd Wednesday, MW max. 2007 10031calculated to represent 100% of the national values 2008 9804
1998 n.a.Time of highest load on the 3rd Wednesday CET 2007 15:00
2008 12:00
Power produced in parallel operation on the 3rd Wednesday at 11:00 a.m. MW max. 1998 n.a.
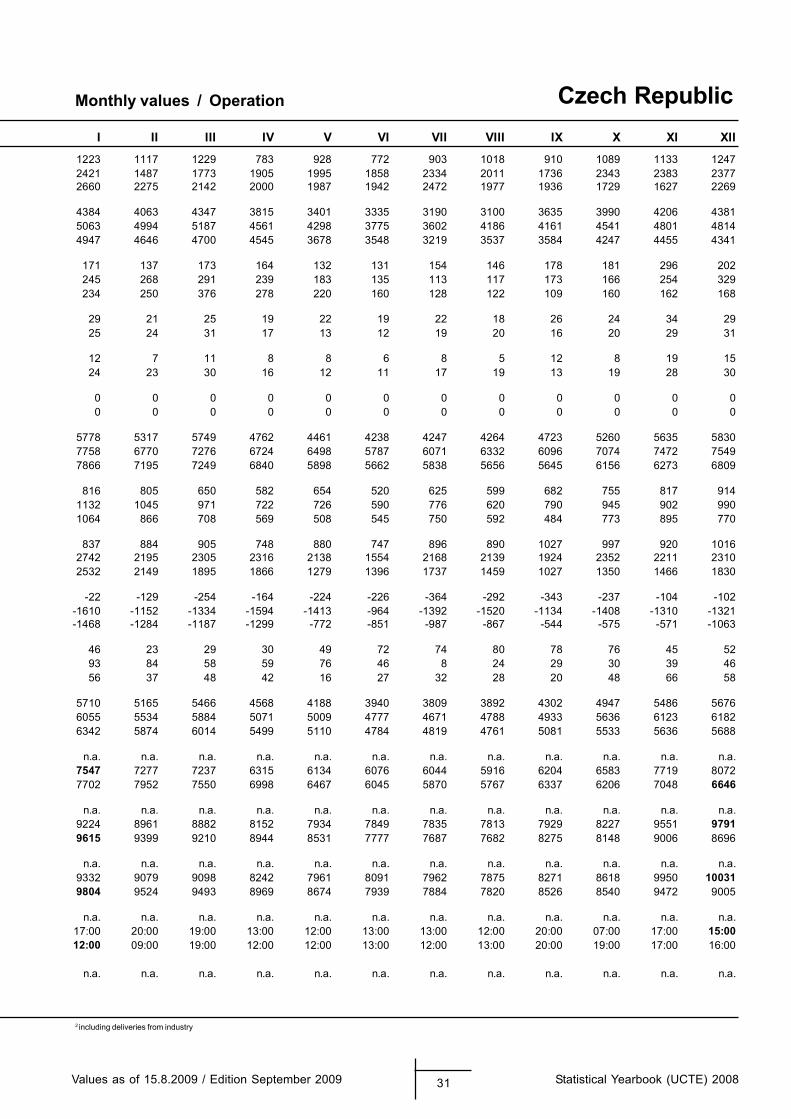
2 including deliveries from industry
Monthly values / Operation
Values as of 15.8.2009 / Edition September 2009 31 Statistical Yearbook (UCTE) 2008
Czech RepublicI II III IV V VI VII VIII IX X XI XII
1223 1117 1229 783 928 772 903 1018 910 1089 1133 12472421 1487 1773 1905 1995 1858 2334 2011 1736 2343 2383 23772660 2275 2142 2000 1987 1942 2472 1977 1936 1729 1627 2269
4384 4063 4347 3815 3401 3335 3190 3100 3635 3990 4206 43815063 4994 5187 4561 4298 3775 3602 4186 4161 4541 4801 48144947 4646 4700 4545 3678 3548 3219 3537 3584 4247 4455 4341
171 137 173 164 132 131 154 146 178 181 296 202245 268 291 239 183 135 113 117 173 166 254 329234 250 376 278 220 160 128 122 109 160 162 168
29 21 25 19 22 19 22 18 26 24 34 2925 24 31 17 13 12 19 20 16 20 29 31
12 7 11 8 8 6 8 5 12 8 19 1524 23 30 16 12 11 17 19 13 19 28 30
0 0 0 0 0 0 0 0 0 0 0 00 0 0 0 0 0 0 0 0 0 0 0
5778 5317 5749 4762 4461 4238 4247 4264 4723 5260 5635 58307758 6770 7276 6724 6498 5787 6071 6332 6096 7074 7472 75497866 7195 7249 6840 5898 5662 5838 5656 5645 6156 6273 6809
816 805 650 582 654 520 625 599 682 755 817 9141132 1045 971 722 726 590 776 620 790 945 902 9901064 866 708 569 508 545 750 592 484 773 895 770
837 884 905 748 880 747 896 890 1027 997 920 10162742 2195 2305 2316 2138 1554 2168 2139 1924 2352 2211 23102532 2149 1895 1866 1279 1396 1737 1459 1027 1350 1466 1830
-22 -129 -254 -164 -224 -226 -364 -292 -343 -237 -104 -102-1610 -1152 -1334 -1594 -1413 -964 -1392 -1520 -1134 -1408 -1310 -1321-1468 -1284 -1187 -1299 -772 -851 -987 -867 -544 -575 -571 -1063
46 23 29 30 49 72 74 80 78 76 45 5293 84 58 59 76 46 8 24 29 30 39 4656 37 48 42 16 27 32 28 20 48 66 58
5710 5165 5466 4568 4188 3940 3809 3892 4302 4947 5486 56766055 5534 5884 5071 5009 4777 4671 4788 4933 5636 6123 61826342 5874 6014 5499 5110 4784 4819 4761 5081 5533 5636 5688
n.a. n.a. n.a. n.a. n.a. n.a. n.a. n.a. n.a. n.a. n.a. n.a.7547 7277 7237 6315 6134 6076 6044 5916 6204 6583 7719 80727702 7952 7550 6998 6467 6045 5870 5767 6337 6206 7048 6646
n.a. n.a. n.a. n.a. n.a. n.a. n.a. n.a. n.a. n.a. n.a. n.a.9224 8961 8882 8152 7934 7849 7835 7813 7929 8227 9551 97919615 9399 9210 8944 8531 7777 7687 7682 8275 8148 9006 8696
n.a. n.a. n.a. n.a. n.a. n.a. n.a. n.a. n.a. n.a. n.a. n.a.9332 9079 9098 8242 7961 8091 7962 7875 8271 8618 9950 100319804 9524 9493 8969 8674 7939 7884 7820 8526 8540 9472 9005
n.a. n.a. n.a. n.a. n.a. n.a. n.a. n.a. n.a. n.a. n.a. n.a.17:00 20:00 19:00 13:00 12:00 13:00 13:00 12:00 20:00 07:00 17:00 15:0012:00 09:00 19:00 12:00 12:00 13:00 12:00 13:00 20:00 19:00 17:00 16:00
n.a. n.a. n.a. n.a. n.a. n.a. n.a. n.a. n.a. n.a. n.a. n.a.
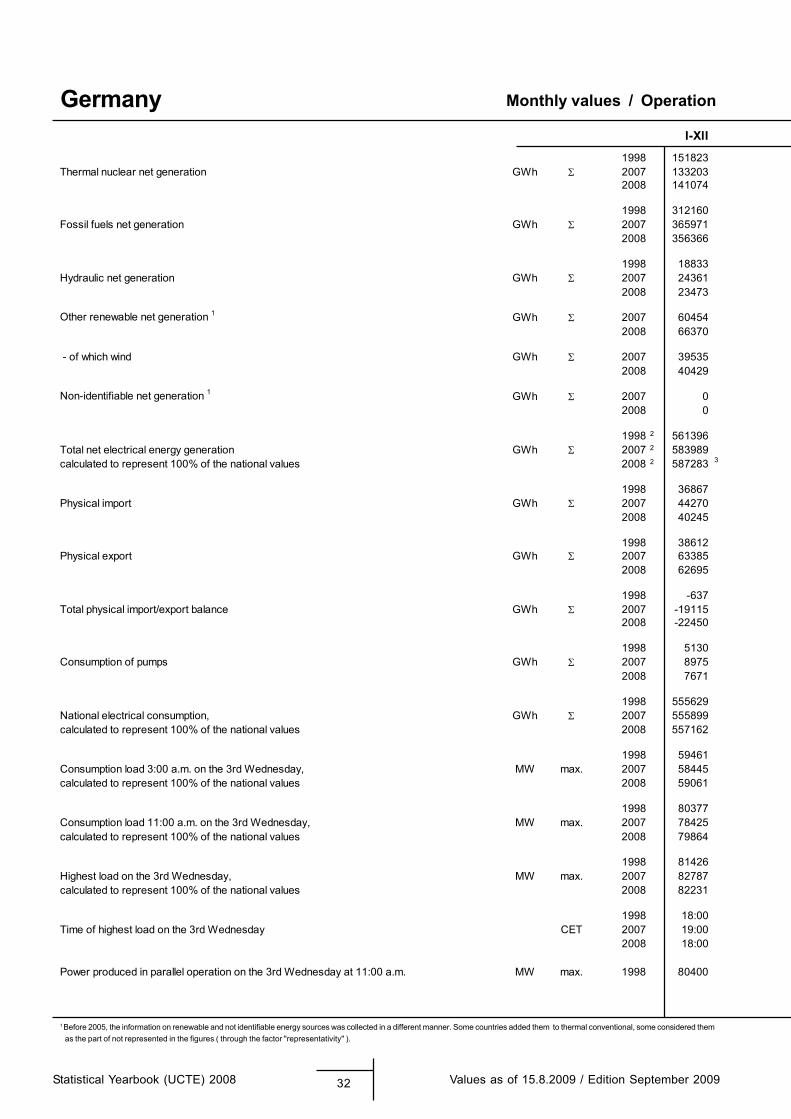
1 Before 2005, the information on renewable and not identifiable energy sources was collected in a different manner. Some countries added them to thermal conventional, some considered them as the part of not represented in the figures ( through the factor "representativity" ).
Monthly values / Operation
Statistical Yearbook (UCTE) 2008 32 Values as of 15.8.2009 / Edition September 2009
GermanyI-XII
1998 151823Thermal nuclear net generation GWh 2007 133203
2008 141074
1998 312160Fossil fuels net generation GWh 2007 365971
2008 356366
1998 18833Hydraulic net generation GWh 2007 24361
2008 23473
Other renewable net generation 1 GWh 2007 604542008 66370
- of which wind GWh 2007 395352008 40429
Non-identifiable net generation 1 GWh 2007 02008 0
1998 2 561396Total net electrical energy generation GWh 2007 2 583989calculated to represent 100% of the national values 2008 2 587283 3
1998 36867Physical import GWh 2007 44270
2008 40245
1998 38612Physical export GWh 2007 63385
2008 62695
1998 -637Total physical import/export balance GWh 2007 -19115
2008 -22450
1998 5130Consumption of pumps GWh 2007 8975
2008 7671
1998 555629National electrical consumption, GWh 2007 555899calculated to represent 100% of the national values 2008 557162
1998 59461Consumption load 3:00 a.m. on the 3rd Wednesday, MW max. 2007 58445calculated to represent 100% of the national values 2008 59061
1998 80377Consumption load 11:00 a.m. on the 3rd Wednesday, MW max. 2007 78425calculated to represent 100% of the national values 2008 79864
1998 81426Highest load on the 3rd Wednesday, MW max. 2007 82787calculated to represent 100% of the national values 2008 82231
1998 18:00Time of highest load on the 3rd Wednesday CET 2007 19:00
2008 18:00
Power produced in parallel operation on the 3rd Wednesday at 11:00 a.m. MW max. 1998 80400
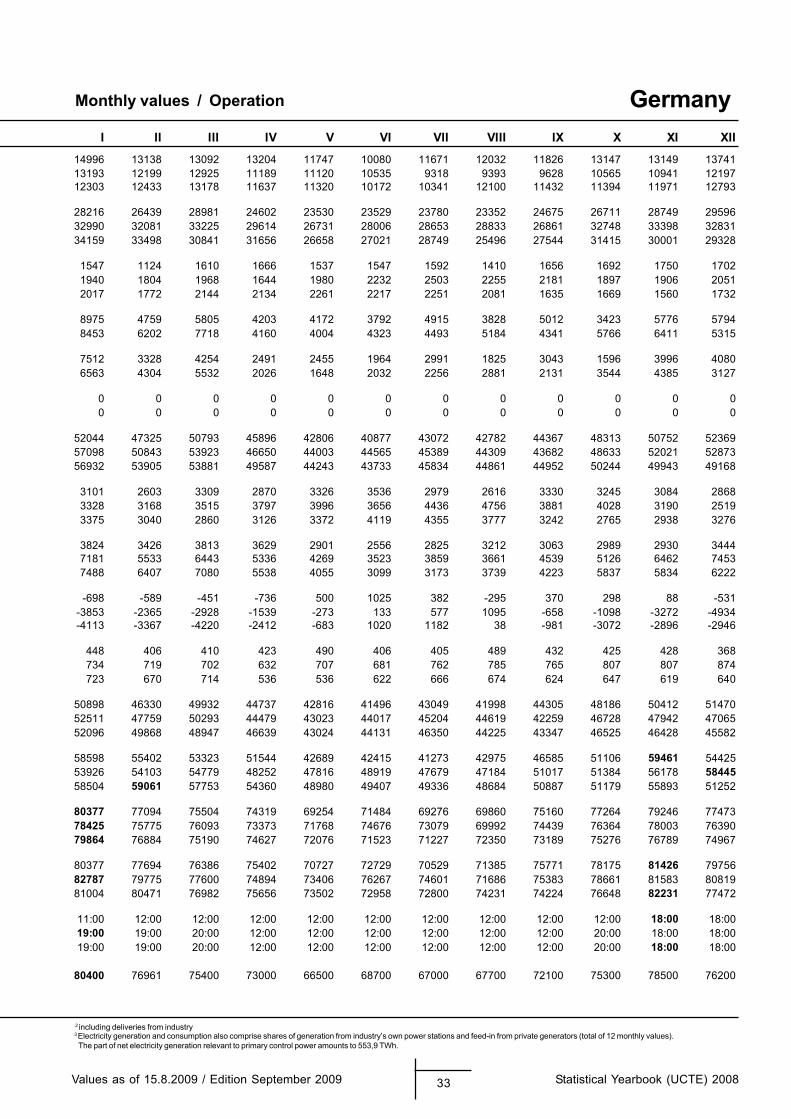
2 including deliveries from industry
Monthly values / Operation
Values as of 15.8.2009 / Edition September 2009 33 Statistical Yearbook (UCTE) 2008
GermanyI II III IV V VI VII VIII IX X XI XII
14996 13138 13092 13204 11747 10080 11671 12032 11826 13147 13149 1374113193 12199 12925 11189 11120 10535 9318 9393 9628 10565 10941 1219712303 12433 13178 11637 11320 10172 10341 12100 11432 11394 11971 12793
28216 26439 28981 24602 23530 23529 23780 23352 24675 26711 28749 2959632990 32081 33225 29614 26731 28006 28653 28833 26861 32748 33398 3283134159 33498 30841 31656 26658 27021 28749 25496 27544 31415 30001 29328
1547 1124 1610 1666 1537 1547 1592 1410 1656 1692 1750 17021940 1804 1968 1644 1980 2232 2503 2255 2181 1897 1906 20512017 1772 2144 2134 2261 2217 2251 2081 1635 1669 1560 1732
8975 4759 5805 4203 4172 3792 4915 3828 5012 3423 5776 57948453 6202 7718 4160 4004 4323 4493 5184 4341 5766 6411 5315
7512 3328 4254 2491 2455 1964 2991 1825 3043 1596 3996 40806563 4304 5532 2026 1648 2032 2256 2881 2131 3544 4385 3127
0 0 0 0 0 0 0 0 0 0 0 00 0 0 0 0 0 0 0 0 0 0 0
52044 47325 50793 45896 42806 40877 43072 42782 44367 48313 50752 5236957098 50843 53923 46650 44003 44565 45389 44309 43682 48633 52021 5287356932 53905 53881 49587 44243 43733 45834 44861 44952 50244 49943 49168
3101 2603 3309 2870 3326 3536 2979 2616 3330 3245 3084 28683328 3168 3515 3797 3996 3656 4436 4756 3881 4028 3190 25193375 3040 2860 3126 3372 4119 4355 3777 3242 2765 2938 3276
3824 3426 3813 3629 2901 2556 2825 3212 3063 2989 2930 34447181 5533 6443 5336 4269 3523 3859 3661 4539 5126 6462 74537488 6407 7080 5538 4055 3099 3173 3739 4223 5837 5834 6222
-698 -589 -451 -736 500 1025 382 -295 370 298 88 -531-3853 -2365 -2928 -1539 -273 133 577 1095 -658 -1098 -3272 -4934-4113 -3367 -4220 -2412 -683 1020 1182 38 -981 -3072 -2896 -2946
448 406 410 423 490 406 405 489 432 425 428 368734 719 702 632 707 681 762 785 765 807 807 874723 670 714 536 536 622 666 674 624 647 619 640
50898 46330 49932 44737 42816 41496 43049 41998 44305 48186 50412 5147052511 47759 50293 44479 43023 44017 45204 44619 42259 46728 47942 4706552096 49868 48947 46639 43024 44131 46350 44225 43347 46525 46428 45582
58598 55402 53323 51544 42689 42415 41273 42975 46585 51106 59461 5442553926 54103 54779 48252 47816 48919 47679 47184 51017 51384 56178 5844558504 59061 57753 54360 48980 49407 49336 48684 50887 51179 55893 51252
80377 77094 75504 74319 69254 71484 69276 69860 75160 77264 79246 7747378425 75775 76093 73373 71768 74676 73079 69992 74439 76364 78003 7639079864 76884 75190 74627 72076 71523 71227 72350 73189 75276 76789 74967
80377 77694 76386 75402 70727 72729 70529 71385 75771 78175 81426 7975682787 79775 77600 74894 73406 76267 74601 71686 75383 78661 81583 8081981004 80471 76982 75656 73502 72958 72800 74231 74224 76648 82231 77472
11:00 12:00 12:00 12:00 12:00 12:00 12:00 12:00 12:00 12:00 18:00 18:0019:00 19:00 20:00 12:00 12:00 12:00 12:00 12:00 12:00 20:00 18:00 18:0019:00 19:00 20:00 12:00 12:00 12:00 12:00 12:00 12:00 20:00 18:00 18:00
80400 76961 75400 73000 66500 68700 67000 67700 72100 75300 78500 76200
3 Electricity generation and consumption also comprise shares of generation from industry’s own power stations and feed-in from private generators (total of 12 monthly values). The part of net electricity generation relevant to primary control power amounts to 553,9 TWh.
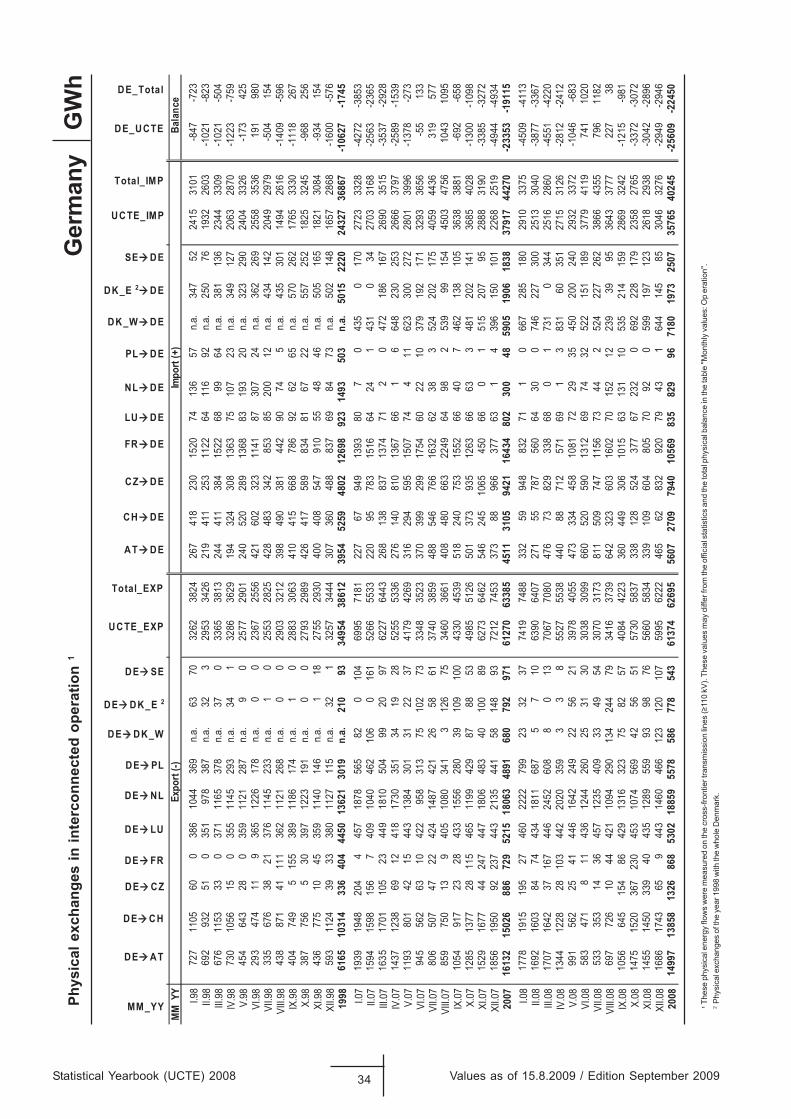
1
The
se p
hysi
cal e
nerg
y flo
ws
wer
e m
easu
red
on th
e cr
oss-
front
ier t
rans
mis
sion
lines
(≥11
0 kV
). Th
ese
valu
es m
ay d
iffer
from
the
offic
ial s
tatis
tics
and
the
tota
l phy
sica
l bal
ance
in th
e ta
ble
"Mon
thly
val
ues:
Op
erat
ion"
.
2 P
hysi
cal e
xcha
nges
of t
he y
ear 1
998
with
the
who
le D
enm
ark.
GW
hPh
ysic
al e
xcha
nges
in in
terc
onne
cted
ope
ratio
n 1
Statistical Yearbook (UCTE) 2008 34 Values as of 15.8.2009 / Edition September 2009
Ger
man
y
MM_YY
DE AT
DE CH
DE CZ
DE FR
DE LU
DE NL
DE PL
DE DK_W
DE DK_E 2
DE SE
UCTE_EXP
Total_EXP
AT DE
CH DE
CZ DE
FR DE
LU DE
NL DE
PL DE
DK_W DE
DK_E 2 DE
SE DE
UCTE_IMP
Total_IMP
DE_UCTE
DE_Total
MM
_YY
I.98
727
1105
600
386
1044
369
n.a.
6370
3262
3824
267
418
230
1520
7413
657
n.a.
347
5224
1531
01-8
47-7
23II.
9869
293
251
035
197
838
7n.
a.32
329
5334
2621
941
125
311
2264
116
92n.
a.25
076
1932
2603
-102
1-8
23III
.98
676
1153
330
371
1165
378
n.a.
370
3365
3813
244
411
384
1522
6899
64n.
a.38
113
623
4433
09-1
021
-504
IV.9
873
010
5615
035
511
4529
3n.
a.34
132
8636
2919
432
430
813
6375
107
23n.
a.34
912
720
6328
70-1
223
-759
V.98
454
643
280
359
1121
287
n.a.
90
2577
2901
240
520
289
1368
8319
320
n.a.
323
290
2404
3326
-173
425
VI.9
829
347
411
936
512
2617
8n.
a.0
023
6725
5642
160
232
311
4187
307
24n.
a.36
226
925
5835
3619
198
0VI
I.98
335
676
3821
376
1145
233
n.a.
10
2553
2825
428
483
342
853
8520
012
n.a.
434
142
2049
2979
-504
154
VIII.
9843
887
141
111
362
1121
268
n.a.
00
2903
3212
398
490
381
442
9074
5n.
a.43
530
114
9426
16-1
409
-596
IX.9
840
474
95
155
389
1186
174
n.a.
10
2883
3063
410
415
668
786
9262
65n.
a.57
026
217
6533
30-1
118
267
X.98
387
756
530
397
1223
191
n.a.
00
2793
2989
426
417
589
834
8167
22n.
a.55
725
218
2532
45-9
6825
6XI
.98
436
775
1045
359
1140
146
n.a.
11 8
2755
2930
400
408
547
910
5548
46n.
a.50
516
518
2130
84-9
3415
4XI
I.98
593
1124
3933
380
1127
115
n.a.
321
3257
3444
307
360
488
837
6984
73n.
a.50
214
816
5728
68-1
600
-576
1998
6165
1031
433
640
444
5013
621
3019
n.a.
210
9334
954
3861
239
5452
5948
0212
698
923
1493
503
n.a.
5015
2220
2432
736
867
-106
27-1
745
I.07
1939
1948
204
445
718
7856
582
010
469
9571
8122
767
949
1393
807
043
50
170
2723
3328
-427
2-3
853
II.07
1594
1598
156
740
910
4046
210
60
161
5266
5533
220
9578
315
1664
241
431
034
2703
3168
-256
3-2
365
III.0
716
3 517
0 110
523
449
1810
504
9920
9762
2764
4326
813
883
713
7471
20
472
186
167
2690
3515
-353
7-2
928
IV.0
714
3712
3869
1241
817
3035
134
1928
5255
5336
276
140
810
1367
661
664
823
025
326
6637
97-2
589
-153
9V.
0711
9380
142
1544
313
8430
131
2237
4179
4269
316
294
595
1507
744
1162
330
027
228
0139
96-1
378
-273
VI.0
794
556
263
1042
295
831
375
102
7333
4835
2337
039
929
917
5460
2210
379
192
171
3293
3656
-55
133
VII.0
780
650
747
2242
414
8742
126
5861
3740
3859
488
546
766
1632
6238
352
420
217
540
5944
3631
957
7VI
II.07
859
750
139
405
1080
341
312
675
3460
3661
408
480
663
2249
6498
253
999
154
4503
4756
1043
1095
IX.0
710
5491
723
2843
315
5628
039
109
100
4330
4539
518
240
753
1552
6640
746
213
810
536
3838
81-6
92-6
58X.
0712
8513
7728
115
465
1199
429
8788
5349
8551
2650
137
393
512
6366
633
481
202
141
3685
4028
-130
0-1
098
XI.0
715
2916
7744
247
447
1806
483
4010
089
6273
6462
546
245
1065
450
660
151
520
795
2888
3190
-338
5-3
272
XII.0
718
5619
5092
237
443
2135
441
5814
893
7212
7453
373
8896
637
763
14
396
150
101
2268
2519
-494
4-4
934
2007
1613
215
026
886
729
5215
1 80 6
348
9168
079
297
161
270
6338
545
1131
0594
2116
434
802
300
4859
0519
0618
3837
917
4427
0-2
3353
-191
15I.0
817
7819
1519
527
460
2222
799
2332
3774
1974
8833
259
948
832
711
066
728
518
029
1033
75-4
509
-411
3II.
0816
9216
0384
7443
418
1168
75
710
6390
6407
271
5578
756
064
300
746
227
300
2513
3040
-387
7-3
367
III.0
817
0716
4237
167
446
2452
608
80
1370
6770
8047
673
829
338
680
173
10
344
2516
2860
-455
1-4
220
IV.0
813
4412
2828
103
442
2020
359
33
855
2755
3844
088
712
571
691
383
160
351
2715
3126
-281
2-2
412
V.08
991
562
2541
4 46
1642
249
2256
2139
7840
5547
333
445
810
8172
2935
450
200
240
2932
3372
-104
6-6
83VI
.08
583
471
811
436
1244
260
2531
3030
3830
9966
052
059
013
1269
7432
522
151
189
3779
4119
741
1020
VII.0
853
335
314
3645
712
3540
933
4954
3070
3173
811
509
747
1156
7344
252
422
726
238
6643
5579
611
82VI
II.08
697
726
1044
421
1094
290
134
244
7934
1637
3964
232
360
316
0270
152
1223
939
9536
4337
7722
738
IX.0
810
5664
515
486
429
1316
323
7582
5740
8442
2336
044
930
610
1563
131
1053
521
415
928
6932
42-1
215
-981
X.08
1475
1520
367
230
453
1074
569
4 25 6
5157
3058
3733
812
852
437
767
232
069
222
817
923
5827
65-3
372
-307
2XI
.08
1455
1450
339
4043
512
8955
993
9876
5660
5834
339
109
604
805
7092
059
919
712
326
1829
38-3
042
-289
6XI
I.08
1686
1743
659
443
1460
466
123
120
107
5995
6222
465
6283
292
079
431
644
145
8530
4632
76-2
949
-294
620
0814
997
1385
813
2686
853
0218
859
5578
586
778
543
6137
462
695
5607
2709
7940
1056
983
582
996
7180
1973
2507
3576
540
245
-256
09-2
2450
Bala
nce
Impo
rt (+
)Ex
port
(-)
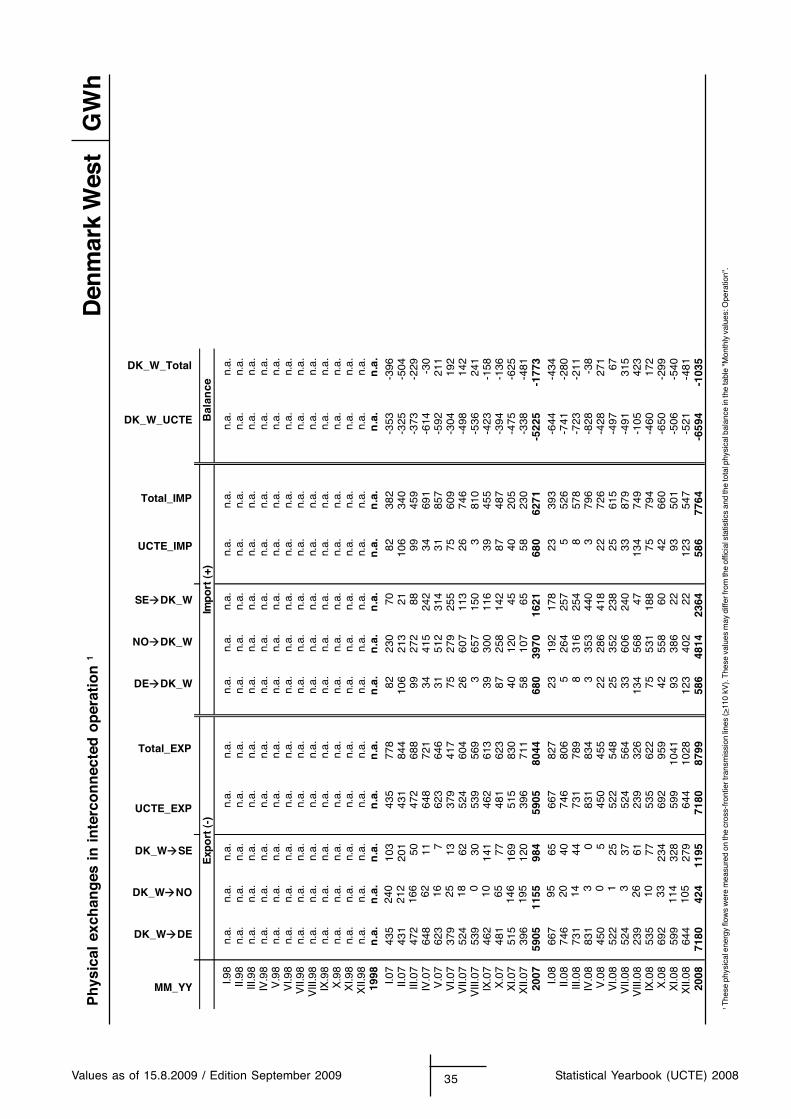
Values as of 15.8.2009 / Edition September 2009 35 Statistical Yearbook (UCTE) 2008
GW
hP
hys
ical
exc
han
ges
in
in
terc
on
nec
ted
op
erat
ion
1
1
The
se p
hysi
cal e
nerg
y flo
ws
wer
e m
easu
red
on th
e cr
oss-
fron
tier t
rans
mis
sion
line
s (>
110
kV).
The
se v
alue
s m
ay d
iffer
from
the
offic
ial s
tatis
tics
and
the
tota
l phy
sica
l bal
ance
in th
e ta
ble
"Mon
thly
val
ues:
Ope
ratio
n".
Den
mar
k W
est
MM_YY
DK_W DE
DK_W NO
DK_W SE
UCTE_EXP
Total_EXP
DE DK_W
NO DK_W
SE DK_W
UCTE_IMP
Total_IMP
DK_W_UCTE
DK_W_Total
Exp
ort
(-)
Imp
ort
(+)
Bal
ance
I.98
n.a.
n.a.
n.a.
n.a.
n.a.
n.a.
n.a.
n.a.
n.a.
n.a.
n.a.
n.a.
II.98
n.a.
n.a.
n.a.
n.a.
n.a.
n.a.
n.a.
n.a.
n.a.
n.a.
n.a.
n.a.
III.9
8n.
a.n.
a.n.
a.n.
a.n.
a.n.
a.n.
a.n.
a.n.
a.n.
a.n.
a.n.
a.IV
.98
n.a.
n.a.
n.a.
n.a.
n.a.
n.a.
n.a.
n.a.
n.a.
n.a.
n.a.
n.a.
V.9
8n.
a.n.
a.n.
a.n.
a.n.
a.n.
a.n.
a.n.
a.n.
a.n.
a.n.
a.n.
a.V
I.98
n.a.
n.a.
n.a.
n.a.
n.a.
n.a.
n.a.
n.a.
n.a.
n.a.
n.a.
n.a.
VII.
98n.
a.n.
a.n.
a.n.
a.n.
a.n.
a.n.
a.n.
a.n.
a.n.
a.n.
a.n.
a.V
III.9
8n.
a.n.
a.n.
a.n.
a.n.
a.n.
a.n.
a.n.
a.n.
a.n.
a.n.
a.n.
a.IX
.98
n.a.
n.a.
n.a.
n.a.
n.a.
n.a.
n.a.
n.a.
n.a.
n.a.
n.a.
n.a.
X.9
8n.
a.n.
a.n.
a.n.
a.n.
a.n.
a.n.
a.n.
a.n.
a.n.
a.n.
a.n.
a.X
I.98
n.a.
n.a.
n.a.
n.a.
n.a.
n.a.
n.a.
n.a.
n.a.
n.a.
n.a.
n.a.
XII.
98n.
a.n.
a.n.
a.n.
a.n.
a.n.
a.n.
a.n.
a.n.
a.n.
a.n.
a.n.
a.19
98n
.a.
n.a
.n
.a.
n.a
.n
.a.
n.a
.n
.a.
n.a
.n
.a.
n.a
.n
.a.
n.a
.I.0
743
524
010
343
577
882
230
7082
382
-353
-396
II.07
431
212
201
431
844
106
213
2110
634
0-3
25-5
04III
.07
472
166
5047
268
899
272
8899
459
-373
-229
IV.0
764
862
1164
872
134
415
242
3469
1-6
14-3
0V
.07
623
167
623
646
3151
231
431
857
-592
211
VI.0
737
925
1337
941
775
279
255
7560
9-3
0419
2V
II.07
524
1862
524
604
2660
711
326
746
-498
142
VIII
.07
539
030
539
569
365
715
03
810
-536
241
IX.0
746
210
141
462
613
3930
011
639
455
-423
-158
X.0
748
165
7748
162
387
258
142
8748
7-3
94-1
36X
I.07
515
146
169
515
830
4012
045
4020
5-4
75-6
25X
II.07
396
195
120
396
711
5810
765
5823
0-3
38-4
8120
0759
0511
5598
459
0580
4468
039
7016
2168
062
71-5
225
-177
3I.0
866
795
6566
782
723
192
178
2339
3-6
44-4
34II.
0874
620
4074
680
65
264
257
552
6-7
41-2
80III
.08
731
1444
731
789
831
625
48
578
-723
-211
IV.0
883
13
083
183
43
353
440
379
6-8
28-3
8V
.08
450
05
450
455
2228
641
822
726
-428
271
VI.0
852
21
2552
254
825
352
238
2561
5-4
9767
VII.
0852
43
3752
456
433
606
240
3387
9-4
9131
5V
III.0
823
926
6123
932
613
456
847
134
749
-105
423
IX.0
853
510
7753
562
275
531
188
7579
4-4
6017
2X
.08
692
3323
469
295
942
558
6042
660
-650
-299
XI.0
859
911
432
859
910
4193
386
2293
501
-506
-540
XII.
0864
410
527
964
410
2812
340
222
123
547
-521
-481
2008
7180
424
1195
7180
8799
586
4814
2364
586
7764
-659
4-1
035

1 Before 2005, the information on renewable and not identifiable energy sources was collected in a different manner. Some countries added them to thermal conventional, some considered them as the part of not represented in the figures ( through the factor "representativity" ).
Monthly values / Operation
Statistical Yearbook (UCTE) 2008 36 Values as of 15.8.2009 / Edition September 2009
Denmark WestI-XII
1998 n.a.Thermal nuclear net generation GWh 2007 0
2008 0
1998 n.a.Fossil fuels net generation GWh 2007 16403
2008 15910
1998 n.a.Hydraulic net generation GWh 2007 31
2008 27
Other renewable net generation 1 GWh 2007 71352008 6804
- of which wind GWh 2007 56252008 5209
Non-identifiable net generation 1 GWh 2007 02008 0
1998 n.a.Total net electrical energy generation GWh 2007 2 23569calculated to represent 100% of the national values 2008 2 22741
1998 n.a.Physical import GWh 2007 6271
2008 7764
1998 n.a.Physical export GWh 2007 8044
2008 8799
1998 n.a.Total physical import/export balance GWh 2007 -1775
2008 -1029
1998 n.a.Consumption of pumps GWh 2007 0
2008 0
1998 n.a.National electrical consumption, GWh 2007 21794calculated to represent 100% of the national values 2008 21712
1998 n.a.Consumption load 3:00 a.m. on the 3rd Wednesday, MW max. 2007 2116calculated to represent 100% of the national values 2008 2083
1998 n.a.Consumption load 11:00 a.m. on the 3rd Wednesday, MW max. 2007 3653calculated to represent 100% of the national values 2008 3508
1998 n.a.Highest load on the 3rd Wednesday, MW max. 2007 3713calculated to represent 100% of the national values 2008 3664
1998 n.a.Time of highest load on the 3rd Wednesday CET 2007 09:00
2008 18:00
Power produced in parallel operation on the 3rd Wednesday at 11:00 a.m. MW max. 1998 n.a.
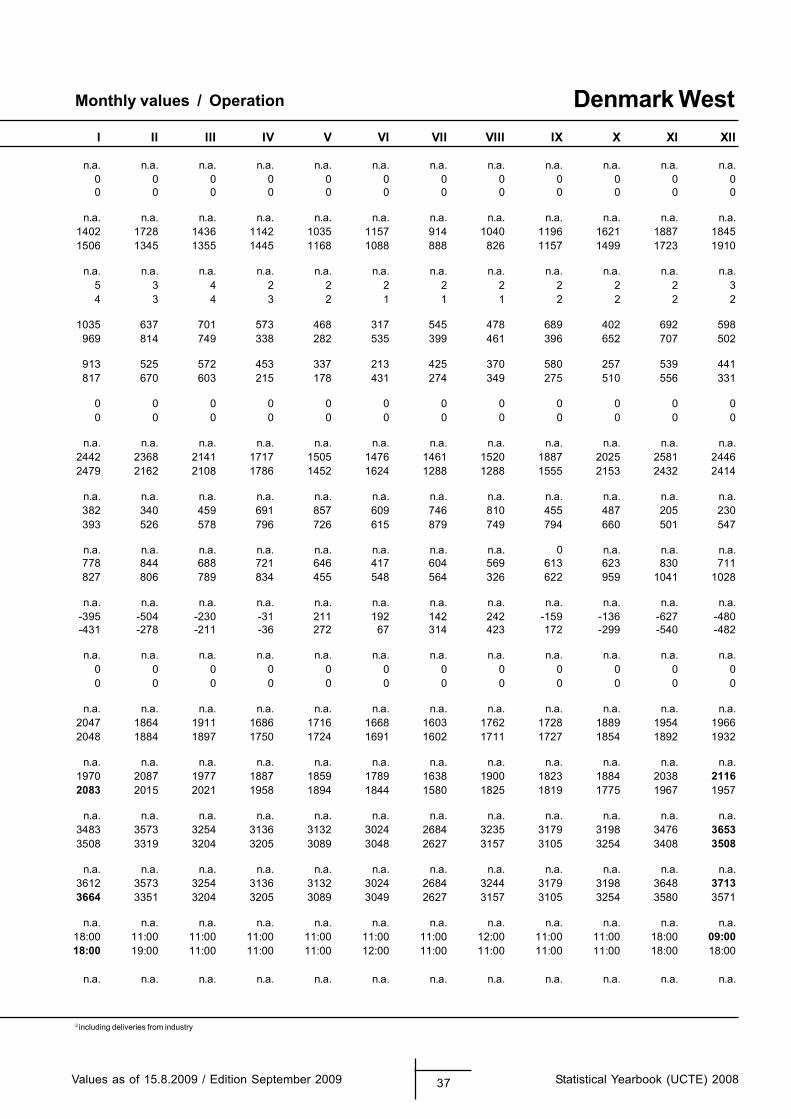
2 including deliveries from industry
Monthly values / Operation
Values as of 15.8.2009 / Edition September 2009 37 Statistical Yearbook (UCTE) 2008
Denmark WestI II III IV V VI VII VIII IX X XI XII
n.a. n.a. n.a. n.a. n.a. n.a. n.a. n.a. n.a. n.a. n.a. n.a.0 0 0 0 0 0 0 0 0 0 0 00 0 0 0 0 0 0 0 0 0 0 0
n.a. n.a. n.a. n.a. n.a. n.a. n.a. n.a. n.a. n.a. n.a. n.a.1402 1728 1436 1142 1035 1157 914 1040 1196 1621 1887 18451506 1345 1355 1445 1168 1088 888 826 1157 1499 1723 1910
n.a. n.a. n.a. n.a. n.a. n.a. n.a. n.a. n.a. n.a. n.a. n.a.5 3 4 2 2 2 2 2 2 2 2 34 3 4 3 2 1 1 1 2 2 2 2
1035 637 701 573 468 317 545 478 689 402 692 598969 814 749 338 282 535 399 461 396 652 707 502
913 525 572 453 337 213 425 370 580 257 539 441817 670 603 215 178 431 274 349 275 510 556 331
0 0 0 0 0 0 0 0 0 0 0 00 0 0 0 0 0 0 0 0 0 0 0
n.a. n.a. n.a. n.a. n.a. n.a. n.a. n.a. n.a. n.a. n.a. n.a.2442 2368 2141 1717 1505 1476 1461 1520 1887 2025 2581 24462479 2162 2108 1786 1452 1624 1288 1288 1555 2153 2432 2414
n.a. n.a. n.a. n.a. n.a. n.a. n.a. n.a. n.a. n.a. n.a. n.a.382 340 459 691 857 609 746 810 455 487 205 230393 526 578 796 726 615 879 749 794 660 501 547
n.a. n.a. n.a. n.a. n.a. n.a. n.a. n.a. 0 n.a. n.a. n.a.778 844 688 721 646 417 604 569 613 623 830 711827 806 789 834 455 548 564 326 622 959 1041 1028
n.a. n.a. n.a. n.a. n.a. n.a. n.a. n.a. n.a. n.a. n.a. n.a.-395 -504 -230 -31 211 192 142 242 -159 -136 -627 -480-431 -278 -211 -36 272 67 314 423 172 -299 -540 -482
n.a. n.a. n.a. n.a. n.a. n.a. n.a. n.a. n.a. n.a. n.a. n.a.0 0 0 0 0 0 0 0 0 0 0 00 0 0 0 0 0 0 0 0 0 0 0
n.a. n.a. n.a. n.a. n.a. n.a. n.a. n.a. n.a. n.a. n.a. n.a.2047 1864 1911 1686 1716 1668 1603 1762 1728 1889 1954 19662048 1884 1897 1750 1724 1691 1602 1711 1727 1854 1892 1932
n.a. n.a. n.a. n.a. n.a. n.a. n.a. n.a. n.a. n.a. n.a. n.a.1970 2087 1977 1887 1859 1789 1638 1900 1823 1884 2038 21162083 2015 2021 1958 1894 1844 1580 1825 1819 1775 1967 1957
n.a. n.a. n.a. n.a. n.a. n.a. n.a. n.a. n.a. n.a. n.a. n.a.3483 3573 3254 3136 3132 3024 2684 3235 3179 3198 3476 36533508 3319 3204 3205 3089 3048 2627 3157 3105 3254 3408 3508
n.a. n.a. n.a. n.a. n.a. n.a. n.a. n.a. n.a. n.a. n.a. n.a.3612 3573 3254 3136 3132 3024 2684 3244 3179 3198 3648 37133664 3351 3204 3205 3089 3049 2627 3157 3105 3254 3580 3571
n.a. n.a. n.a. n.a. n.a. n.a. n.a. n.a. n.a. n.a. n.a. n.a.18:00 11:00 11:00 11:00 11:00 11:00 11:00 12:00 11:00 11:00 18:00 09:0018:00 19:00 11:00 11:00 11:00 12:00 11:00 11:00 11:00 11:00 18:00 18:00
n.a. n.a. n.a. n.a. n.a. n.a. n.a. n.a. n.a. n.a. n.a. n.a.
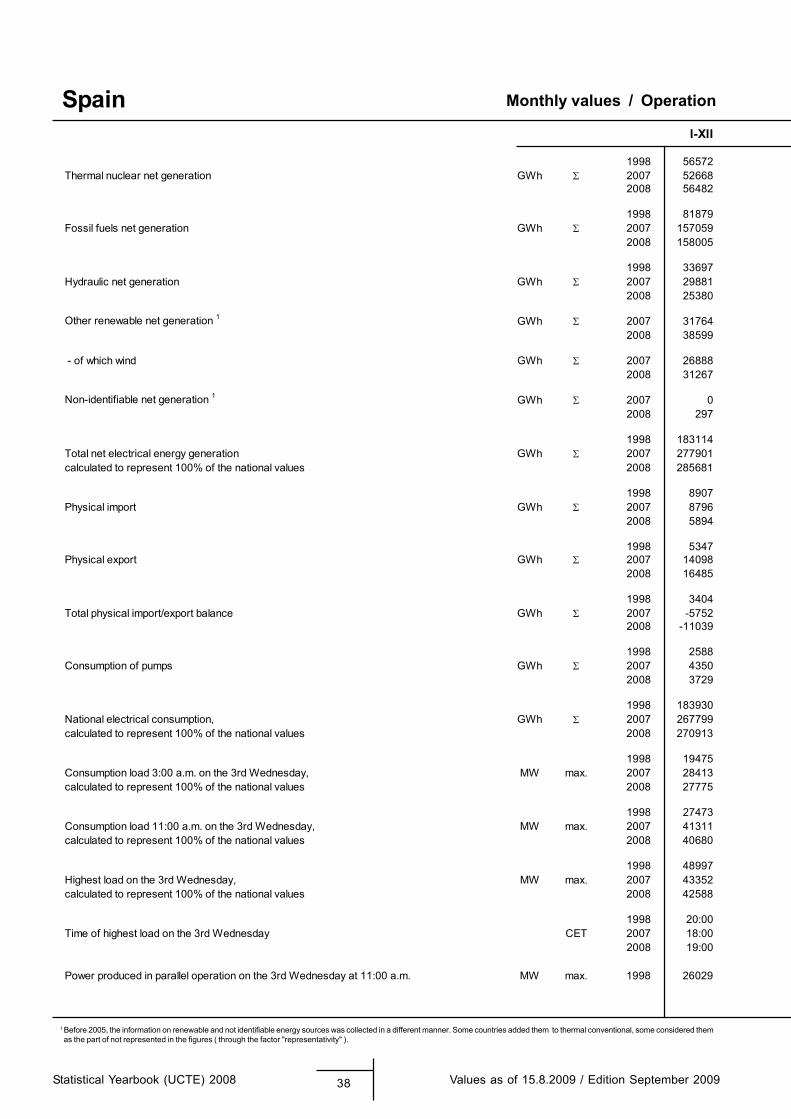
1 Before 2005, the information on renewable and not identifiable energy sources was collected in a different manner. Some countries added them to thermal conventional, some considered them as the part of not represented in the figures ( through the factor "representativity" ).
Monthly values / Operation
Statistical Yearbook (UCTE) 2008 38 Values as of 15.8.2009 / Edition September 2009
SpainI-XII
1998 56572Thermal nuclear net generation GWh 2007 52668
2008 56482
1998 81879Fossil fuels net generation GWh 2007 157059
2008 158005
1998 33697Hydraulic net generation GWh 2007 29881
2008 25380
Other renewable net generation 1 GWh 2007 317642008 38599
- of which wind GWh 2007 268882008 31267
Non-identifiable net generation 1 GWh 2007 02008 297
1998 183114Total net electrical energy generation GWh 2007 277901calculated to represent 100% of the national values 2008 285681
1998 8907Physical import GWh 2007 8796
2008 5894
1998 5347Physical export GWh 2007 14098
2008 16485
1998 3404Total physical import/export balance GWh 2007 -5752
2008 -11039
1998 2588Consumption of pumps GWh 2007 4350
2008 3729
1998 183930National electrical consumption, GWh 2007 267799calculated to represent 100% of the national values 2008 270913
1998 19475Consumption load 3:00 a.m. on the 3rd Wednesday, MW max. 2007 28413calculated to represent 100% of the national values 2008 27775
1998 27473Consumption load 11:00 a.m. on the 3rd Wednesday, MW max. 2007 41311calculated to represent 100% of the national values 2008 40680
1998 48997Highest load on the 3rd Wednesday, MW max. 2007 43352calculated to represent 100% of the national values 2008 42588
1998 20:00Time of highest load on the 3rd Wednesday CET 2007 18:00
2008 19:00
Power produced in parallel operation on the 3rd Wednesday at 11:00 a.m. MW max. 1998 26029
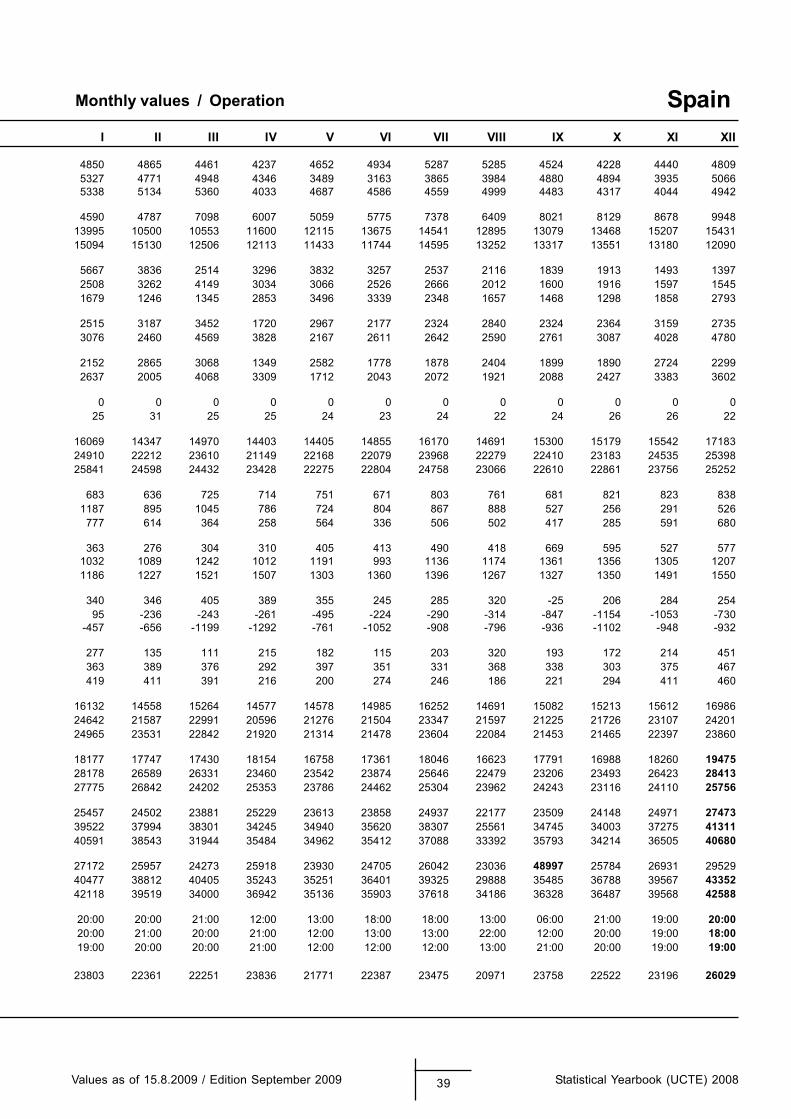
Monthly values / Operation
Values as of 15.8.2009 / Edition September 2009 39 Statistical Yearbook (UCTE) 2008
SpainI II III IV V VI VII VIII IX X XI XII
4850 4865 4461 4237 4652 4934 5287 5285 4524 4228 4440 48095327 4771 4948 4346 3489 3163 3865 3984 4880 4894 3935 50665338 5134 5360 4033 4687 4586 4559 4999 4483 4317 4044 4942
4590 4787 7098 6007 5059 5775 7378 6409 8021 8129 8678 994813995 10500 10553 11600 12115 13675 14541 12895 13079 13468 15207 1543115094 15130 12506 12113 11433 11744 14595 13252 13317 13551 13180 12090
5667 3836 2514 3296 3832 3257 2537 2116 1839 1913 1493 13972508 3262 4149 3034 3066 2526 2666 2012 1600 1916 1597 15451679 1246 1345 2853 3496 3339 2348 1657 1468 1298 1858 2793
2515 3187 3452 1720 2967 2177 2324 2840 2324 2364 3159 27353076 2460 4569 3828 2167 2611 2642 2590 2761 3087 4028 4780
2152 2865 3068 1349 2582 1778 1878 2404 1899 1890 2724 22992637 2005 4068 3309 1712 2043 2072 1921 2088 2427 3383 3602
0 0 0 0 0 0 0 0 0 0 0 025 31 25 25 24 23 24 22 24 26 26 22
16069 14347 14970 14403 14405 14855 16170 14691 15300 15179 15542 1718324910 22212 23610 21149 22168 22079 23968 22279 22410 23183 24535 2539825841 24598 24432 23428 22275 22804 24758 23066 22610 22861 23756 25252
683 636 725 714 751 671 803 761 681 821 823 8381187 895 1045 786 724 804 867 888 527 256 291 526
777 614 364 258 564 336 506 502 417 285 591 680
363 276 304 310 405 413 490 418 669 595 527 5771032 1089 1242 1012 1191 993 1136 1174 1361 1356 1305 12071186 1227 1521 1507 1303 1360 1396 1267 1327 1350 1491 1550
340 346 405 389 355 245 285 320 -25 206 284 25495 -236 -243 -261 -495 -224 -290 -314 -847 -1154 -1053 -730
-457 -656 -1199 -1292 -761 -1052 -908 -796 -936 -1102 -948 -932
277 135 111 215 182 115 203 320 193 172 214 451363 389 376 292 397 351 331 368 338 303 375 467419 411 391 216 200 274 246 186 221 294 411 460
16132 14558 15264 14577 14578 14985 16252 14691 15082 15213 15612 1698624642 21587 22991 20596 21276 21504 23347 21597 21225 21726 23107 2420124965 23531 22842 21920 21314 21478 23604 22084 21453 21465 22397 23860
18177 17747 17430 18154 16758 17361 18046 16623 17791 16988 18260 1947528178 26589 26331 23460 23542 23874 25646 22479 23206 23493 26423 2841327775 26842 24202 25353 23786 24462 25304 23962 24243 23116 24110 25756
25457 24502 23881 25229 23613 23858 24937 22177 23509 24148 24971 2747339522 37994 38301 34245 34940 35620 38307 25561 34745 34003 37275 4131140591 38543 31944 35484 34962 35412 37088 33392 35793 34214 36505 40680
27172 25957 24273 25918 23930 24705 26042 23036 48997 25784 26931 2952940477 38812 40405 35243 35251 36401 39325 29888 35485 36788 39567 4335242118 39519 34000 36942 35136 35903 37618 34186 36328 36487 39568 42588
20:00 20:00 21:00 12:00 13:00 18:00 18:00 13:00 06:00 21:00 19:00 20:0020:00 21:00 20:00 21:00 12:00 13:00 13:00 22:00 12:00 20:00 19:00 18:0019:00 20:00 20:00 21:00 12:00 12:00 12:00 13:00 21:00 20:00 19:00 19:00
23803 22361 22251 23836 21771 22387 23475 20971 23758 22522 23196 26029
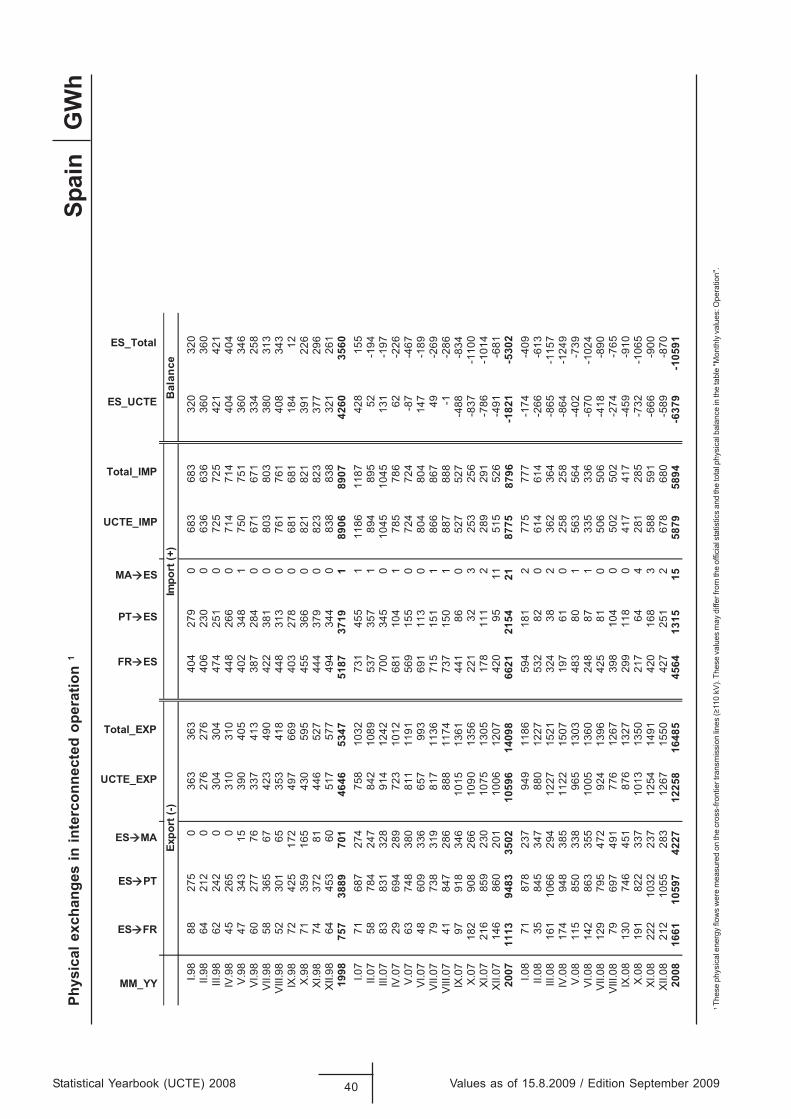
Statistical Yearbook (UCTE) 2008 40 Values as of 15.8.2009 / Edition September 2009
GW
hPh
ysic
al e
xcha
nges
in in
terc
onne
cted
ope
ratio
n 1
1
Thes
e ph
ysic
al e
nerg
y flo
ws
wer
e m
easu
red
on th
e cr
oss-
front
ier t
rans
mis
sion
lines
(≥11
0 kV
). Th
ese
valu
es m
ay d
iffer
from
the
offic
ial s
tatis
tics
and
the
tota
l phy
sica
l bal
ance
in th
e ta
ble
"Mon
thly
val
ues:
Ope
ratio
n".
Spai
n
MM_YY
ES FR
ES PT
ES MA
UCTE_EXP
Total_EXP
FR ES
PT ES
MA ES
UCTE_IMP
Total_IMP
ES_UCTE
ES_Total
I.98
8827
50
363
363
404
279
068
368
332
032
0II.
9864
212
027
627
640
623
00
636
636
360
360
III.9
862
242
030
430
447
425
10
725
725
421
421
IV.9
845
265
031
031
044
826
60
714
714
404
404
V.9
847
343
1539
040
540
234
81
750
751
360
346
VI.9
860
277
7633
741
338
728
40
671
671
334
258
VII.9
858
365
6742
349
042
238
10
803
803
380
313
VIII
.98
5230
165
353
418
448
313
076
176
140
834
3IX
.98
7242
517
249
766
940
327
80
681
681
184
12X
.98
7135
916
543
059
545
536
60
821
821
391
226
XI.9
874
372
8144
652
744
437
90
823
823
377
296
XII.9
864
453
6051
757
749
434
40
838
838
321
261
1998
757
3889
701
4646
5347
5187
3719
189
0689
0742
6035
60I.0
771
687
274
758
1032
731
455
111
8611
8742
815
5II.
0758
784
247
842
1089
537
357
189
489
552
-194
III.0
783
831
328
914
1242
700
345
010
4510
4513
1-1
97IV
.07
2969
428
972
310
1268
110
41
785
786
62-2
26V
.07
6374
838
081
111
9156
915
50
724
724
-87
-467
VI.0
748
609
336
657
993
691
113
080
480
414
7-1
89VI
I.07
7973
831
981
711
3671
515
11
866
867
49-2
69V
III.0
741
847
286
888
1174
737
150
188
788
8-1
-286
IX.0
797
918
346
1015
1361
441
860
527
527
-488
-834
X.0
718
290
826
610
9013
5622
132
325
325
6-8
37-1
100
XI.0
721
685
923
010
7513
0517
811
12
289
291
-786
-101
4XI
I.07
146
860
201
1006
1207
420
9511
515
526
-491
-681
2007
1113
9483
3502
1059
614
098
6621
2154
2187
7587
96-1
821
-530
2I.0
871
878
237
949
1186
594
181
277
577
7-1
74-4
09II.
0835
845
347
880
1227
532
820
614
614
-266
-613
III.0
816
110
6629
412
2715
2132
438
236
236
4-8
65-1
157
IV.0
817
494
838
511
2215
0719
761
025
825
8-8
64-1
249
V.0
811
585
033
896
513
0348
380
156
356
4-4
02-7
39VI
.08
142
863
355
1005
1360
248
871
335
336
-670
-102
4VI
I.08
129
795
472
924
1396
425
810
506
506
-418
-890
VIII
.08
7969
749
177
612
6739
810
40
502
502
-274
-765
IX.0
813
074
645
187
613
2729
911
80
417
417
-459
-910
X.0
819
182
233
710
1313
5021
764
428
128
5-7
32-1
065
XI.0
822
210
3223
712
5414
9142
016
83
588
591
-666
-900
XII.0
821
210
5528
312
6715
5042
725
12
678
680
-589
-870
2008
1661
1059
742
2712
258
1648
545
6413
1515
5879
5894
-637
9-1
0591
ecnalaB
)+( tropmI
)-( tropxE
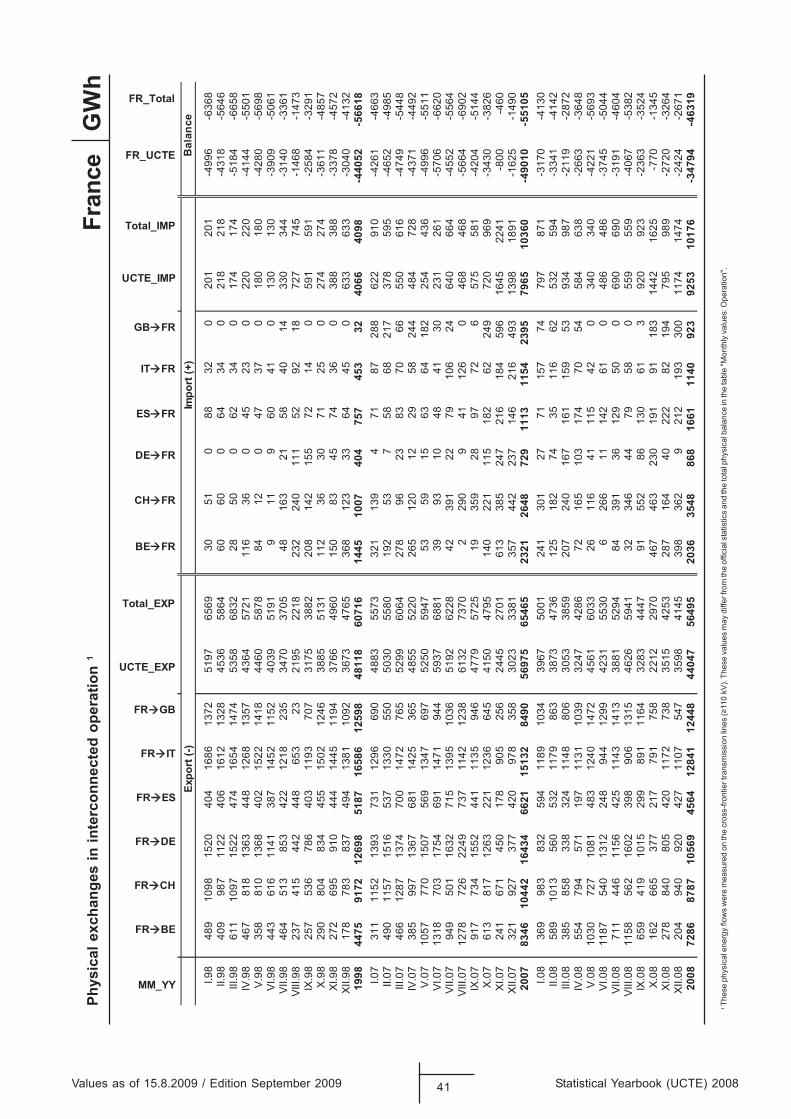
1
Thes
e ph
ysic
al e
nerg
y flo
ws
wer
e m
easu
red
on th
e cr
oss-
front
ier t
rans
mis
sion
lines
(≥11
0 kV
). Th
ese
valu
es m
ay d
iffer
from
the
offic
ial s
tatis
tics
and
the
tota
l phy
sica
l bal
ance
in th
e ta
ble
"Mon
thly
val
ues:
Ope
ratio
n".
Values as of 15.8.2009 / Edition September 2009 41 Statistical Yearbook (UCTE) 2008
GW
hPh
ysic
al e
xcha
nges
in in
terc
onne
cted
ope
ratio
n 1
Fran
ce
MM_YY
FR BE
FR CH
FR DE
FR ES
FR IT
FR GB
UCTE_EXP
Total_EXP
BE FR
CH FR
DE FR
ES FR
IT FR
GB FR
UCTE_IMP
Total_IMP
FR_UCTE
FR_Total
)+( tropmI
)-( tropxE
I.98
489
1098
1520
404
1686
1372
5197
6569
3051
088
320
201
201
-499
6-6
368
II.98
409
987
1122
406
1612
1328
4536
5864
6060
064
340
218
218
-431
8-5
646
III.9
861
110
9715
2247
416
5414
7453
5868
3228
500
6234
017
417
4-5
184
-665
8IV
.98
467
818
1363
448
1268
1357
4364
5721
116
360
4523
022
022
0-4
144
-550
1V.
9835
881
013
6840
215
2214
1844
6058
7884
120
4737
018
018
0-4
280
-569
8VI
.98
443
616
1141
387
1452
1152
4039
5191
911
960
410
130
130
-390
9-5
061
VII.9
846
451
385
342
212
1823
534
7037
0548
163
2158
4014
330
344
-314
0-3
361
VIII.
9823
741
544
244
865
323
2195
2218
232
240
111
5292
1872
774
5-1
468
-147
3IX
.98
257
536
786
403
1193
707
3175
3882
208
142
155
7214
059
159
1-2
584
-329
1X.
9829
080
483
445
515
0212
4638
8551
3111
236
3071
250
274
274
-361
1-4
857
XI.9
827
269
591
044
414
4511
9437
6649
6015
083
4574
360
388
388
-337
8-4
572
XII.9
817
878
383
749
413
8110
9236
7347
6536
812
333
6445
063
363
3-3
040
-413
219
9844
7591
7212
698
5187
1658
612
598
4811
860
716
1445
1007
404
757
453
3240
6640
98-4
4052
-566
18I.0
731
111
5213
9373
112
9669
048
8355
7332
113
94
7187
288
622
910
-426
1-4
663
II.07
490
1157
1516
537
1330
550
5030
5580
192
537
5868
217
378
595
-465
2-4
985
III.0
746
612
8713
7470
014
7276
552
9960
6427
896
2383
7066
550
616
-474
9-5
448
IV.0
738
599
713
6768
114
2536
548
5552
2026
512
012
2958
244
484
728
-437
1-4
492
V.07
1057
770
1507
569
1347
697
5250
5947
5359
1563
6418
225
443
6-4
996
-551
1VI
.07
1318
703
1754
691
1471
944
5937
6881
3993
1048
4130
231
261
-570
6-6
620
VII.0
794
950
116
3271
513
9510
3651
9262
2842
391
2279
106
2464
066
4-4
552
-556
4VI
II.07
1278
726
2249
737
1142
1238
6132
7370
229
09
4112
60
468
468
-566
4-6
902
IX.0
791
773
415
5244
111
3594
647
7957
2519
359
2897
726
575
581
-420
4-5
144
X.07
613
817
1263
221
1236
645
4150
4795
140
221
115
182
6224
972
096
9-3
430
-382
6XI
.07
241
671
450
178
905
256
2445
2701
613
385
247
216
184
596
1645
2241
-800
-460
XII.0
732
192
737
742
097
835
830
2333
8135
744
223
714
621
649
313
9818
91-1
625
-149
020
0783
4610
442
1643
466
2115
132
8490
5697
565
465
2321
2648
729
1113
1154
2395
7965
1036
0-4
9010
-551
05I.0
836
998
383
259
411
8910
3439
6750
0124
130
127
7115
774
797
871
-317
0-4
130
II.08
589
1013
560
532
1179
863
3873
4736
125
182
7435
116
6253
259
4-3
341
-414
2III
.08
385
858
338
324
1148
806
3053
3859
207
240
167
161
159
5393
498
7-2
119
-287
2IV
.08
554
794
571
197
1131
1039
3247
4286
7216
510
317
470
5458
463
8-2
663
-364
8V.
0810
3072
710
8148
312
4014
7245
6160
3326
116
4111
542
034
034
0-4
221
-569
3VI
.08
1187
540
1312
248
944
1299
4231
5530
626
611
142
610
486
486
-374
5-5
044
VII.0
871
144
611
5642
511
4314
1338
8152
9484
391
3612
950
069
069
0-3
191
-460
4VI
II.08
1158
562
1602
398
906
1315
4626
5941
3234
644
7958
055
955
9-4
067
-538
2IX
.08
659
419
1015
299
891
1164
3283
4447
9155
286
130
613
920
923
-236
3-3
524
X.08
162
665
377
217
791
758
2212
2970
467
463
230
191
9118
314
4216
25-7
70-1
345
XI.0
827
884
080
542
011
7273
835
1542
5328
716
440
222
8219
479
598
9-2
720
-326
4XI
I.08
204
940
920
427
1107
547
3598
4145
398
362
921
219
330
011
7414
74-2
424
-267
120
0872
8687
8710
569
4564
1284
112
448
4404
756
495
2036
3548
868
1661
1140
923
9253
1017
6-3
4794
-463
19
Bal
ance
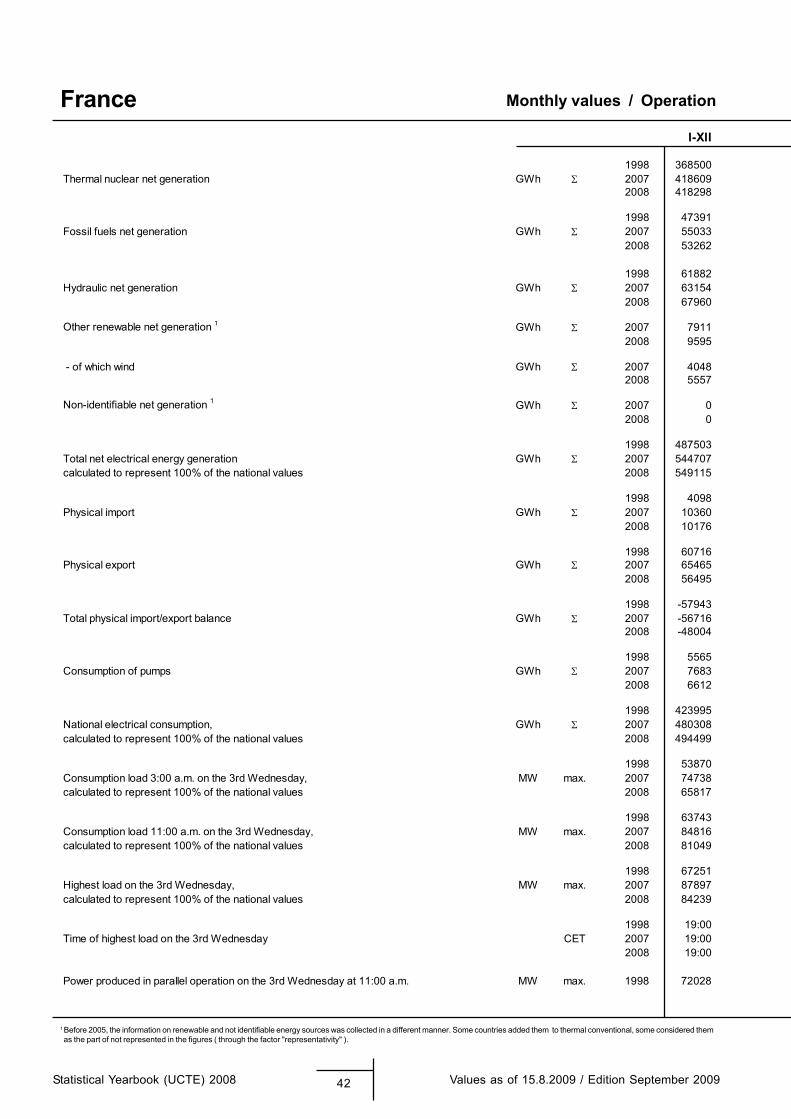
1 Before 2005, the information on renewable and not identifiable energy sources was collected in a different manner. Some countries added them to thermal conventional, some considered them as the part of not represented in the figures ( through the factor "representativity" ).
Monthly values / Operation
Statistical Yearbook (UCTE) 2008 42 Values as of 15.8.2009 / Edition September 2009
FranceI-XII
1998 368500Thermal nuclear net generation GWh 2007 418609
2008 418298
1998 47391Fossil fuels net generation GWh 2007 55033
2008 53262
1998 61882Hydraulic net generation GWh 2007 63154
2008 67960
Other renewable net generation 1 GWh 2007 79112008 9595
- of which wind GWh 2007 40482008 5557
Non-identifiable net generation 1 GWh 2007 02008 0
1998 487503Total net electrical energy generation GWh 2007 544707calculated to represent 100% of the national values 2008 549115
1998 4098Physical import GWh 2007 10360
2008 10176
1998 60716Physical export GWh 2007 65465
2008 56495
1998 -57943Total physical import/export balance GWh 2007 -56716
2008 -48004
1998 5565Consumption of pumps GWh 2007 7683
2008 6612
1998 423995National electrical consumption, GWh 2007 480308calculated to represent 100% of the national values 2008 494499
1998 53870Consumption load 3:00 a.m. on the 3rd Wednesday, MW max. 2007 74738calculated to represent 100% of the national values 2008 65817
1998 63743Consumption load 11:00 a.m. on the 3rd Wednesday, MW max. 2007 84816calculated to represent 100% of the national values 2008 81049
1998 67251Highest load on the 3rd Wednesday, MW max. 2007 87897calculated to represent 100% of the national values 2008 84239
1998 19:00Time of highest load on the 3rd Wednesday CET 2007 19:00
2008 19:00
Power produced in parallel operation on the 3rd Wednesday at 11:00 a.m. MW max. 1998 72028
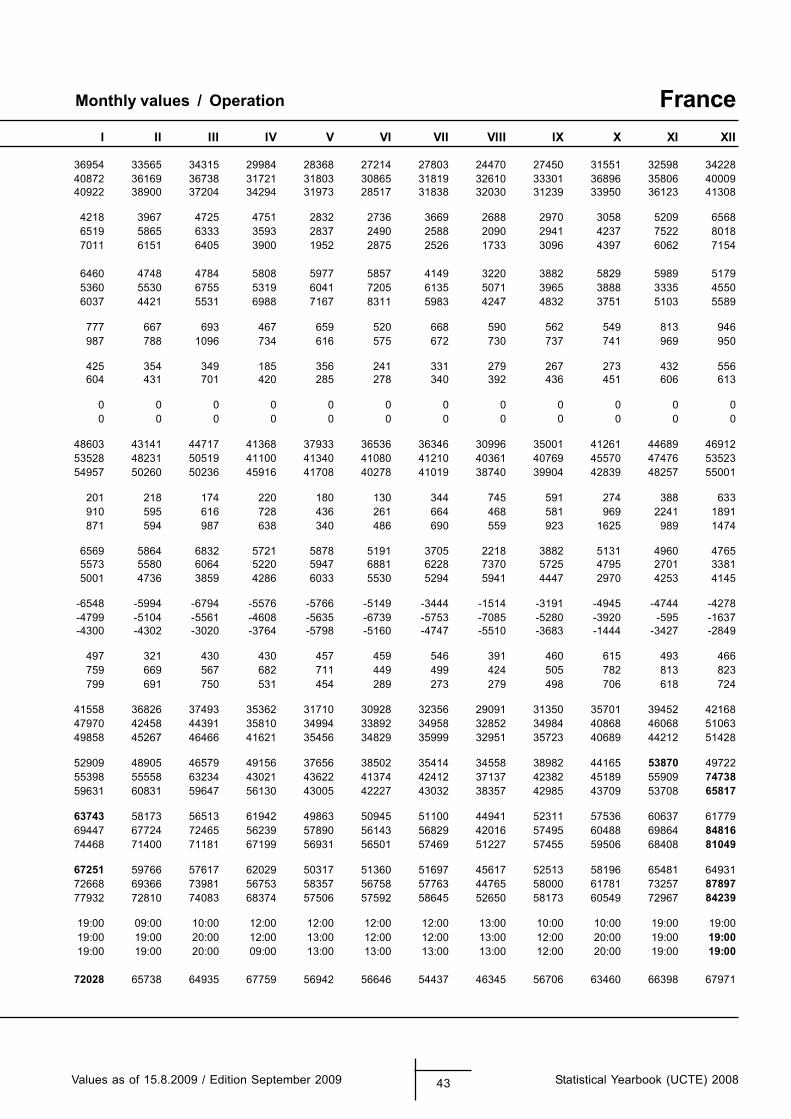
Monthly values / Operation
Values as of 15.8.2009 / Edition September 2009 43 Statistical Yearbook (UCTE) 2008
FranceI II III IV V VI VII VIII IX X XI XII
36954 33565 34315 29984 28368 27214 27803 24470 27450 31551 32598 3422840872 36169 36738 31721 31803 30865 31819 32610 33301 36896 35806 4000940922 38900 37204 34294 31973 28517 31838 32030 31239 33950 36123 41308
4218 3967 4725 4751 2832 2736 3669 2688 2970 3058 5209 65686519 5865 6333 3593 2837 2490 2588 2090 2941 4237 7522 80187011 6151 6405 3900 1952 2875 2526 1733 3096 4397 6062 7154
6460 4748 4784 5808 5977 5857 4149 3220 3882 5829 5989 51795360 5530 6755 5319 6041 7205 6135 5071 3965 3888 3335 45506037 4421 5531 6988 7167 8311 5983 4247 4832 3751 5103 5589
777 667 693 467 659 520 668 590 562 549 813 946987 788 1096 734 616 575 672 730 737 741 969 950
425 354 349 185 356 241 331 279 267 273 432 556604 431 701 420 285 278 340 392 436 451 606 613
0 0 0 0 0 0 0 0 0 0 0 00 0 0 0 0 0 0 0 0 0 0 0
48603 43141 44717 41368 37933 36536 36346 30996 35001 41261 44689 4691253528 48231 50519 41100 41340 41080 41210 40361 40769 45570 47476 5352354957 50260 50236 45916 41708 40278 41019 38740 39904 42839 48257 55001
201 218 174 220 180 130 344 745 591 274 388 633910 595 616 728 436 261 664 468 581 969 2241 1891871 594 987 638 340 486 690 559 923 1625 989 1474
6569 5864 6832 5721 5878 5191 3705 2218 3882 5131 4960 47655573 5580 6064 5220 5947 6881 6228 7370 5725 4795 2701 33815001 4736 3859 4286 6033 5530 5294 5941 4447 2970 4253 4145
-6548 -5994 -6794 -5576 -5766 -5149 -3444 -1514 -3191 -4945 -4744 -4278-4799 -5104 -5561 -4608 -5635 -6739 -5753 -7085 -5280 -3920 -595 -1637-4300 -4302 -3020 -3764 -5798 -5160 -4747 -5510 -3683 -1444 -3427 -2849
497 321 430 430 457 459 546 391 460 615 493 466759 669 567 682 711 449 499 424 505 782 813 823799 691 750 531 454 289 273 279 498 706 618 724
41558 36826 37493 35362 31710 30928 32356 29091 31350 35701 39452 4216847970 42458 44391 35810 34994 33892 34958 32852 34984 40868 46068 5106349858 45267 46466 41621 35456 34829 35999 32951 35723 40689 44212 51428
52909 48905 46579 49156 37656 38502 35414 34558 38982 44165 53870 4972255398 55558 63234 43021 43622 41374 42412 37137 42382 45189 55909 7473859631 60831 59647 56130 43005 42227 43032 38357 42985 43709 53708 65817
63743 58173 56513 61942 49863 50945 51100 44941 52311 57536 60637 6177969447 67724 72465 56239 57890 56143 56829 42016 57495 60488 69864 8481674468 71400 71181 67199 56931 56501 57469 51227 57455 59506 68408 81049
67251 59766 57617 62029 50317 51360 51697 45617 52513 58196 65481 6493172668 69366 73981 56753 58357 56758 57763 44765 58000 61781 73257 8789777932 72810 74083 68374 57506 57592 58645 52650 58173 60549 72967 84239
19:00 09:00 10:00 12:00 12:00 12:00 12:00 13:00 10:00 10:00 19:00 19:0019:00 19:00 20:00 12:00 13:00 12:00 12:00 13:00 12:00 20:00 19:00 19:0019:00 19:00 20:00 09:00 13:00 13:00 13:00 13:00 12:00 20:00 19:00 19:00
72028 65738 64935 67759 56942 56646 54437 46345 56706 63460 66398 67971
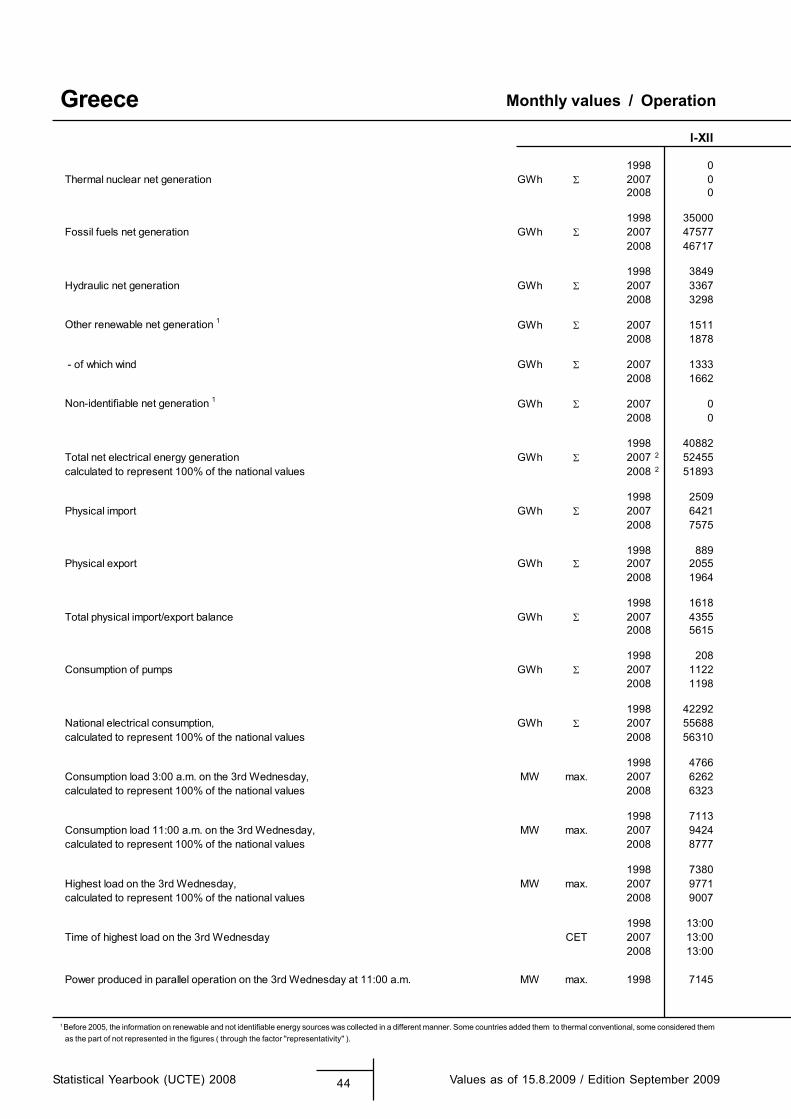
1 Before 2005, the information on renewable and not identifiable energy sources was collected in a different manner. Some countries added them to thermal conventional, some considered them as the part of not represented in the figures ( through the factor "representativity" ).
Monthly values / Operation
Statistical Yearbook (UCTE) 2008 44 Values as of 15.8.2009 / Edition September 2009
GreeceI-XII
1998 0Thermal nuclear net generation GWh 2007 0
2008 0
1998 35000Fossil fuels net generation GWh 2007 47577
2008 46717
1998 3849Hydraulic net generation GWh 2007 3367
2008 3298
Other renewable net generation 1 GWh 2007 15112008 1878
- of which wind GWh 2007 13332008 1662
Non-identifiable net generation 1 GWh 2007 02008 0
1998 40882Total net electrical energy generation GWh 2007 2 52455calculated to represent 100% of the national values 2008 2 51893
1998 2509Physical import GWh 2007 6421
2008 7575
1998 889Physical export GWh 2007 2055
2008 1964
1998 1618Total physical import/export balance GWh 2007 4355
2008 5615
1998 208Consumption of pumps GWh 2007 1122
2008 1198
1998 42292National electrical consumption, GWh 2007 55688calculated to represent 100% of the national values 2008 56310
1998 4766Consumption load 3:00 a.m. on the 3rd Wednesday, MW max. 2007 6262calculated to represent 100% of the national values 2008 6323
1998 7113Consumption load 11:00 a.m. on the 3rd Wednesday, MW max. 2007 9424calculated to represent 100% of the national values 2008 8777
1998 7380Highest load on the 3rd Wednesday, MW max. 2007 9771calculated to represent 100% of the national values 2008 9007
1998 13:00Time of highest load on the 3rd Wednesday CET 2007 13:00
2008 13:00
Power produced in parallel operation on the 3rd Wednesday at 11:00 a.m. MW max. 1998 7145
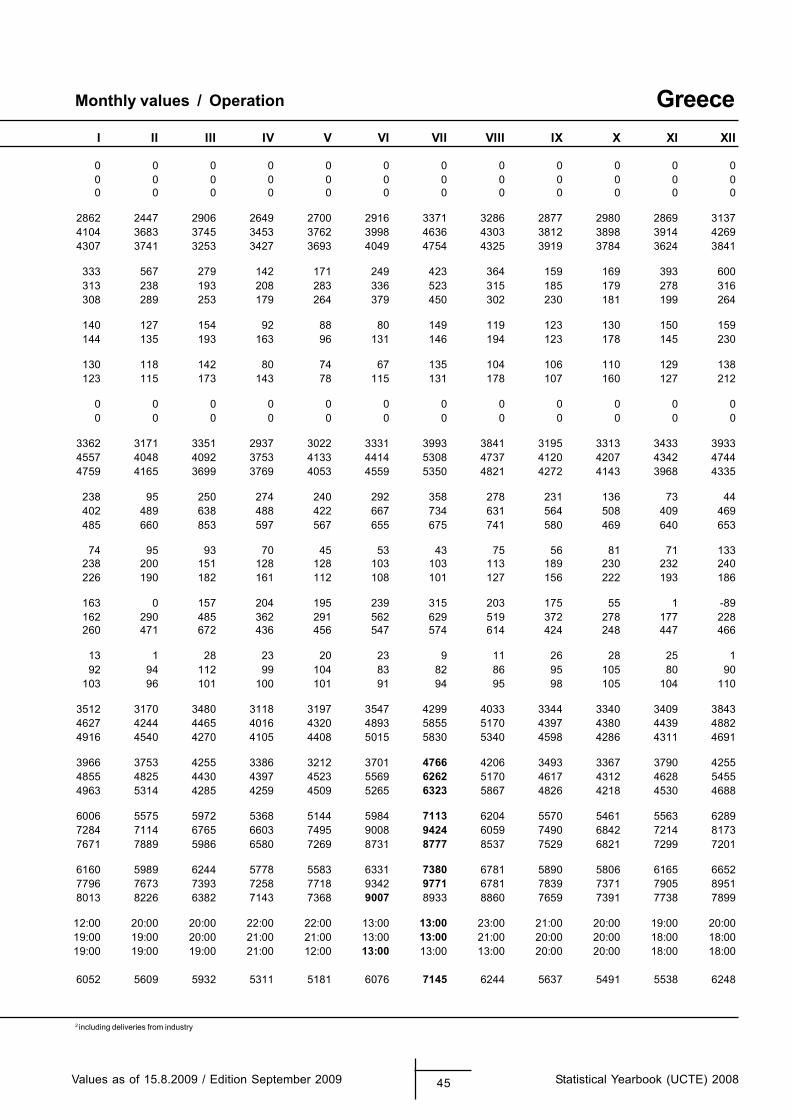
2 including deliveries from industry
Monthly values / Operation
Values as of 15.8.2009 / Edition September 2009 45 Statistical Yearbook (UCTE) 2008
GreeceI II III IV V VI VII VIII IX X XI XII
0 0 0 0 0 0 0 0 0 0 0 00 0 0 0 0 0 0 0 0 0 0 00 0 0 0 0 0 0 0 0 0 0 0
2862 2447 2906 2649 2700 2916 3371 3286 2877 2980 2869 31374104 3683 3745 3453 3762 3998 4636 4303 3812 3898 3914 42694307 3741 3253 3427 3693 4049 4754 4325 3919 3784 3624 3841
333 567 279 142 171 249 423 364 159 169 393 600313 238 193 208 283 336 523 315 185 179 278 316308 289 253 179 264 379 450 302 230 181 199 264
140 127 154 92 88 80 149 119 123 130 150 159144 135 193 163 96 131 146 194 123 178 145 230
130 118 142 80 74 67 135 104 106 110 129 138123 115 173 143 78 115 131 178 107 160 127 212
0 0 0 0 0 0 0 0 0 0 0 00 0 0 0 0 0 0 0 0 0 0 0
3362 3171 3351 2937 3022 3331 3993 3841 3195 3313 3433 39334557 4048 4092 3753 4133 4414 5308 4737 4120 4207 4342 47444759 4165 3699 3769 4053 4559 5350 4821 4272 4143 3968 4335
238 95 250 274 240 292 358 278 231 136 73 44402 489 638 488 422 667 734 631 564 508 409 469485 660 853 597 567 655 675 741 580 469 640 653
74 95 93 70 45 53 43 75 56 81 71 133238 200 151 128 128 103 103 113 189 230 232 240226 190 182 161 112 108 101 127 156 222 193 186
163 0 157 204 195 239 315 203 175 55 1 -89162 290 485 362 291 562 629 519 372 278 177 228260 471 672 436 456 547 574 614 424 248 447 466
13 1 28 23 20 23 9 11 26 28 25 192 94 112 99 104 83 82 86 95 105 80 90
103 96 101 100 101 91 94 95 98 105 104 110
3512 3170 3480 3118 3197 3547 4299 4033 3344 3340 3409 38434627 4244 4465 4016 4320 4893 5855 5170 4397 4380 4439 48824916 4540 4270 4105 4408 5015 5830 5340 4598 4286 4311 4691
3966 3753 4255 3386 3212 3701 4766 4206 3493 3367 3790 42554855 4825 4430 4397 4523 5569 6262 5170 4617 4312 4628 54554963 5314 4285 4259 4509 5265 6323 5867 4826 4218 4530 4688
6006 5575 5972 5368 5144 5984 7113 6204 5570 5461 5563 62897284 7114 6765 6603 7495 9008 9424 6059 7490 6842 7214 81737671 7889 5986 6580 7269 8731 8777 8537 7529 6821 7299 7201
6160 5989 6244 5778 5583 6331 7380 6781 5890 5806 6165 66527796 7673 7393 7258 7718 9342 9771 6781 7839 7371 7905 89518013 8226 6382 7143 7368 9007 8933 8860 7659 7391 7738 7899
12:00 20:00 20:00 22:00 22:00 13:00 13:00 23:00 21:00 20:00 19:00 20:0019:00 19:00 20:00 21:00 21:00 13:00 13:00 21:00 20:00 20:00 18:00 18:0019:00 19:00 19:00 21:00 12:00 13:00 13:00 13:00 20:00 20:00 18:00 18:00
6052 5609 5932 5311 5181 6076 7145 6244 5637 5491 5538 6248
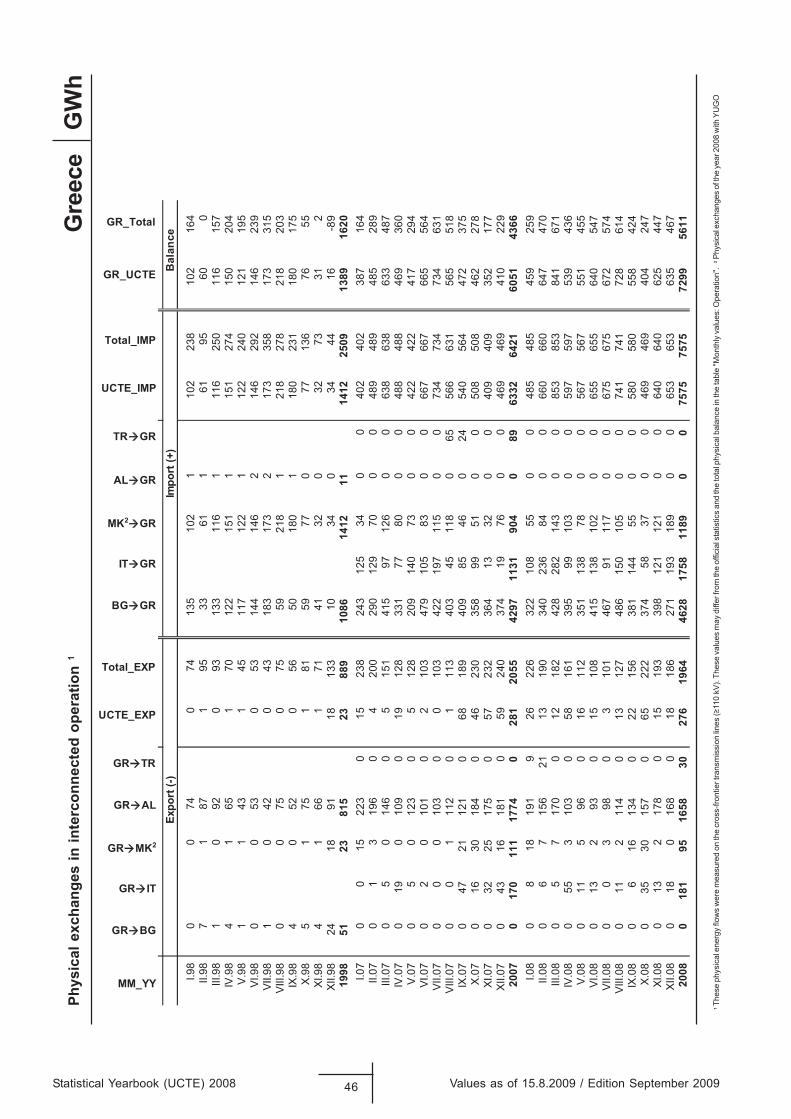
Statistical Yearbook (UCTE) 2008 46 Values as of 15.8.2009 / Edition September 2009
GW
hPh
ysic
al e
xcha
nges
in in
terc
onne
cted
ope
ratio
n 1
1
Thes
e ph
ysic
al e
nerg
y flo
ws
wer
e m
easu
red
on th
e cr
oss-
front
ier t
rans
mis
sion
lines
(≥11
0 kV
). Th
ese
valu
es m
ay d
iffer
from
the
offic
ial s
tatis
tics
and
the
tota
l phy
sica
l bal
ance
in th
e ta
ble
"Mon
thly
val
ues:
Ope
ratio
n".
Gre
ece
MM_YY
GR BG
GR IT
GR MK2
GR AL
GR TR
UCTE_EXP
Total_EXP
BG GR
IT GR
MK2 GR
AL GR
TR GR
UCTE_IMP
Total_IMP
GR_UCTE
GR_Total
ecnalaB
)+( tropmI
)-( tropxE
I.98
00
740
7413
510
21
102
238
102
164
II.98
71
871
9533
611
6195
600
III.9
81
092
093
133
116
111
625
011
615
7IV
.98
41
651
7012
215
11
151
274
150
204
V.98
11
431
4511
712
21
122
240
121
195
VI.9
80
053
053
144
146
214
629
214
623
9VI
I.98
10
420
4318
317
32
173
358
173
315
VIII.
980
075
075
5921
81
218
278
218
203
IX.9
84
052
056
5018
01
180
231
180
175
X.98
51
751
8159
770
7713
676
55XI
.98
41
661
7141
320
3273
312
XII.9
824
1891
1813
310
340
3444
16-8
919
9851
2381
523
889
1086
1412
1114
1225
0913
8916
20I.0
70
015
223
015
238
243
125
340
040
240
238
716
4II.
070
13
196
04
200
290
129
700
048
948
948
528
9III
.07
05
014
60
515
141
597
126
00
638
638
633
487
IV.0
70
190
109
019
128
331
7780
00
488
488
469
360
V.07
05
012
30
512
820
914
073
00
422
422
417
294
VI.0
70
20
101
02
103
479
105
830
066
766
766
556
4VI
I.07
00
010
30
010
342
219
711
50
073
473
473
463
1VI
II.07
00
111
20
111
340
345
118
065
566
631
565
518
IX.0
70
4721
121
068
189
409
8546
024
540
564
472
375
X.07
016
3018
40
4623
035
899
510
050
850
846
227
8XI
.07
032
2517
50
5723
236
413
320
040
940
935
217
7XI
I.07
043
1618
10
5924
037
419
760
046
946
941
022
920
070
170
111
1774
028
120
5542
9711
3190
40
8963
3264
2160
5143
66I.0
80
818
191
926
226
322
108
550
048
548
545
925
9II.
080
67
156
2113
190
340
236
840
066
066
064
747
0III
.08
05
717
00
1218
242
828
214
30
085
385
384
167
1IV
.08
055
310
30
5816
139
599
103
00
597
597
539
436
V.08
011
596
016
112
351
138
780
056
756
755
145
5VI
.08
013
293
015
108
415
138
102
00
655
655
640
547
VII.0
80
03
980
310
146
791
117
00
675
675
672
574
VIII.
080
112
114
013
127
486
150
105
00
741
741
728
614
IX.0
80
616
134
022
156
381
144
550
058
058
055
842
4X.
080
3530
157
065
222
374
5837
00
469
469
404
247
XI.0
80
132
178
015
193
398
121
121
00
640
640
625
447
XII.0
80
180
168
018
186
271
193
189
00
653
653
635
467
2008
018
195
1658
3027
619
6446
2817
5811
890
075
7575
7572
9956
11
2
Phys
ical
exc
hang
es o
f the
yea
r 200
8 w
ith Y
UG
O
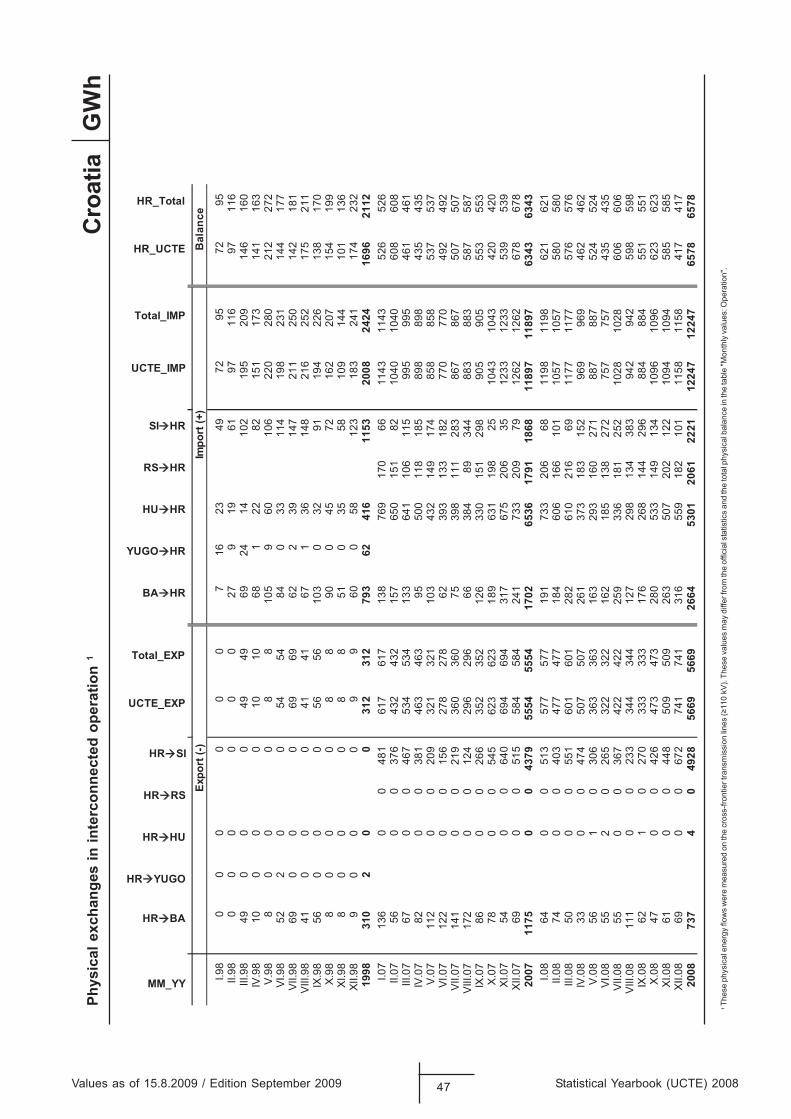
1
Thes
e ph
ysic
al e
nerg
y flo
ws
wer
e m
easu
red
on th
e cr
oss-
front
ier t
rans
mis
sion
lines
(≥11
0 kV
). Th
ese
valu
es m
ay d
iffer
from
the
offic
ial s
tatis
tics
and
the
tota
l phy
sica
l bal
ance
in th
e ta
ble
"Mon
thly
val
ues:
Ope
ratio
n".
Values as of 15.8.2009 / Edition September 2009 47 Statistical Yearbook (UCTE) 2008
GW
hPh
ysic
al e
xcha
nges
in in
terc
onne
cted
ope
ratio
n 1
Cro
atia
MM_YY
HR BA
HR YUGO
HR HU
HR RS
HR SI
UCTE_EXP
Total_EXP
BA HR
YUGO HR
HU HR
RS HR
SI HR
UCTE_IMP
Total_IMP
HR_UCTE
HR_Totalecnala
B)+( trop
mI)-( tropxE
I.98
00
00
00
716
2349
7295
7295
II.98
00
00
00
279
1961
9711
697
116
III.9
849
00
049
4969
2414
102
195
209
146
160
IV.9
810
00
010
1068
122
8215
117
314
116
3V
.98
80
00
88
105
960
106
220
280
212
272
VI.9
852
20
054
5484
033
114
198
231
144
177
VII.9
869
00
069
6962
239
147
211
250
142
181
VIII
.98
410
00
4141
671
3614
821
625
217
521
1IX
.98
560
00
5656
103
032
9119
422
613
817
0X
.98
80
00
88
900
4572
162
207
154
199
XI.9
88
00
08
851
035
5810
914
410
113
6XI
I.98
90
00
99
600
5812
318
324
117
423
219
9831
02
00
312
312
793
6241
611
5320
0824
2416
9621
12I.0
713
60
048
161
761
713
876
917
066
1143
1143
526
526
II.07
560
037
643
243
215
765
015
182
1040
1040
608
608
III.0
767
00
467
534
534
133
641
106
115
995
995
461
461
IV.0
782
00
381
463
463
9550
011
818
589
889
843
543
5V
.07
112
00
209
321
321
103
432
149
174
858
858
537
537
VI.0
712
20
015
627
827
862
393
133
182
770
770
492
492
VII.0
714
10
021
936
036
075
398
111
283
867
867
507
507
VIII
.07
172
00
124
296
296
6638
489
344
883
883
587
587
IX.0
786
00
266
352
352
126
330
151
298
905
905
553
553
X.0
778
00
545
623
623
189
631
198
2510
4310
4342
042
0XI
.07
540
064
069
469
431
767
520
635
1233
1233
539
539
XII.0
769
00
515
584
584
241
733
209
7912
6212
6267
867
820
0711
750
043
7955
5455
5417
0265
3617
9118
6811
897
1189
763
4363
43I.0
864
00
513
577
577
191
733
206
6811
9811
9862
162
1II.
0874
00
403
477
477
184
606
166
101
1057
1057
580
580
III.0
850
00
551
601
601
282
610
216
6911
7711
7757
657
6IV
.08
330
047
450
750
726
137
318
315
296
996
946
246
2V
.08
561
030
636
336
316
329
316
027
188
788
752
452
4VI
.08
552
026
532
232
216
218
513
827
275
775
743
543
5VI
I.08
550
036
742
242
225
933
618
125
210
2810
2860
660
6V
III.0
811
10
023
334
434
412
729
813
438
394
294
259
859
8IX
.08
621
027
033
333
317
626
814
429
688
488
455
155
1X
.08
470
042
647
347
328
053
314
913
410
9610
9662
362
3XI
.08
610
044
850
950
926
350
720
212
210
9410
9458
558
5XI
I.08
690
067
274
174
131
655
918
210
111
5811
5841
741
720
0873
74
049
2856
6956
6926
6453
0120
6122
2112
247
1224
765
7865
78

1 Before 2005, the information on renewable and not identifiable energy sources was collected in a different manner. Some countries added them to thermal conventional, some considered them as the part of not represented in the figures ( through the factor "representativity" ).
Monthly values / Operation
Statistical Yearbook (UCTE) 2008 48 Values as of 15.8.2009 / Edition September 2009
CroatiaI-XII
1998 0Thermal nuclear net generation GWh 2007 0
2008 0
1998 4573Fossil fuels net generation GWh 2007 6664
2008 6090
1998 5437Hydraulic net generation GWh 2007 4361
2008 5284
Other renewable net generation 1 GWh 2007 392008 44
- of which wind GWh 2007 352008 41
Non-identifiable net generation 1 GWh 2007 02008 0
1998 2 10010Total net electrical energy generation GWh 2007 2 11064calculated to represent 100% of the national values 2008 2 11418
1998 2424Physical import GWh 2007 11897
2008 12247
1998 312Physical export GWh 2007 5554
2008 5669
1998 2111Total physical import/export balance GWh 2007 6549
2008 6597
1998 13Consumption of pumps GWh 2007 233
2008 154
1998 12108National electrical consumption, GWh 2007 17380calculated to represent 100% of the national values 2008 17861
1998 1232Consumption load 3:00 a.m. on the 3rd Wednesday, MW max. 2007 1778calculated to represent 100% of the national values 2008 1675
1998 2203Consumption load 11:00 a.m. on the 3rd Wednesday, MW max. 2007 2713calculated to represent 100% of the national values 2008 2556
1998 2354Highest load on the 3rd Wednesday, MW max. 2007 3036calculated to represent 100% of the national values 2008 2839
1998 18:00Time of highest load on the 3rd Wednesday CET 2007 18:00
2008 20:00
Power produced in parallel operation on the 3rd Wednesday at 11:00 a.m. MW max. 1998 1880
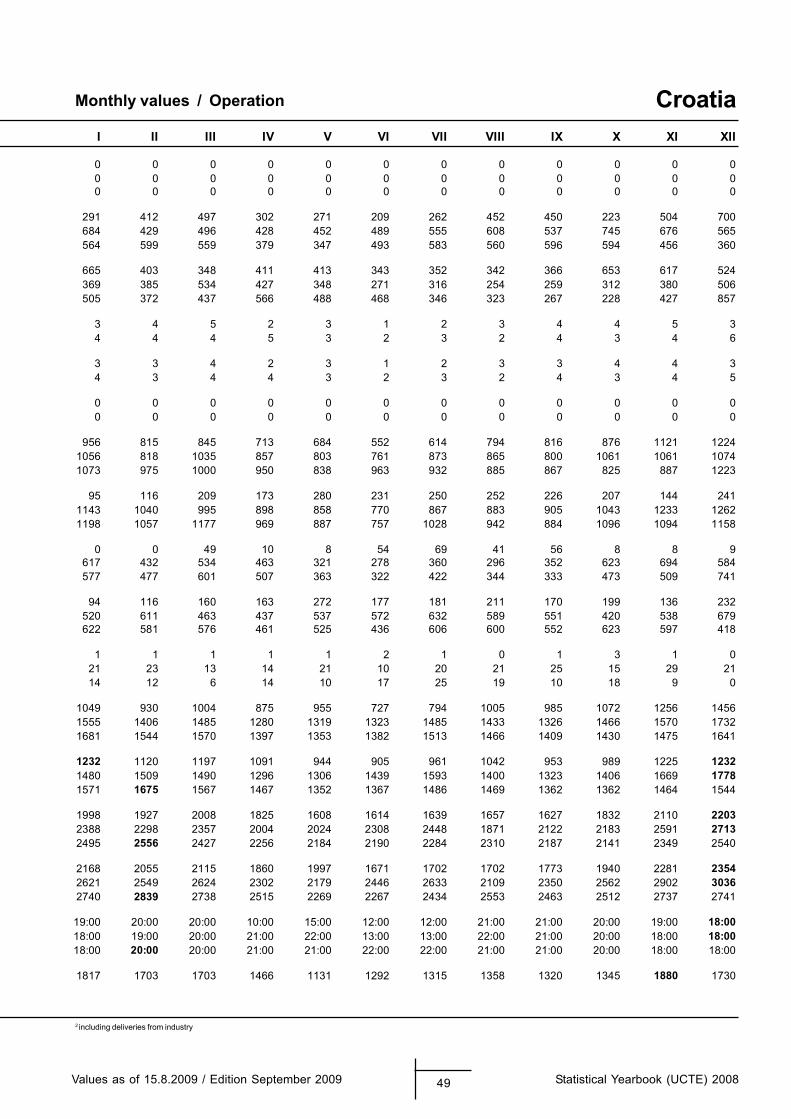
2 including deliveries from industry
Monthly values / Operation
Values as of 15.8.2009 / Edition September 2009 49 Statistical Yearbook (UCTE) 2008
CroatiaI II III IV V VI VII VIII IX X XI XII
0 0 0 0 0 0 0 0 0 0 0 00 0 0 0 0 0 0 0 0 0 0 00 0 0 0 0 0 0 0 0 0 0 0
291 412 497 302 271 209 262 452 450 223 504 700684 429 496 428 452 489 555 608 537 745 676 565564 599 559 379 347 493 583 560 596 594 456 360
665 403 348 411 413 343 352 342 366 653 617 524369 385 534 427 348 271 316 254 259 312 380 506505 372 437 566 488 468 346 323 267 228 427 857
3 4 5 2 3 1 2 3 4 4 5 34 4 4 5 3 2 3 2 4 3 4 6
3 3 4 2 3 1 2 3 3 4 4 34 3 4 4 3 2 3 2 4 3 4 5
0 0 0 0 0 0 0 0 0 0 0 00 0 0 0 0 0 0 0 0 0 0 0
956 815 845 713 684 552 614 794 816 876 1121 12241056 818 1035 857 803 761 873 865 800 1061 1061 10741073 975 1000 950 838 963 932 885 867 825 887 1223
95 116 209 173 280 231 250 252 226 207 144 2411143 1040 995 898 858 770 867 883 905 1043 1233 12621198 1057 1177 969 887 757 1028 942 884 1096 1094 1158
0 0 49 10 8 54 69 41 56 8 8 9617 432 534 463 321 278 360 296 352 623 694 584577 477 601 507 363 322 422 344 333 473 509 741
94 116 160 163 272 177 181 211 170 199 136 232520 611 463 437 537 572 632 589 551 420 538 679622 581 576 461 525 436 606 600 552 623 597 418
1 1 1 1 1 2 1 0 1 3 1 021 23 13 14 21 10 20 21 25 15 29 2114 12 6 14 10 17 25 19 10 18 9 0
1049 930 1004 875 955 727 794 1005 985 1072 1256 14561555 1406 1485 1280 1319 1323 1485 1433 1326 1466 1570 17321681 1544 1570 1397 1353 1382 1513 1466 1409 1430 1475 1641
1232 1120 1197 1091 944 905 961 1042 953 989 1225 12321480 1509 1490 1296 1306 1439 1593 1400 1323 1406 1669 17781571 1675 1567 1467 1352 1367 1486 1469 1362 1362 1464 1544
1998 1927 2008 1825 1608 1614 1639 1657 1627 1832 2110 22032388 2298 2357 2004 2024 2308 2448 1871 2122 2183 2591 27132495 2556 2427 2256 2184 2190 2284 2310 2187 2141 2349 2540
2168 2055 2115 1860 1997 1671 1702 1702 1773 1940 2281 23542621 2549 2624 2302 2179 2446 2633 2109 2350 2562 2902 30362740 2839 2738 2515 2269 2267 2434 2553 2463 2512 2737 2741
19:00 20:00 20:00 10:00 15:00 12:00 12:00 21:00 21:00 20:00 19:00 18:0018:00 19:00 20:00 21:00 22:00 13:00 13:00 22:00 21:00 20:00 18:00 18:0018:00 20:00 20:00 21:00 21:00 22:00 22:00 21:00 21:00 20:00 18:00 18:00
1817 1703 1703 1466 1131 1292 1315 1358 1320 1345 1880 1730
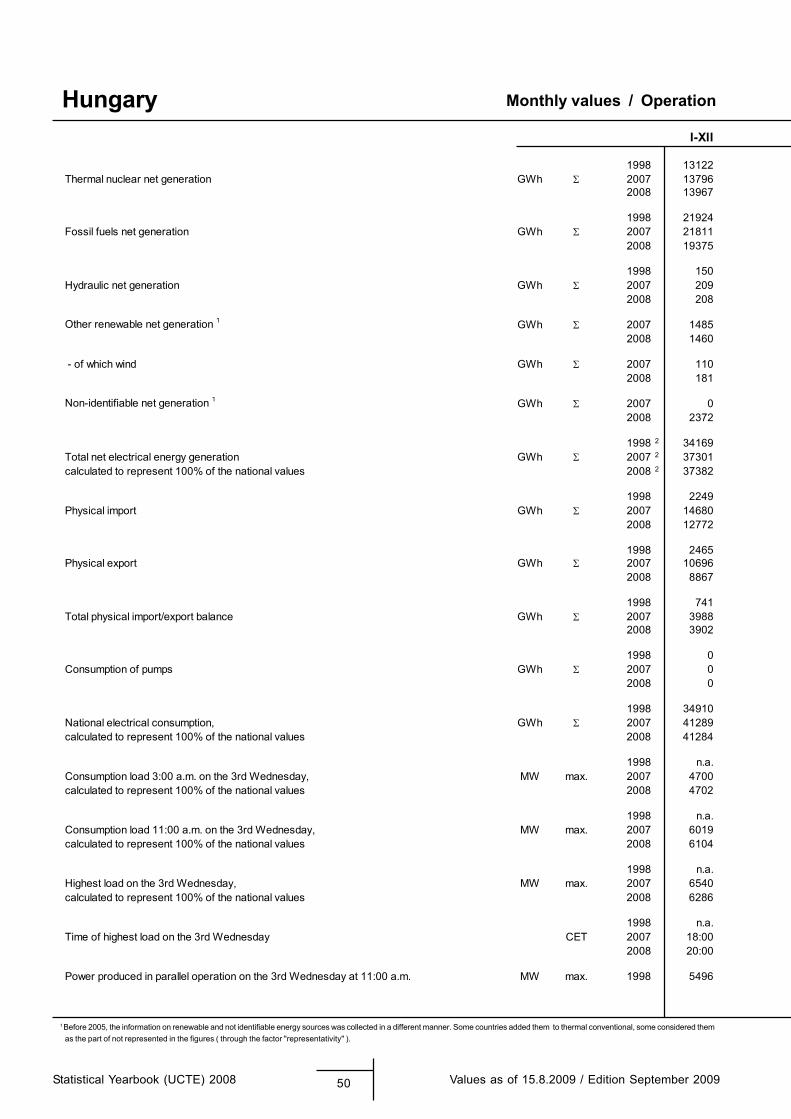
1 Before 2005, the information on renewable and not identifiable energy sources was collected in a different manner. Some countries added them to thermal conventional, some considered them as the part of not represented in the figures ( through the factor "representativity" ).
Monthly values / Operation
Statistical Yearbook (UCTE) 2008 50 Values as of 15.8.2009 / Edition September 2009
HungaryI-XII
1998 13122Thermal nuclear net generation GWh 2007 13796
2008 13967
1998 21924Fossil fuels net generation GWh 2007 21811
2008 19375
1998 150Hydraulic net generation GWh 2007 209
2008 208
Other renewable net generation 1 GWh 2007 14852008 1460
- of which wind GWh 2007 1102008 181
Non-identifiable net generation 1 GWh 2007 02008 2372
1998 2 34169Total net electrical energy generation GWh 2007 2 37301calculated to represent 100% of the national values 2008 2 37382
1998 2249Physical import GWh 2007 14680
2008 12772
1998 2465Physical export GWh 2007 10696
2008 8867
1998 741Total physical import/export balance GWh 2007 3988
2008 3902
1998 0Consumption of pumps GWh 2007 0
2008 0
1998 34910National electrical consumption, GWh 2007 41289calculated to represent 100% of the national values 2008 41284
1998 n.a.Consumption load 3:00 a.m. on the 3rd Wednesday, MW max. 2007 4700calculated to represent 100% of the national values 2008 4702
1998 n.a.Consumption load 11:00 a.m. on the 3rd Wednesday, MW max. 2007 6019calculated to represent 100% of the national values 2008 6104
1998 n.a.Highest load on the 3rd Wednesday, MW max. 2007 6540calculated to represent 100% of the national values 2008 6286
1998 n.a.Time of highest load on the 3rd Wednesday CET 2007 18:00
2008 20:00
Power produced in parallel operation on the 3rd Wednesday at 11:00 a.m. MW max. 1998 5496
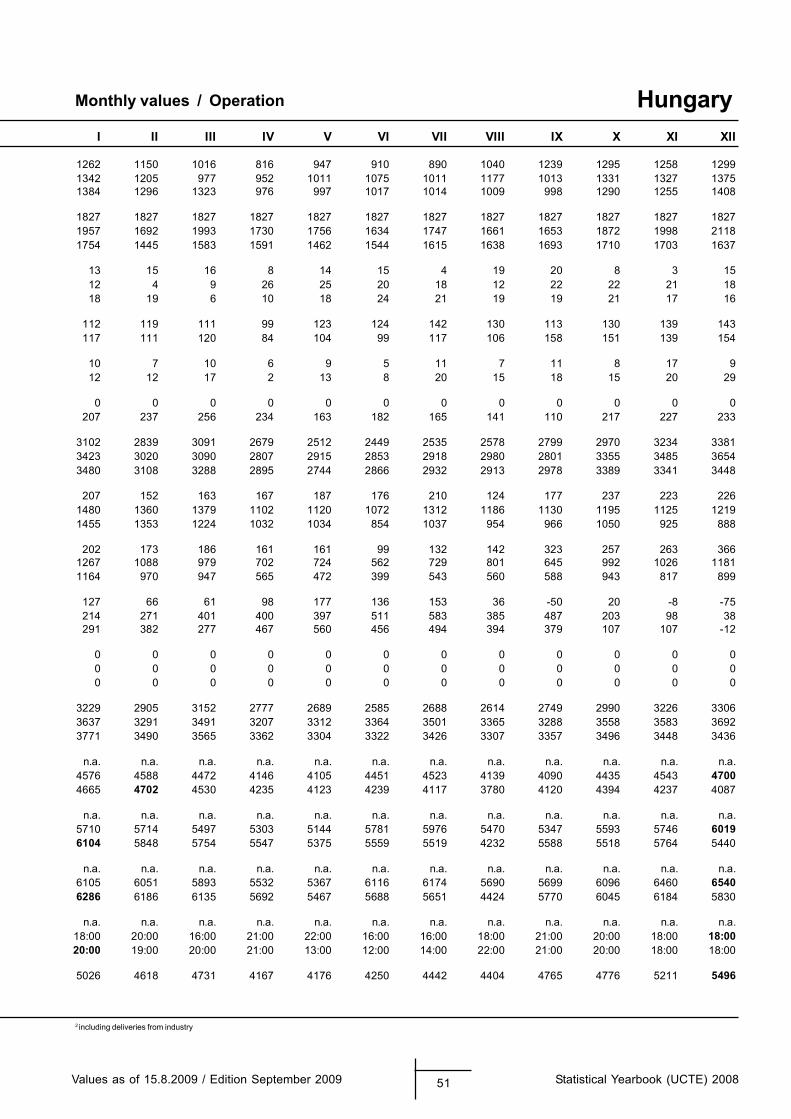
2 including deliveries from industry
Monthly values / Operation
Values as of 15.8.2009 / Edition September 2009 51 Statistical Yearbook (UCTE) 2008
HungaryI II III IV V VI VII VIII IX X XI XII
1262 1150 1016 816 947 910 890 1040 1239 1295 1258 12991342 1205 977 952 1011 1075 1011 1177 1013 1331 1327 13751384 1296 1323 976 997 1017 1014 1009 998 1290 1255 1408
1827 1827 1827 1827 1827 1827 1827 1827 1827 1827 1827 18271957 1692 1993 1730 1756 1634 1747 1661 1653 1872 1998 21181754 1445 1583 1591 1462 1544 1615 1638 1693 1710 1703 1637
13 15 16 8 14 15 4 19 20 8 3 1512 4 9 26 25 20 18 12 22 22 21 1818 19 6 10 18 24 21 19 19 21 17 16
112 119 111 99 123 124 142 130 113 130 139 143117 111 120 84 104 99 117 106 158 151 139 154
10 7 10 6 9 5 11 7 11 8 17 912 12 17 2 13 8 20 15 18 15 20 29
0 0 0 0 0 0 0 0 0 0 0 0207 237 256 234 163 182 165 141 110 217 227 233
3102 2839 3091 2679 2512 2449 2535 2578 2799 2970 3234 33813423 3020 3090 2807 2915 2853 2918 2980 2801 3355 3485 36543480 3108 3288 2895 2744 2866 2932 2913 2978 3389 3341 3448
207 152 163 167 187 176 210 124 177 237 223 2261480 1360 1379 1102 1120 1072 1312 1186 1130 1195 1125 12191455 1353 1224 1032 1034 854 1037 954 966 1050 925 888
202 173 186 161 161 99 132 142 323 257 263 3661267 1088 979 702 724 562 729 801 645 992 1026 11811164 970 947 565 472 399 543 560 588 943 817 899
127 66 61 98 177 136 153 36 -50 20 -8 -75214 271 401 400 397 511 583 385 487 203 98 38291 382 277 467 560 456 494 394 379 107 107 -12
0 0 0 0 0 0 0 0 0 0 0 00 0 0 0 0 0 0 0 0 0 0 00 0 0 0 0 0 0 0 0 0 0 0
3229 2905 3152 2777 2689 2585 2688 2614 2749 2990 3226 33063637 3291 3491 3207 3312 3364 3501 3365 3288 3558 3583 36923771 3490 3565 3362 3304 3322 3426 3307 3357 3496 3448 3436
n.a. n.a. n.a. n.a. n.a. n.a. n.a. n.a. n.a. n.a. n.a. n.a.4576 4588 4472 4146 4105 4451 4523 4139 4090 4435 4543 47004665 4702 4530 4235 4123 4239 4117 3780 4120 4394 4237 4087
n.a. n.a. n.a. n.a. n.a. n.a. n.a. n.a. n.a. n.a. n.a. n.a.5710 5714 5497 5303 5144 5781 5976 5470 5347 5593 5746 60196104 5848 5754 5547 5375 5559 5519 4232 5588 5518 5764 5440
n.a. n.a. n.a. n.a. n.a. n.a. n.a. n.a. n.a. n.a. n.a. n.a.6105 6051 5893 5532 5367 6116 6174 5690 5699 6096 6460 65406286 6186 6135 5692 5467 5688 5651 4424 5770 6045 6184 5830
n.a. n.a. n.a. n.a. n.a. n.a. n.a. n.a. n.a. n.a. n.a. n.a.18:00 20:00 16:00 21:00 22:00 16:00 16:00 18:00 21:00 20:00 18:00 18:0020:00 19:00 20:00 21:00 13:00 12:00 14:00 22:00 21:00 20:00 18:00 18:00
5026 4618 4731 4167 4176 4250 4442 4404 4765 4776 5211 5496
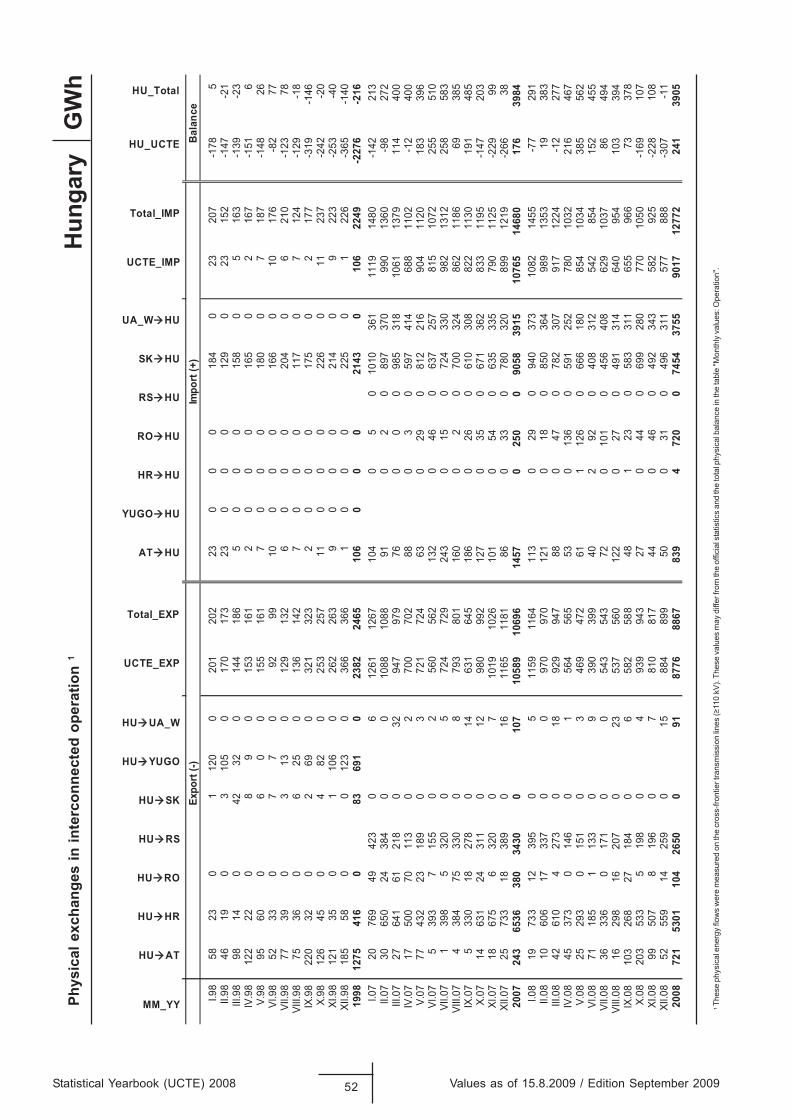
Statistical Yearbook (UCTE) 2008 52 Values as of 15.8.2009 / Edition September 2009
GW
hPh
ysic
al e
xcha
nges
in in
terc
onne
cted
ope
ratio
n 1
1
Thes
e ph
ysic
al e
nerg
y flo
ws
wer
e m
easu
red
on th
e cr
oss-
front
ier t
rans
mis
sion
lines
(≥11
0 kV
). Th
ese
valu
es m
ay d
iffer
from
the
offic
ial s
tatis
tics
and
the
tota
l phy
sica
l bal
ance
in th
e ta
ble
"Mon
thly
val
ues:
Ope
ratio
n".
Hun
gary
MM_YY
HU AT
HU HR
HU RO
HU RS
HU SK
HU YUGO
HU UA_W
UCTE_EXP
Total_EXP
AT HU
YUGO HU
HR HU
RO HU
RS HU
SK HU
UA_W HU
UCTE_IMP
Total_IMP
HU_UCTE
HU_Total
Expo
rt (-)
ecnalaB)+( trop
mI
I.98
5823
01
120
020
120
223
00
018
40
2320
7-1
785
II.98
4619
03
105
017
017
323
00
012
90
2315
2-1
47-2
1III
.98
9814
042
320
144
186
50
00
158
05
163
-139
-23
IV.9
812
222
08
90
153
161
20
00
165
02
167
-151
6V.
9895
600
60
015
516
17
00
018
00
718
7-1
4826
VI.9
852
330
77
092
9910
00
016
60
1017
6-8
277
VII.9
877
390
313
012
913
26
00
020
40
621
0-1
2378
VIII.
9875
360
625
013
614
27
00
011
70
712
4-1
29-1
8IX
.98
220
320
269
032
132
32
00
017
50
217
7-3
19-1
46X.
9812
645
04
820
253
257
110
00
226
011
237
-242
-20
XI.9
812
135
01
106
026
226
39
00
021
40
922
3-2
53-4
0XI
I.98
185
580
012
30
366
366
10
00
225
01
226
-365
-140
1998
1275
416
083
691
023
8224
6510
60
00
2143
010
622
49-2
276
-216
I.07
2076
949
423
06
1261
1267
104
05
010
1036
111
1914
80-1
4221
3II.
0730
650
2438
40
010
8810
8891
02
089
737
099
013
60-9
827
2III
.07
2764
161
218
032
947
979
760
00
985
318
1061
1379
114
400
IV.0
717
500
7011
30
270
070
288
03
059
741
468
811
02-1
240
0V.
0777
432
2318
90
372
172
463
029
081
221
690
411
2018
339
6VI
.07
539
37
155
02
560
562
132
046
063
725
781
510
7225
551
0VI
I.07
139
85
320
05
724
729
243
015
072
433
098
213
1225
858
3VI
II.07
438
475
330
08
793
801
160
02
070
032
486
211
8669
385
IX.0
75
330
1827
80
1463
164
518
60
260
610
308
822
1130
191
485
X.07
1463
124
311
012
980
992
127
035
067
136
283
311
95-1
4720
3XI
.07
1867
56
320
07
1019
1026
101
054
063
533
579
011
25-2
2999
XII.0
725
733
1838
90
1611
6511
8186
033
078
032
089
912
19-2
6638
2007
243
6536
380
3430
010
710
589
1069
614
570
250
090
5839
1510
765
1468
017
639
84I.0
819
733
1239
50
511
5911
6411
30
290
940
373
1082
1455
-77
291
II.08
1060
617
337
00
970
970
121
018
085
036
498
913
5319
383
III.0
842
610
427
30
1892
994
788
047
078
230
791
712
24-1
227
7IV
.08
4537
30
146
01
564
565
530
136
059
125
278
010
3221
646
7V.
0825
293
015
10
346
947
261
112
60
666
180
854
1034
385
562
VI.0
871
185
113
30
939
039
940
292
040
831
254
285
415
245
5VI
I.08
3633
60
171
00
543
543
720
101
045
640
862
910
3786
494
VIII.
0816
298
1620
70
2353
756
012
20
270
491
314
640
954
103
394
IX.0
810
326
827
184
06
582
588
481
230
583
311
655
966
7337
8X.
0820
353
35
198
04
939
943
270
440
699
280
770
1050
-169
107
XI.0
899
507
819
60
781
081
744
046
049
234
358
292
5-2
2810
8XI
I.08
5255
914
259
015
884
899
500
310
496
311
577
888
-307
-11
2008
721
5301
104
2650
091
8776
8867
839
472
00
7454
3755
9017
1277
224
139
05
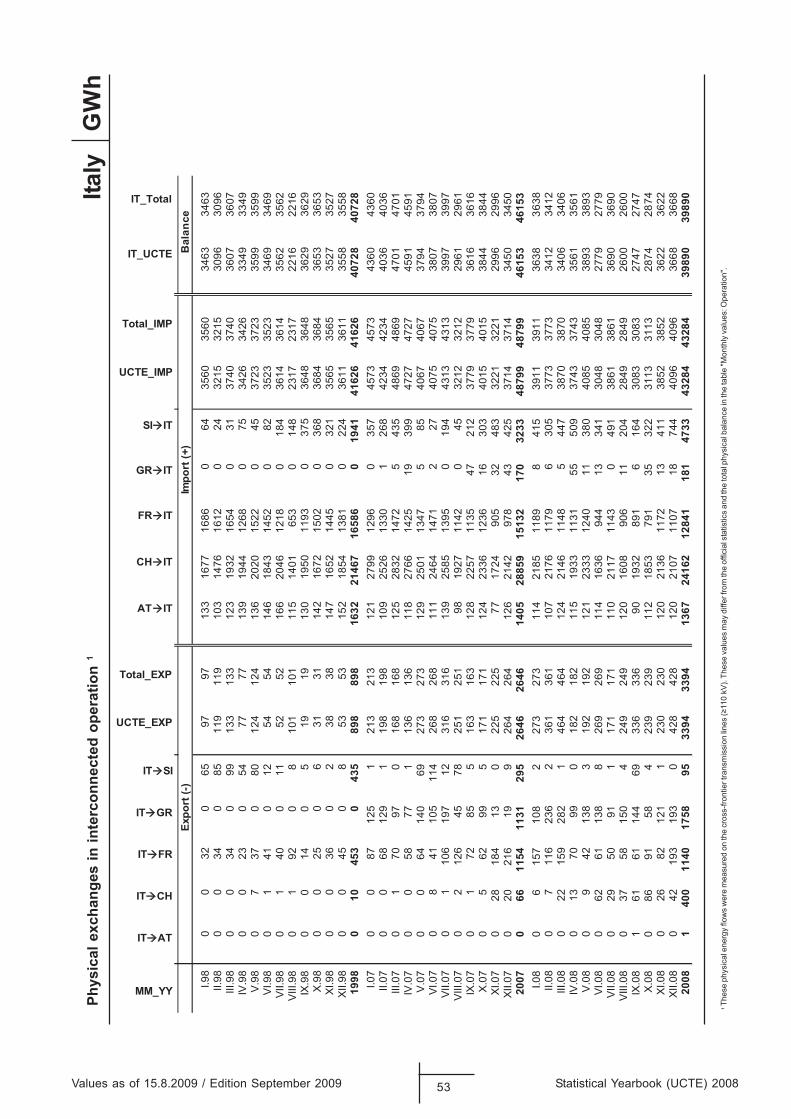
1
Thes
e ph
ysic
al e
nerg
y flo
ws
wer
e m
easu
red
on th
e cr
oss-
front
ier t
rans
mis
sion
lines
(≥11
0 kV
). Th
ese
valu
es m
ay d
iffer
from
the
offic
ial s
tatis
tics
and
the
tota
l phy
sica
l bal
ance
in th
e ta
ble
"Mon
thly
val
ues:
Ope
ratio
n".
Values as of 15.8.2009 / Edition September 2009 53 Statistical Yearbook (UCTE) 2008
GW
hPh
ysic
al e
xcha
nges
in in
terc
onne
cted
ope
ratio
n 1
Italy
MM_YY
IT AT
IT CH
IT FR
IT GR
IT SI
UCTE_EXP
Total_EXP
AT IT
CH IT
FR IT
GR IT
SI IT
UCTE_IMP
Total_IMP
IT_UCTE
IT_Totalecnala
B)+( trop
mI)-( tropxE
I.98
00
320
6597
9713
316
7716
860
6435
6035
6034
6334
63II.
980
034
085
119
119
103
1476
1612
024
3215
3215
3096
3096
III.9
80
034
099
133
133
123
1932
1654
031
3740
3740
3607
3607
IV.9
80
023
054
7777
139
1944
1268
075
3426
3426
3349
3349
V.9
80
737
080
124
124
136
2020
1522
045
3723
3723
3599
3599
VI.9
80
141
012
5454
146
1843
1452
082
3523
3523
3469
3469
VII.9
80
140
011
5252
166
2046
1218
018
436
1436
1435
6235
62V
III.9
80
192
08
101
101
115
1401
653
014
823
1723
1722
1622
16IX
.98
00
140
519
1913
019
5011
9 30
375
3648
3648
3629
3629
X.9
80
025
06
3131
142
1672
1502
036
836
8436
8436
5336
53XI
.98
00
360
238
3814
716
5214
450
321
3565
3565
3527
3527
XII.9
80
045
08
5353
152
1854
1381
022
436
1136
1135
5835
5819
980
1045
30
435
898
898
1632
2146
716
586
019
4141
626
4162
640
728
4072
8I.0
70
087
125
121
321
312
127
9912
960
357
4573
4573
4360
4360
II.07
00
6812
91
198
198
109
2526
1330
126
842
3442
3440
3640
36III
.07
01
7097
016
816
812
528
3214
725
435
4869
4869
4701
4701
IV.0
70
058
771
136
136
118
2766
1425
1939
947
2747
2745
9145
91V
.07
00
6414
069
273
273
129
2501
1347
585
4067
4067
3794
3794
VI.0
70
841
105
114
268
268
111
2464
147 1
227
4075
4075
3807
3807
VII.0
70
110
619
712
316
316
139
2585
1395
019
443
1343
1339
9739
97V
III.0
70
212
645
7825
125
198
1927
1142
045
3212
3212
2961
2961
IX.0
70
172
855
163
163
128
2257
1135
4721
237
7937
7936
1636
16X
.07
05
6299
517
117
112
423
3612
3616
303
4015
4015
3844
3844
XI.0
70
2818
413
022
522
577
1724
905
3248
332
2132
2129
9629
96XI
I.07
020
216
199
264
264
126
2142
978
4342
537
1437
1434
5034
5020
070
6611
5411
3129
526
4626
4614
0528
859
1513
217
032
3348
799
4879
946
153
4615
3I.0
80
615
710
82
273
273
114
2185
1189
841
539
1139
1136
3836
38II.
080
711
623
62
361
361
107
2176
1179
630
537
7337
7334
1234
12III
.08
022
159
282
146
446
412
421
4611
485
447
3870
3870
3406
3406
IV.0
80
1370
990
182
182
115
1933
1131
5550
937
4337
4335
6135
61V
.08
09
4213
83
192
192
121
2333
1240
1138
040
8540
8538
9338
93VI
.08
062
6113
88
269
269
114
1636
944
1334
130
4830
4827
7927
79VI
I.08
029
5091
117
117
111
021
1711
430
491
3861
3861
3690
3690
VIII
.08
037
5815
04
249
249
120
1608
906
1120
428
4928
4926
0026
00IX
.08
161
6114
469
336
336
9019
3289
16
164
3083
3083
2747
2747
X.0
80
8691
584
239
239
112
1853
791
3532
231
1331
1328
7428
74XI
.08
026
8212
11
230
230
120
2136
117 2
1341
138
5238
5236
2236
22XI
I.08
042
193
193
042
842
812
021
0711
0718
744
4096
4096
3668
3668
2008
140
011
4017
5895
3394
3394
1367
2416
212
841
181
4733
4328
443
284
3989
039
890
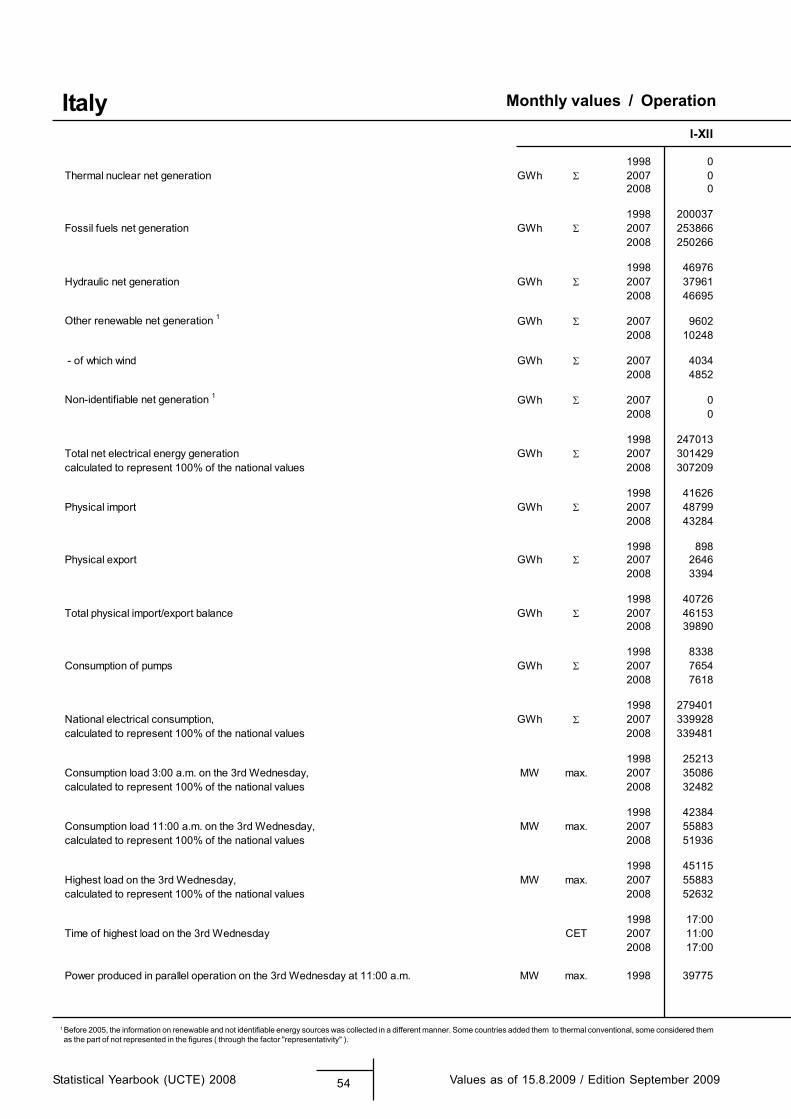
1 Before 2005, the information on renewable and not identifiable energy sources was collected in a different manner. Some countries added them to thermal conventional, some considered them as the part of not represented in the figures ( through the factor "representativity" ).
Monthly values / Operation
Statistical Yearbook (UCTE) 2008 54 Values as of 15.8.2009 / Edition September 2009
ItalyI-XII
1998 0Thermal nuclear net generation GWh 2007 0
2008 0
1998 200037Fossil fuels net generation GWh 2007 253866
2008 250266
1998 46976Hydraulic net generation GWh 2007 37961
2008 46695
Other renewable net generation 1 GWh 2007 96022008 10248
- of which wind GWh 2007 40342008 4852
Non-identifiable net generation 1 GWh 2007 02008 0
1998 247013Total net electrical energy generation GWh 2007 301429calculated to represent 100% of the national values 2008 307209
1998 41626Physical import GWh 2007 48799
2008 43284
1998 898Physical export GWh 2007 2646
2008 3394
1998 40726Total physical import/export balance GWh 2007 46153
2008 39890
1998 8338Consumption of pumps GWh 2007 7654
2008 7618
1998 279401National electrical consumption, GWh 2007 339928calculated to represent 100% of the national values 2008 339481
1998 25213Consumption load 3:00 a.m. on the 3rd Wednesday, MW max. 2007 35086calculated to represent 100% of the national values 2008 32482
1998 42384Consumption load 11:00 a.m. on the 3rd Wednesday, MW max. 2007 55883calculated to represent 100% of the national values 2008 51936
1998 45115Highest load on the 3rd Wednesday, MW max. 2007 55883calculated to represent 100% of the national values 2008 52632
1998 17:00Time of highest load on the 3rd Wednesday CET 2007 11:00
2008 17:00
Power produced in parallel operation on the 3rd Wednesday at 11:00 a.m. MW max. 1998 39775
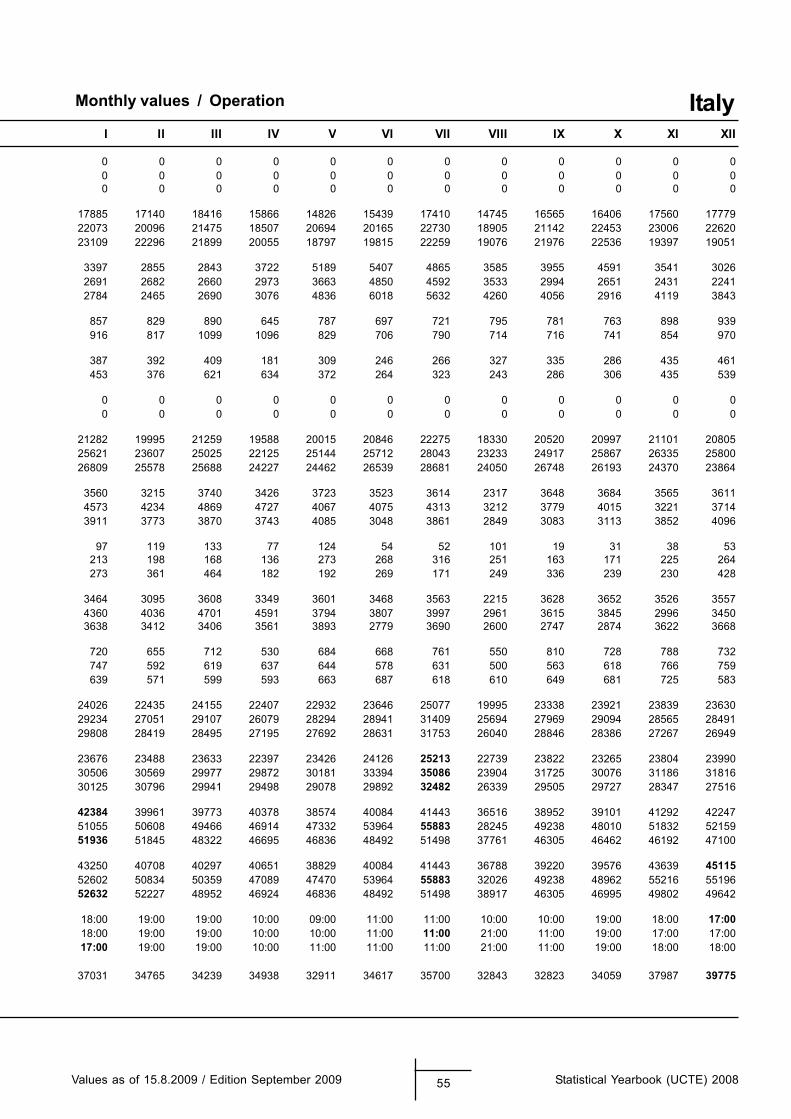
Monthly values / Operation
Values as of 15.8.2009 / Edition September 2009 55 Statistical Yearbook (UCTE) 2008
ItalyI II III IV V VI VII VIII IX X XI XII
0 0 0 0 0 0 0 0 0 0 0 00 0 0 0 0 0 0 0 0 0 0 00 0 0 0 0 0 0 0 0 0 0 0
17885 17140 18416 15866 14826 15439 17410 14745 16565 16406 17560 1777922073 20096 21475 18507 20694 20165 22730 18905 21142 22453 23006 2262023109 22296 21899 20055 18797 19815 22259 19076 21976 22536 19397 19051
3397 2855 2843 3722 5189 5407 4865 3585 3955 4591 3541 30262691 2682 2660 2973 3663 4850 4592 3533 2994 2651 2431 22412784 2465 2690 3076 4836 6018 5632 4260 4056 2916 4119 3843
857 829 890 645 787 697 721 795 781 763 898 939916 817 1099 1096 829 706 790 714 716 741 854 970
387 392 409 181 309 246 266 327 335 286 435 461453 376 621 634 372 264 323 243 286 306 435 539
0 0 0 0 0 0 0 0 0 0 0 00 0 0 0 0 0 0 0 0 0 0 0
21282 19995 21259 19588 20015 20846 22275 18330 20520 20997 21101 2080525621 23607 25025 22125 25144 25712 28043 23233 24917 25867 26335 2580026809 25578 25688 24227 24462 26539 28681 24050 26748 26193 24370 23864
3560 3215 3740 3426 3723 3523 3614 2317 3648 3684 3565 36114573 4234 4869 4727 4067 4075 4313 3212 3779 4015 3221 37143911 3773 3870 3743 4085 3048 3861 2849 3083 3113 3852 4096
97 119 133 77 124 54 52 101 19 31 38 53213 198 168 136 273 268 316 251 163 171 225 264273 361 464 182 192 269 171 249 336 239 230 428
3464 3095 3608 3349 3601 3468 3563 2215 3628 3652 3526 35574360 4036 4701 4591 3794 3807 3997 2961 3615 3845 2996 34503638 3412 3406 3561 3893 2779 3690 2600 2747 2874 3622 3668
720 655 712 530 684 668 761 550 810 728 788 732747 592 619 637 644 578 631 500 563 618 766 759639 571 599 593 663 687 618 610 649 681 725 583
24026 22435 24155 22407 22932 23646 25077 19995 23338 23921 23839 2363029234 27051 29107 26079 28294 28941 31409 25694 27969 29094 28565 2849129808 28419 28495 27195 27692 28631 31753 26040 28846 28386 27267 26949
23676 23488 23633 22397 23426 24126 25213 22739 23822 23265 23804 2399030506 30569 29977 29872 30181 33394 35086 23904 31725 30076 31186 3181630125 30796 29941 29498 29078 29892 32482 26339 29505 29727 28347 27516
42384 39961 39773 40378 38574 40084 41443 36516 38952 39101 41292 4224751055 50608 49466 46914 47332 53964 55883 28245 49238 48010 51832 5215951936 51845 48322 46695 46836 48492 51498 37761 46305 46462 46192 47100
43250 40708 40297 40651 38829 40084 41443 36788 39220 39576 43639 4511552602 50834 50359 47089 47470 53964 55883 32026 49238 48962 55216 5519652632 52227 48952 46924 46836 48492 51498 38917 46305 46995 49802 49642
18:00 19:00 19:00 10:00 09:00 11:00 11:00 10:00 10:00 19:00 18:00 17:0018:00 19:00 19:00 10:00 10:00 11:00 11:00 21:00 11:00 19:00 17:00 17:0017:00 19:00 19:00 10:00 11:00 11:00 11:00 21:00 11:00 19:00 18:00 18:00
37031 34765 34239 34938 32911 34617 35700 32843 32823 34059 37987 39775
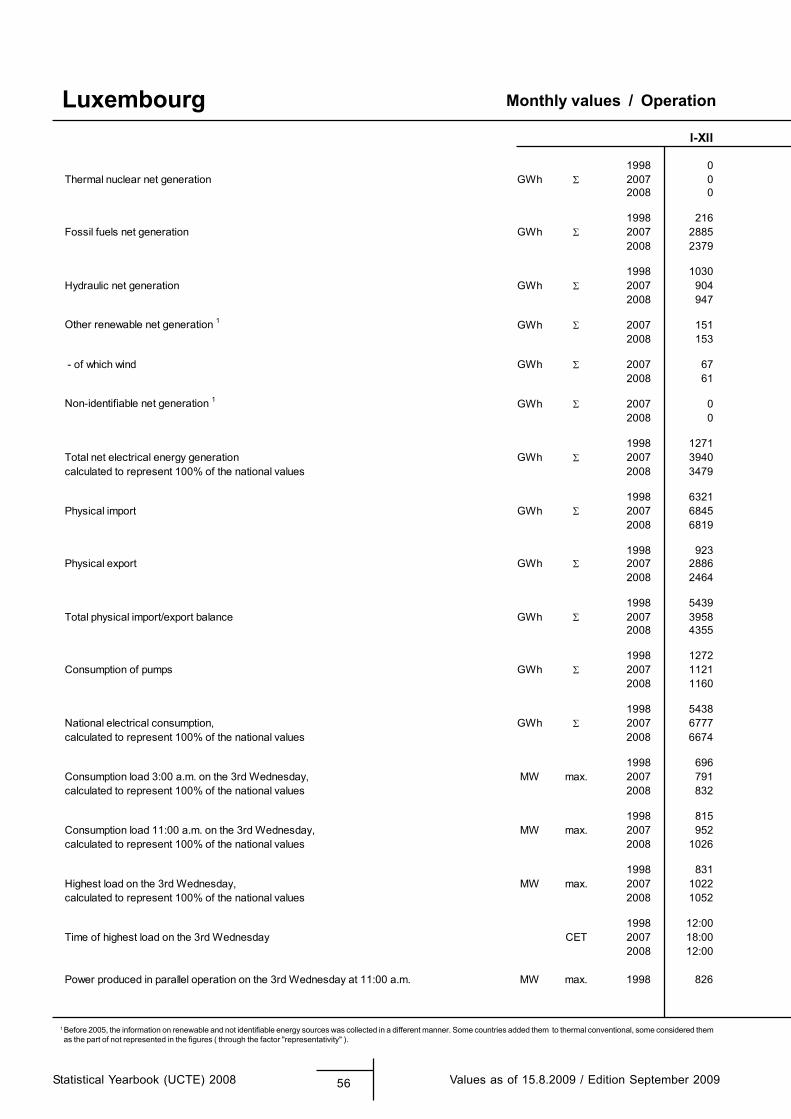
1 Before 2005, the information on renewable and not identifiable energy sources was collected in a different manner. Some countries added them to thermal conventional, some considered them as the part of not represented in the figures ( through the factor "representativity" ).
Monthly values / Operation
Statistical Yearbook (UCTE) 2008 56 Values as of 15.8.2009 / Edition September 2009
LuxembourgI-XII
1998 0Thermal nuclear net generation GWh 2007 0
2008 0
1998 216Fossil fuels net generation GWh 2007 2885
2008 2379
1998 1030Hydraulic net generation GWh 2007 904
2008 947
Other renewable net generation 1 GWh 2007 1512008 153
- of which wind GWh 2007 672008 61
Non-identifiable net generation 1 GWh 2007 02008 0
1998 1271Total net electrical energy generation GWh 2007 3940calculated to represent 100% of the national values 2008 3479
1998 6321Physical import GWh 2007 6845
2008 6819
1998 923Physical export GWh 2007 2886
2008 2464
1998 5439Total physical import/export balance GWh 2007 3958
2008 4355
1998 1272Consumption of pumps GWh 2007 1121
2008 1160
1998 5438National electrical consumption, GWh 2007 6777calculated to represent 100% of the national values 2008 6674
1998 696Consumption load 3:00 a.m. on the 3rd Wednesday, MW max. 2007 791calculated to represent 100% of the national values 2008 832
1998 815Consumption load 11:00 a.m. on the 3rd Wednesday, MW max. 2007 952calculated to represent 100% of the national values 2008 1026
1998 831Highest load on the 3rd Wednesday, MW max. 2007 1022calculated to represent 100% of the national values 2008 1052
1998 12:00Time of highest load on the 3rd Wednesday CET 2007 18:00
2008 12:00
Power produced in parallel operation on the 3rd Wednesday at 11:00 a.m. MW max. 1998 826
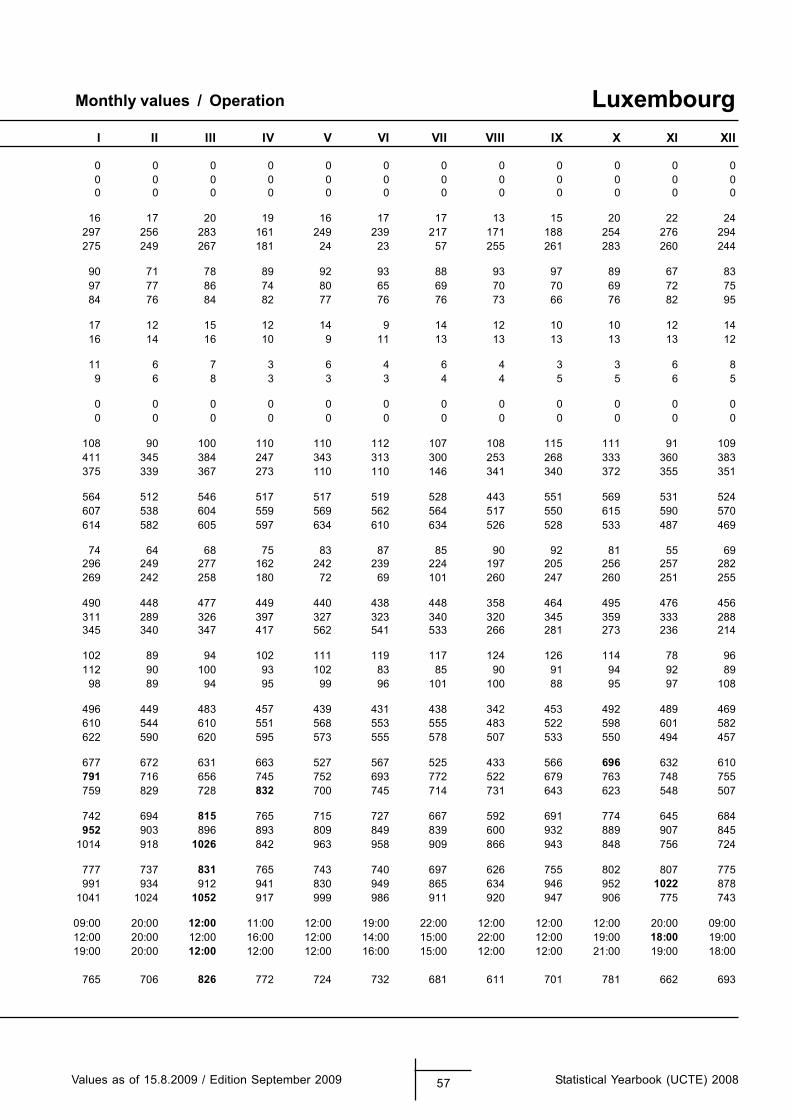
Monthly values / Operation
Values as of 15.8.2009 / Edition September 2009 57 Statistical Yearbook (UCTE) 2008
LuxembourgI II III IV V VI VII VIII IX X XI XII
0 0 0 0 0 0 0 0 0 0 0 00 0 0 0 0 0 0 0 0 0 0 00 0 0 0 0 0 0 0 0 0 0 0
16 17 20 19 16 17 17 13 15 20 22 24297 256 283 161 249 239 217 171 188 254 276 294275 249 267 181 24 23 57 255 261 283 260 244
90 71 78 89 92 93 88 93 97 89 67 8397 77 86 74 80 65 69 70 70 69 72 7584 76 84 82 77 76 76 73 66 76 82 95
17 12 15 12 14 9 14 12 10 10 12 1416 14 16 10 9 11 13 13 13 13 13 12
11 6 7 3 6 4 6 4 3 3 6 89 6 8 3 3 3 4 4 5 5 6 5
0 0 0 0 0 0 0 0 0 0 0 00 0 0 0 0 0 0 0 0 0 0 0
108 90 100 110 110 112 107 108 115 111 91 109411 345 384 247 343 313 300 253 268 333 360 383375 339 367 273 110 110 146 341 340 372 355 351
564 512 546 517 517 519 528 443 551 569 531 524607 538 604 559 569 562 564 517 550 615 590 570614 582 605 597 634 610 634 526 528 533 487 469
74 64 68 75 83 87 85 90 92 81 55 69296 249 277 162 242 239 224 197 205 256 257 282269 242 258 180 72 69 101 260 247 260 251 255
490 448 477 449 440 438 448 358 464 495 476 456311 289 326 397 327 323 340 320 345 359 333 288345 340 347 417 562 541 533 266 281 273 236 214
102 89 94 102 111 119 117 124 126 114 78 96112 90 100 93 102 83 85 90 91 94 92 89
98 89 94 95 99 96 101 100 88 95 97 108
496 449 483 457 439 431 438 342 453 492 489 469610 544 610 551 568 553 555 483 522 598 601 582622 590 620 595 573 555 578 507 533 550 494 457
677 672 631 663 527 567 525 433 566 696 632 610791 716 656 745 752 693 772 522 679 763 748 755759 829 728 832 700 745 714 731 643 623 548 507
742 694 815 765 715 727 667 592 691 774 645 684952 903 896 893 809 849 839 600 932 889 907 845
1014 918 1026 842 963 958 909 866 943 848 756 724
777 737 831 765 743 740 697 626 755 802 807 775991 934 912 941 830 949 865 634 946 952 1022 878
1041 1024 1052 917 999 986 911 920 947 906 775 743
09:00 20:00 12:00 11:00 12:00 19:00 22:00 12:00 12:00 12:00 20:00 09:0012:00 20:00 12:00 16:00 12:00 14:00 15:00 22:00 12:00 19:00 18:00 19:0019:00 20:00 12:00 12:00 12:00 16:00 15:00 12:00 12:00 21:00 19:00 18:00
765 706 826 772 724 732 681 611 701 781 662 693
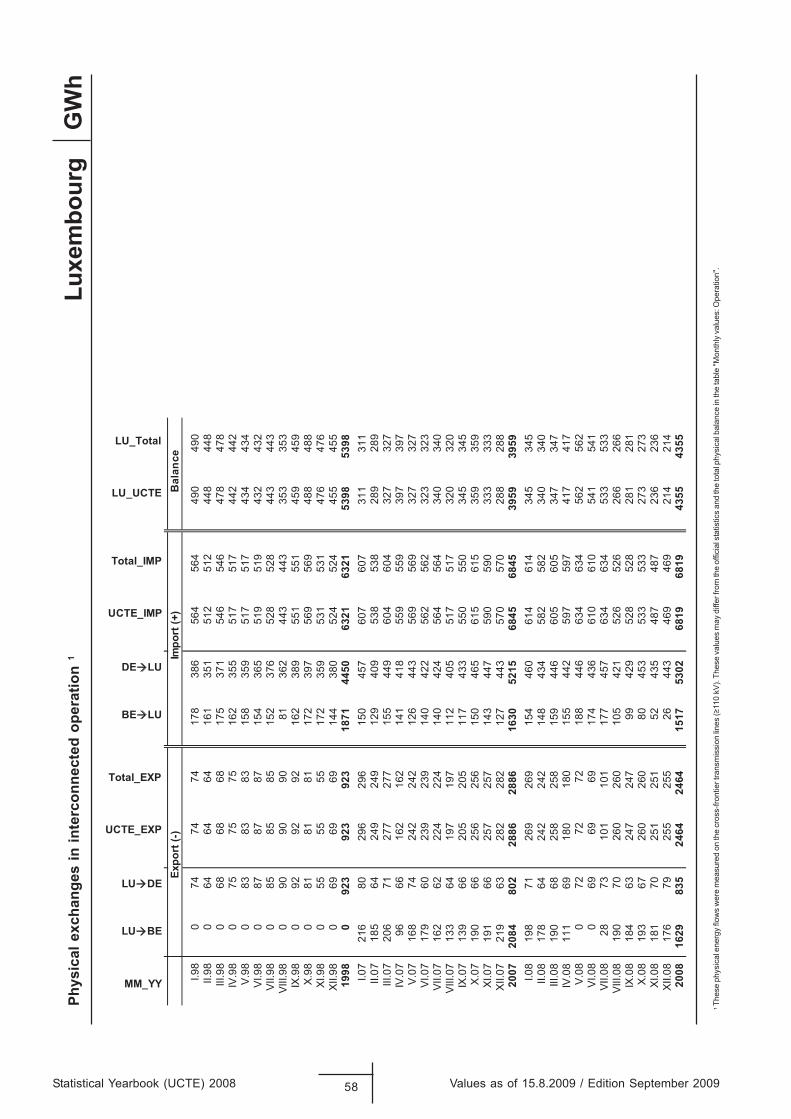
Statistical Yearbook (UCTE) 2008 58 Values as of 15.8.2009 / Edition September 2009
GW
hPh
ysic
al e
xcha
nges
in in
terc
onne
cted
ope
ratio
n 1
1
Thes
e ph
ysic
al e
nerg
y flo
ws
wer
e m
easu
red
on th
e cr
oss-
front
ier t
rans
mis
sion
lines
(≥11
0 kV
). Th
ese
valu
es m
ay d
iffer
from
the
offic
ial s
tatis
tics
and
the
tota
l phy
sica
l bal
ance
in th
e ta
ble
"Mon
thly
val
ues:
Ope
ratio
n".
Luxe
mbo
urg
MM_YY
LU BE
LU DE
UCTE_EXP
Total_EXP
BE LU
DE LU
UCTE_IMP
Total_IMP
LU_UCTE
LU_Total
ecnalaB
)+( tropmI
)-( tropxE
I.98
074
7474
178
386
564
564
490
490
II.98
064
6464
161
351
512
512
448
448
III.9
80
6868
6817
537
154
654
647
847
8IV
.98
075
7575
162
355
517
517
442
442
V.98
083
8383
158
359
517
517
434
434
VI.9
80
8787
8715
436
551
951
943
243
2VI
I.98
085
8585
152
376
528
528
443
443
VIII.
980
9090
9081
362
443
443
353
353
IX.9
80
9292
9216
238
955
155
145
945
9X.
980
8181
8117
239
756
956
948
848
8XI
.98
055
5555
172
359
531
531
476
476
XII.9
80
6969
6914
438
052
452
445
545
519
980
923
923
923
1871
4450
6321
6321
5398
5398
I.07
216
8029
629
615
045
760
760
731
131
1II.
0718
564
249
249
129
409
538
538
289
289
III.0
720
671
277
277
155
449
604
604
327
327
IV.0
796
6616
216
214
141
855
955
939
739
7V.
0716
874
242
242
126
443
569
569
327
327
VI.0
717
960
239
239
140
422
562
562
323
323
VII.0
716
262
224
224
140
424
564
564
340
340
VIII.
0713
364
197
197
112
405
517
517
320
320
IX.0
713
966
205
205
117
433
550
550
345
345
X.07
190
6625
625
615
046
561
561
535
935
9XI
.07
191
6625
725
714
344
759
059
033
333
3XI
I.07
219
6328
228
212
744
357
057
028
828
820
0720
8480
228
8628
8616
3052
1568
4568
4539
5939
59I.0
819
871
269
269
154
460
614
614
345
345
II.08
178
6424
224
214
843
458
258
234
034
0III
.08
190
6825
825
815
944
660
560
534
734
7IV
.08
111
6918
018
015
544
259
759
741
741
7V.
080
7272
7218
844
663
463
456
256
2VI
.08
069
6969
174
436
610
610
541
541
VII.0
828
7310
110
117
745
763
463
453
353
3VI
II.08
190
7026
026
010
542
152
652
626
626
6IX
.08
184
6324
724
799
429
528
528
281
281
X.08
193
6726
026
080
453
533
533
273
273
XI.0
818
170
251
251
5243
548
748
723
623
6XI
I.08
176
7925
525
526
443
469
469
214
214
2008
1629
835
2464
2464
1517
5302
6819
6819
4355
4355
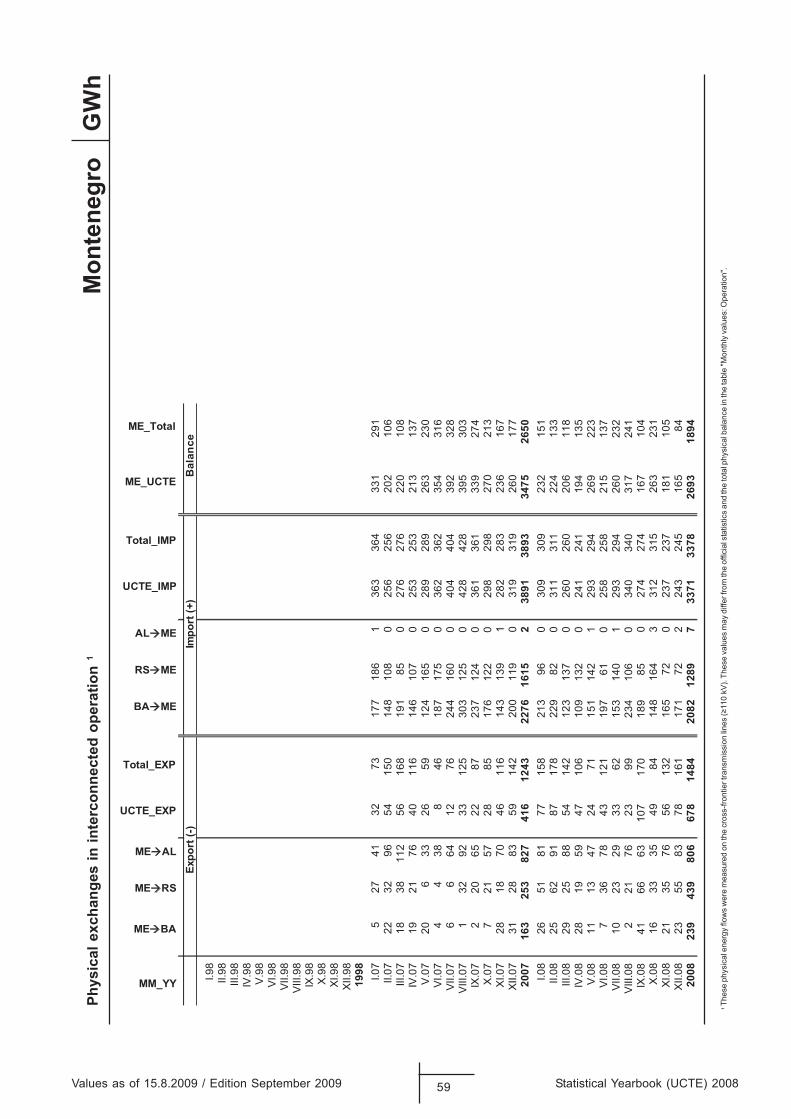
1
Thes
e ph
ysic
al e
nerg
y flo
ws
wer
e m
easu
red
on th
e cr
oss-
front
ier t
rans
mis
sion
lines
(≥11
0 kV
). Th
ese
valu
es m
ay d
iffer
from
the
offic
ial s
tatis
tics
and
the
tota
l phy
sica
l bal
ance
in th
e ta
ble
"Mon
thly
val
ues:
Ope
ratio
n".
Values as of 15.8.2009 / Edition September 2009 59 Statistical Yearbook (UCTE) 2008
GW
hPh
ysic
al e
xcha
nges
in in
terc
onne
cted
ope
ratio
n 1
Mon
tene
gro
MM_YY
ME BA
ME RS
ME AL
UCTE_EXP
Total_EXP
BA ME
RS ME
AL ME
UCTE_IMP
Total_IMP
ME_UCTE
ME_Total
I.98
II.98
III.9
8IV
.98
V.9
8VI
.98
VII.
98V
III.9
8IX
.98
X.9
8XI
.98
XII.
9819
98 I.07
527
4132
7317
718
61
363
364
331
291
II.07
2232
9654
150
148
108
025
625
620
210
6III
.07
1838
112
5616
819
185
027
627
622
010
8IV
.07
1921
7640
116
146
107
025
325
321
313
7V
.07
206
3326
5912
416
50
289
289
263
230
VI.0
74
438
846
187
175
036
236
235
431
6VI
I.07
66
6412
7624
416
00
404
404
392
328
VIII
.07
132
9233
125
303
125
042
842
839
530
3IX
.07
220
6522
8723
712
40
361
361
339
274
X.0
77
2157
2885
176
122
029
829
827
021
3XI
.07
2818
7046
116
143
139
128
228
323
616
7XI
I.07
3128
8359
142
200
119
031
931
926
017
720
0716
325
382
741
612
4322
7616
152
3891
3893
3475
2650
I.08
2651
8177
158
213
960
309
309
232
151
II.08
2562
9187
178
229
820
311
311
224
133
III.0
829
2588
5414
212
313
70
260
260
206
118
IV.0
828
1959
4710
610
913
20
241
241
194
135
V.0
811
1347
2471
151
142
129
329
426
922
3VI
.08
736
7843
121
197
610
258
258
215
137
VII.0
810
2329
3362
153
140
129
329
426
023
2V
III.0
82
2176
2399
234
106
034
034
031
724
1IX
.08
4166
6310
717
018
985
027
427
416
710
4X
.08
1633
3549
8414
816
43
312
315
263
231
XI.0
821
3576
5613
216
572
023
723
718
110
5XI
I.08
2355
8378
161
171
722
243
245
165
8420
0823
943
980
667
814
8420
8212
897
3371
3378
2693
1894
ecnalaB
)+( tropmI
)-( tropxE
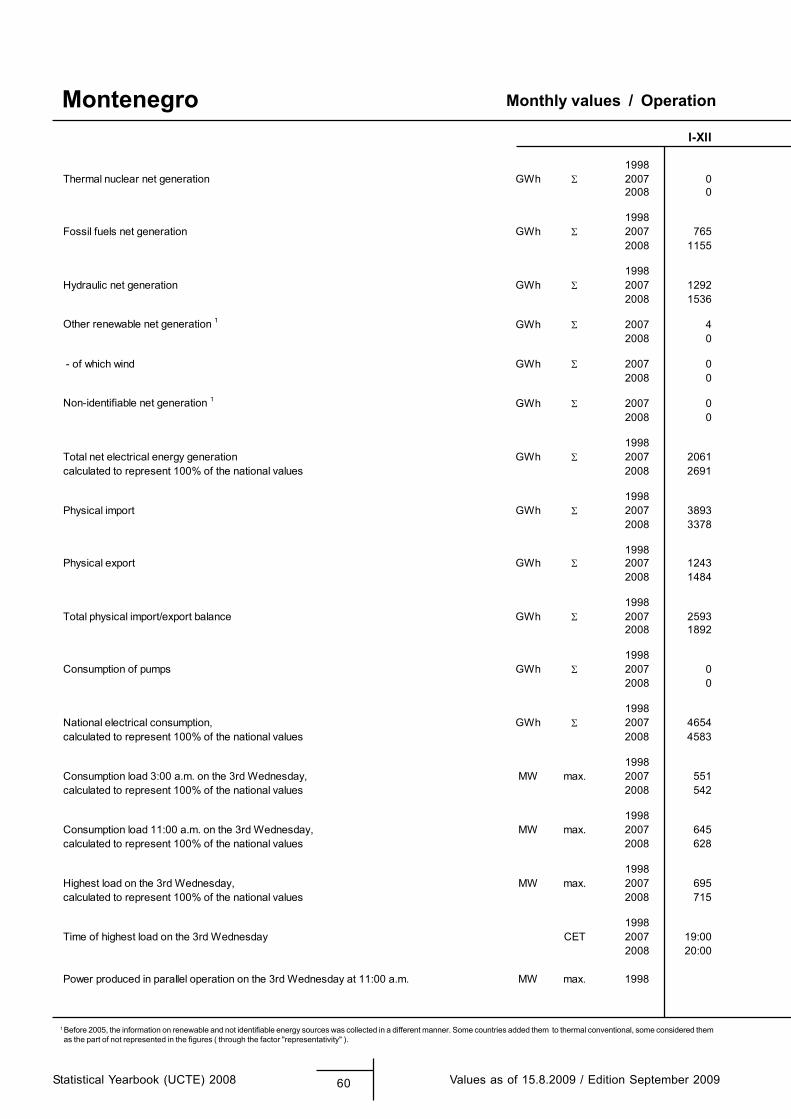
1 Before 2005, the information on renewable and not identifiable energy sources was collected in a different manner. Some countries added them to thermal conventional, some considered them as the part of not represented in the figures ( through the factor "representativity" ).
Monthly values / Operation
Statistical Yearbook (UCTE) 2008 60 Values as of 15.8.2009 / Edition September 2009
MontenegroI-XII
1998Thermal nuclear net generation GWh 2007 0
2008 0
1998Fossil fuels net generation GWh 2007 765
2008 1155
1998Hydraulic net generation GWh 2007 1292
2008 1536
Other renewable net generation 1 GWh 2007 42008 0
- of which wind GWh 2007 02008 0
Non-identifiable net generation 1 GWh 2007 02008 0
1998Total net electrical energy generation GWh 2007 2061calculated to represent 100% of the national values 2008 2691
1998Physical import GWh 2007 3893
2008 3378
1998Physical export GWh 2007 1243
2008 1484
1998Total physical import/export balance GWh 2007 2593
2008 1892
1998Consumption of pumps GWh 2007 0
2008 0
1998National electrical consumption, GWh 2007 4654calculated to represent 100% of the national values 2008 4583
1998Consumption load 3:00 a.m. on the 3rd Wednesday, MW max. 2007 551calculated to represent 100% of the national values 2008 542
1998Consumption load 11:00 a.m. on the 3rd Wednesday, MW max. 2007 645calculated to represent 100% of the national values 2008 628
1998Highest load on the 3rd Wednesday, MW max. 2007 695calculated to represent 100% of the national values 2008 715
1998Time of highest load on the 3rd Wednesday CET 2007 19:00
2008 20:00
Power produced in parallel operation on the 3rd Wednesday at 11:00 a.m. MW max. 1998
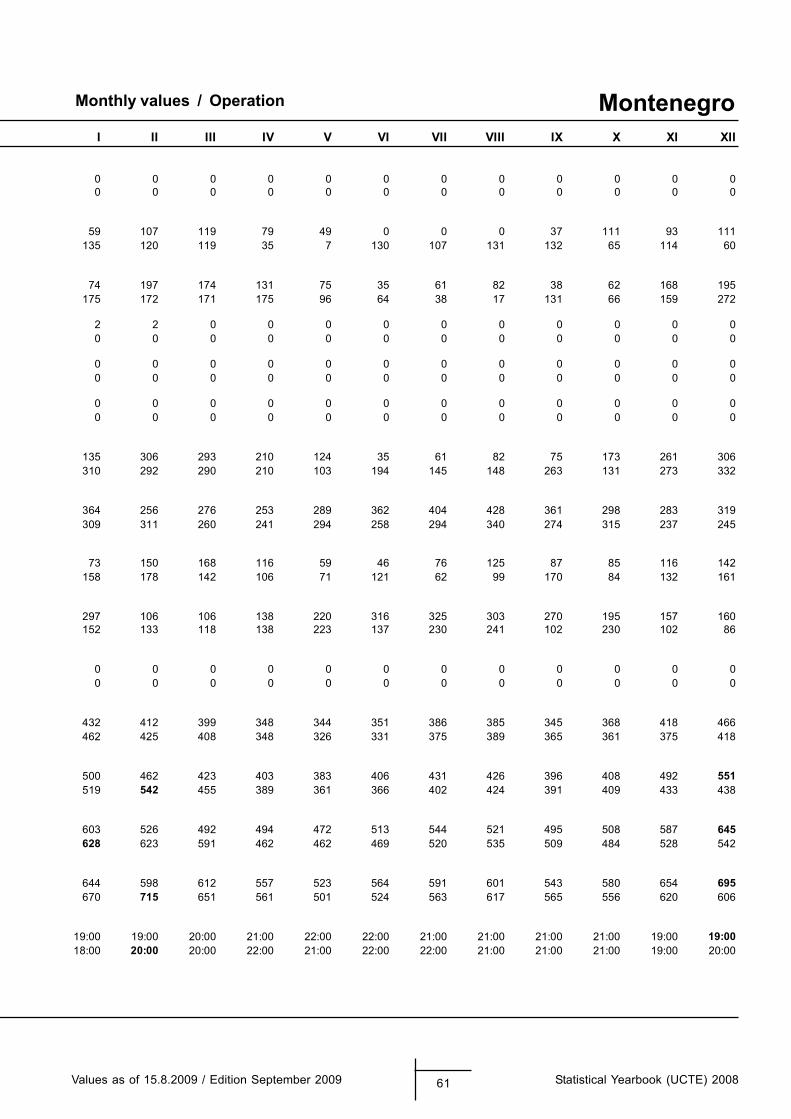
Monthly values / Operation
Values as of 15.8.2009 / Edition September 2009 61 Statistical Yearbook (UCTE) 2008
MontenegroI II III IV V VI VII VIII IX X XI XII
0 0 0 0 0 0 0 0 0 0 0 00 0 0 0 0 0 0 0 0 0 0 0
59 107 119 79 49 0 0 0 37 111 93 111135 120 119 35 7 130 107 131 132 65 114 60
74 197 174 131 75 35 61 82 38 62 168 195175 172 171 175 96 64 38 17 131 66 159 272
2 2 0 0 0 0 0 0 0 0 0 00 0 0 0 0 0 0 0 0 0 0 0
0 0 0 0 0 0 0 0 0 0 0 00 0 0 0 0 0 0 0 0 0 0 0
0 0 0 0 0 0 0 0 0 0 0 00 0 0 0 0 0 0 0 0 0 0 0
135 306 293 210 124 35 61 82 75 173 261 306310 292 290 210 103 194 145 148 263 131 273 332
364 256 276 253 289 362 404 428 361 298 283 319309 311 260 241 294 258 294 340 274 315 237 245
73 150 168 116 59 46 76 125 87 85 116 142158 178 142 106 71 121 62 99 170 84 132 161
297 106 106 138 220 316 325 303 270 195 157 160152 133 118 138 223 137 230 241 102 230 102 86
0 0 0 0 0 0 0 0 0 0 0 00 0 0 0 0 0 0 0 0 0 0 0
432 412 399 348 344 351 386 385 345 368 418 466462 425 408 348 326 331 375 389 365 361 375 418
500 462 423 403 383 406 431 426 396 408 492 551519 542 455 389 361 366 402 424 391 409 433 438
603 526 492 494 472 513 544 521 495 508 587 645628 623 591 462 462 469 520 535 509 484 528 542
644 598 612 557 523 564 591 601 543 580 654 695670 715 651 561 501 524 563 617 565 556 620 606
19:00 19:00 20:00 21:00 22:00 22:00 21:00 21:00 21:00 21:00 19:00 19:0018:00 20:00 20:00 22:00 21:00 22:00 22:00 21:00 21:00 21:00 19:00 20:00

1 Before 2005, the information on renewable and not identifiable energy sources was collected in a different manner. Some countries added them to thermal conventional, some considered them as the part of not represented in the figures ( through the factor "representativity" ).
Monthly values / Operation
Statistical Yearbook (UCTE) 2008 62 Values as of 15.8.2009 / Edition September 2009
FYROMI-XII
1998 n.a.Thermal nuclear net generation GWh 2007 0
2008 0
1998 n.a.Fossil fuels net generation GWh 2007 5016
2008 4982
1998 n.a.Hydraulic net generation GWh 2007 1054
2008 881
Other renewable net generation 1 GWh 2007 02008 0
- of which wind GWh 2007 02008 0
Non-identifiable net generation 1 GWh 2007 02008 0
1998 n.a.Total net electrical energy generation GWh 2007 6070calculated to represent 100% of the national values 2008 5863
1998 n.a.Physical import GWh 2007 3388
2008 3920
1998 n.a.Physical export GWh 2007 905
2008 1203
1998 n.a.Total physical import/export balance GWh 2007 2496
2008 2780
1998 n.a.Consumption of pumps GWh 2007 0
2008 0
1998 n.a.National electrical consumption, GWh 2007 8566calculated to represent 100% of the national values 2008 8643
1998 n.a.Consumption load 3:00 a.m. on the 3rd Wednesday, MW max. 2007 1080calculated to represent 100% of the national values 2008 1006
1998 n.a.Consumption load 11:00 a.m. on the 3rd Wednesday, MW max. 2007 1386calculated to represent 100% of the national values 2008 1285
1998 n.a.Highest load on the 3rd Wednesday, MW max. 2007 1556calculated to represent 100% of the national values 2008 1431
1998 n.a.Time of highest load on the 3rd Wednesday CET 2007 18:00
2008 18:00
Power produced in parallel operation on the 3rd Wednesday at 11:00 a.m. MW max. 1998 n.a.
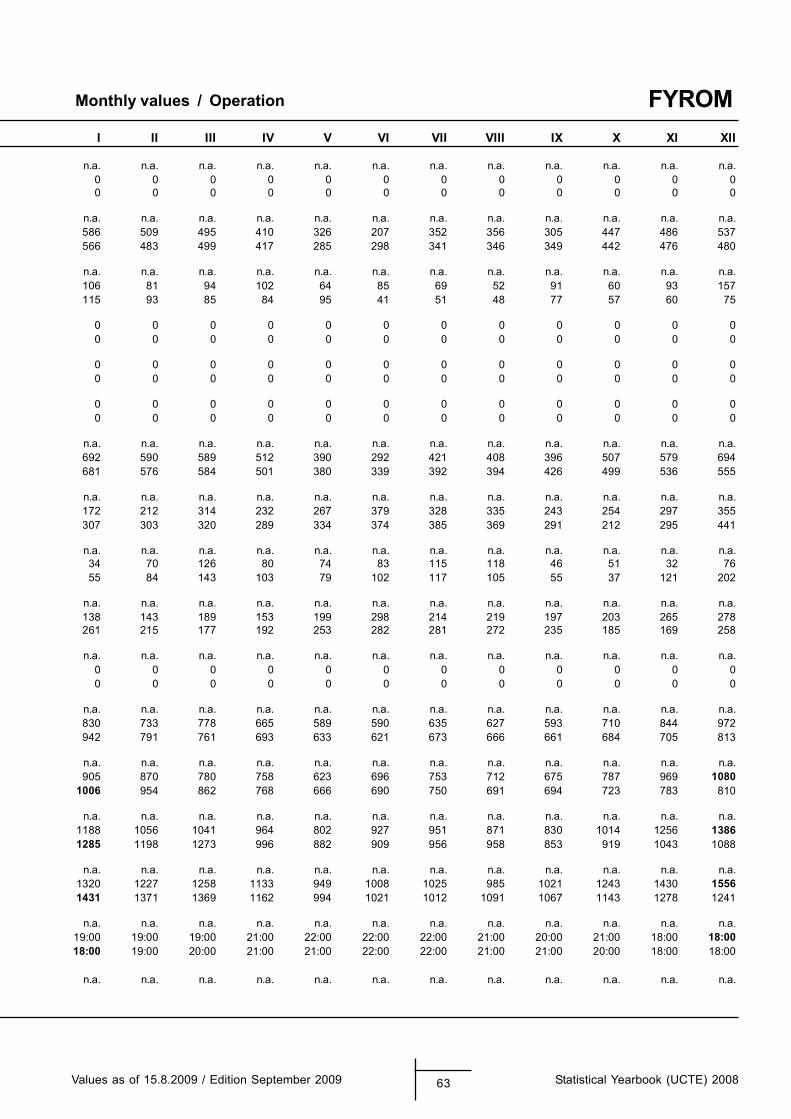
Monthly values / Operation
Values as of 15.8.2009 / Edition September 2009 63 Statistical Yearbook (UCTE) 2008
FYROMI II III IV V VI VII VIII IX X XI XII
n.a. n.a. n.a. n.a. n.a. n.a. n.a. n.a. n.a. n.a. n.a. n.a.0 0 0 0 0 0 0 0 0 0 0 00 0 0 0 0 0 0 0 0 0 0 0
n.a. n.a. n.a. n.a. n.a. n.a. n.a. n.a. n.a. n.a. n.a. n.a.586 509 495 410 326 207 352 356 305 447 486 537566 483 499 417 285 298 341 346 349 442 476 480
n.a. n.a. n.a. n.a. n.a. n.a. n.a. n.a. n.a. n.a. n.a. n.a.106 81 94 102 64 85 69 52 91 60 93 157115 93 85 84 95 41 51 48 77 57 60 75
0 0 0 0 0 0 0 0 0 0 0 00 0 0 0 0 0 0 0 0 0 0 0
0 0 0 0 0 0 0 0 0 0 0 00 0 0 0 0 0 0 0 0 0 0 0
0 0 0 0 0 0 0 0 0 0 0 00 0 0 0 0 0 0 0 0 0 0 0
n.a. n.a. n.a. n.a. n.a. n.a. n.a. n.a. n.a. n.a. n.a. n.a.692 590 589 512 390 292 421 408 396 507 579 694681 576 584 501 380 339 392 394 426 499 536 555
n.a. n.a. n.a. n.a. n.a. n.a. n.a. n.a. n.a. n.a. n.a. n.a.172 212 314 232 267 379 328 335 243 254 297 355307 303 320 289 334 374 385 369 291 212 295 441
n.a. n.a. n.a. n.a. n.a. n.a. n.a. n.a. n.a. n.a. n.a. n.a.34 70 126 80 74 83 115 118 46 51 32 7655 84 143 103 79 102 117 105 55 37 121 202
n.a. n.a. n.a. n.a. n.a. n.a. n.a. n.a. n.a. n.a. n.a. n.a.138 143 189 153 199 298 214 219 197 203 265 278261 215 177 192 253 282 281 272 235 185 169 258
n.a. n.a. n.a. n.a. n.a. n.a. n.a. n.a. n.a. n.a. n.a. n.a.0 0 0 0 0 0 0 0 0 0 0 00 0 0 0 0 0 0 0 0 0 0 0
n.a. n.a. n.a. n.a. n.a. n.a. n.a. n.a. n.a. n.a. n.a. n.a.830 733 778 665 589 590 635 627 593 710 844 972942 791 761 693 633 621 673 666 661 684 705 813
n.a. n.a. n.a. n.a. n.a. n.a. n.a. n.a. n.a. n.a. n.a. n.a.905 870 780 758 623 696 753 712 675 787 969 1080
1006 954 862 768 666 690 750 691 694 723 783 810
n.a. n.a. n.a. n.a. n.a. n.a. n.a. n.a. n.a. n.a. n.a. n.a.1188 1056 1041 964 802 927 951 871 830 1014 1256 13861285 1198 1273 996 882 909 956 958 853 919 1043 1088
n.a. n.a. n.a. n.a. n.a. n.a. n.a. n.a. n.a. n.a. n.a. n.a.1320 1227 1258 1133 949 1008 1025 985 1021 1243 1430 15561431 1371 1369 1162 994 1021 1012 1091 1067 1143 1278 1241
n.a. n.a. n.a. n.a. n.a. n.a. n.a. n.a. n.a. n.a. n.a. n.a.19:00 19:00 19:00 21:00 22:00 22:00 22:00 21:00 20:00 21:00 18:00 18:0018:00 19:00 20:00 21:00 21:00 22:00 22:00 21:00 21:00 20:00 18:00 18:00
n.a. n.a. n.a. n.a. n.a. n.a. n.a. n.a. n.a. n.a. n.a. n.a.
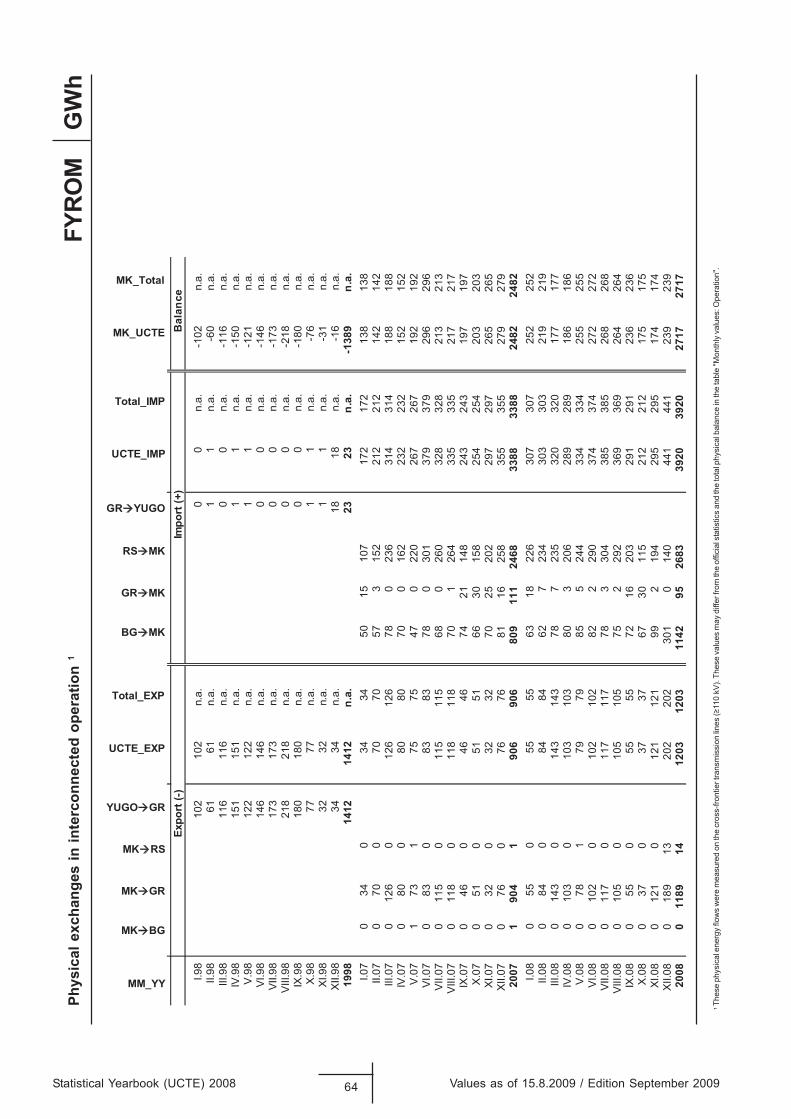
Statistical Yearbook (UCTE) 2008 64 Values as of 15.8.2009 / Edition September 2009
GW
hPh
ysic
al e
xcha
nges
in in
terc
onne
cted
ope
ratio
n 1
1
Thes
e ph
ysic
al e
nerg
y flo
ws
wer
e m
easu
red
on th
e cr
oss-
front
ier t
rans
mis
sion
lines
(≥11
0 kV
). Th
ese
valu
es m
ay d
iffer
from
the
offic
ial s
tatis
tics
and
the
tota
l phy
sica
l bal
ance
in th
e ta
ble
"Mon
thly
val
ues:
Ope
ratio
n".
FYR
OM
MM_YY
MK BG
MK GR
MK RS
YUGO GR
UCTE_EXP
Total_EXP
BG MK
GR MK
RS MK
GR YUGO
UCTE_IMP
Total_IMP
MK_UCTE
MK_Total
ecnalaB
)+( tropmI
)-( tropxE
.a.n201-
.a.n0
0.a.n
201201
89.I.a.n
06-.a.n
11
.a.n16
1689.II
.a.n611-
.a.n0
0.a.n
611611
89.III.a.n
051-.a.n
11
.a.n151
15189.
VI.a.n
121-.a.n
11
.a.n221
22189.
V.a.n
641-.a.n
00
.a.n641
64189.IV
.a.n371-
.a.n0
0.a.n
371371
89.IIV.a.n
812-.a.n
00
.a.n812
81289.III
V.a.n
081-.a.n
00
.a.n081
08189.
XI.a.n
67-.a.n
11
.a.n77
7789.
X.a.n
13-.a.n
11
.a.n23
2389.IX
.a.n61-
.a.n81
81.a.n
4343
89.IIX
.a.n9831-
.a.n32
32.a.n
21412141
8991 I.07
034
034
3450
1510
717
217
213
813
8II.
070
700
7070
573
152
212
212
142
142
III.0
70
126
012
612
678
023
631
431
418
818
8IV
.07
080
080
8070
016
223
223
215
215
2V
.07
173
175
7547
022
026
726
719
219
2VI
.07
083
083
8378
030
137
937
929
629
6VI
I.07
011
50
115
115
680
260
328
328
213
213
VIII
.07
011
80
118
118
701
264
335
335
217
217
IX.0
70
460
4646
7421
148
243
243
197
197
X.0
70
510
5151
6630
158
254
254
203
203
XI.0
70
320
3232
7025
202
297
297
265
265
XII.0
70
760
7676
8116
258
355
355
279
279
2007
190
41
906
906
809
111
2468
3388
3388
2482
2482
I.08
055
055
5563
1822
630
730
725
225
2II.
080
840
8484
627
234
303
303
219
219
III.0
80
143
014
314
378
723
532
032
017
717
7IV
.08
010
30
103
103
803
206
289
289
186
186
V.0
80
781
7979
855
244
334
334
255
255
VI.0
80
102
010
210
282
229
037
437
427
227
2VI
I.08
011
70
117
117
783
304
385
385
268
268
VIII
.08
010
50
105
105
752
292
369
369
264
264
IX.0
80
550
5555
7216
203
291
291
236
236
X.0
80
370
3737
6730
115
212
212
175
175
XI.0
80
121
012
112
199
219
429
529
517
417
4XI
I.08
018
913
202
202
301
014
044
144
123
923
920
080
1189
1412
0312
0311
4295
2683
3920
3920
2717
2717
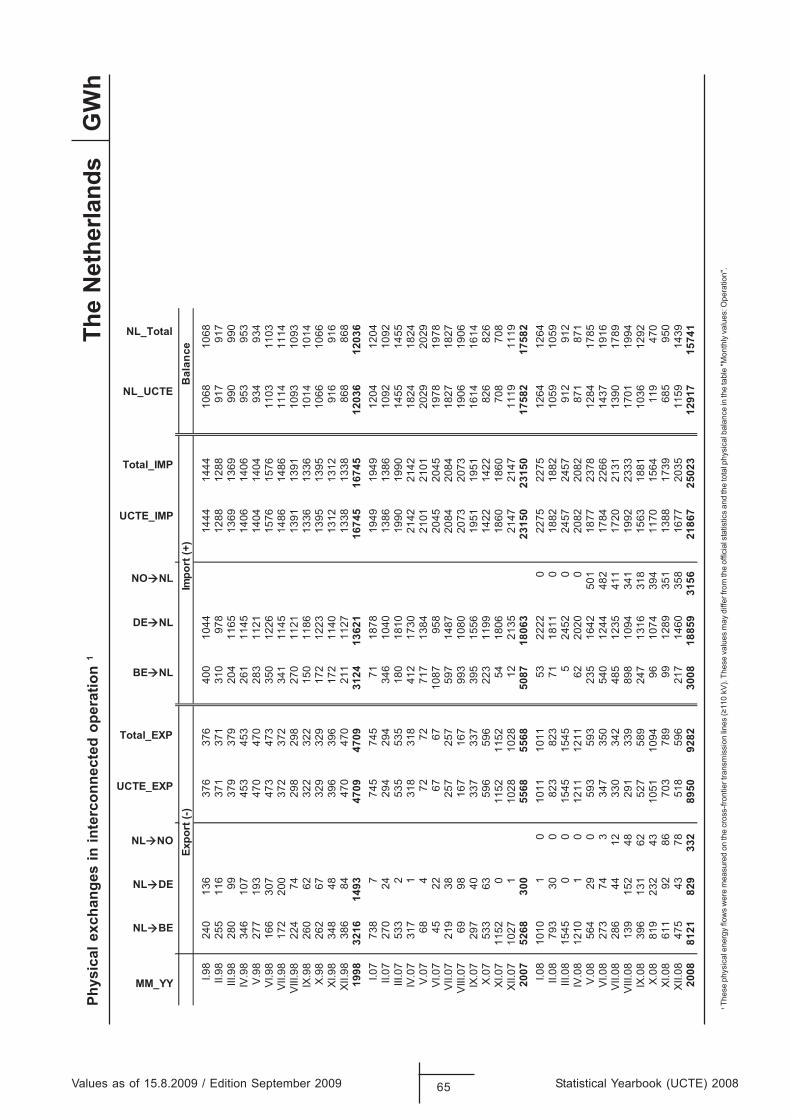
1
Thes
e ph
ysic
al e
nerg
y flo
ws
wer
e m
easu
red
on th
e cr
oss-
front
ier t
rans
mis
sion
lines
(≥11
0 kV
). Th
ese
valu
es m
ay d
iffer
from
the
offic
ial s
tatis
tics
and
the
tota
l phy
sica
l bal
ance
in th
e ta
ble
"Mon
thly
val
ues:
Ope
ratio
n".
Values as of 15.8.2009 / Edition September 2009 65 Statistical Yearbook (UCTE) 2008
GW
hPh
ysic
al e
xcha
nges
in in
terc
onne
cted
ope
ratio
n 1
The
Net
herla
nds
MM_YY
NL BE
NL DE
NL NO
UCTE_EXP
Total_EXP
BE NL
DE NL
NO NL
UCTE_IMP
Total_IMP
NL_UCTE
NL_Total
ecnalaB
)+( tropmI
)-( tropxE
I.98
240
136
376
376
400
1044
1444
1444
1068
1068
II.98
255
116
371
371
310
978
1288
1288
917
917
III.9
828
099
379
379
204
1165
1369
1369
990
990
IV.9
834
610
745
345
326
111
4514
0614
0695
395
3V
.98
277
193
470
470
283
1121
1404
1404
934
934
VI.9
816
630
747
347
335
012
2615
7615
7611
0311
03VI
I.98
172
200
372
372
341
1145
1486
1486
1114
1114
VIII
.98
224
7429
829
827
011
2113
9113
9110
9310
93IX
.98
260
6232
232
215
011
8613
3613
3610
1410
14X
.98
262
6732
932
917
212
2313
9513
9510
6610
66XI
.98
348
4839
639
617
211
4013
1213
1291
691
6XI
I.98
386
8447
047
021
111
2713
3813
3886
886
819
9832
1614
9347
0947
0931
2413
621
1674
516
745
1203
612
036
I.07
738
774
574
571
1878
1949
1949
1204
1204
II.07
270
2429
429
434
610
4013
8613
8610
9210
92III
.07
533
253
553
518
018
1019
9019
9014
5514
55IV
.07
317
131
831
841
217
3021
4221
4218
2418
24V
.07
684
7272
717
1384
2101
2101
2029
2029
VI.0
745
2267
6710
8795
820
4520
4519
7819
78VI
I.07
219
3825
725
759
714
8720
8420
8418
2718
27V
III.0
769
9816
716
799
310
8020
7320
7319
0619
06IX
.07
297
4033
733
739
515
5619
5119
5116
1416
14X
.07
533
6359
659
622
311
9914
2214
2282
682
6XI
.07
1152
011
5211
5254
1806
1860
1860
708
708
XII.0
710
271
1028
1028
1221
3521
4721
4711
1911
1920
0752
6830
055
6855
6850
8718
063
2315
023
150
1758
217
582
I.08
1010
10
1011
1011
5322
220
2275
2275
1264
1264
II.08
793
300
823
823
7118
110
1882
1882
1059
1059
III.0
815
450
015
4515
455
2452
024
5724
5791
291
2IV
.08
1210
10
1211
1211
6220
200
2082
2082
871
871
V.0
856
429
059
359
323
516
4250
118
7723
7812
8417
85VI
.08
273
743
347
350
540
1244
482
1784
2266
1437
1916
VII.0
828
644
1233
034
248
512
3541
117
2021
3113
9017
89V
III.0
813
915
248
291
339
898
1094
341
1992
2333
1701
1994
IX.0
839
613
162
527
589
247
1316
318
1563
1881
1036
1292
X.0
881
923
243
1051
1094
9610
7439
411
7015
6411
947
0XI
.08
611
9286
703
789
9912
8935
113
8817
3968
595
0XI
I.08
475
4378
518
596
217
1460
358
1677
2035
1159
1439
2008
8121
829
332
8950
9282
3008
1885
931
5621
867
2502
312
917
1574
1
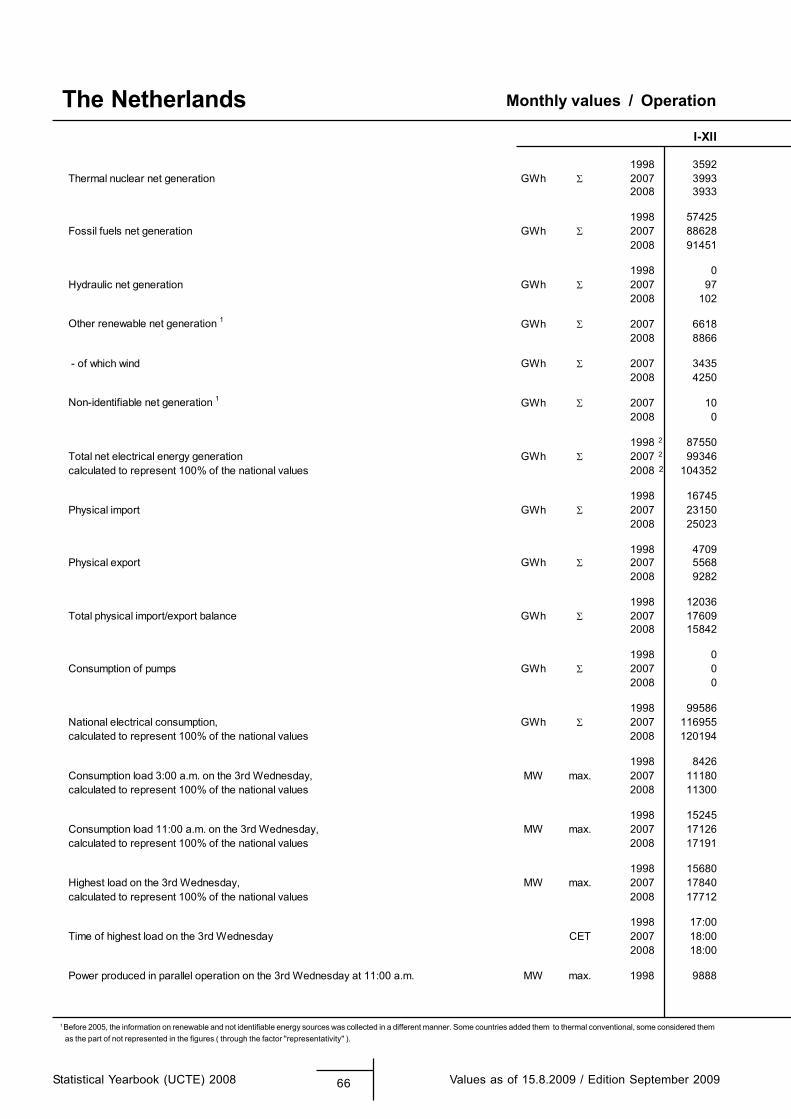
1 Before 2005, the information on renewable and not identifiable energy sources was collected in a different manner. Some countries added them to thermal conventional, some considered them as the part of not represented in the figures ( through the factor "representativity" ).
Monthly values / Operation
Statistical Yearbook (UCTE) 2008 66 Values as of 15.8.2009 / Edition September 2009
The NetherlandsI-XII
1998 3592Thermal nuclear net generation GWh 2007 3993
2008 3933
1998 57425Fossil fuels net generation GWh 2007 88628
2008 91451
1998 0Hydraulic net generation GWh 2007 97
2008 102
Other renewable net generation 1 GWh 2007 66182008 8866
- of which wind GWh 2007 34352008 4250
Non-identifiable net generation 1 GWh 2007 102008 0
1998 2 87550Total net electrical energy generation GWh 2007 2 99346calculated to represent 100% of the national values 2008 2 104352
1998 16745Physical import GWh 2007 23150
2008 25023
1998 4709Physical export GWh 2007 5568
2008 9282
1998 12036Total physical import/export balance GWh 2007 17609
2008 15842
1998 0Consumption of pumps GWh 2007 0
2008 0
1998 99586National electrical consumption, GWh 2007 116955calculated to represent 100% of the national values 2008 120194
1998 8426Consumption load 3:00 a.m. on the 3rd Wednesday, MW max. 2007 11180calculated to represent 100% of the national values 2008 11300
1998 15245Consumption load 11:00 a.m. on the 3rd Wednesday, MW max. 2007 17126calculated to represent 100% of the national values 2008 17191
1998 15680Highest load on the 3rd Wednesday, MW max. 2007 17840calculated to represent 100% of the national values 2008 17712
1998 17:00Time of highest load on the 3rd Wednesday CET 2007 18:00
2008 18:00
Power produced in parallel operation on the 3rd Wednesday at 11:00 a.m. MW max. 1998 9888
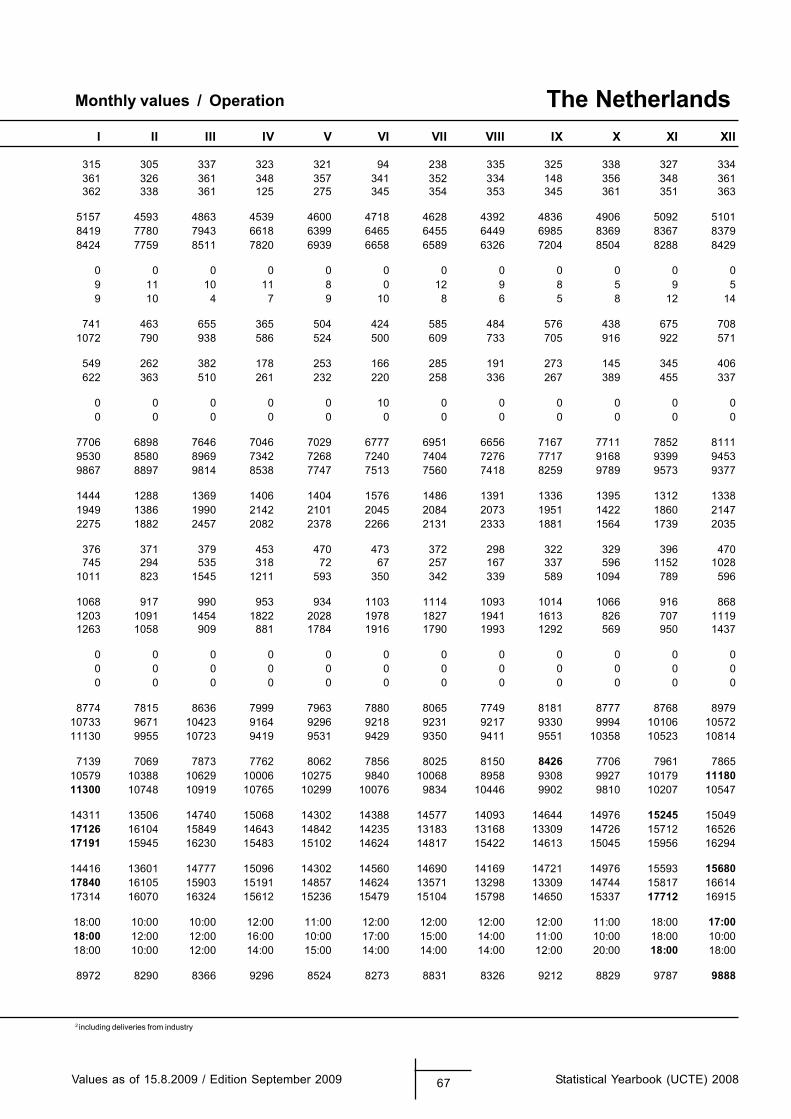
2 including deliveries from industry
Monthly values / Operation
Values as of 15.8.2009 / Edition September 2009 67 Statistical Yearbook (UCTE) 2008
The NetherlandsI II III IV V VI VII VIII IX X XI XII
315 305 337 323 321 94 238 335 325 338 327 334361 326 361 348 357 341 352 334 148 356 348 361362 338 361 125 275 345 354 353 345 361 351 363
5157 4593 4863 4539 4600 4718 4628 4392 4836 4906 5092 51018419 7780 7943 6618 6399 6465 6455 6449 6985 8369 8367 83798424 7759 8511 7820 6939 6658 6589 6326 7204 8504 8288 8429
0 0 0 0 0 0 0 0 0 0 0 09 11 10 11 8 0 12 9 8 5 9 59 10 4 7 9 10 8 6 5 8 12 14
741 463 655 365 504 424 585 484 576 438 675 7081072 790 938 586 524 500 609 733 705 916 922 571
549 262 382 178 253 166 285 191 273 145 345 406622 363 510 261 232 220 258 336 267 389 455 337
0 0 0 0 0 10 0 0 0 0 0 00 0 0 0 0 0 0 0 0 0 0 0
7706 6898 7646 7046 7029 6777 6951 6656 7167 7711 7852 81119530 8580 8969 7342 7268 7240 7404 7276 7717 9168 9399 94539867 8897 9814 8538 7747 7513 7560 7418 8259 9789 9573 9377
1444 1288 1369 1406 1404 1576 1486 1391 1336 1395 1312 13381949 1386 1990 2142 2101 2045 2084 2073 1951 1422 1860 21472275 1882 2457 2082 2378 2266 2131 2333 1881 1564 1739 2035
376 371 379 453 470 473 372 298 322 329 396 470745 294 535 318 72 67 257 167 337 596 1152 1028
1011 823 1545 1211 593 350 342 339 589 1094 789 596
1068 917 990 953 934 1103 1114 1093 1014 1066 916 8681203 1091 1454 1822 2028 1978 1827 1941 1613 826 707 11191263 1058 909 881 1784 1916 1790 1993 1292 569 950 1437
0 0 0 0 0 0 0 0 0 0 0 00 0 0 0 0 0 0 0 0 0 0 00 0 0 0 0 0 0 0 0 0 0 0
8774 7815 8636 7999 7963 7880 8065 7749 8181 8777 8768 897910733 9671 10423 9164 9296 9218 9231 9217 9330 9994 10106 1057211130 9955 10723 9419 9531 9429 9350 9411 9551 10358 10523 10814
7139 7069 7873 7762 8062 7856 8025 8150 8426 7706 7961 786510579 10388 10629 10006 10275 9840 10068 8958 9308 9927 10179 1118011300 10748 10919 10765 10299 10076 9834 10446 9902 9810 10207 10547
14311 13506 14740 15068 14302 14388 14577 14093 14644 14976 15245 1504917126 16104 15849 14643 14842 14235 13183 13168 13309 14726 15712 1652617191 15945 16230 15483 15102 14624 14817 15422 14613 15045 15956 16294
14416 13601 14777 15096 14302 14560 14690 14169 14721 14976 15593 1568017840 16105 15903 15191 14857 14624 13571 13298 13309 14744 15817 1661417314 16070 16324 15612 15236 15479 15104 15798 14650 15337 17712 16915
18:00 10:00 10:00 12:00 11:00 12:00 12:00 12:00 12:00 11:00 18:00 17:0018:00 12:00 12:00 16:00 10:00 17:00 15:00 14:00 11:00 10:00 18:00 10:0018:00 10:00 12:00 14:00 15:00 14:00 14:00 14:00 12:00 20:00 18:00 18:00
8972 8290 8366 9296 8524 8273 8831 8326 9212 8829 9787 9888
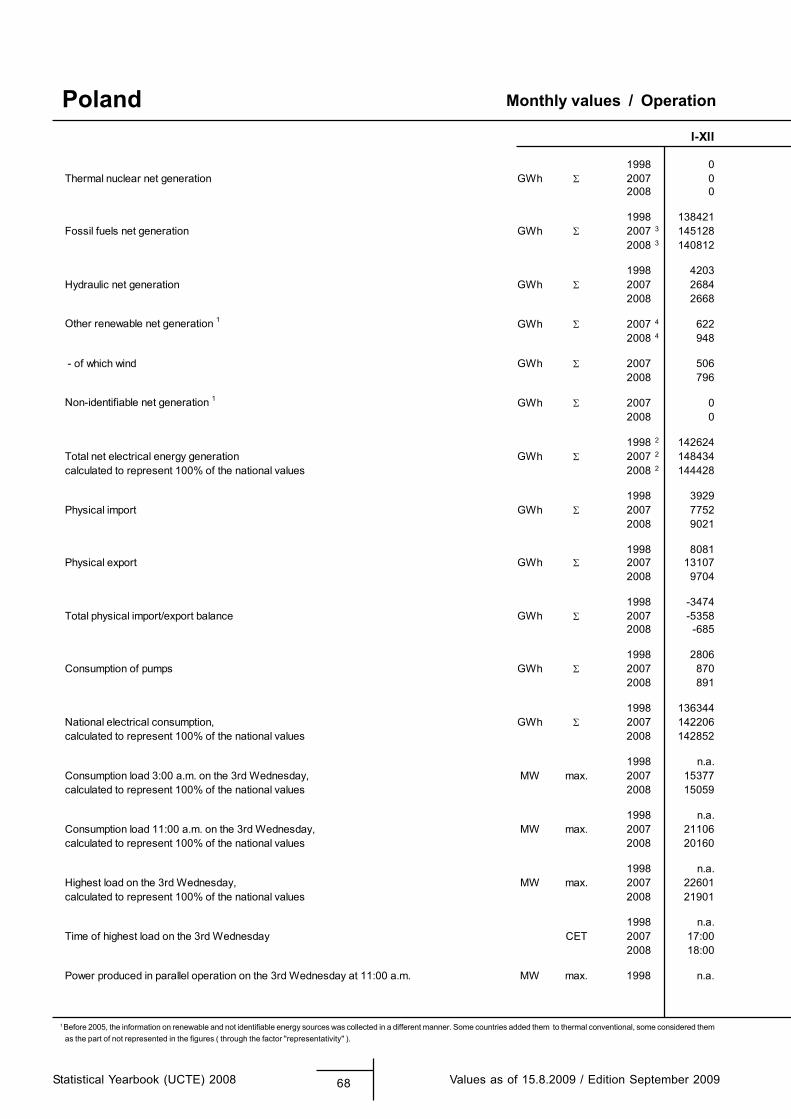
1 Before 2005, the information on renewable and not identifiable energy sources was collected in a different manner. Some countries added them to thermal conventional, some considered them as the part of not represented in the figures ( through the factor "representativity" ).
Monthly values / Operation
Statistical Yearbook (UCTE) 2008 68 Values as of 15.8.2009 / Edition September 2009
PolandI-XII
1998 0Thermal nuclear net generation GWh 2007 0
2008 0
1998 138421Fossil fuels net generation GWh 2007 3 145128
2008 3 140812
1998 4203Hydraulic net generation GWh 2007 2684
2008 2668
Other renewable net generation 1 GWh 2007 4 6222008 4 948
- of which wind GWh 2007 5062008 796
Non-identifiable net generation 1 GWh 2007 02008 0
1998 2 142624Total net electrical energy generation GWh 2007 2 148434calculated to represent 100% of the national values 2008 2 144428
1998 3929Physical import GWh 2007 7752
2008 9021
1998 8081Physical export GWh 2007 13107
2008 9704
1998 -3474Total physical import/export balance GWh 2007 -5358
2008 -685
1998 2806Consumption of pumps GWh 2007 870
2008 891
1998 136344National electrical consumption, GWh 2007 142206calculated to represent 100% of the national values 2008 142852
1998 n.a.Consumption load 3:00 a.m. on the 3rd Wednesday, MW max. 2007 15377calculated to represent 100% of the national values 2008 15059
1998 n.a.Consumption load 11:00 a.m. on the 3rd Wednesday, MW max. 2007 21106calculated to represent 100% of the national values 2008 20160
1998 n.a.Highest load on the 3rd Wednesday, MW max. 2007 22601calculated to represent 100% of the national values 2008 21901
1998 n.a.Time of highest load on the 3rd Wednesday CET 2007 17:00
2008 18:00
Power produced in parallel operation on the 3rd Wednesday at 11:00 a.m. MW max. 1998 n.a.
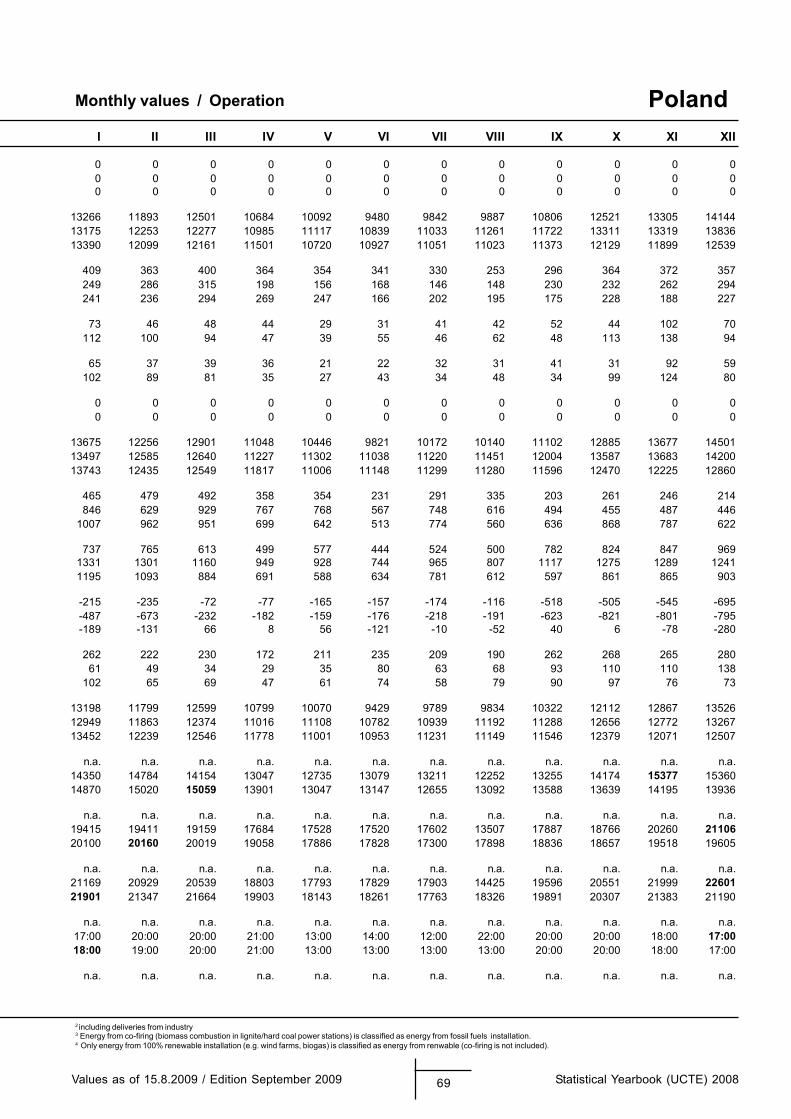
2 including deliveries from industry
Monthly values / Operation
Values as of 15.8.2009 / Edition September 2009 69 Statistical Yearbook (UCTE) 2008
Poland
3 Energy from co-firing (biomass combustion in lignite/hard coal power stations) is classified as energy from fossil fuels installation.4 Only energy from 100% renewable installation (e.g. wind farms, biogas) is classified as energy from renwable (co-firing is not included).
I II III IV V VI VII VIII IX X XI XII
0 0 0 0 0 0 0 0 0 0 0 00 0 0 0 0 0 0 0 0 0 0 00 0 0 0 0 0 0 0 0 0 0 0
13266 11893 12501 10684 10092 9480 9842 9887 10806 12521 13305 1414413175 12253 12277 10985 11117 10839 11033 11261 11722 13311 13319 1383613390 12099 12161 11501 10720 10927 11051 11023 11373 12129 11899 12539
409 363 400 364 354 341 330 253 296 364 372 357249 286 315 198 156 168 146 148 230 232 262 294241 236 294 269 247 166 202 195 175 228 188 227
73 46 48 44 29 31 41 42 52 44 102 70112 100 94 47 39 55 46 62 48 113 138 94
65 37 39 36 21 22 32 31 41 31 92 59102 89 81 35 27 43 34 48 34 99 124 80
0 0 0 0 0 0 0 0 0 0 0 00 0 0 0 0 0 0 0 0 0 0 0
13675 12256 12901 11048 10446 9821 10172 10140 11102 12885 13677 1450113497 12585 12640 11227 11302 11038 11220 11451 12004 13587 13683 1420013743 12435 12549 11817 11006 11148 11299 11280 11596 12470 12225 12860
465 479 492 358 354 231 291 335 203 261 246 214846 629 929 767 768 567 748 616 494 455 487 446
1007 962 951 699 642 513 774 560 636 868 787 622
737 765 613 499 577 444 524 500 782 824 847 9691331 1301 1160 949 928 744 965 807 1117 1275 1289 12411195 1093 884 691 588 634 781 612 597 861 865 903
-215 -235 -72 -77 -165 -157 -174 -116 -518 -505 -545 -695-487 -673 -232 -182 -159 -176 -218 -191 -623 -821 -801 -795-189 -131 66 8 56 -121 -10 -52 40 6 -78 -280
262 222 230 172 211 235 209 190 262 268 265 28061 49 34 29 35 80 63 68 93 110 110 138
102 65 69 47 61 74 58 79 90 97 76 73
13198 11799 12599 10799 10070 9429 9789 9834 10322 12112 12867 1352612949 11863 12374 11016 11108 10782 10939 11192 11288 12656 12772 1326713452 12239 12546 11778 11001 10953 11231 11149 11546 12379 12071 12507
n.a. n.a. n.a. n.a. n.a. n.a. n.a. n.a. n.a. n.a. n.a. n.a.14350 14784 14154 13047 12735 13079 13211 12252 13255 14174 15377 1536014870 15020 15059 13901 13047 13147 12655 13092 13588 13639 14195 13936
n.a. n.a. n.a. n.a. n.a. n.a. n.a. n.a. n.a. n.a. n.a. n.a.19415 19411 19159 17684 17528 17520 17602 13507 17887 18766 20260 2110620100 20160 20019 19058 17886 17828 17300 17898 18836 18657 19518 19605
n.a. n.a. n.a. n.a. n.a. n.a. n.a. n.a. n.a. n.a. n.a. n.a.21169 20929 20539 18803 17793 17829 17903 14425 19596 20551 21999 2260121901 21347 21664 19903 18143 18261 17763 18326 19891 20307 21383 21190
n.a. n.a. n.a. n.a. n.a. n.a. n.a. n.a. n.a. n.a. n.a. n.a.17:00 20:00 20:00 21:00 13:00 14:00 12:00 22:00 20:00 20:00 18:00 17:0018:00 19:00 20:00 21:00 13:00 13:00 13:00 13:00 20:00 20:00 18:00 17:00
n.a. n.a. n.a. n.a. n.a. n.a. n.a. n.a. n.a. n.a. n.a. n.a.
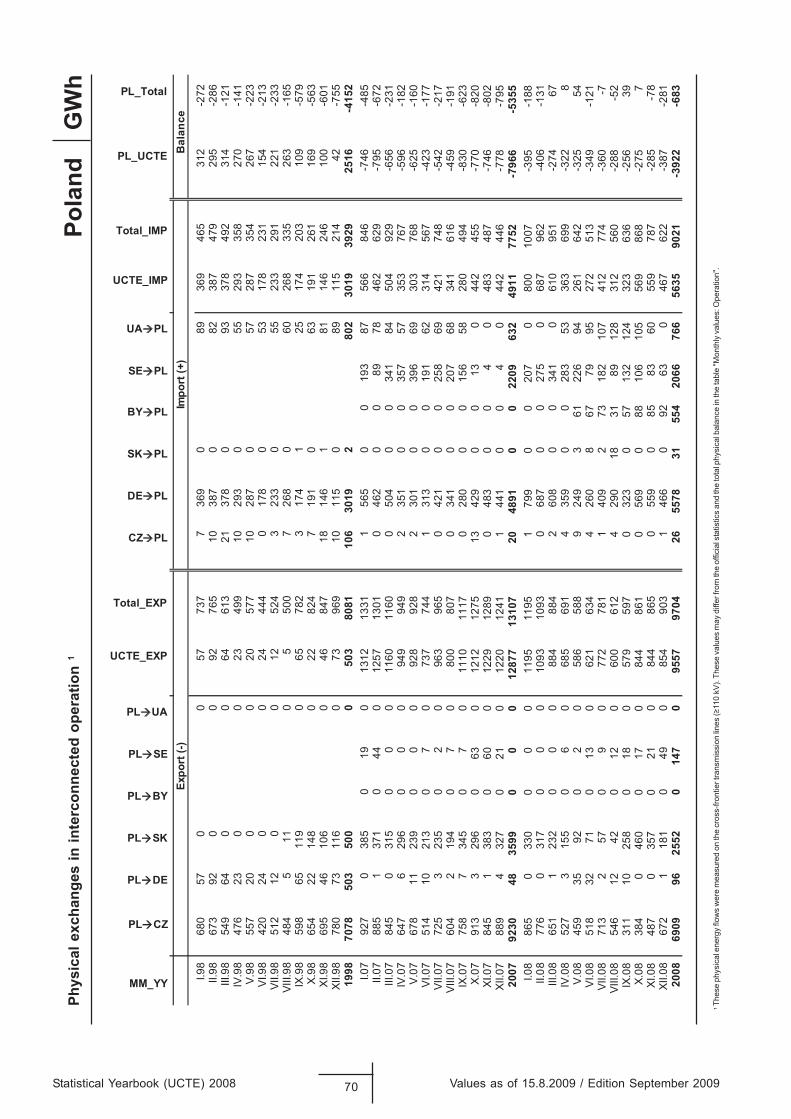
Statistical Yearbook (UCTE) 2008 70 Values as of 15.8.2009 / Edition September 2009
GW
hPh
ysic
al e
xcha
nges
in in
terc
onne
cted
ope
ratio
n 1
1
Thes
e ph
ysic
al e
nerg
y flo
ws
wer
e m
easu
red
on th
e cr
oss-
front
ier t
rans
mis
sion
lines
(≥11
0 kV
). Th
ese
valu
es m
ay d
iffer
from
the
offic
ial s
tatis
tics
and
the
tota
l phy
sica
l bal
ance
in th
e ta
ble
"Mon
thly
val
ues:
Ope
ratio
n".
Pola
nd
MM_YY
PL CZ
PL DE
PL SK
PL BY
PL SE
PL UA
UCTE_EXP
Total_EXP
CZ PL
DE PL
SK PL
BY PL
SE PL
UA PL
UCTE_IMP
Total_IMP
PL_UCTE
PL_Total
ecnalaB
)+( tropmI
)-( tropxE
272-213
564963
980
9637
73775
00
75086
89.I682-
592974
78328
0783
01567
290
029
37689.II
121-413
294873
390
87312
31646
00
46945
89.III141-
072853
39255
0392
01994
320
032
67489.VI
322-762
453782
750
78201
77502
00
02755
89.V312-
451132
87135
0871
0444
420
042
02489.IV
332-122
192332
550
3323
42521
00
21215
89.IIV561-
362533
86206
0862
7005
50
115
48489.IIIV
975-901
302471
521
4713
28756
0911
56895
89.XI365-
961162
19136
0191
7428
220
84122
45689.X
106-001
642641
181
64181
74864
0601
64596
89.IX557-
24412
51198
0511
01969
370
61137
08789.IIX
2514-6152
92939103
2082
9103601
1808305
0005
3058707
8991 I.07
927
038
50
190
1312
1331
156
50
019
387
566
846
-746
-485
II.07
885
137
10
440
1257
1301
046
20
089
7846
262
9-7
95-6
72III
.07
845
031
50
00
1160
1160
050
40
034
184
504
929
-656
-231
IV.0
764
76
296
00
094
994
92
351
00
357
5735
376
7-5
96-1
82V.
0767
811
239
00
092
892
82
301
00
396
6930
376
8-6
25-1
60VI
.07
514
1021
30
70
737
744
131
30
019
162
314
567
-423
-177
VII.0
772
53
235
02
096
396
50
421
00
258
6942
174
8-5
42-2
17VI
II.07
604
219
40
70
800
807
034
10
020
768
341
616
-459
-191
IX.0
775
87
345
07
011
1011
170
280
00
156
5828
049
4-8
30-6
23X.
0791
33
296
063
012
1212
7513
429
00
130
442
455
-770
-820
XI.0
784
51
383
060
012
2912
890
483
00
40
483
487
-746
-802
XII.0
788
94
327
021
012
2012
411
441
00
40
442
446
-778
-795
2007
9230
4835
990
00
1287
713
107
2048
910
022
0963
249
1177
52-7
966
-535
5I.0
886
50
330
00
011
9511
951
799
00
207
080
010
07-3
95-1
88II.
0877
60
317
00
010
9310
930
687
00
275
068
796
2-4
06-1
31III
.08
651
123
20
00
884
884
260
80
034
10
610
951
-274
67IV
.08
527
315
50
60
685
691
435
90
028
353
363
699
-322
8V.
0845
935
920
20
586
588
924
93
6122
694
261
642
-325
54VI
.08
518
3271
013
062
163
44
260
867
7995
272
513
-349
-121
VII.0
871
32
570
90
772
781
140
92
7318
210
741
277
4-3
60-7
VIII.
0854
612
420
120
600
612
429
018
3189
128
312
560
-288
-52
IX.0
831
110
258
018
057
959
70
323
057
132
124
323
636
-256
39X.
0838
40
460
017
084
486
10
569
088
106
105
569
868
-275
7XI
.08
487
035
70
210
844
865
055
90
8583
6055
978
7-2
85-7
8XI
I.08
672
118
10
490
854
903
146
60
9263
046
762
2-3
87-2
8120
0869
0996
2552
014
70
9557
9704
2655
7831
554
2066
766
5635
9021
-392
2-6
83
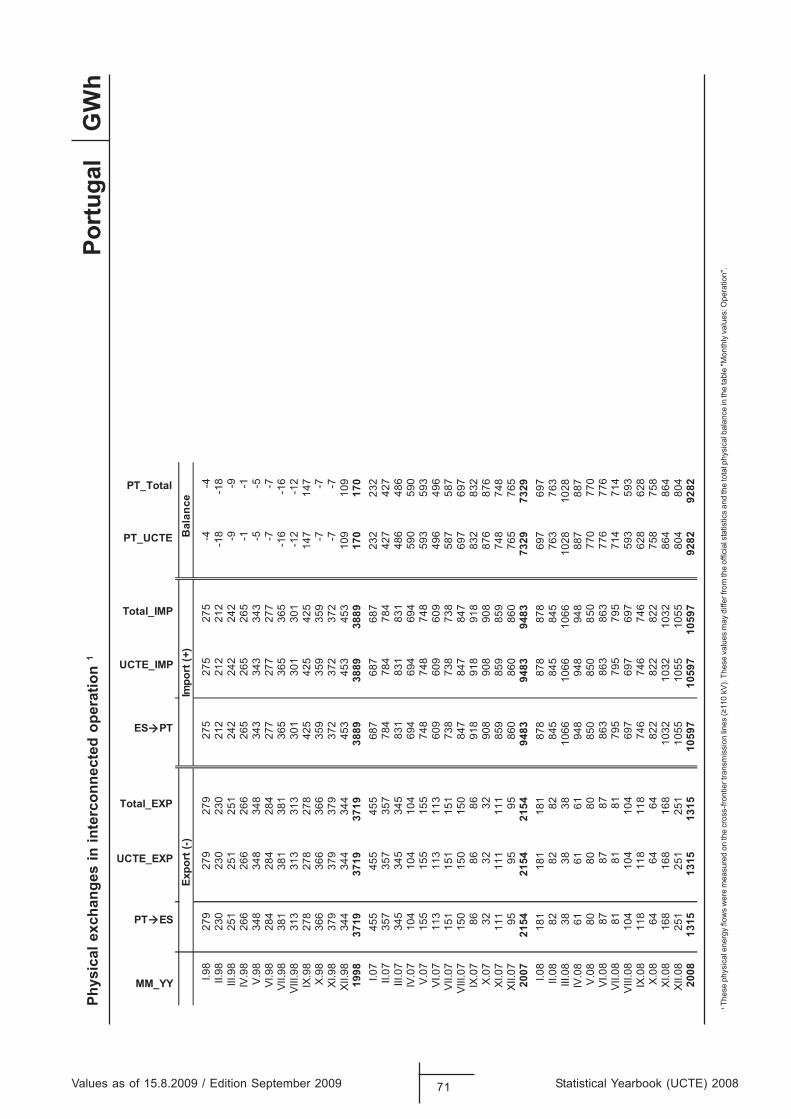
1
Thes
e ph
ysic
al e
nerg
y flo
ws
wer
e m
easu
red
on th
e cr
oss-
front
ier t
rans
mis
sion
lines
(≥11
0 kV
). Th
ese
valu
es m
ay d
iffer
from
the
offic
ial s
tatis
tics
and
the
tota
l phy
sica
l bal
ance
in th
e ta
ble
"Mon
thly
val
ues:
Ope
ratio
n".
Values as of 15.8.2009 / Edition September 2009 71 Statistical Yearbook (UCTE) 2008
GW
hPh
ysic
al e
xcha
nges
in in
terc
onne
cted
ope
ratio
n 1
Port
ugal
MM_YY
PT ES
UCTE_EXP
Total_EXP
ES PT
UCTE_IMP
Total_IMP
PT_UCTE
PT_Total
ecnalaB
)+( tropmI
)-( tropxE
I.98
279
279
279
275
275
275
-4-4
II.98
230
230
230
212
212
212
-18
-18
III.9
825
125
125
124
224
224
2-9
-9IV
.98
266
266
266
265
265
265
-1-1
V.9
834
834
834
834
334
334
3-5
-5VI
.98
284
284
284
277
277
277
-7-7
VII.9
838
138
138
136
536
536
5-1
6-1
6V
III.9
831
331
331
330
130
130
1-1
2-1
2IX
.98
278
278
278
425
425
425
147
147
X.9
836
636
636
635
935
935
9-7
-7XI
.98
379
379
379
372
372
372
-7-7
XII.9
834
434
434
445
345
345
310
910
919
9837
1937
1937
1938
8938
8938
8917
017
0I.0
745
545
545
568
768
768
723
223
2II.
0735
735
735
778
478
478
442
742
7III
.07
345
345
345
831
831
831
486
486
IV.0
710
410
410
469
469
469
459
059
0V
.07
155
155
155
748
748
748
593
593
VI.0
711
311
311
360
960
960
949
649
6VI
I.07
151
151
151
738
738
738
587
587
VIII
.07
150
150
150
847
847
847
697
697
IX.0
786
8686
918
918
918
832
832
X.0
732
3232
908
908
908
876
876
XI.0
711
111
111
185
985
985
974
874
8XI
I.07
9595
9586
086
086
076
576
520
0721
5421
5421
5494
8394
8394
8373
2973
29I.0
818
118
118
187
887
887
869
769
7II.
0882
8282
845
845
845
763
763
III.0
838
3838
1066
1066
1066
1028
1028
IV.0
861
6161
948
948
948
887
887
V.0
880
8080
850
850
850
770
770
VI.0
887
8787
863
863
863
776
776
VII.0
881
8181
795
795
795
714
714
VIII
.08
104
104
104
697
697
697
593
593
IX.0
811
811
811
874
674
674
662
862
8X
.08
6464
6482
282
282
275
875
8XI
.08
168
168
168
1032
1032
1032
864
864
XII.0
825
125
125
110
5510
5510
5580
480
420
0813
1513
1513
1510
597
1059
710
597
9282
9282
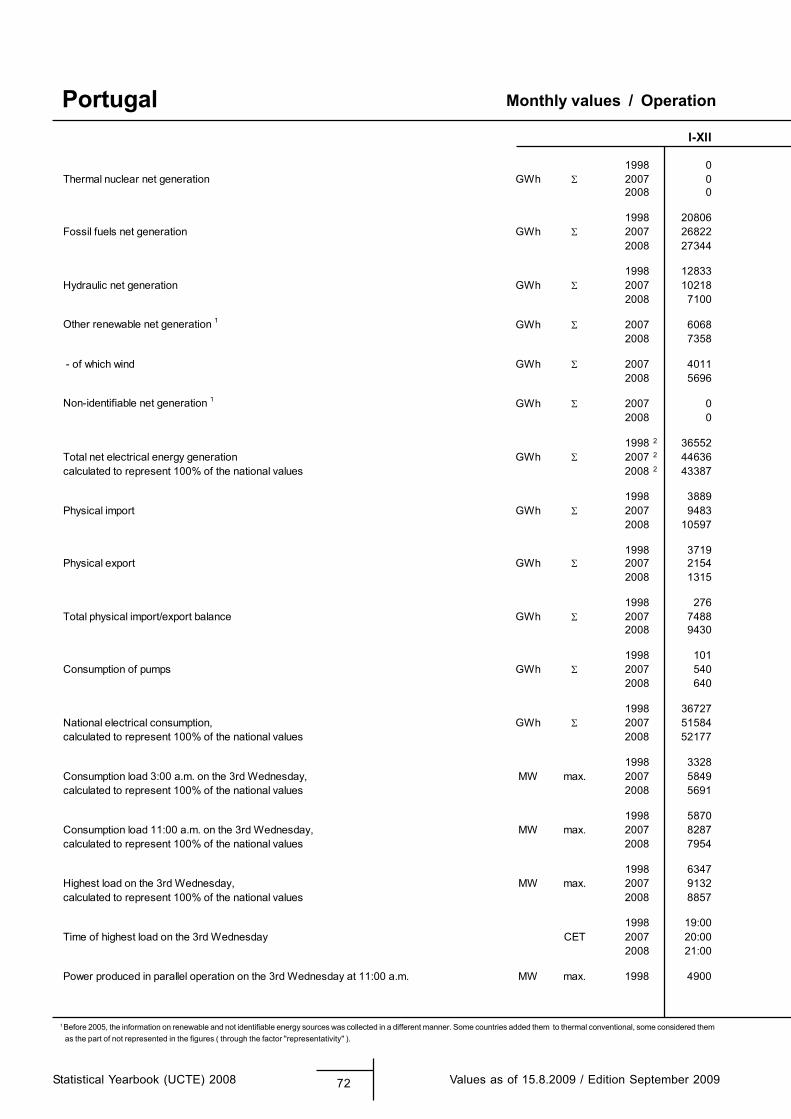
1 Before 2005, the information on renewable and not identifiable energy sources was collected in a different manner. Some countries added them to thermal conventional, some considered them as the part of not represented in the figures ( through the factor "representativity" ).
Monthly values / Operation
Statistical Yearbook (UCTE) 2008 72 Values as of 15.8.2009 / Edition September 2009
PortugalI-XII
1998 0Thermal nuclear net generation GWh 2007 0
2008 0
1998 20806Fossil fuels net generation GWh 2007 26822
2008 27344
1998 12833Hydraulic net generation GWh 2007 10218
2008 7100
Other renewable net generation 1 GWh 2007 60682008 7358
- of which wind GWh 2007 40112008 5696
Non-identifiable net generation 1 GWh 2007 02008 0
1998 2 36552Total net electrical energy generation GWh 2007 2 44636calculated to represent 100% of the national values 2008 2 43387
1998 3889Physical import GWh 2007 9483
2008 10597
1998 3719Physical export GWh 2007 2154
2008 1315
1998 276Total physical import/export balance GWh 2007 7488
2008 9430
1998 101Consumption of pumps GWh 2007 540
2008 640
1998 36727National electrical consumption, GWh 2007 51584calculated to represent 100% of the national values 2008 52177
1998 3328Consumption load 3:00 a.m. on the 3rd Wednesday, MW max. 2007 5849calculated to represent 100% of the national values 2008 5691
1998 5870Consumption load 11:00 a.m. on the 3rd Wednesday, MW max. 2007 8287calculated to represent 100% of the national values 2008 7954
1998 6347Highest load on the 3rd Wednesday, MW max. 2007 9132calculated to represent 100% of the national values 2008 8857
1998 19:00Time of highest load on the 3rd Wednesday CET 2007 20:00
2008 21:00
Power produced in parallel operation on the 3rd Wednesday at 11:00 a.m. MW max. 1998 4900
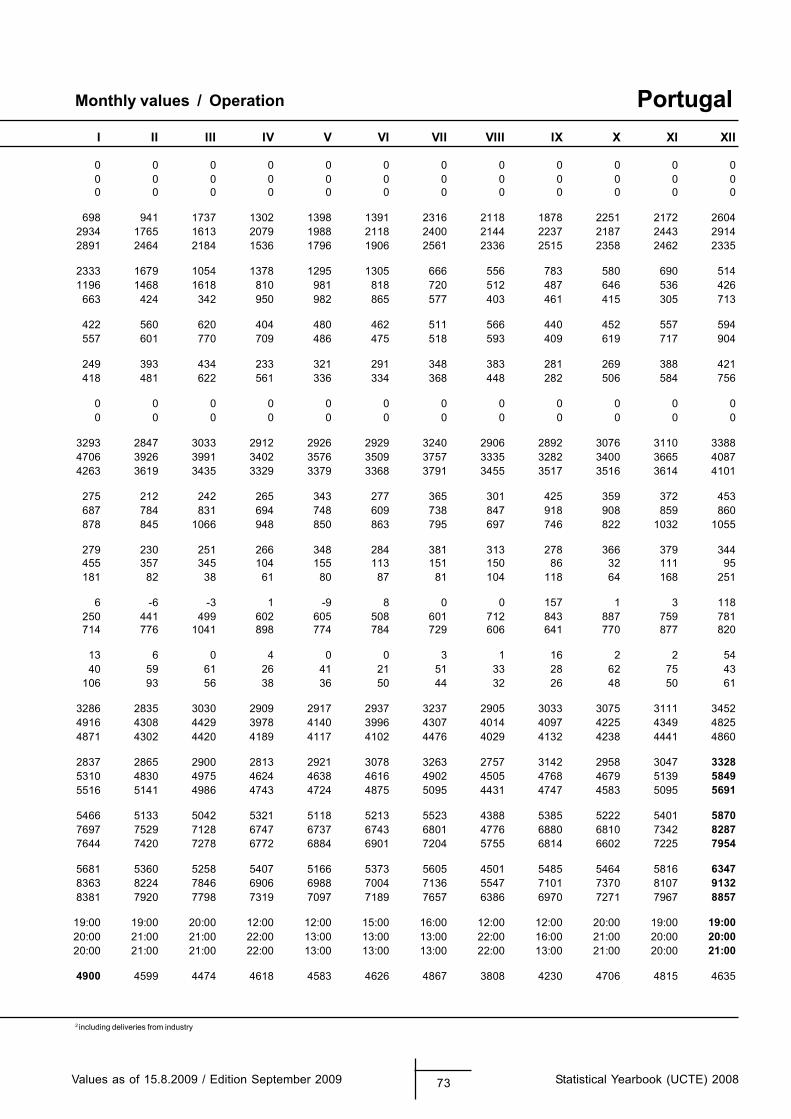
2 including deliveries from industry
Monthly values / Operation
Values as of 15.8.2009 / Edition September 2009 73 Statistical Yearbook (UCTE) 2008
PortugalI II III IV V VI VII VIII IX X XI XII
0 0 0 0 0 0 0 0 0 0 0 00 0 0 0 0 0 0 0 0 0 0 00 0 0 0 0 0 0 0 0 0 0 0
698 941 1737 1302 1398 1391 2316 2118 1878 2251 2172 26042934 1765 1613 2079 1988 2118 2400 2144 2237 2187 2443 29142891 2464 2184 1536 1796 1906 2561 2336 2515 2358 2462 2335
2333 1679 1054 1378 1295 1305 666 556 783 580 690 5141196 1468 1618 810 981 818 720 512 487 646 536 426
663 424 342 950 982 865 577 403 461 415 305 713
422 560 620 404 480 462 511 566 440 452 557 594557 601 770 709 486 475 518 593 409 619 717 904
249 393 434 233 321 291 348 383 281 269 388 421418 481 622 561 336 334 368 448 282 506 584 756
0 0 0 0 0 0 0 0 0 0 0 00 0 0 0 0 0 0 0 0 0 0 0
3293 2847 3033 2912 2926 2929 3240 2906 2892 3076 3110 33884706 3926 3991 3402 3576 3509 3757 3335 3282 3400 3665 40874263 3619 3435 3329 3379 3368 3791 3455 3517 3516 3614 4101
275 212 242 265 343 277 365 301 425 359 372 453687 784 831 694 748 609 738 847 918 908 859 860878 845 1066 948 850 863 795 697 746 822 1032 1055
279 230 251 266 348 284 381 313 278 366 379 344455 357 345 104 155 113 151 150 86 32 111 95181 82 38 61 80 87 81 104 118 64 168 251
6 -6 -3 1 -9 8 0 0 157 1 3 118250 441 499 602 605 508 601 712 843 887 759 781714 776 1041 898 774 784 729 606 641 770 877 820
13 6 0 4 0 0 3 1 16 2 2 5440 59 61 26 41 21 51 33 28 62 75 43
106 93 56 38 36 50 44 32 26 48 50 61
3286 2835 3030 2909 2917 2937 3237 2905 3033 3075 3111 34524916 4308 4429 3978 4140 3996 4307 4014 4097 4225 4349 48254871 4302 4420 4189 4117 4102 4476 4029 4132 4238 4441 4860
2837 2865 2900 2813 2921 3078 3263 2757 3142 2958 3047 33285310 4830 4975 4624 4638 4616 4902 4505 4768 4679 5139 58495516 5141 4986 4743 4724 4875 5095 4431 4747 4583 5095 5691
5466 5133 5042 5321 5118 5213 5523 4388 5385 5222 5401 58707697 7529 7128 6747 6737 6743 6801 4776 6880 6810 7342 82877644 7420 7278 6772 6884 6901 7204 5755 6814 6602 7225 7954
5681 5360 5258 5407 5166 5373 5605 4501 5485 5464 5816 63478363 8224 7846 6906 6988 7004 7136 5547 7101 7370 8107 91328381 7920 7798 7319 7097 7189 7657 6386 6970 7271 7967 8857
19:00 19:00 20:00 12:00 12:00 15:00 16:00 12:00 12:00 20:00 19:00 19:0020:00 21:00 21:00 22:00 13:00 13:00 13:00 22:00 16:00 21:00 20:00 20:0020:00 21:00 21:00 22:00 13:00 13:00 13:00 22:00 13:00 21:00 20:00 21:00
4900 4599 4474 4618 4583 4626 4867 3808 4230 4706 4815 4635
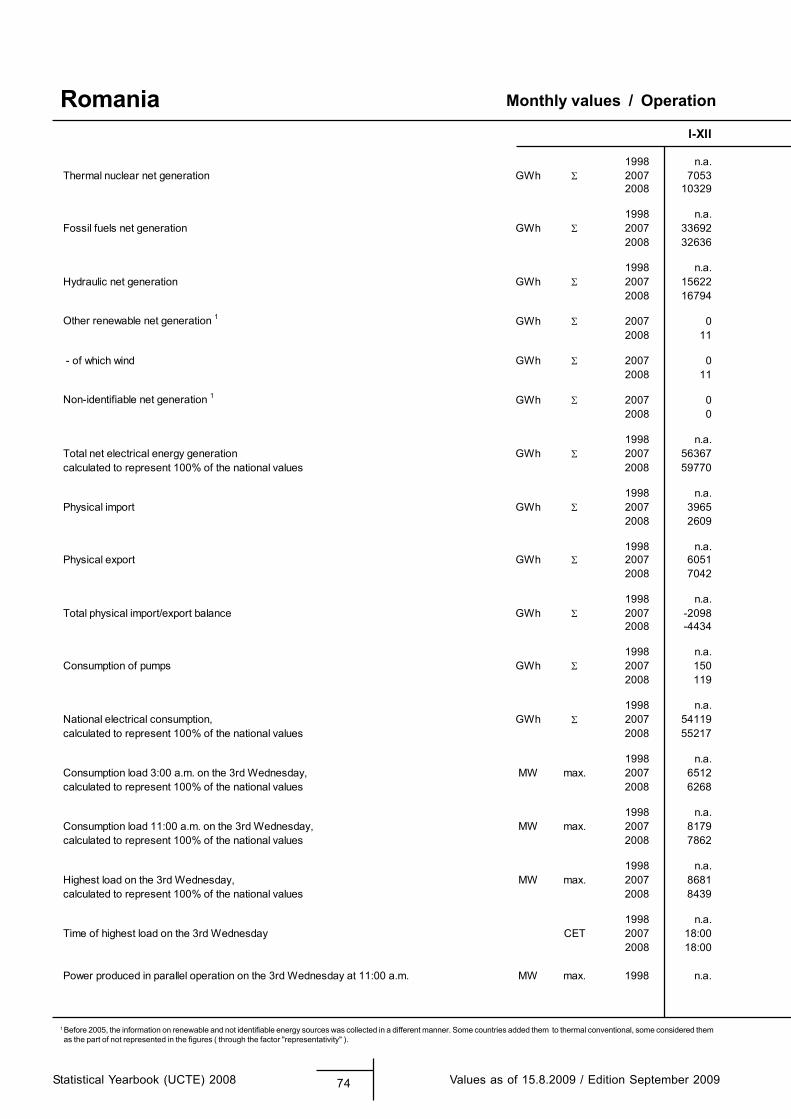
1 Before 2005, the information on renewable and not identifiable energy sources was collected in a different manner. Some countries added them to thermal conventional, some considered them as the part of not represented in the figures ( through the factor "representativity" ).
Monthly values / Operation
Statistical Yearbook (UCTE) 2008 74 Values as of 15.8.2009 / Edition September 2009
RomaniaI-XII
1998 n.a.Thermal nuclear net generation GWh 2007 7053
2008 10329
1998 n.a.Fossil fuels net generation GWh 2007 33692
2008 32636
1998 n.a.Hydraulic net generation GWh 2007 15622
2008 16794
Other renewable net generation 1 GWh 2007 02008 11
- of which wind GWh 2007 02008 11
Non-identifiable net generation 1 GWh 2007 02008 0
1998 n.a.Total net electrical energy generation GWh 2007 56367calculated to represent 100% of the national values 2008 59770
1998 n.a.Physical import GWh 2007 3965
2008 2609
1998 n.a.Physical export GWh 2007 6051
2008 7042
1998 n.a.Total physical import/export balance GWh 2007 -2098
2008 -4434
1998 n.a.Consumption of pumps GWh 2007 150
2008 119
1998 n.a.National electrical consumption, GWh 2007 54119calculated to represent 100% of the national values 2008 55217
1998 n.a.Consumption load 3:00 a.m. on the 3rd Wednesday, MW max. 2007 6512calculated to represent 100% of the national values 2008 6268
1998 n.a.Consumption load 11:00 a.m. on the 3rd Wednesday, MW max. 2007 8179calculated to represent 100% of the national values 2008 7862
1998 n.a.Highest load on the 3rd Wednesday, MW max. 2007 8681calculated to represent 100% of the national values 2008 8439
1998 n.a.Time of highest load on the 3rd Wednesday CET 2007 18:00
2008 18:00
Power produced in parallel operation on the 3rd Wednesday at 11:00 a.m. MW max. 1998 n.a.
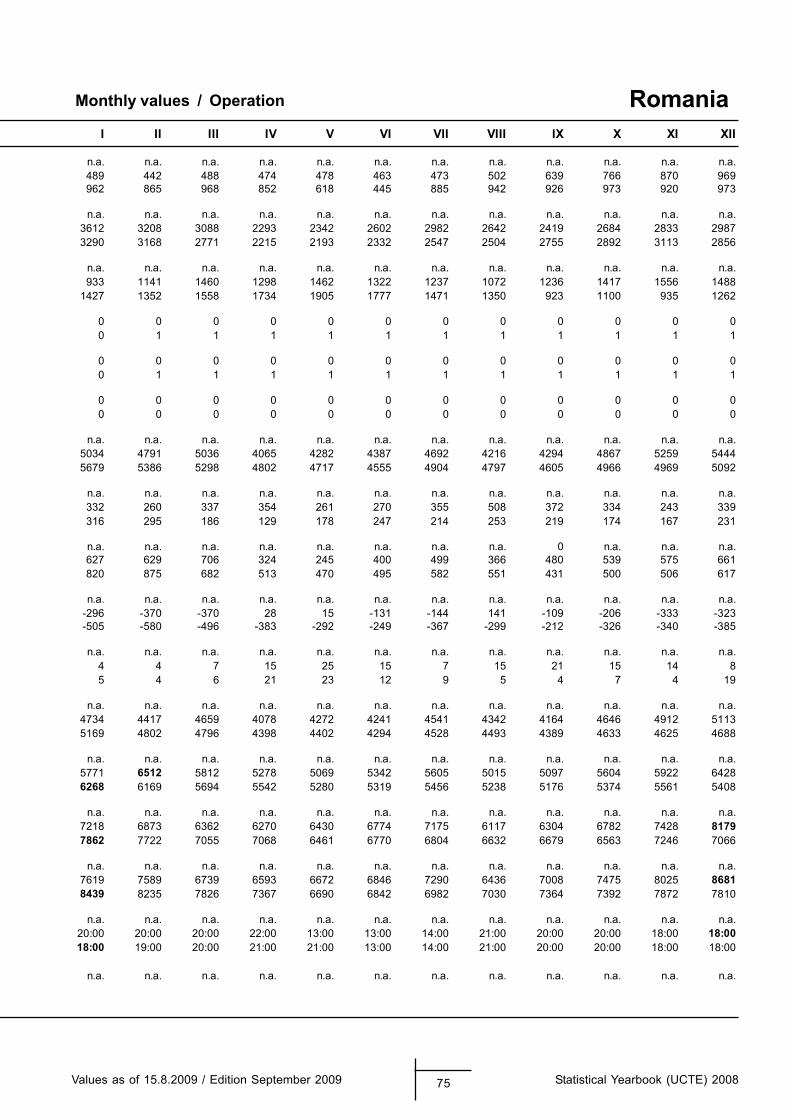
Monthly values / Operation
Values as of 15.8.2009 / Edition September 2009 75 Statistical Yearbook (UCTE) 2008
RomaniaI II III IV V VI VII VIII IX X XI XII
n.a. n.a. n.a. n.a. n.a. n.a. n.a. n.a. n.a. n.a. n.a. n.a.489 442 488 474 478 463 473 502 639 766 870 969962 865 968 852 618 445 885 942 926 973 920 973
n.a. n.a. n.a. n.a. n.a. n.a. n.a. n.a. n.a. n.a. n.a. n.a.3612 3208 3088 2293 2342 2602 2982 2642 2419 2684 2833 29873290 3168 2771 2215 2193 2332 2547 2504 2755 2892 3113 2856
n.a. n.a. n.a. n.a. n.a. n.a. n.a. n.a. n.a. n.a. n.a. n.a.933 1141 1460 1298 1462 1322 1237 1072 1236 1417 1556 1488
1427 1352 1558 1734 1905 1777 1471 1350 923 1100 935 1262
0 0 0 0 0 0 0 0 0 0 0 00 1 1 1 1 1 1 1 1 1 1 1
0 0 0 0 0 0 0 0 0 0 0 00 1 1 1 1 1 1 1 1 1 1 1
0 0 0 0 0 0 0 0 0 0 0 00 0 0 0 0 0 0 0 0 0 0 0
n.a. n.a. n.a. n.a. n.a. n.a. n.a. n.a. n.a. n.a. n.a. n.a.5034 4791 5036 4065 4282 4387 4692 4216 4294 4867 5259 54445679 5386 5298 4802 4717 4555 4904 4797 4605 4966 4969 5092
n.a. n.a. n.a. n.a. n.a. n.a. n.a. n.a. n.a. n.a. n.a. n.a.332 260 337 354 261 270 355 508 372 334 243 339316 295 186 129 178 247 214 253 219 174 167 231
n.a. n.a. n.a. n.a. n.a. n.a. n.a. n.a. 0 n.a. n.a. n.a.627 629 706 324 245 400 499 366 480 539 575 661820 875 682 513 470 495 582 551 431 500 506 617
n.a. n.a. n.a. n.a. n.a. n.a. n.a. n.a. n.a. n.a. n.a. n.a.-296 -370 -370 28 15 -131 -144 141 -109 -206 -333 -323-505 -580 -496 -383 -292 -249 -367 -299 -212 -326 -340 -385
n.a. n.a. n.a. n.a. n.a. n.a. n.a. n.a. n.a. n.a. n.a. n.a.4 4 7 15 25 15 7 15 21 15 14 85 4 6 21 23 12 9 5 4 7 4 19
n.a. n.a. n.a. n.a. n.a. n.a. n.a. n.a. n.a. n.a. n.a. n.a.4734 4417 4659 4078 4272 4241 4541 4342 4164 4646 4912 51135169 4802 4796 4398 4402 4294 4528 4493 4389 4633 4625 4688
n.a. n.a. n.a. n.a. n.a. n.a. n.a. n.a. n.a. n.a. n.a. n.a.5771 6512 5812 5278 5069 5342 5605 5015 5097 5604 5922 64286268 6169 5694 5542 5280 5319 5456 5238 5176 5374 5561 5408
n.a. n.a. n.a. n.a. n.a. n.a. n.a. n.a. n.a. n.a. n.a. n.a.7218 6873 6362 6270 6430 6774 7175 6117 6304 6782 7428 81797862 7722 7055 7068 6461 6770 6804 6632 6679 6563 7246 7066
n.a. n.a. n.a. n.a. n.a. n.a. n.a. n.a. n.a. n.a. n.a. n.a.7619 7589 6739 6593 6672 6846 7290 6436 7008 7475 8025 86818439 8235 7826 7367 6690 6842 6982 7030 7364 7392 7872 7810
n.a. n.a. n.a. n.a. n.a. n.a. n.a. n.a. n.a. n.a. n.a. n.a.20:00 20:00 20:00 22:00 13:00 13:00 14:00 21:00 20:00 20:00 18:00 18:0018:00 19:00 20:00 21:00 21:00 13:00 14:00 21:00 20:00 20:00 18:00 18:00
n.a. n.a. n.a. n.a. n.a. n.a. n.a. n.a. n.a. n.a. n.a. n.a.
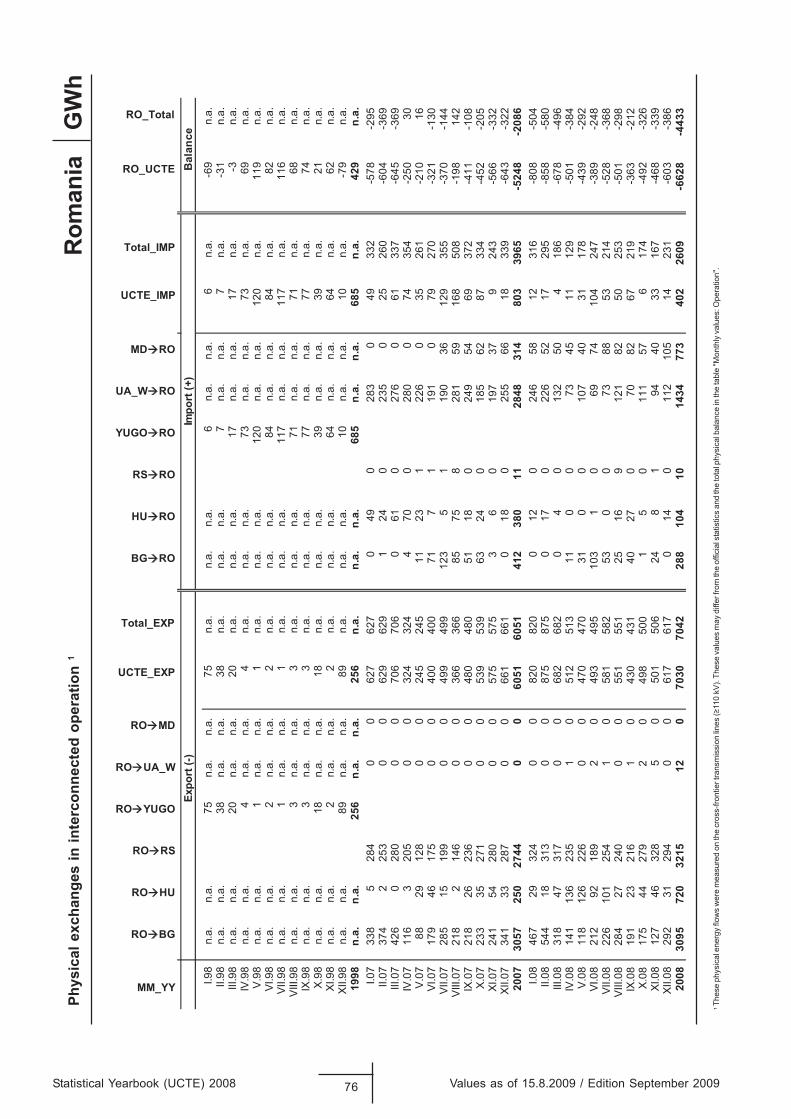
Statistical Yearbook (UCTE) 2008 76 Values as of 15.8.2009 / Edition September 2009
GW
hPh
ysic
al e
xcha
nges
in in
terc
onne
cted
ope
ratio
n 1
1
Thes
e ph
ysic
al e
nerg
y flo
ws
wer
e m
easu
red
on th
e cr
oss-
front
ier t
rans
mis
sion
lines
(≥11
0 kV
). Th
ese
valu
es m
ay d
iffer
from
the
offic
ial s
tatis
tics
and
the
tota
l phy
sica
l bal
ance
in th
e ta
ble
"Mon
thly
val
ues:
Ope
ratio
n".
Rom
ania
MM_YY
RO BG
RO HU
RO RS
RO YUGO
RO UA_W
RO MD
UCTE_EXP
Total_EXP
BG RO
HU RO
RS RO
YUGO RO
UA_W RO
MD RO
UCTE_IMP
Total_IMP
RO_UCTE
RO_Total
ecnalaB
)+( tropmI
)-( tropxE
I.98
n.a.
n.a.
75n.
a.n.
a.75
n.a.
n.a.
n.a.
6n.
a.n.
a.6
n.a.
-69
n.a.
II.98
n.a.
n.a.
38n.
a.n.
a.38
n.a.
n.a.
n.a.
7n.
a.n.
a.7
n.a.
-31
n.a.
III.9
8n.
a.n.
a.20
n.a.
n.a.
20n.
a.n.
a.n.
a.17
n.a.
n.a.
17n.
a.-3
n.a.
IV.9
8n.
a.n.
a.4
n.a.
n.a.
4n.
a.n.
a.n.
a.73
n.a.
n.a.
73n.
a.69
n.a.
V.9
8n.
a.n.
a.1
n.a.
n.a.
1n.
a.n.
a.n.
a.12
0n.
a.n.
a.12
0n.
a.11
9n.
a.VI
.98
n.a.
n.a.
2n.
a.n.
a.2
n.a.
n.a.
n.a.
84n.
a.n.
a.84
n.a.
82n.
a.VI
I .98
n.a.
n.a.
1n.
a.n.
a.1
n.a.
n.a.
n.a.
117
n.a.
n.a.
117
n.a.
116
n.a.
VIII
.98
n.a.
n.a.
3n.
a.n.
a.3
n.a.
n.a.
n.a.
71n.
a.n.
a.71
n.a.
68n.
a.IX
.98
n.a.
n.a.
3n.
a.n.
a.3
n.a.
n.a.
n.a.
77n.
a.n.
a.77
n.a.
74n.
a.X
.98
n.a.
n.a.
18n.
a.n.
a.18
n.a.
n.a.
n.a.
39n.
a.n.
a.39
n.a.
21n.
a.XI
.98
n.a.
n.a.
2n.
a.n.
a.2
n.a.
n.a.
n.a.
64n.
a.n.
a.64
n.a.
62n.
a.XI
I.98
n.a.
n.a.
89n.
a.n.
a.89
n.a.
n.a.
n.a.
10n.
a.n.
a.10
n.a.
-79
n.a.
1998
n.a.
n.a.
256
n.a.
n.a.
256
n.a.
n.a.
n.a.
685
n.a.
n.a.
685
n.a.
429
n.a.
I.07
338
528
40
062
762
70
490
283
049
332
-578
-295
II.07
374
225
30
062
962
91
240
235
025
260
-604
-369
III.0
742
60
280
00
706
706
061
027
60
6133
7-6
45-3
69IV
.07
116
320
50
032
432
44
700
280
074
354
-250
30V
.07
8829
128
00
245
245
1123
122
60
3526
1-2
1016
VI.0
717
946
175
00
400
400
717
119
10
7927
0-3
21-1
30VI
I.07
285
1519
90
049
949
912
35
119
036
129
355
-370
-144
VIII
.07
218
214
60
036
636
685
758
281
5916
850
8-1
9814
2IX
.07
218
2623
60
048
048
051
180
249
5469
372
-411
-108
X.0
723
335
271
00
539
539
6324
018
562
8733
4-4
52-2
05XI
.07
241
5428
00
057
557
53
60
197
379
243
-566
-332
XII.0
734
133
287
00
661
661
01 8
025
566
1833
9-6
43-3
2220
0730
5725
027
440
060
5160
5141
238
011
2848
314
803
3965
-524
8-2
086
I.08
467
2932
40
082
082
00
120
246
5812
316
-808
-504
II.08
544
1831
30
087
587
50
170
226
5217
295
-858
-580
III.0
831
847
317
00
682
682
04
013
250
418
6-6
78-4
96IV
.08
141
136
235
10
512
513
110
073
4511
129
-501
-384
V.0
811
812
622
60
047
047
031
00
107
4031
178
-439
-292
VI.0
821
292
189
20
493
495
103
10
6974
104
247
-389
-248
VII.0
822
610
125
41
058
158
253
00
7388
5321
4-5
28-3
68V
III.0
828
427
240
00
551
551
2516
912
182
5025
3-5
01-2
98IX
.08
191
2321
61
043
043
140
270
7082
6721
9-3
63-2
12X
.08
175
4427
92
049
850
01
50
111
576
174
-492
-326
XI.0
812
746
328
50
501
506
248
194
4033
167
-468
-339
XII.0
829
231
294
00
617
617
014
011
210
514
231
-603
-386
2008
3095
720
3215
120
7030
7042
288
104
1014
3477
340
226
09-6
628
-443
3
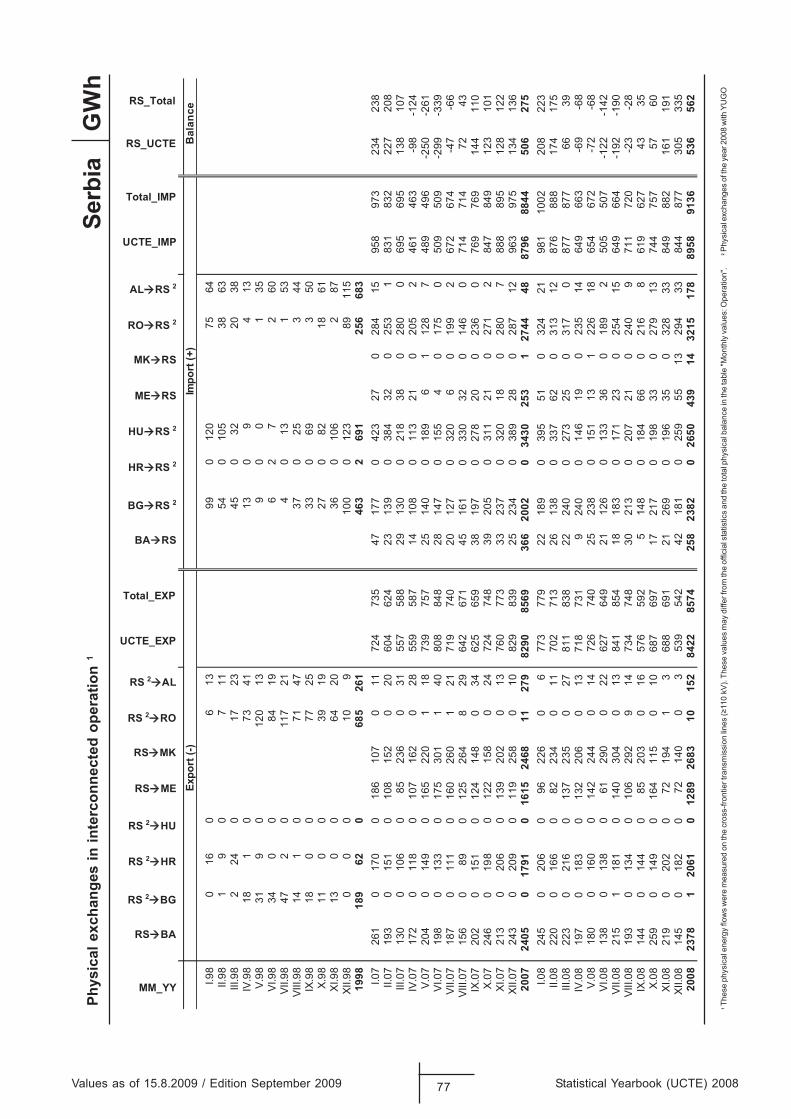
1
Thes
e ph
ysic
al e
nerg
y flo
ws
wer
e m
easu
red
on th
e cr
oss-
front
ier t
rans
mis
sion
lines
(≥11
0 kV
). Th
ese
valu
es m
ay d
iffer
from
the
offic
ial s
tatis
tics
and
the
tota
l phy
sica
l bal
ance
in th
e ta
ble
"Mon
thly
val
ues:
Ope
ratio
n".
Values as of 15.8.2009 / Edition September 2009 77 Statistical Yearbook (UCTE) 2008
GW
hPh
ysic
al e
xcha
nges
in in
terc
onne
cted
ope
ratio
n 1
Serb
ia
2
Phys
ical
exc
hang
es o
f the
yea
r 200
8 w
ith Y
UG
O
MM_YY
RS BA
RS 2 BG
RS 2 HR
RS 2 HU
RS ME
RS MK
RS 2 RO
RS 2 AL
UCTE_EXP
Total_EXP
BA RS
BG RS 2
HR RS 2
HU RS 2
ME RS
MK RS
RO RS 2
AL RS 2
UCTE_IMP
Total_IMP
RS_UCTE
RS_Total
4657
0210
9931
60
610
89.I36
83501
045
117
09
189.II
8302
230
5432
710
422
89.III31
49
031
1437
01
8189.VI
531
00
931
0210
913
89.V06
27
26
9148
00
4389.IV
351
310
412
7110
274
89.IIV44
352
073
7417
01
4189.IIIV
053
960
3352
770
081
89.XI16
8128
072
9193
00
1189.X
782
6010
6302
460
031
89.IX511
98321
0001
901
00
089.IIX
386652
1962
364162
5860
26981
8991 I.07
261
017
00
186
107
011
724
735
4717
70
423
270
284
1595
897
323
423
8II.
0719
30
151
010
815
20
2060
462
423
139
038
432
025
31
831
832
227
208
III.0
713
00
106
085
236
031
557
588
2913
00
218
380
280
069
569
513
810
7IV
.07
172
011
80
107
162
028
559
587
1410
80
113
210
205
246
146
3-9
8-1
24V.
0720
40
149
016
522
01
1873
975
725
140
018
96
112
87
489
496
-250
-261
VI.0
719
80
133
017
530
11
4080
884
828
147
015
54
017
50
509
509
-299
-339
VII.0
718
70
111
016
026
01
2171
974
020
127
032
06
019
92
672
674
-47
-66
VIII.
0715
60
890
125
264
829
642
671
4516
10
330
320
146
071
471
472
43IX
.07
202
015
10
124
148
034
625
659
3819
70
278
200
236
076
976
914
411
0X.
0724
60
198
012
215
80
2472
474
839
205
031
121
027
12
847
849
123
101
XI.0
721
30
206
013
920
20
1376
077
333
237
032
018
028
07
888
895
128
122
XII.0
724
30
209
011
925
80
1082
983
925
234
038
928
028
712
963
975
134
136
2007
2405
017
910
1615
2468
1127
982
9085
6936
620
020
3430
253
127
4448
8796
8844
506
275
I.08
245
020
60
9622
60
677
377
922
189
039
551
032
421
981
1002
208
223
II.08
220
016
60
8223
40
1170
271
326
138
033
762
031
312
876
888
174
175
III.0
822
30
216
013
723
50
2781
183
822
240
027
325
031
70
877
877
6639
IV.0
819
70
183
013
220
60
1371
873
19
240
014
619
023
514
649
663
-69
-68
V.08
180
016
00
142
244
014
726
740
2523
80
151
131
226
1865
467
2-7
2-6
8VI
.08
138
013
80
6129
00
2262
764
921
126
013
336
018
92
505
507
-122
-142
VII.0
821
51
181
014
030
40
1384
185
418
183
017
123
025
415
649
664
-192
-190
VIII.
0819
30
134
010
629
29
1473
474
830
213
020
721
024
09
711
720
-23
-28
IX.0
814
40
144
085
203
016
576
592
514
80
184
660
216
861
962
743
35X.
0825
90
149
016
411
50
1068
769
717
217
019
833
027
913
744
757
5760
XI.0
821
90
202
072
194
13
688
691
2126
90
196
350
328
3384
988
216
119
1XI
I.08
145
018
20
7214
00
353
954
242
181
025
955
1329
433
844
877
305
335
2008
2378
120
610
1289
2683
1015
284
2285
7425
823
820
2650
439
1432
1517
889
5891
3653
656
2
Expo
rt (-
)ecnala
B)+( trop
mI
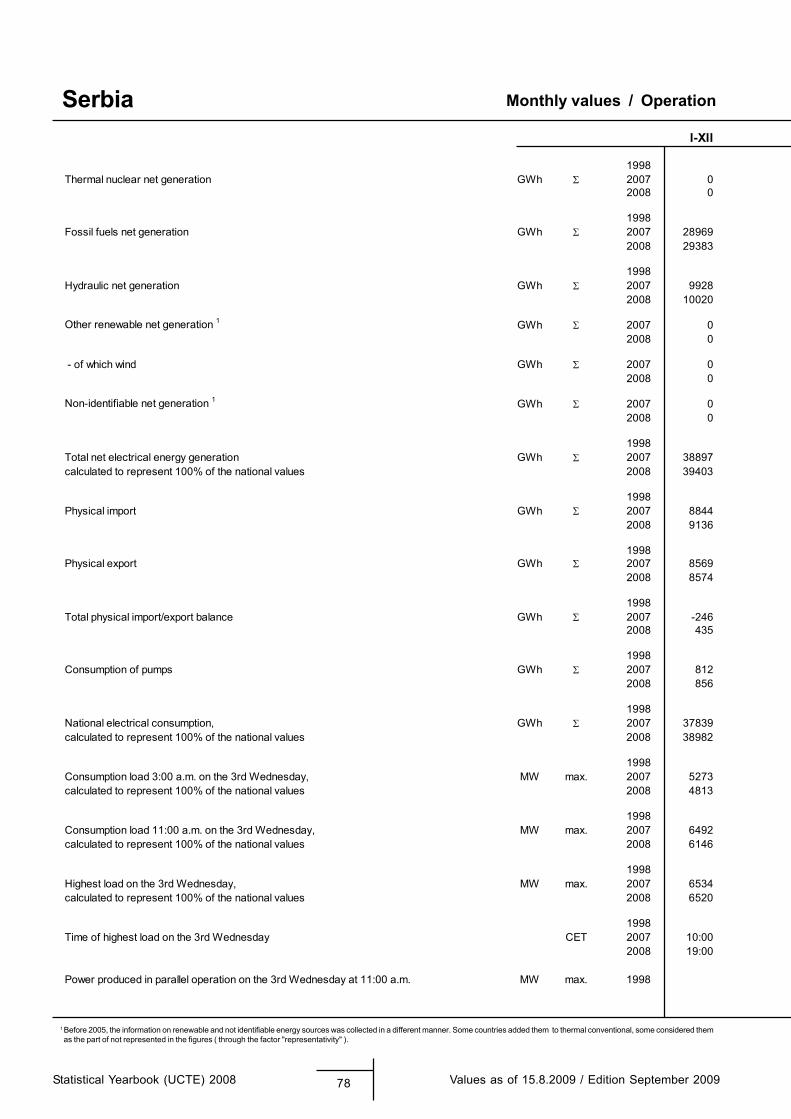
1 Before 2005, the information on renewable and not identifiable energy sources was collected in a different manner. Some countries added them to thermal conventional, some considered them as the part of not represented in the figures ( through the factor "representativity" ).
Monthly values / Operation
Statistical Yearbook (UCTE) 2008 78 Values as of 15.8.2009 / Edition September 2009
SerbiaI-XII
1998Thermal nuclear net generation GWh 2007 0
2008 0
1998Fossil fuels net generation GWh 2007 28969
2008 29383
1998Hydraulic net generation GWh 2007 9928
2008 10020
Other renewable net generation 1 GWh 2007 02008 0
- of which wind GWh 2007 02008 0
Non-identifiable net generation 1 GWh 2007 02008 0
1998Total net electrical energy generation GWh 2007 38897calculated to represent 100% of the national values 2008 39403
1998Physical import GWh 2007 8844
2008 9136
1998Physical export GWh 2007 8569
2008 8574
1998Total physical import/export balance GWh 2007 -246
2008 435
1998Consumption of pumps GWh 2007 812
2008 856
1998National electrical consumption, GWh 2007 37839calculated to represent 100% of the national values 2008 38982
1998Consumption load 3:00 a.m. on the 3rd Wednesday, MW max. 2007 5273calculated to represent 100% of the national values 2008 4813
1998Consumption load 11:00 a.m. on the 3rd Wednesday, MW max. 2007 6492calculated to represent 100% of the national values 2008 6146
1998Highest load on the 3rd Wednesday, MW max. 2007 6534calculated to represent 100% of the national values 2008 6520
1998Time of highest load on the 3rd Wednesday CET 2007 10:00
2008 19:00
Power produced in parallel operation on the 3rd Wednesday at 11:00 a.m. MW max. 1998
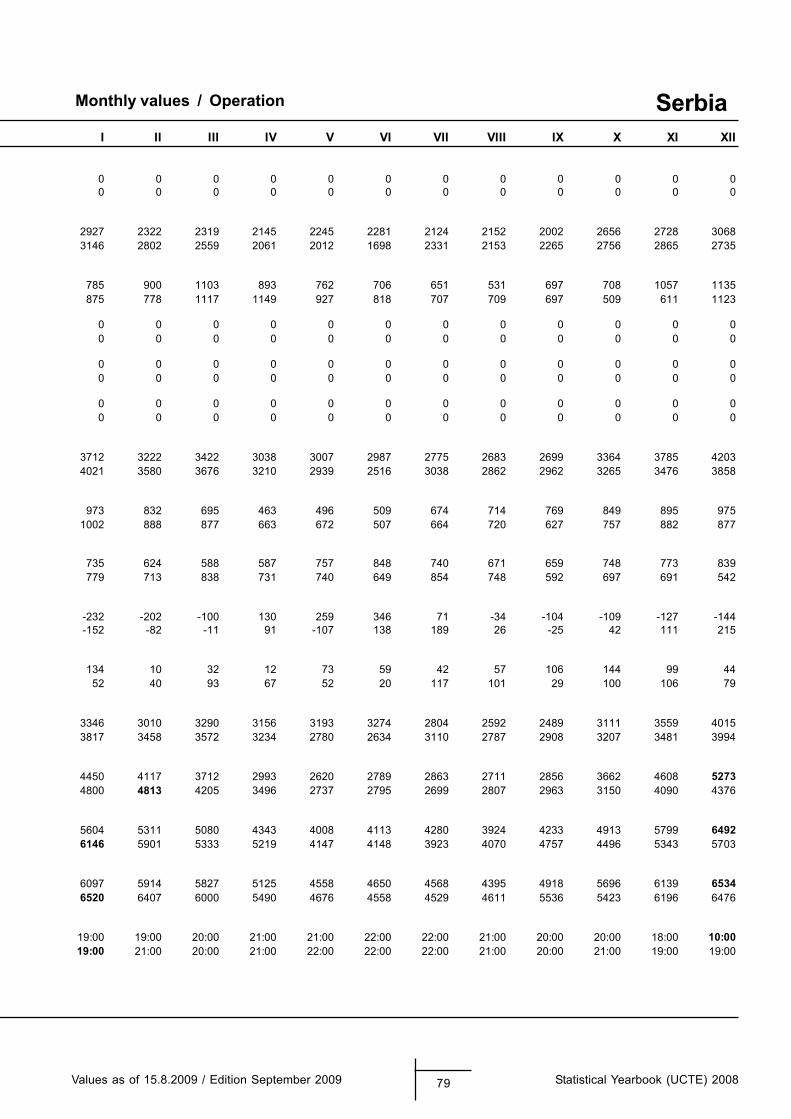
Monthly values / Operation
Values as of 15.8.2009 / Edition September 2009 79 Statistical Yearbook (UCTE) 2008
SerbiaI II III IV V VI VII VIII IX X XI XII
0 0 0 0 0 0 0 0 0 0 0 00 0 0 0 0 0 0 0 0 0 0 0
2927 2322 2319 2145 2245 2281 2124 2152 2002 2656 2728 30683146 2802 2559 2061 2012 1698 2331 2153 2265 2756 2865 2735
785 900 1103 893 762 706 651 531 697 708 1057 1135875 778 1117 1149 927 818 707 709 697 509 611 1123
0 0 0 0 0 0 0 0 0 0 0 00 0 0 0 0 0 0 0 0 0 0 0
0 0 0 0 0 0 0 0 0 0 0 00 0 0 0 0 0 0 0 0 0 0 0
0 0 0 0 0 0 0 0 0 0 0 00 0 0 0 0 0 0 0 0 0 0 0
3712 3222 3422 3038 3007 2987 2775 2683 2699 3364 3785 42034021 3580 3676 3210 2939 2516 3038 2862 2962 3265 3476 3858
973 832 695 463 496 509 674 714 769 849 895 9751002 888 877 663 672 507 664 720 627 757 882 877
735 624 588 587 757 848 740 671 659 748 773 839779 713 838 731 740 649 854 748 592 697 691 542
-232 -202 -100 130 259 346 71 -34 -104 -109 -127 -144-152 -82 -11 91 -107 138 189 26 -25 42 111 215
134 10 32 12 73 59 42 57 106 144 99 4452 40 93 67 52 20 117 101 29 100 106 79
3346 3010 3290 3156 3193 3274 2804 2592 2489 3111 3559 40153817 3458 3572 3234 2780 2634 3110 2787 2908 3207 3481 3994
4450 4117 3712 2993 2620 2789 2863 2711 2856 3662 4608 52734800 4813 4205 3496 2737 2795 2699 2807 2963 3150 4090 4376
5604 5311 5080 4343 4008 4113 4280 3924 4233 4913 5799 64926146 5901 5333 5219 4147 4148 3923 4070 4757 4496 5343 5703
6097 5914 5827 5125 4558 4650 4568 4395 4918 5696 6139 65346520 6407 6000 5490 4676 4558 4529 4611 5536 5423 6196 6476
19:00 19:00 20:00 21:00 21:00 22:00 22:00 21:00 20:00 20:00 18:00 10:0019:00 21:00 20:00 21:00 22:00 22:00 22:00 21:00 20:00 21:00 19:00 19:00
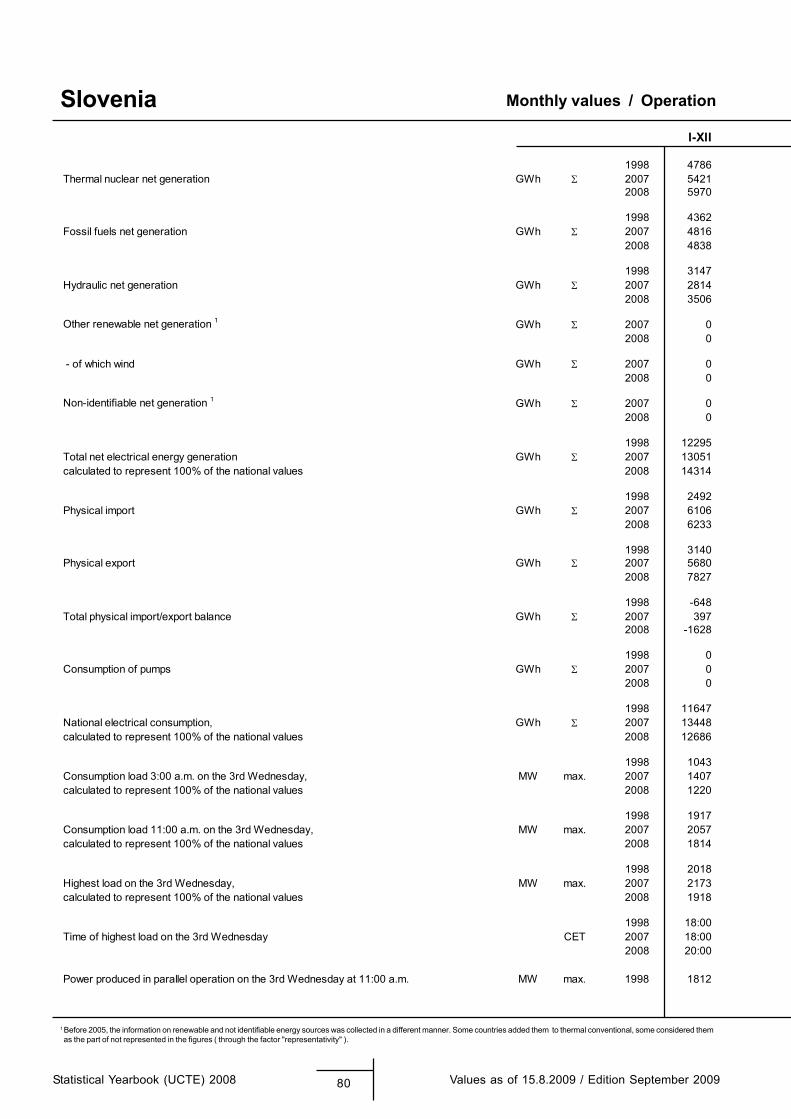
1 Before 2005, the information on renewable and not identifiable energy sources was collected in a different manner. Some countries added them to thermal conventional, some considered them as the part of not represented in the figures ( through the factor "representativity" ).
Monthly values / Operation
Statistical Yearbook (UCTE) 2008 80 Values as of 15.8.2009 / Edition September 2009
SloveniaI-XII
1998 4786Thermal nuclear net generation GWh 2007 5421
2008 5970
1998 4362Fossil fuels net generation GWh 2007 4816
2008 4838
1998 3147Hydraulic net generation GWh 2007 2814
2008 3506
Other renewable net generation 1 GWh 2007 02008 0
- of which wind GWh 2007 02008 0
Non-identifiable net generation 1 GWh 2007 02008 0
1998 12295Total net electrical energy generation GWh 2007 13051calculated to represent 100% of the national values 2008 14314
1998 2492Physical import GWh 2007 6106
2008 6233
1998 3140Physical export GWh 2007 5680
2008 7827
1998 -648Total physical import/export balance GWh 2007 397
2008 -1628
1998 0Consumption of pumps GWh 2007 0
2008 0
1998 11647National electrical consumption, GWh 2007 13448calculated to represent 100% of the national values 2008 12686
1998 1043Consumption load 3:00 a.m. on the 3rd Wednesday, MW max. 2007 1407calculated to represent 100% of the national values 2008 1220
1998 1917Consumption load 11:00 a.m. on the 3rd Wednesday, MW max. 2007 2057calculated to represent 100% of the national values 2008 1814
1998 2018Highest load on the 3rd Wednesday, MW max. 2007 2173calculated to represent 100% of the national values 2008 1918
1998 18:00Time of highest load on the 3rd Wednesday CET 2007 18:00
2008 20:00
Power produced in parallel operation on the 3rd Wednesday at 11:00 a.m. MW max. 1998 1812
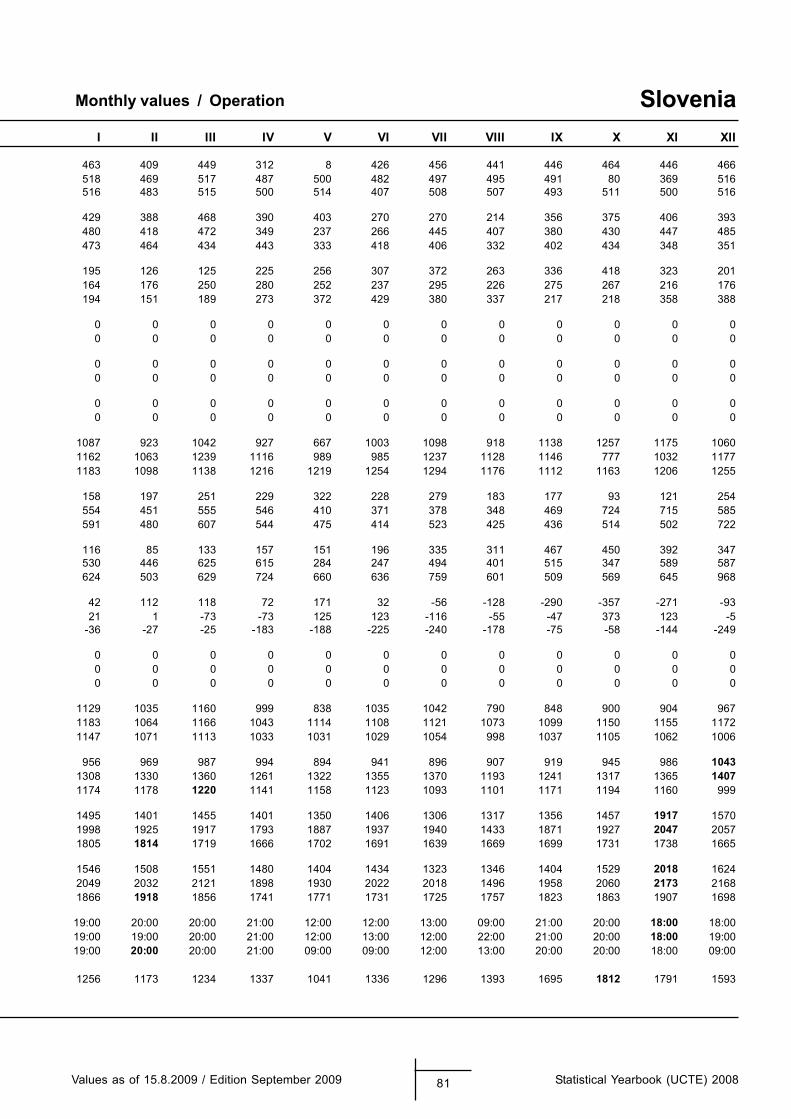
Monthly values / Operation
Values as of 15.8.2009 / Edition September 2009 81 Statistical Yearbook (UCTE) 2008
SloveniaI II III IV V VI VII VIII IX X XI XII
463 409 449 312 8 426 456 441 446 464 446 466518 469 517 487 500 482 497 495 491 80 369 516516 483 515 500 514 407 508 507 493 511 500 516
429 388 468 390 403 270 270 214 356 375 406 393480 418 472 349 237 266 445 407 380 430 447 485473 464 434 443 333 418 406 332 402 434 348 351
195 126 125 225 256 307 372 263 336 418 323 201164 176 250 280 252 237 295 226 275 267 216 176194 151 189 273 372 429 380 337 217 218 358 388
0 0 0 0 0 0 0 0 0 0 0 00 0 0 0 0 0 0 0 0 0 0 0
0 0 0 0 0 0 0 0 0 0 0 00 0 0 0 0 0 0 0 0 0 0 0
0 0 0 0 0 0 0 0 0 0 0 00 0 0 0 0 0 0 0 0 0 0 0
1087 923 1042 927 667 1003 1098 918 1138 1257 1175 10601162 1063 1239 1116 989 985 1237 1128 1146 777 1032 11771183 1098 1138 1216 1219 1254 1294 1176 1112 1163 1206 1255
158 197 251 229 322 228 279 183 177 93 121 254554 451 555 546 410 371 378 348 469 724 715 585591 480 607 544 475 414 523 425 436 514 502 722
116 85 133 157 151 196 335 311 467 450 392 347530 446 625 615 284 247 494 401 515 347 589 587624 503 629 724 660 636 759 601 509 569 645 968
42 112 118 72 171 32 -56 -128 -290 -357 -271 -9321 1 -73 -73 125 123 -116 -55 -47 373 123 -5
-36 -27 -25 -183 -188 -225 -240 -178 -75 -58 -144 -249
0 0 0 0 0 0 0 0 0 0 0 00 0 0 0 0 0 0 0 0 0 0 00 0 0 0 0 0 0 0 0 0 0 0
1129 1035 1160 999 838 1035 1042 790 848 900 904 9671183 1064 1166 1043 1114 1108 1121 1073 1099 1150 1155 11721147 1071 1113 1033 1031 1029 1054 998 1037 1105 1062 1006
956 969 987 994 894 941 896 907 919 945 986 10431308 1330 1360 1261 1322 1355 1370 1193 1241 1317 1365 14071174 1178 1220 1141 1158 1123 1093 1101 1171 1194 1160 999
1495 1401 1455 1401 1350 1406 1306 1317 1356 1457 1917 15701998 1925 1917 1793 1887 1937 1940 1433 1871 1927 2047 20571805 1814 1719 1666 1702 1691 1639 1669 1699 1731 1738 1665
1546 1508 1551 1480 1404 1434 1323 1346 1404 1529 2018 16242049 2032 2121 1898 1930 2022 2018 1496 1958 2060 2173 21681866 1918 1856 1741 1771 1731 1725 1757 1823 1863 1907 1698
19:00 20:00 20:00 21:00 12:00 12:00 13:00 09:00 21:00 20:00 18:00 18:0019:00 19:00 20:00 21:00 12:00 13:00 12:00 22:00 21:00 20:00 18:00 19:0019:00 20:00 20:00 21:00 09:00 09:00 12:00 13:00 20:00 20:00 18:00 09:00
1256 1173 1234 1337 1041 1336 1296 1393 1695 1812 1791 1593
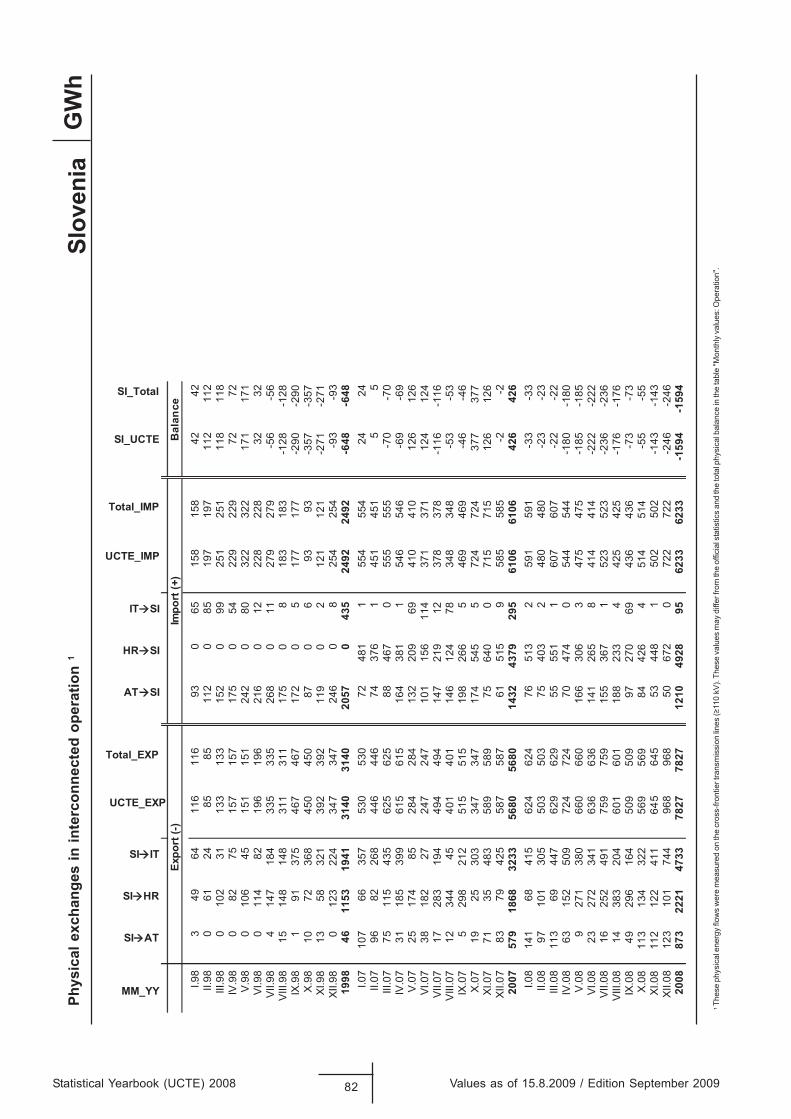
Statistical Yearbook (UCTE) 2008 82 Values as of 15.8.2009 / Edition September 2009
GW
hPh
ysic
al e
xcha
nges
in in
terc
onne
cted
ope
ratio
n 1
1
Thes
e ph
ysic
al e
nerg
y flo
ws
wer
e m
easu
red
on th
e cr
oss-
front
ier t
rans
mis
sion
lines
(≥11
0 kV
). Th
ese
valu
es m
ay d
iffer
from
the
offic
ial s
tatis
tics
and
the
tota
l phy
sica
l bal
ance
in th
e ta
ble
"Mon
thly
val
ues:
Ope
ratio
n".
Slov
enia
MM_YY
SI AT
SI HR
SI IT
UCTE_EXP
Total_EXP
AT SI
HR SI
IT SI
UCTE_IMP
Total_IMP
SI_UCTE
SI_Total
ecnalaB
)+( tropmI
)-( tropxE
I.98
349
6411
611
693
065
158
158
4242
II.98
061
2485
8511
20
8519
719
711
211
2III
.98
010
231
133
133
152
099
251
251
118
118
IV.9
80
8275
157
157
175
054
229
229
7272
V.9
80
106
4515
115
124
20
8032
232
217
117
1VI
.98
011
482
196
196
216
012
228
228
3232
VII.9
84
147
184
335
335
268
011
279
279
-56
-56
VIII
.98
1514
814
831
131
117
50
818
318
3-1
28-1
28IX
.98
191
375
467
467
172
05
177
177
-290
-290
X.9
810
7236
845
045
087
06
9393
-357
-357
XI.9
813
5832
139
239
211
90
212
112
1-2
71-2
71XI
I.98
012
322
434
734
724
60
825
425
4-9
3-9
319
9846
1153
1941
3140
3140
2057
043
524
9224
92-6
48-6
48I.0
710
766
357
530
530
7248
11
554
554
2424
II.07
9682
268
446
446
7437
61
451
451
55
III.0
775
115
435
625
625
8846
70
555
555
-70
-70
IV.0
731
185
399
615
615
164
381
154
654
6-6
9-6
9V
.07
2517
485
284
284
132
209
6941
041
012
612
6VI
.07
3818
227
247
247
101
156
114
371
371
124
124
VII.0
717
283
194
494
494
147
219
1237
837
8-1
16-1
16V
III.0
712
344
4540
140
114
612
478
348
348
-53
-53
IX.0
75
298
212
515
515
198
266
546
946
9-4
6-4
6X
.07
1925
303
347
347
174
545
572
472
437
737
7XI
.07
7135
483
589
589
7564
00
715
715
126
126
XII.0
783
7942
558
758
761
515
958
558
5-2
-220
0757
918
6832
3356
8056
8014
3243
7929
561
0661
0642
642
6I.0
814
168
415
624
624
7651
32
591
591
-33
-33
II.08
9710
130
550
350
375
403
248
048
0-2
3-2
3III
.08
113
6944
762
962
955
551
160
760
7-2
2-2
2IV
.08
6315
250
972
472
470
474
054
454
4-1
80-1
80V
.08
927
138
066
066
016
630
63
475
475
-185
-185
VI.0
823
272
341
636
636
141
265
841
441
4-2
22-2
22VI
I.08
1625
249
175
975
915
536
71
523
523
-236
-236
VIII
.08
1438
320
460
160
118
823
34
425
425
-176
-176
IX.0
849
296
164
509
509
9727
069
436
436
-73
-73
X.0
811
313
432
256
956
984
426
451
451
4-5
5-5
5XI
.08
112
122
411
645
645
5344
81
502
502
-143
-143
XII.0
812
310
174
496
896
850
672
072
272
2-2
46-2
4620
0887
322
2147
3378
2778
2712
1049
2895
6233
6233
-159
4-1
594
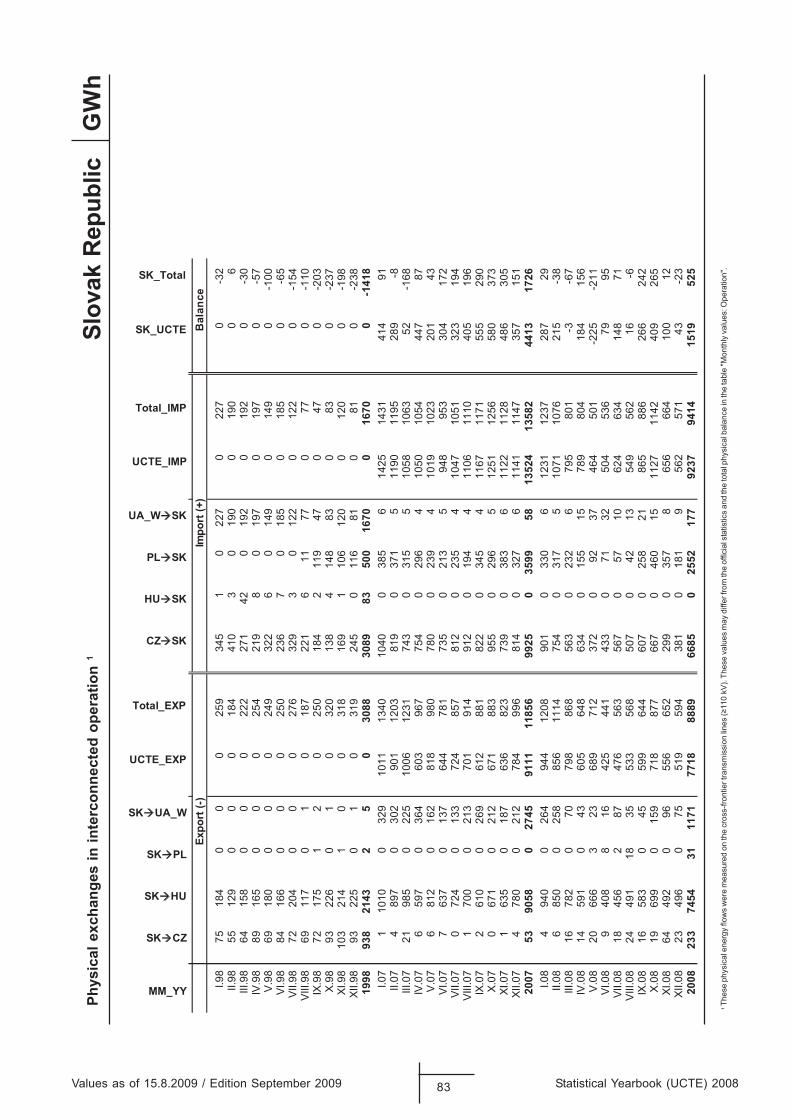
1
Thes
e ph
ysic
al e
nerg
y flo
ws
wer
e m
easu
red
on th
e cr
oss-
front
ier t
rans
mis
sion
lines
(≥11
0 kV
). Th
ese
valu
es m
ay d
iffer
from
the
offic
ial s
tatis
tics
and
the
tota
l phy
sica
l bal
ance
in th
e ta
ble
"Mon
thly
val
ues:
Ope
ratio
n".
Values as of 15.8.2009 / Edition September 2009 83 Statistical Yearbook (UCTE) 2008
GW
hPh
ysic
al e
xcha
nges
in in
terc
onne
cted
ope
ratio
n 1
Slov
ak R
epub
lic
MM_YY
SK CZ
SK HU
SK PL
SK UA_W
UCTE_EXP
Total_EXP
CZ SK
HU SK
PL SK
UA_W SK
UCTE_IMP
Total_IMP
SK_UCTE
SK_Total
ecnalaB
)+( tropmI
)-( tropxE
I.98
7518
40
00
259
345
10
227
022
70
-32
II.98
5512
90
00
184
410
30
190
019
00
6III
.98
6415
80
00
222
271
420
192
019
20
-30
IV.9
889
165
00
025
421
98
019
70
197
0-5
7V
.98
6918
00
00
249
322
60
149
014
90
-100
VI.9
884
166
00
025
023
67
018
50
185
0-6
5VI
I.98
7220
40
00
276
329
30
122
012
20
-154
VIII
.98
6911
70
10
187
221
611
770
770
-110
IX.9
872
175
12
025
018
42
119
470
470
-203
X.9
893
226
01
032
013
84
148
830
830
-237
XI.9
810
321
41
00
318
169
110
612
00
120
0-1
98XI
I.98
9322
50
10
319
245
011
681
081
0-2
3819
9893
821
432
50
308 8
3089
8350
016
700
1670
0-1
418
I.07
110
100
329
1011
1340
1040
038
56
1425
1431
414
91II.
074
897
030
290
112
0381
90
371
511
9011
9528
9-8
III.0
721
985
022
510
0612
3174
30
315
510
5810
6352
-168
IV.0
76
597
036
460
396
775
40
296
410
5010
5444
787
V.0
76
812
016
281
898
078
00
239
410
1910
2320
143
VI.0
77
637
013
764
478
173
50
213
594
895
330
417
2VI
I.07
072
40
133
724
857
812
023
54
1047
1051
323
194
VIII
.07
170
00
213
701
914
912
019
44
1106
1110
405
196
IX.0
72
610
026
961
288
182
20
345
411
6711
7155
529
0X
.07
067
10
212
671
883
955
029
65
1251
1256
580
373
XI.0
71
635
018
763
682
373
90
383
611
2211
2848
630
5XI
I.07
478
00
212
784
9 96
814
032
76
1141
1147
357
151
2007
5390
580
2745
9111
1185
699
250
3599
5813
524
1358
244
1317
26I.0
84
940
026
494
412
0890
10
330
612
3112
3728
729
II.08
685
00
258
856
1114
754
031
75
1071
1076
215
-38
III.0
816
782
070
798
868
563
023
26
795
801
-3-6
7IV
.08
1459
10
4360
564
863
40
155
1578
980
418
415
6V
.08
2066
63
2368
971
237
20
9237
464
501
-225
-211
VI.0
89
408
816
425
441
433
071
3250
453
679
95VI
I.08
1845
62
8747
656
356
70
5710
624
634
148
71V
III.0
824
491
1835
533
568
507
042
1354
956
216
-6IX
.08
1658
30
4559
964
460
70
258
2186
588
626
624
2X
.08
1969
90
159
718
877
667
046
015
1127
1142
409
265
XI.0
864
492
096
556
652
299
035
78
656
664
100
12XI
I.08
2349
60
7551
959
438
10
181
956
257
143
-23
2008
233
7454
3111
7177
1888
8966
850
2552
177
9237
9414
1519
525
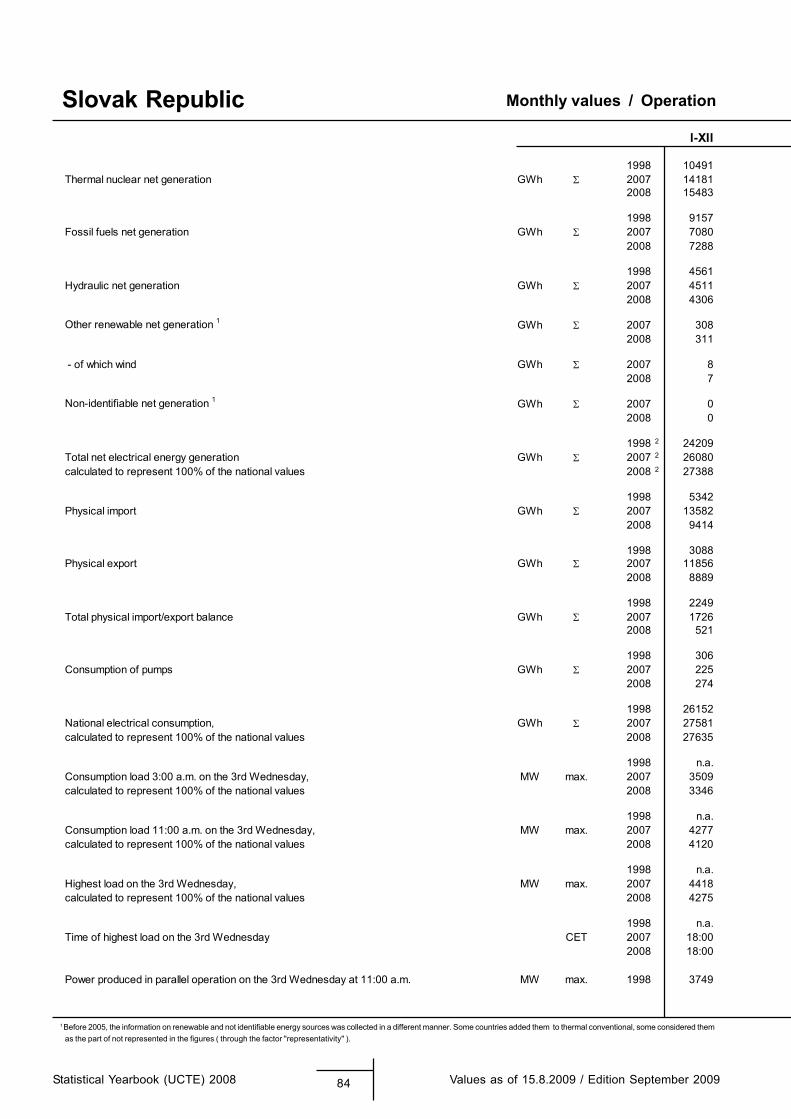
1 Before 2005, the information on renewable and not identifiable energy sources was collected in a different manner. Some countries added them to thermal conventional, some considered them as the part of not represented in the figures ( through the factor "representativity" ).
Monthly values / Operation
Statistical Yearbook (UCTE) 2008 84 Values as of 15.8.2009 / Edition September 2009
Slovak RepublicI-XII
1998 10491Thermal nuclear net generation GWh 2007 14181
2008 15483
1998 9157Fossil fuels net generation GWh 2007 7080
2008 7288
1998 4561Hydraulic net generation GWh 2007 4511
2008 4306
Other renewable net generation 1 GWh 2007 3082008 311
- of which wind GWh 2007 82008 7
Non-identifiable net generation 1 GWh 2007 02008 0
1998 2 24209Total net electrical energy generation GWh 2007 2 26080calculated to represent 100% of the national values 2008 2 27388
1998 5342Physical import GWh 2007 13582
2008 9414
1998 3088Physical export GWh 2007 11856
2008 8889
1998 2249Total physical import/export balance GWh 2007 1726
2008 521
1998 306Consumption of pumps GWh 2007 225
2008 274
1998 26152National electrical consumption, GWh 2007 27581calculated to represent 100% of the national values 2008 27635
1998 n.a.Consumption load 3:00 a.m. on the 3rd Wednesday, MW max. 2007 3509calculated to represent 100% of the national values 2008 3346
1998 n.a.Consumption load 11:00 a.m. on the 3rd Wednesday, MW max. 2007 4277calculated to represent 100% of the national values 2008 4120
1998 n.a.Highest load on the 3rd Wednesday, MW max. 2007 4418calculated to represent 100% of the national values 2008 4275
1998 n.a.Time of highest load on the 3rd Wednesday CET 2007 18:00
2008 18:00
Power produced in parallel operation on the 3rd Wednesday at 11:00 a.m. MW max. 1998 3749
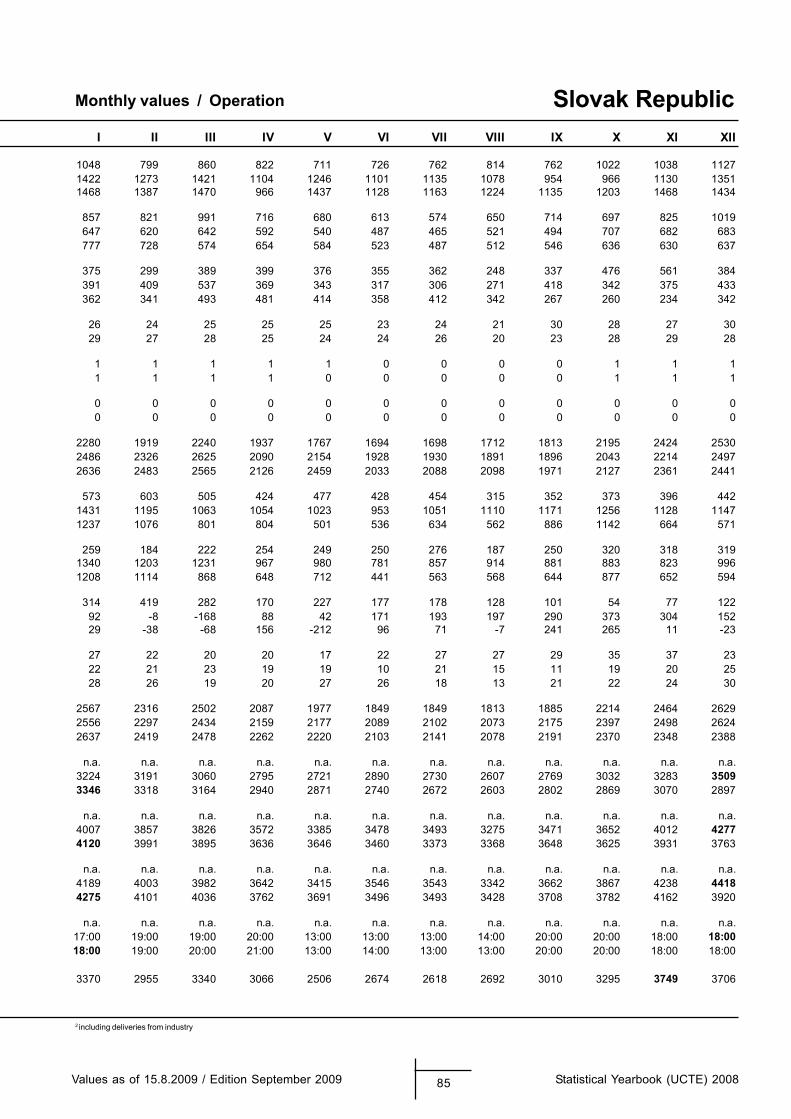
2 including deliveries from industry
Monthly values / Operation
Values as of 15.8.2009 / Edition September 2009 85 Statistical Yearbook (UCTE) 2008
Slovak RepublicI II III IV V VI VII VIII IX X XI XII
1048 799 860 822 711 726 762 814 762 1022 1038 11271422 1273 1421 1104 1246 1101 1135 1078 954 966 1130 13511468 1387 1470 966 1437 1128 1163 1224 1135 1203 1468 1434
857 821 991 716 680 613 574 650 714 697 825 1019647 620 642 592 540 487 465 521 494 707 682 683777 728 574 654 584 523 487 512 546 636 630 637
375 299 389 399 376 355 362 248 337 476 561 384391 409 537 369 343 317 306 271 418 342 375 433362 341 493 481 414 358 412 342 267 260 234 342
26 24 25 25 25 23 24 21 30 28 27 3029 27 28 25 24 24 26 20 23 28 29 28
1 1 1 1 1 0 0 0 0 1 1 11 1 1 1 0 0 0 0 0 1 1 1
0 0 0 0 0 0 0 0 0 0 0 00 0 0 0 0 0 0 0 0 0 0 0
2280 1919 2240 1937 1767 1694 1698 1712 1813 2195 2424 25302486 2326 2625 2090 2154 1928 1930 1891 1896 2043 2214 24972636 2483 2565 2126 2459 2033 2088 2098 1971 2127 2361 2441
573 603 505 424 477 428 454 315 352 373 396 4421431 1195 1063 1054 1023 953 1051 1110 1171 1256 1128 11471237 1076 801 804 501 536 634 562 886 1142 664 571
259 184 222 254 249 250 276 187 250 320 318 3191340 1203 1231 967 980 781 857 914 881 883 823 9961208 1114 868 648 712 441 563 568 644 877 652 594
314 419 282 170 227 177 178 128 101 54 77 12292 -8 -168 88 42 171 193 197 290 373 304 15229 -38 -68 156 -212 96 71 -7 241 265 11 -23
27 22 20 20 17 22 27 27 29 35 37 2322 21 23 19 19 10 21 15 11 19 20 2528 26 19 20 27 26 18 13 21 22 24 30
2567 2316 2502 2087 1977 1849 1849 1813 1885 2214 2464 26292556 2297 2434 2159 2177 2089 2102 2073 2175 2397 2498 26242637 2419 2478 2262 2220 2103 2141 2078 2191 2370 2348 2388
n.a. n.a. n.a. n.a. n.a. n.a. n.a. n.a. n.a. n.a. n.a. n.a.3224 3191 3060 2795 2721 2890 2730 2607 2769 3032 3283 35093346 3318 3164 2940 2871 2740 2672 2603 2802 2869 3070 2897
n.a. n.a. n.a. n.a. n.a. n.a. n.a. n.a. n.a. n.a. n.a. n.a.4007 3857 3826 3572 3385 3478 3493 3275 3471 3652 4012 42774120 3991 3895 3636 3646 3460 3373 3368 3648 3625 3931 3763
n.a. n.a. n.a. n.a. n.a. n.a. n.a. n.a. n.a. n.a. n.a. n.a.4189 4003 3982 3642 3415 3546 3543 3342 3662 3867 4238 44184275 4101 4036 3762 3691 3496 3493 3428 3708 3782 4162 3920
n.a. n.a. n.a. n.a. n.a. n.a. n.a. n.a. n.a. n.a. n.a. n.a.17:00 19:00 19:00 20:00 13:00 13:00 13:00 14:00 20:00 20:00 18:00 18:0018:00 19:00 20:00 21:00 13:00 14:00 13:00 13:00 20:00 20:00 18:00 18:00
3370 2955 3340 3066 2506 2674 2618 2692 3010 3295 3749 3706
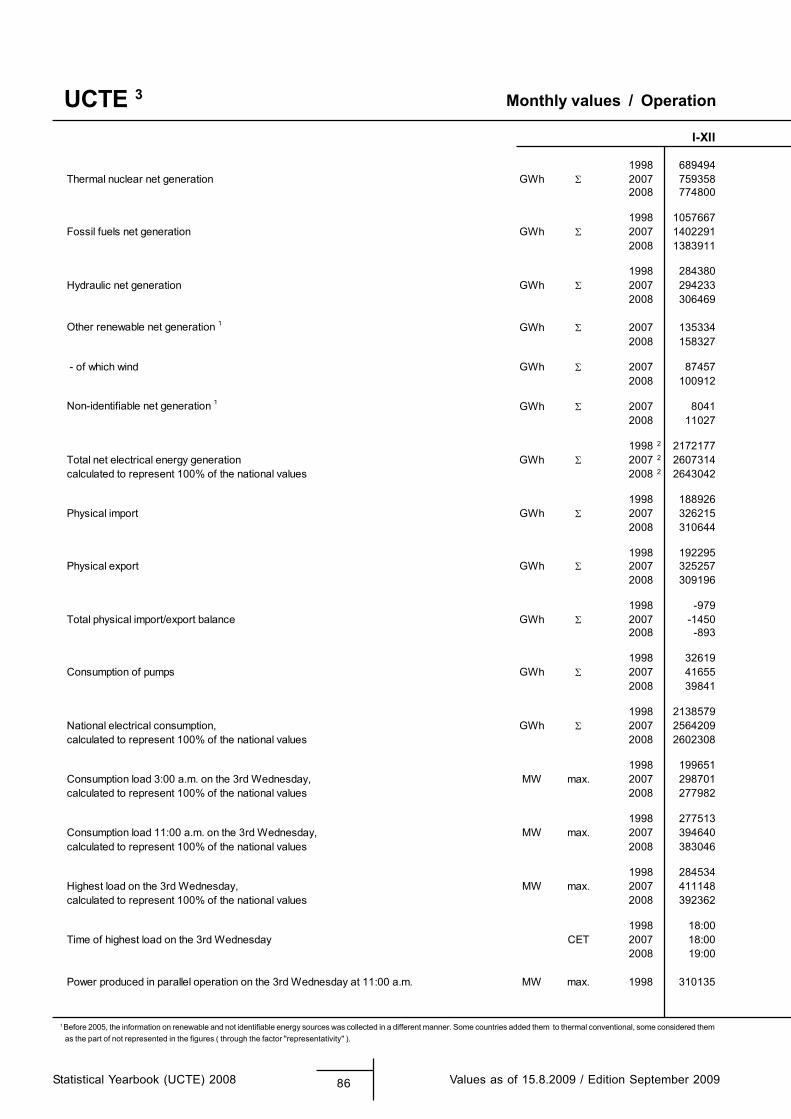
1 Before 2005, the information on renewable and not identifiable energy sources was collected in a different manner. Some countries added them to thermal conventional, some considered them as the part of not represented in the figures ( through the factor "representativity" ).
Monthly values / Operation
Statistical Yearbook (UCTE) 2008 86 Values as of 15.8.2009 / Edition September 2009
UCTE 3
I-XII
1998 689494Thermal nuclear net generation GWh 2007 759358
2008 774800
1998 1057667Fossil fuels net generation GWh 2007 1402291
2008 1383911
1998 284380Hydraulic net generation GWh 2007 294233
2008 306469
Other renewable net generation 1 GWh 2007 1353342008 158327
- of which wind GWh 2007 874572008 100912
Non-identifiable net generation 1 GWh 2007 80412008 11027
1998 2 2172177Total net electrical energy generation GWh 2007 2 2607314calculated to represent 100% of the national values 2008 2 2643042
1998 188926Physical import GWh 2007 326215
2008 310644
1998 192295Physical export GWh 2007 325257
2008 309196
1998 -979Total physical import/export balance GWh 2007 -1450
2008 -893
1998 32619Consumption of pumps GWh 2007 41655
2008 39841
1998 2138579National electrical consumption, GWh 2007 2564209calculated to represent 100% of the national values 2008 2602308
1998 199651Consumption load 3:00 a.m. on the 3rd Wednesday, MW max. 2007 298701calculated to represent 100% of the national values 2008 277982
1998 277513Consumption load 11:00 a.m. on the 3rd Wednesday, MW max. 2007 394640calculated to represent 100% of the national values 2008 383046
1998 284534Highest load on the 3rd Wednesday, MW max. 2007 411148calculated to represent 100% of the national values 2008 392362
1998 18:00Time of highest load on the 3rd Wednesday CET 2007 18:00
2008 19:00
Power produced in parallel operation on the 3rd Wednesday at 11:00 a.m. MW max. 1998 310135
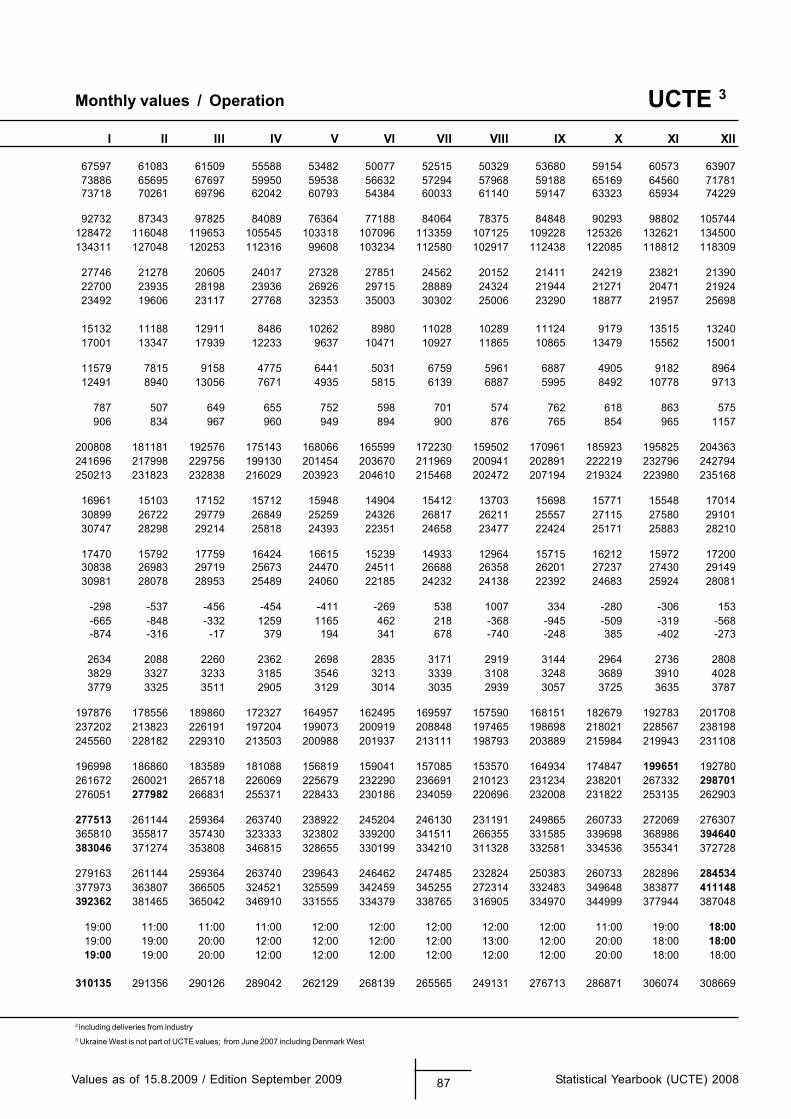
2 including deliveries from industry
Monthly values / Operation
Values as of 15.8.2009 / Edition September 2009 87 Statistical Yearbook (UCTE) 2008
UCTE 3
3 Ukraine West is not part of UCTE values; from June 2007 including Denmark West
I II III IV V VI VII VIII IX X XI XII
67597 61083 61509 55588 53482 50077 52515 50329 53680 59154 60573 6390773886 65695 67697 59950 59538 56632 57294 57968 59188 65169 64560 7178173718 70261 69796 62042 60793 54384 60033 61140 59147 63323 65934 74229
92732 87343 97825 84089 76364 77188 84064 78375 84848 90293 98802 105744128472 116048 119653 105545 103318 107096 113359 107125 109228 125326 132621 134500134311 127048 120253 112316 99608 103234 112580 102917 112438 122085 118812 118309
27746 21278 20605 24017 27328 27851 24562 20152 21411 24219 23821 2139022700 23935 28198 23936 26926 29715 28889 24324 21944 21271 20471 2192423492 19606 23117 27768 32353 35003 30302 25006 23290 18877 21957 25698
15132 11188 12911 8486 10262 8980 11028 10289 11124 9179 13515 1324017001 13347 17939 12233 9637 10471 10927 11865 10865 13479 15562 15001
11579 7815 9158 4775 6441 5031 6759 5961 6887 4905 9182 896412491 8940 13056 7671 4935 5815 6139 6887 5995 8492 10778 9713
787 507 649 655 752 598 701 574 762 618 863 575906 834 967 960 949 894 900 876 765 854 965 1157
200808 181181 192576 175143 168066 165599 172230 159502 170961 185923 195825 204363241696 217998 229756 199130 201454 203670 211969 200941 202891 222219 232796 242794250213 231823 232838 216029 203923 204610 215468 202472 207194 219324 223980 235168
16961 15103 17152 15712 15948 14904 15412 13703 15698 15771 15548 1701430899 26722 29779 26849 25259 24326 26817 26211 25557 27115 27580 2910130747 28298 29214 25818 24393 22351 24658 23477 22424 25171 25883 28210
17470 15792 17759 16424 16615 15239 14933 12964 15715 16212 15972 1720030838 26983 29719 25673 24470 24511 26688 26358 26201 27237 27430 2914930981 28078 28953 25489 24060 22185 24232 24138 22392 24683 25924 28081
-298 -537 -456 -454 -411 -269 538 1007 334 -280 -306 153-665 -848 -332 1259 1165 462 218 -368 -945 -509 -319 -568-874 -316 -17 379 194 341 678 -740 -248 385 -402 -273
2634 2088 2260 2362 2698 2835 3171 2919 3144 2964 2736 28083829 3327 3233 3185 3546 3213 3339 3108 3248 3689 3910 40283779 3325 3511 2905 3129 3014 3035 2939 3057 3725 3635 3787
197876 178556 189860 172327 164957 162495 169597 157590 168151 182679 192783 201708237202 213823 226191 197204 199073 200919 208848 197465 198698 218021 228567 238198245560 228182 229310 213503 200988 201937 213111 198793 203889 215984 219943 231108
196998 186860 183589 181088 156819 159041 157085 153570 164934 174847 199651 192780261672 260021 265718 226069 225679 232290 236691 210123 231234 238201 267332 298701276051 277982 266831 255371 228433 230186 234059 220696 232008 231822 253135 262903
277513 261144 259364 263740 238922 245204 246130 231191 249865 260733 272069 276307365810 355817 357430 323333 323802 339200 341511 266355 331585 339698 368986 394640383046 371274 353808 346815 328655 330199 334210 311328 332581 334536 355341 372728
279163 261144 259364 263740 239643 246462 247485 232824 250383 260733 282896 284534377973 363807 366505 324521 325599 342459 345255 272314 332483 349648 383877 411148392362 381465 365042 346910 331555 334379 338765 316905 334970 344999 377944 387048
19:00 11:00 11:00 11:00 12:00 12:00 12:00 12:00 12:00 11:00 19:00 18:0019:00 19:00 20:00 12:00 12:00 12:00 12:00 13:00 12:00 20:00 18:00 18:0019:00 19:00 20:00 12:00 12:00 12:00 12:00 12:00 12:00 20:00 18:00 18:00
310135 291356 290126 289042 262129 268139 265565 249131 276713 286871 306074 308669

Statistical Yearbook (UCTE) 2008 88 Values as of 15.8.2009 / Edition September 2009
EXPO
RTI
NG
CO
UN
TRIE
S
Annual physical electricity exchange in interconnected operation (GWh)UCTEIMPORTING COUNTRIES
Year AT BA BE BG CH CZ DE DK_W ES FR GR HR HU IT
1998 3055 67 3954 106 1632AT 2007 8222 40 4511 1457 1405
2008 7449 56 5607 839 13671998 793
BA 2007 17022008 26641998 1445
BE 2007 23212008 20361998 1086
BG 2007 42972008 46281998 203 5259 1007 21467
CH 2007 37 3105 2648 288592008 106 2709 3548 241621998 2750 4802
CZ 2007 6988 94212008 5335 79401998 6165 10314 336 n.a. 404
DE 2007 16132 15026 886 680 7292008 14997 13858 1326 586 8681998 n.a.
DK_W 2007 59052008 71801998 757
ES 2007 11132008 1661
68561781589621271957448991FR 231511266434612440164387002
14821465496501787868278002158991 0
GR 07002 17008002 181
1998 310 0HR 2007 1175 0
2008 737 41998 1275 416
HU 2007 243 65362008 721 5301
0108991 453 0IT 6607002 1154 1131
00418002 1140 17581998 0 923
LU 2007 2084 8022008 1629 8351998
ME 36170029328002
1998 1412MK 2007 1 904
2008 0 1189394161238991
NL 0038625700292812188002
1998 7078 503PL 2007 9230 48
2008 6909 961998 3719
PT 2007 21542008 13151998 n.a. n.a.
RO 75037002 25059038002 720
1998RS 2007 2405 0 1791 0
187328002 2061 01998 46 1153 1941
SI 2007 579 1868 32332008 873 2221 47331998 938 2143
SK 2007 53 90582008 233 74541998 n.a.
UA_W 2007 39152008 3755
1998 6414 310 7691 240 22551 403 24327 n.a. 8906 4066 1412 1696 106 41626UCTE 2007 23979 3743 15698 3057 33756 10209 37917 680 8775 7965 6332 11897 10765 48799
2008 22033 3354 17036 3095 30494 8524 35765 586 5879 9253 7575 12247 9017 43284
Third 1998 4025 0 0 n.a. 0 8016 12540 n.a. 1 32 1097 728 2143 0countries 2007 0 0 0 0 0 0 6353 5591 21 2395 89 0 3915 0
2008 0 0 0 0 0 0 4480 7178 15 923 0 0 3755 0
Total 1998 10439 310 7691 n.a. 22551 8419 36867 n.a. 8907 4098 2509 2424 2249 41626Import 2007 23979 3743 15698 3057 33756 10209 44270 6271 8796 10360 6421 11897 14680 48799
2008 22033 3354 17036 3095 30494 8524 40245 7764 5894 10176 7575 12247 12772 43284
UCTE 1998 -4284 -483 1251 n.a. -5385 -7149 -10627 n.a. 4260 -44052 1389 1384 -2276 40728Balance 2007 6912 -601 6660 -4463 -893 -16145 -23353 -5225 -1821 -49010 6051 6343 176 46153
2008 5505 -1650 10475 -5345 -31 -11462 -25609 -6594 -6379 -34794 7299 6578 241 39890
Total 1998 -432 n.a. 1251 n.a. -5385 -2328 -1745 n.a. 3560 -56618 1620 2112 -216 40728Balance 2007 6912 -601 6660 -4463 -893 -16145 -19115 -1773 -5302 -55105 4366 6343 3984 46153
2008 5505 -1650 10475 -5345 -31 -11462 -22450 -1035 -10591 -46319 5611 6578 3905 39890
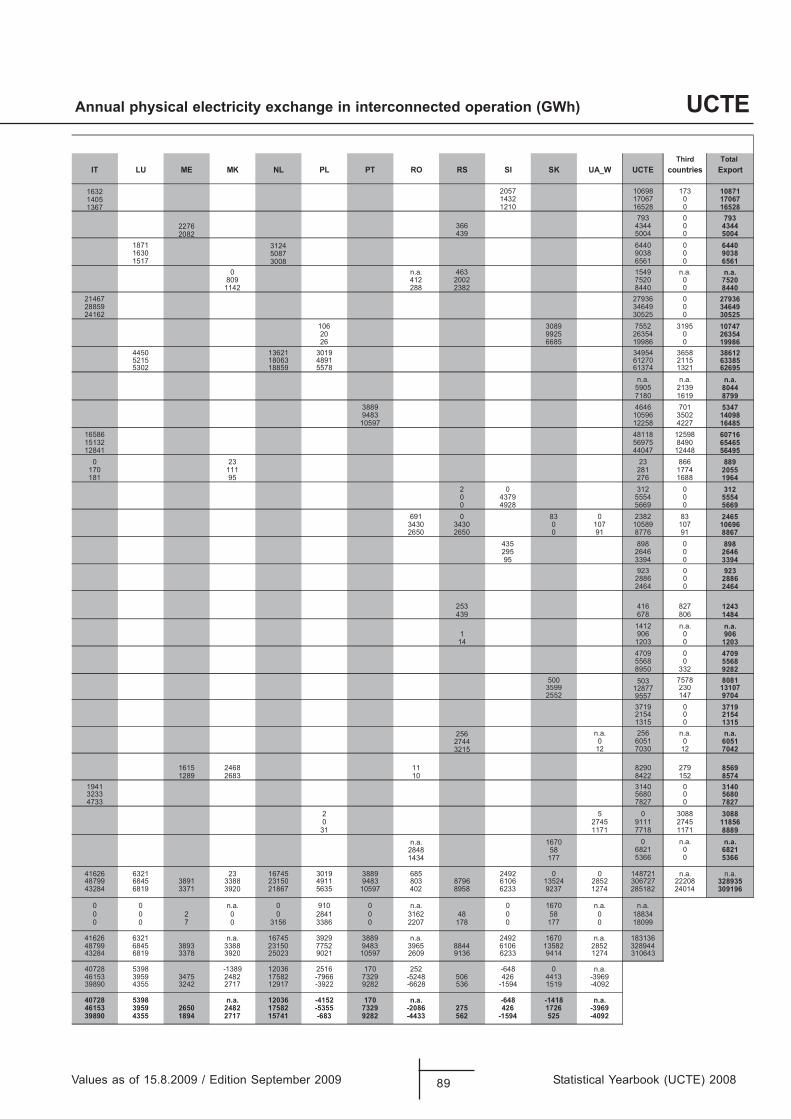
Values as of 15.8.2009 / Edition September 2009 89 Statistical Yearbook (UCTE) 2008
Annual physical electricity exchange in interconnected operation (GWh) UCTE
Third Total IT LU ME MK NL PL PT RO RS SI SK UA_W UCTE countries Export
1632 371896017502 108711405 0760712341 170671367 0825610121 16528
793 0 7932276 04434663 43442082 04005934 5004
1871 3124 6440 0 64401630 5087 9038 0 90381517 3008 6561 0 6561
.a.n9451364.a.n0 n.a.002572002214908 75200044828328822411 8440
21467 27936 0 2793628859 34649 0 3464924162 30525 0 30525
591325579803601 10747045362529902 26354068991586662 19986
4450 13621 3019 34954 3658 386125215 18063 4891 61270 2115 633855302 18859 5578 61374 1321 62695
n.a. n.a. n.a.5905 2139 80447180 1619 8799
3889 4646 701 53479483 10596 3502 1409810597 12258 4227 16485
16586 48118 12598 6071615132 56975 8490 6546512841 44047 12448 56495
320 23 866 889111071 281 1774 2055
59181 276 1688 1964021302 3120455597340 55540966582940 56693828320380196 246570198501701003430343 10696
19677819005620562 88670898534 89806462592 26460493359 3394
923 0 9232886 0 28862464 0 2464
728614352 1243608876934 1484
1412 n.a. n.a.06091 9060302141 1203
4709 0 47095568 0 55688950 332 9282
500 503 7578 80813599 12877 230 131072552 9557 147 9704
3719 0 37192154 0 21541315 0 1315
256 n.a. 256 n.a. n.a.2744 0 6051 0 60513215 12 7030 12 7042
1615 2468 11 8290 279 856925122480138629821 8574
1941 3140 0 31403233 5680 0 56804733 7827 0 7827
2 5 0 3088 30880 2745 9111 2745 11856
31 1171 7718 1171 88890761.a.n 0 n.a. n.a.
858482 6821 0 68217714341 5366 0 5366
41626 6321 23 16745 3019 3889 685 2492 0 0 148721 n.a. n.a.48799 6845 3891 3388 23150 4911 9483 803 8796 6106 13524 2852 306727 22208 32893543284 6819 3371 3920 21867 5635 10597 402 8958 6233 9237 1274 285182 24014 309196
.a.n.a.n07610.a.n00190.a.n000 0 2 0 0 2841 0 3162 48 0 58 0 188340 0 7 0 3156 3386 0 2207 178 0 177 0 18099
631381.a.n07612942.a.n9883929354761.a.n12366261448799 6845 3893 3388 23150 7752 9483 3965 8844 6106 13582 2852 32894443284 6819 3378 3920 25023 9021 10597 2609 9136 6233 9414 1274 310643
.a.n0846-2520716152630219831-89358270446153 3959 3475 2482 17582 -7966 7329 -5248 506 426 4413 -396939890 4355 3242 2717 12917 -3922 9282 -6628 536 -1594 1519 -4092
.a.n8141-846-.a.n0712514-63021.a.n89358270446153 3959 2650 2482 17582 -5355 7329 -2086 275 426 1726 -396939890 4355 1894 2717 15741 -683 9282 -4433 562 -1594 525 -4092
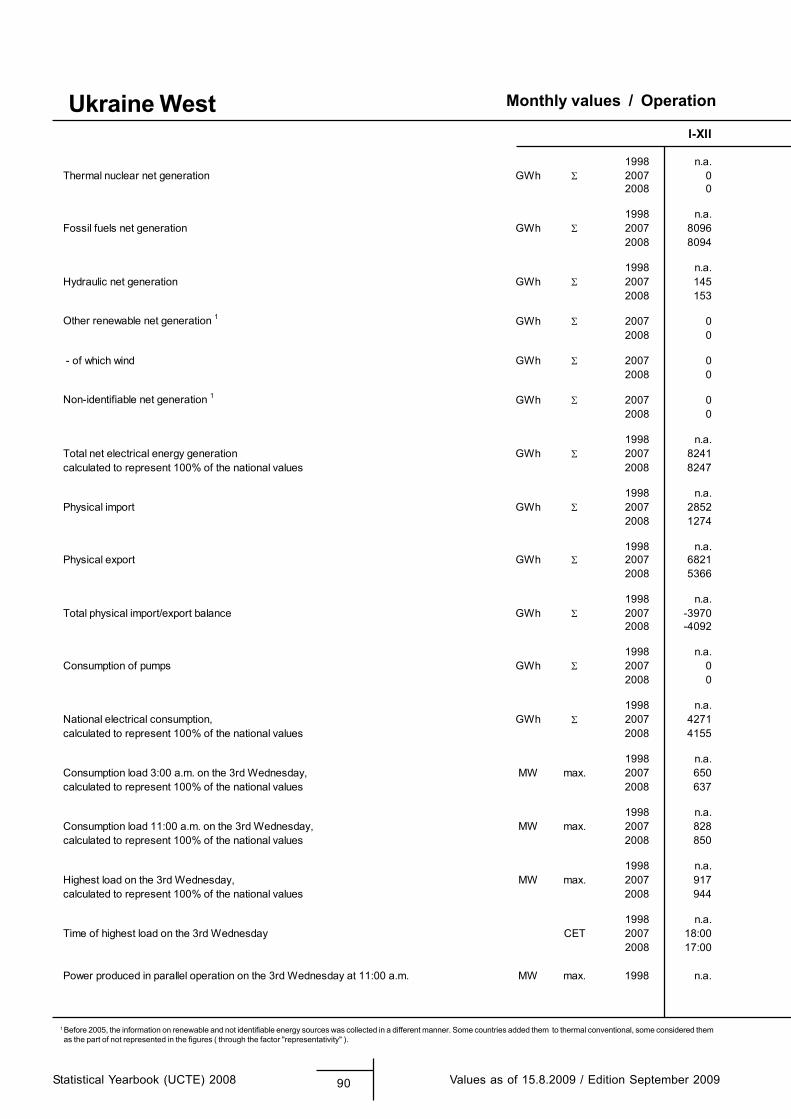
1 Before 2005, the information on renewable and not identifiable energy sources was collected in a different manner. Some countries added them to thermal conventional, some considered them as the part of not represented in the figures ( through the factor "representativity" ).
Monthly values / Operation
Statistical Yearbook (UCTE) 2008 90 Values as of 15.8.2009 / Edition September 2009
Ukraine WestI-XII
1998 n.a.Thermal nuclear net generation GWh 2007 0
2008 0
1998 n.a.Fossil fuels net generation GWh 2007 8096
2008 8094
1998 n.a.Hydraulic net generation GWh 2007 145
2008 153
Other renewable net generation 1 GWh 2007 02008 0
- of which wind GWh 2007 02008 0
Non-identifiable net generation 1 GWh 2007 02008 0
1998 n.a.Total net electrical energy generation GWh 2007 8241calculated to represent 100% of the national values 2008 8247
1998 n.a.Physical import GWh 2007 2852
2008 1274
1998 n.a.Physical export GWh 2007 6821
2008 5366
1998 n.a.Total physical import/export balance GWh 2007 -3970
2008 -4092
1998 n.a.Consumption of pumps GWh 2007 0
2008 0
1998 n.a.National electrical consumption, GWh 2007 4271calculated to represent 100% of the national values 2008 4155
1998 n.a.Consumption load 3:00 a.m. on the 3rd Wednesday, MW max. 2007 650calculated to represent 100% of the national values 2008 637
1998 n.a.Consumption load 11:00 a.m. on the 3rd Wednesday, MW max. 2007 828calculated to represent 100% of the national values 2008 850
1998 n.a.Highest load on the 3rd Wednesday, MW max. 2007 917calculated to represent 100% of the national values 2008 944
1998 n.a.Time of highest load on the 3rd Wednesday CET 2007 18:00
2008 17:00
Power produced in parallel operation on the 3rd Wednesday at 11:00 a.m. MW max. 1998 n.a.
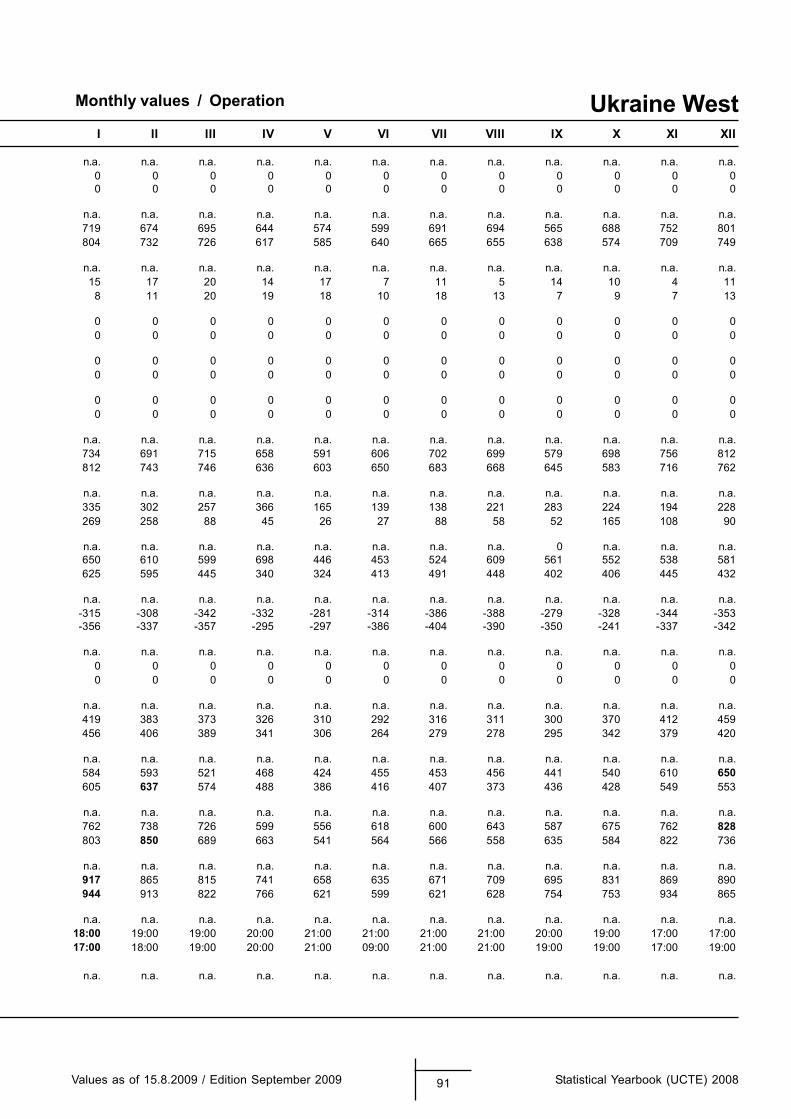
Monthly values / Operation
Values as of 15.8.2009 / Edition September 2009 91 Statistical Yearbook (UCTE) 2008
Ukraine WestI II III IV V VI VII VIII IX X XI XII
n.a. n.a. n.a. n.a. n.a. n.a. n.a. n.a. n.a. n.a. n.a. n.a.0 0 0 0 0 0 0 0 0 0 0 00 0 0 0 0 0 0 0 0 0 0 0
n.a. n.a. n.a. n.a. n.a. n.a. n.a. n.a. n.a. n.a. n.a. n.a.719 674 695 644 574 599 691 694 565 688 752 801804 732 726 617 585 640 665 655 638 574 709 749
n.a. n.a. n.a. n.a. n.a. n.a. n.a. n.a. n.a. n.a. n.a. n.a.15 17 20 14 17 7 11 5 14 10 4 11
8 11 20 19 18 10 18 13 7 9 7 13
0 0 0 0 0 0 0 0 0 0 0 00 0 0 0 0 0 0 0 0 0 0 0
0 0 0 0 0 0 0 0 0 0 0 00 0 0 0 0 0 0 0 0 0 0 0
0 0 0 0 0 0 0 0 0 0 0 00 0 0 0 0 0 0 0 0 0 0 0
n.a. n.a. n.a. n.a. n.a. n.a. n.a. n.a. n.a. n.a. n.a. n.a.734 691 715 658 591 606 702 699 579 698 756 812812 743 746 636 603 650 683 668 645 583 716 762
n.a. n.a. n.a. n.a. n.a. n.a. n.a. n.a. n.a. n.a. n.a. n.a.335 302 257 366 165 139 138 221 283 224 194 228269 258 88 45 26 27 88 58 52 165 108 90
n.a. n.a. n.a. n.a. n.a. n.a. n.a. n.a. 0 n.a. n.a. n.a.650 610 599 698 446 453 524 609 561 552 538 581625 595 445 340 324 413 491 448 402 406 445 432
n.a. n.a. n.a. n.a. n.a. n.a. n.a. n.a. n.a. n.a. n.a. n.a.-315 -308 -342 -332 -281 -314 -386 -388 -279 -328 -344 -353-356 -337 -357 -295 -297 -386 -404 -390 -350 -241 -337 -342
n.a. n.a. n.a. n.a. n.a. n.a. n.a. n.a. n.a. n.a. n.a. n.a.0 0 0 0 0 0 0 0 0 0 0 00 0 0 0 0 0 0 0 0 0 0 0
n.a. n.a. n.a. n.a. n.a. n.a. n.a. n.a. n.a. n.a. n.a. n.a.419 383 373 326 310 292 316 311 300 370 412 459456 406 389 341 306 264 279 278 295 342 379 420
n.a. n.a. n.a. n.a. n.a. n.a. n.a. n.a. n.a. n.a. n.a. n.a.584 593 521 468 424 455 453 456 441 540 610 650605 637 574 488 386 416 407 373 436 428 549 553
n.a. n.a. n.a. n.a. n.a. n.a. n.a. n.a. n.a. n.a. n.a. n.a.762 738 726 599 556 618 600 643 587 675 762 828803 850 689 663 541 564 566 558 635 584 822 736
n.a. n.a. n.a. n.a. n.a. n.a. n.a. n.a. n.a. n.a. n.a. n.a.917 865 815 741 658 635 671 709 695 831 869 890944 913 822 766 621 599 621 628 754 753 934 865
n.a. n.a. n.a. n.a. n.a. n.a. n.a. n.a. n.a. n.a. n.a. n.a.18:00 19:00 19:00 20:00 21:00 21:00 21:00 21:00 20:00 19:00 17:00 17:0017:00 18:00 19:00 20:00 21:00 09:00 21:00 21:00 19:00 19:00 17:00 19:00
n.a. n.a. n.a. n.a. n.a. n.a. n.a. n.a. n.a. n.a. n.a. n.a.
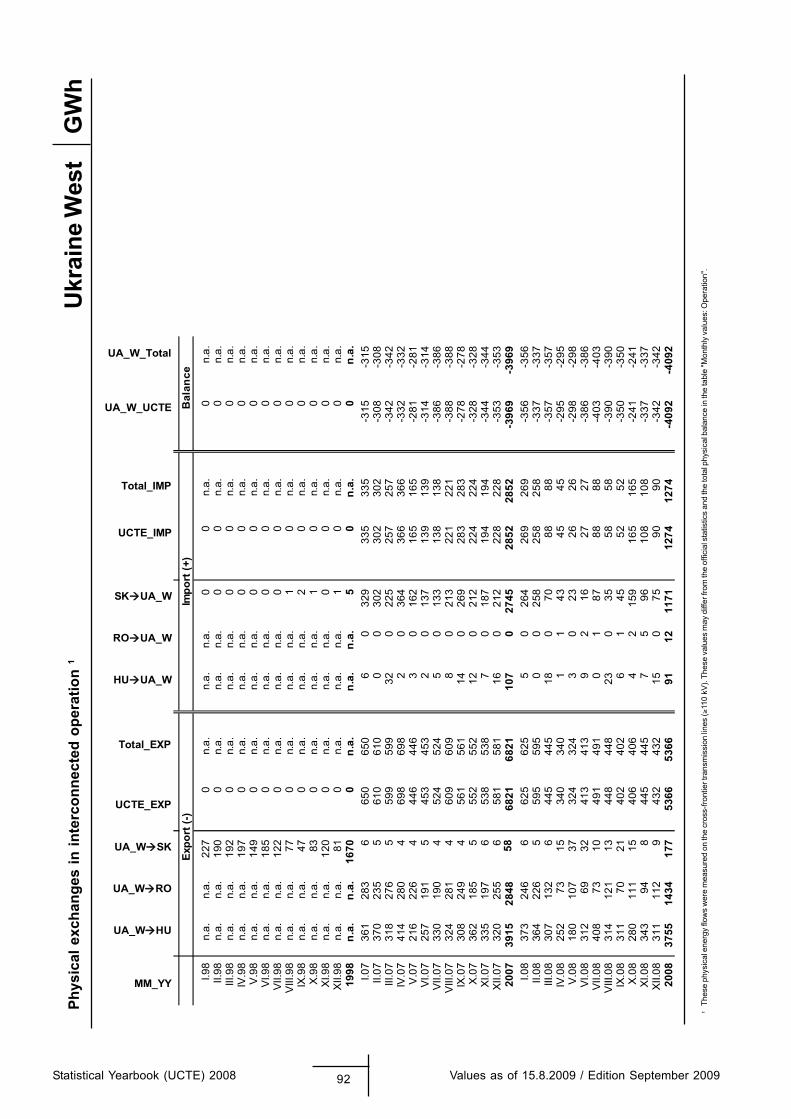
1Th
ese
phys
ical
ene
rgy
flow
s w
ere
mea
sure
d on
the
cros
s-fro
ntie
r tra
nsm
issi
on lin
es (≥
110
kV).
Thes
e va
lues
may
diff
er fr
om th
e of
ficia
l sta
tistic
s an
d th
e to
tal p
hysi
cal b
alan
ce in
the
tabl
e "M
onth
ly v
alue
s: O
pera
tion"
.
Statistical Yearbook (UCTE) 2008 92 Values as of 15.8.2009 / Edition September 2009
GW
hPh
ysic
al e
xcha
nges
in in
terc
onne
cted
ope
ratio
n 1
Ukr
aine
Wes
t
MM_YY
UA_W HU
UA_W RO
UA_W SK
UCTE_EXP
Total_EXP
HU UA_W
RO UA_W
SK UA_W
UCTE_IMP
Total_IMP
UA_W_UCTE
UA_W_Total
Expo
rt (-
)Im
port
(+)
Bal
ance
I.98
n.a.
n.a.
227
0n.
a.n.
a.n.
a.0
0n.
a.0
n.a.
II.98
n.a.
n.a.
190
0n.
a.n.
a.n.
a.0
0n.
a.0
n.a.
III.9
8n.
a.n.
a.19
20
n.a.
n.a.
n.a.
00
n.a.
0n.
a.IV
.98
n.a.
n.a.
197
0n.
a.n.
a.n.
a.0
0n.
a.0
n.a.
V.9
8n.
a.n.
a.14
90
n.a.
n.a.
n.a.
00
n.a.
0n.
a.V
I.98
n.a.
n.a.
185
0n.
a.n.
a.n.
a.0
0n.
a.0
n.a.
VII.9
8n.
a.n.
a.12
20
n.a.
n.a.
n.a.
00
n.a.
0n.
a.V
III.9
8n.
a.n.
a.77
0n.
a.n.
a.n.
a.1
0n.
a.0
n.a.
IX.9
8n.
a.n.
a.47
0n.
a.n.
a.n.
a.2
0n.
a.0
n.a.
X.9
8n.
a.n.
a.83
0n.
a.n.
a.n.
a.1
0n.
a.0
n.a.
XI.9
8n.
a.n.
a.12
00
n.a.
n.a.
n.a.
00
n.a.
0n.
a.X
II.98
n.a.
n.a.
810
n.a.
n.a.
n.a.
10
n.a.
0n.
a.19
98n.
a.n.
a.16
700
n.a.
n.a.
n.a.
50
n.a.
0n.
a.I.0
736
128
36
650
650
60
329
335
335
-315
-315
II.07
370
235
561
061
00
030
230
230
2-3
08-3
08III
.07
318
276
559
959
932
022
525
725
7-3
42-3
42IV
.07
414
280
469
869
82
036
436
636
6-3
32-3
32V
.07
216
226
444
644
63
016
216
516
5-2
81-2
81VI
.07
257
191
545
345
32
013
713
913
9-3
14-3
14VI
I.07
330
190
452
452
45
013
313
813
8-3
86-3
86V
III.0
732
428
14
609
609
80
213
221
221
-388
-388
IX.0
730
824
94
561
561
140
269
283
283
-278
-278
X.0
736
218
55
552
552
120
212
224
224
-328
-328
XI.0
733
519
76
538
538
70
187
194
194
-344
-344
XII.0
732
025
56
581
581
160
212
228
228
-353
-353
2007
3915
2848
5868
2168
2110
70
2745
2852
2852
-396
9-3
969
I.08
373
246
662
562
55
026
426
926
9-3
56-3
56II.
0836
422
65
595
595
00
258
258
258
-337
-337
III.0
830
713
26
445
445
180
7088
88-3
57-3
57IV
.08
252
7315
340
340
11
4345
45-2
95-2
95V
.08
180
107
3732
432
43
023
2626
-298
-298
VI.0
831
269
3241
341
39
216
2727
-386
-386
VII.0
840
873
1049
149
10
187
8888
-403
-403
VIII
.08
314
121
1344
844
823
035
5858
-390
-390
IX.0
831
170
2140
240
26
145
5252
-350
-350
X.0
828
011
115
406
406
42
159
165
165
-241
-241
XI.0
834
394
844
544
57
596
108
108
-337
-337
XII.0
831
111
29
432
432
150
7590
90-3
42-3
4220
0837
5514
3417
753
6653
6691
1211
7112
7412
74-4
092
-409
2