Embed Size (px)
Citation preview
1
Midwest Research InstituteSolutions through science
and technology
Remote Spectral Analysis of Erodible Lands in Clark County,
NevadaFunding Organization
Clark County, Nevada
Rodney Langston
Performing Organization EQM/MRI
Chatten Cowherd, Ph.D. MRI
Marcus Borengasser, Ph.D. MRI

2
Background
• Windblown dust in the Las Vegas Valley contributes to exceedances of PM air quality standards
• Increasing land disturbance associated with population growth is intensifying the problem
• A precise tool is needed to track land disturbances and assure that stabilization measures are applied
3
Purpose
• Use Satellite Imagery to Inventory Erodible Land Areas in Las Vegas Valley– Native desert (natural state)
– Disturbed vacant land (loss of surface protection)
– Stabilized vacant land (restoration of surface protection)
– Private unpaved roads (dirt or gravel)
4
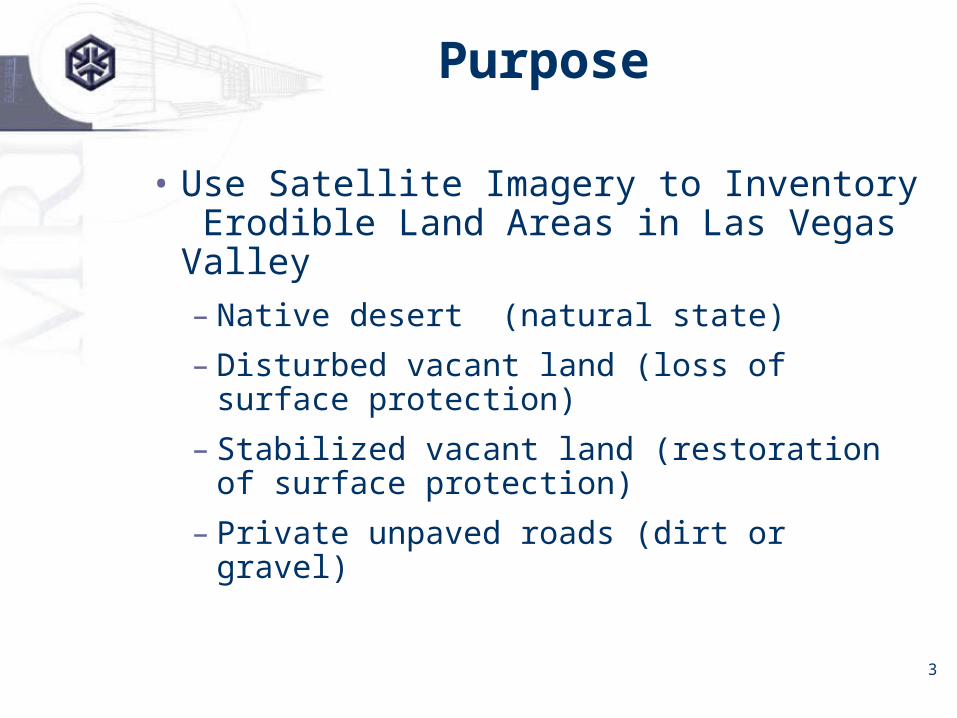
Vacant Land in Las Vegas Valley
5
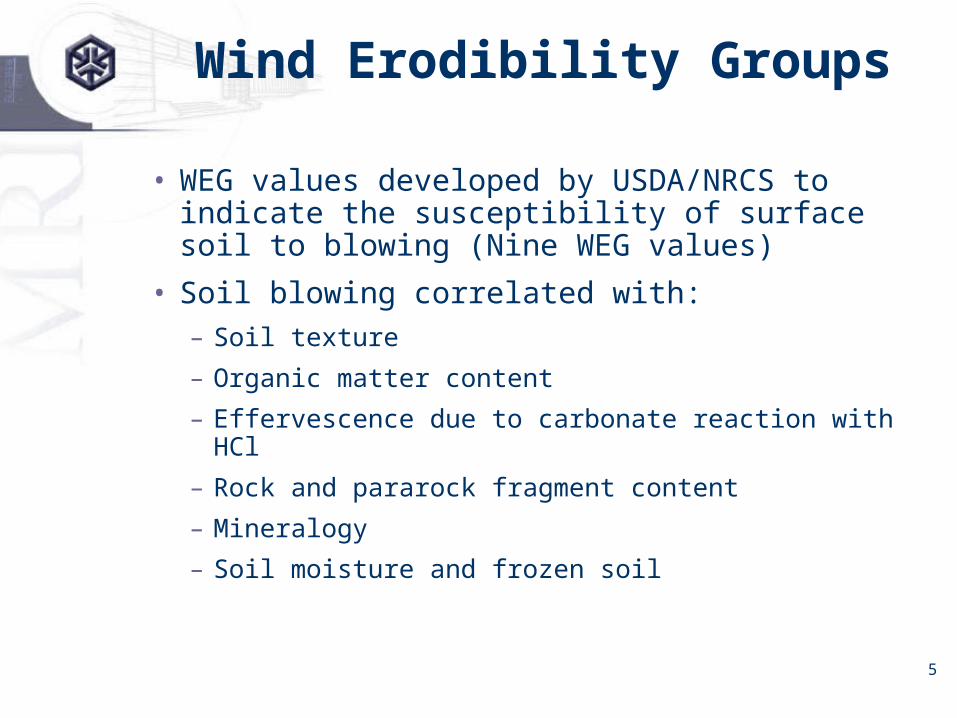
Wind Erodibility Groups
• WEG values developed by USDA/NRCS to indicate the susceptibility of surface soil to blowing (Nine WEG values)
• Soil blowing correlated with:– Soil texture
– Organic matter content
– Effervescence due to carbonate reaction with HCl
– Rock and pararock fragment content
– Mineralogy
– Soil moisture and frozen soil
6
Potentially Relevant Information
• Antelope Valley Blowsand Areas (Almaraz & Nguyen, as reported by Farber et al., 2003)
• Owens Lake Vegetation (http://www.hydrobio.org, 2003)
• Mojave Desert Wind Erosion (USGS, RVDE)
• SSURGO Wind Erodibility Groups
7
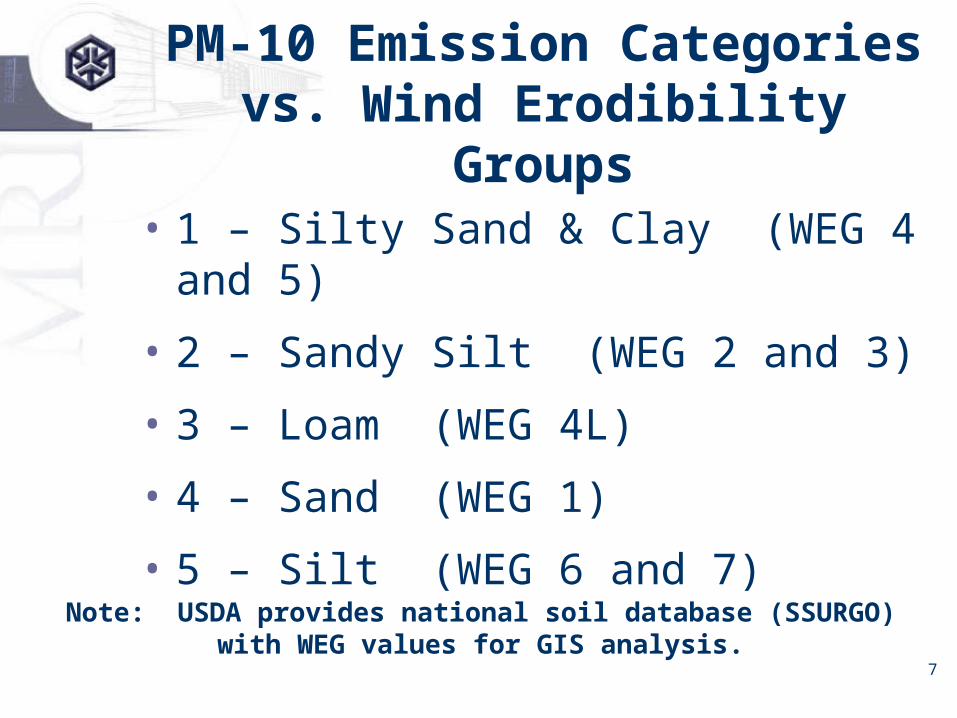
PM-10 Emission Categories vs. Wind Erodibility Groups
• 1 – Silty Sand & Clay (WEG 4 and 5)
• 2 – Sandy Silt (WEG 2 and 3)
• 3 – Loam (WEG 4L)
• 4 – Sand (WEG 1)
• 5 – Silt (WEG 6 and 7)Note: USDA provides national soil database (SSURGO)
with WEG values for GIS analysis.
8
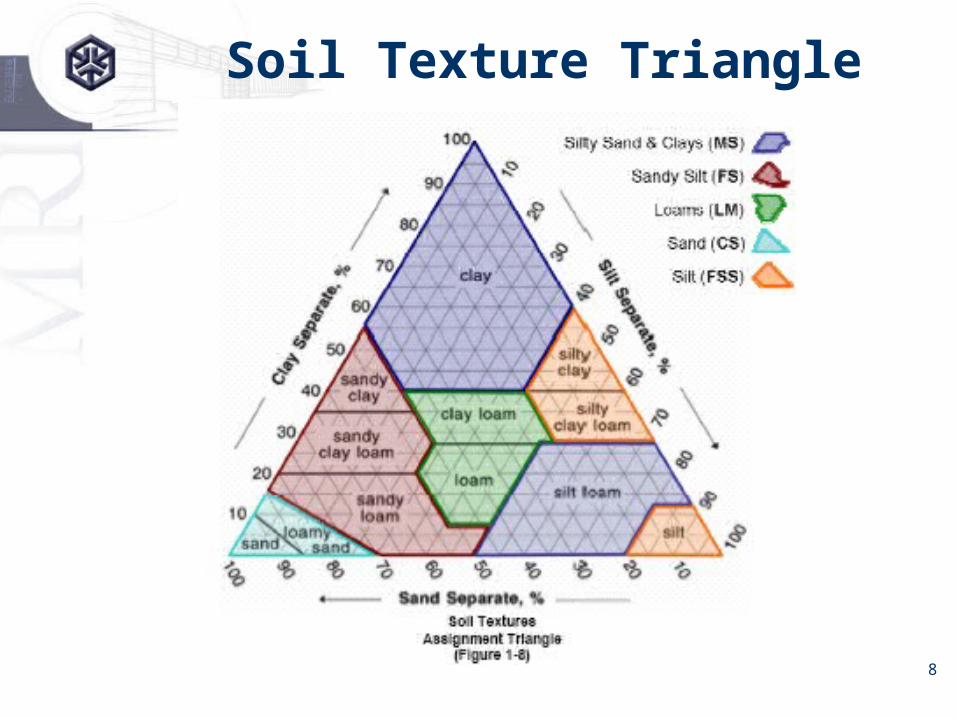
Soil Texture Triangle
9
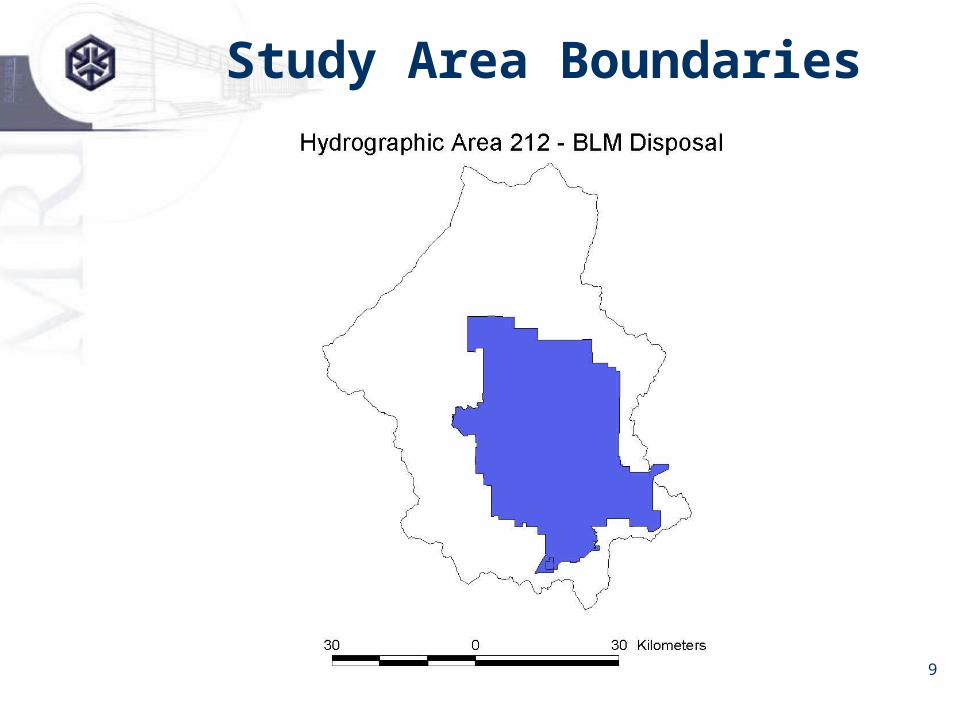
Study Area Boundaries
10
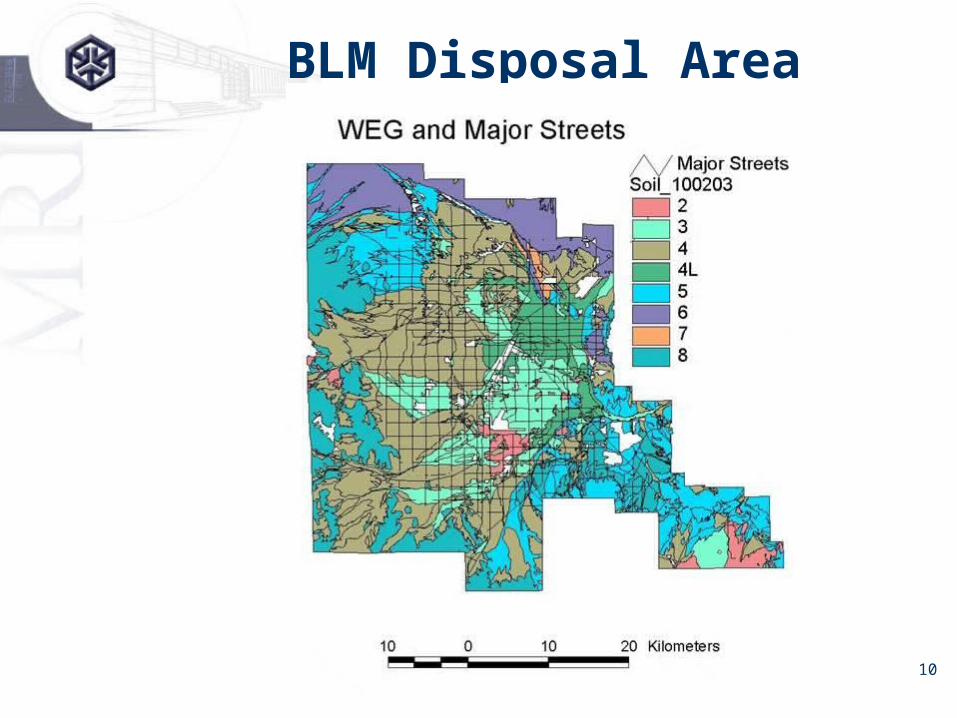
BLM Disposal Area
11
Project Phases
• Pilot Study (two 64 km2 areas)– Utilize limited study area to develop and test
predictive algorithms
– Training sites: development of characteristics of land categories
– Verification sites: assessing accuracy of supervised classification
• Main Study (Rest of BLM zone)– Completion of spectral analysis for full study area
– Check sites: testing of predicted land categories
12
Pilot Study Sites
• 30 Locations for Training and Verification
• Distributed within BLM Disposal Area
• Distributed among Land Categories (weighted by WEG)
• Ground Truthing within 48 hours of Imagery Acquisition
13
Pilot Study Sites
• Native desert, – moderate to heavy vegetation
– little or no vegetation
• Disturbed land – not stabilized
– non-vegetated but crusted (stabilized)
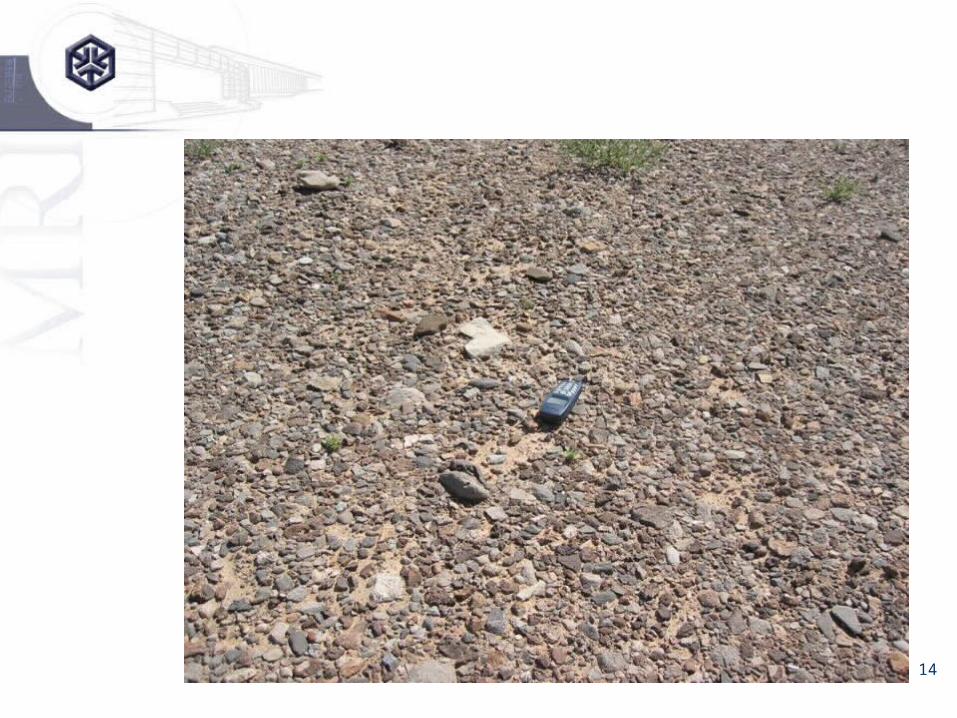
• Unvegetated rocky surface
• Sand dunes
• Private unpaved roads (dirt and gravel)
14
15
Selection of Pilot Study Sites
• Southern Nevada GIS Metadata– Las Vegas Valley Nonattainment Area (CP 3.16)
– BLM disposal area (CP 3.17)
– Public-owned land (CP 3.18)
– Existing land use (CP 3.8)
– Unpaved roads (CP 3.19)
• SSURGO Database with WEG values
• USGS Topographical Data
• Windshield Observations
16
Ground Truthing of Pilot Study Sites
• GPS Coordinates of NW corner locations
• Inspection of vegetation types and coverage
• Characterization of loose surface material
• Drop ball test for surface crust strength
• Rock cover test for non-erodible elements
• Sieving test for threshold friction velocity
17
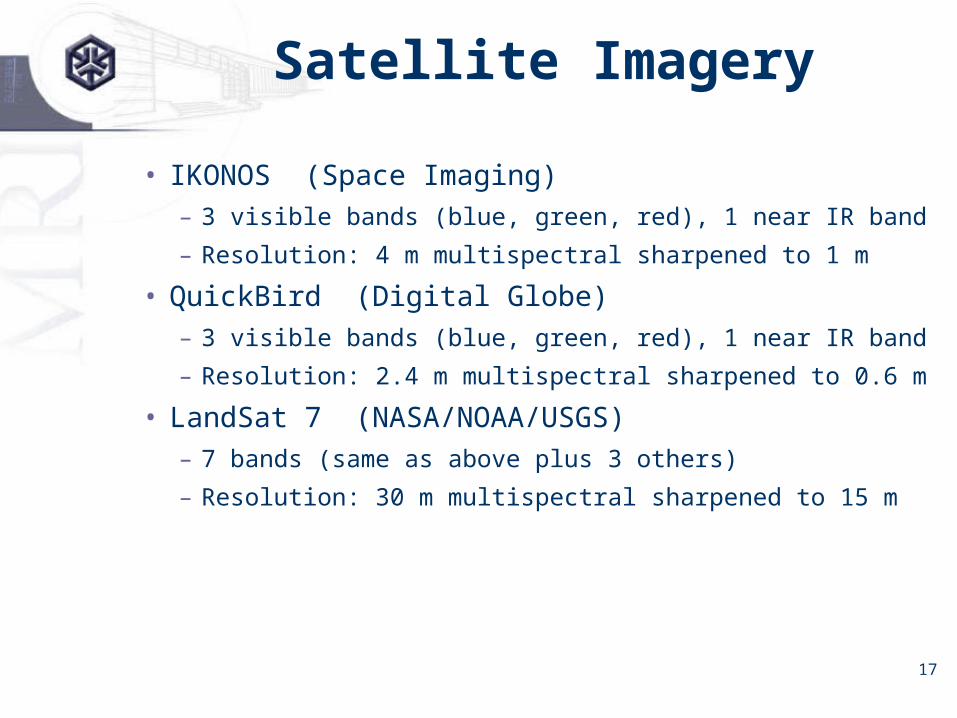
Satellite Imagery
• IKONOS (Space Imaging)– 3 visible bands (blue, green, red), 1 near IR band
– Resolution: 4 m multispectral sharpened to 1 m
• QuickBird (Digital Globe)– 3 visible bands (blue, green, red), 1 near IR band
– Resolution: 2.4 m multispectral sharpened to 0.6 m
• LandSat 7 (NASA/NOAA/USGS)– 7 bands (same as above plus 3 others)
– Resolution: 30 m multispectral sharpened to 15 m
18
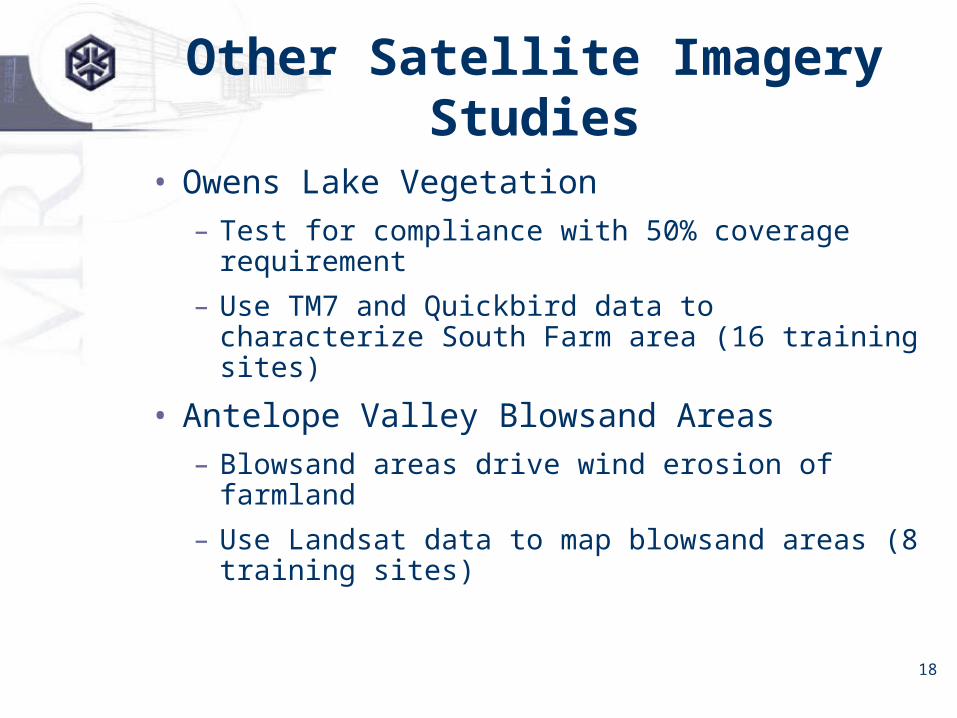
Other Satellite Imagery Studies
• Owens Lake Vegetation– Test for compliance with 50% coverage
requirement
– Use TM7 and Quickbird data to characterize South Farm area (16 training sites)
• Antelope Valley Blowsand Areas– Blowsand areas drive wind erosion of
farmland
– Use Landsat data to map blowsand areas (8 training sites)
19
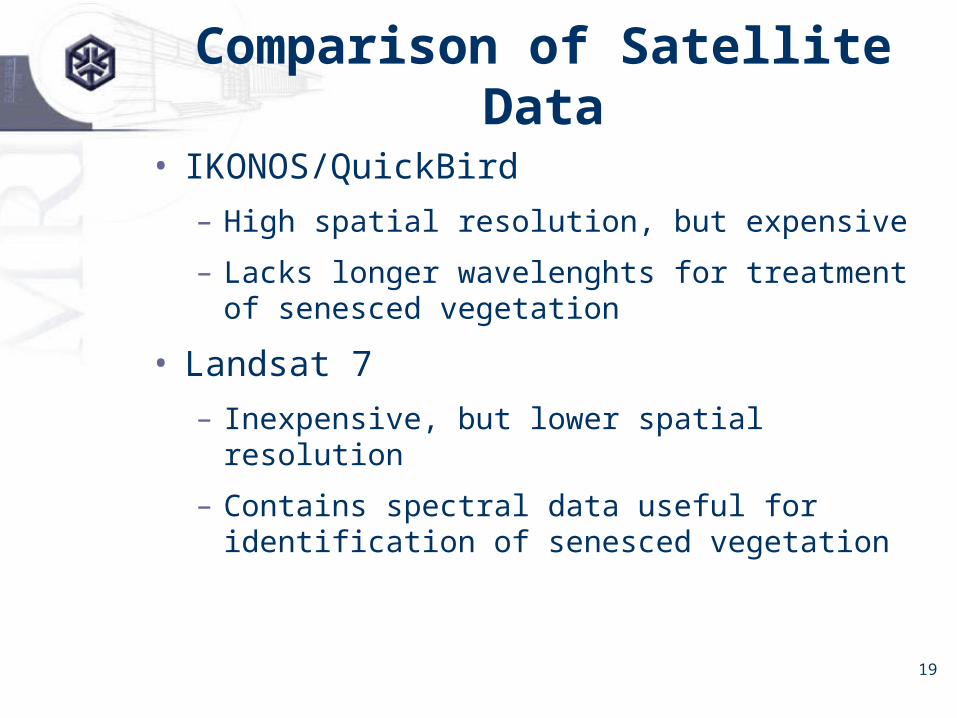
Comparison of Satellite Data
• IKONOS/QuickBird
– High spatial resolution, but expensive
– Lacks longer wavelenghts for treatment of senesced vegetation
• Landsat 7
– Inexpensive, but lower spatial resolution
– Contains spectral data useful for identification of senesced vegetation
20
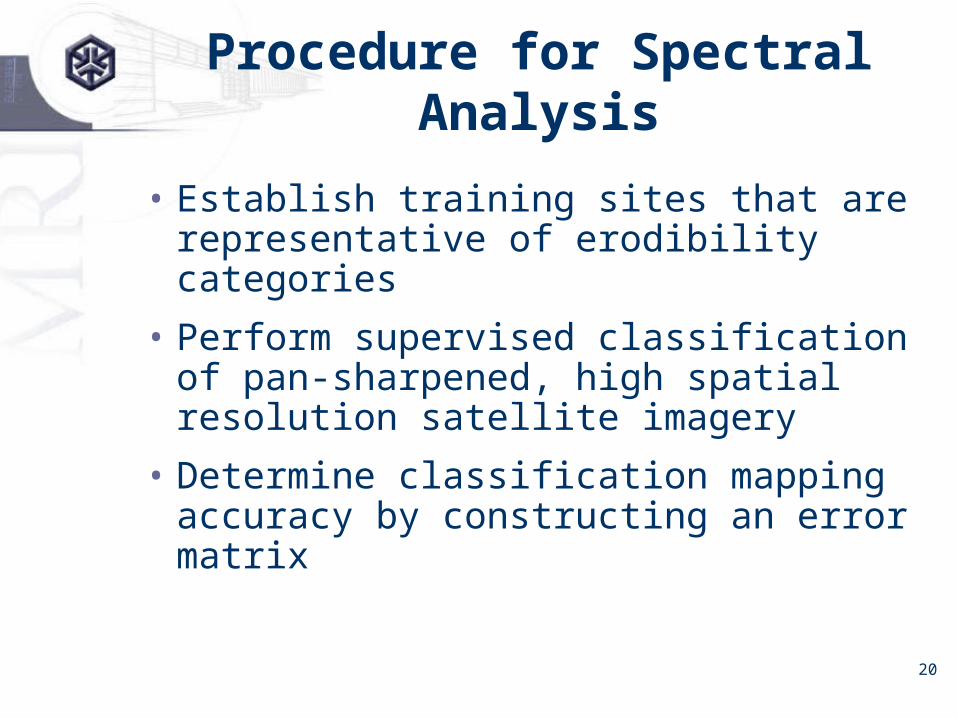
Procedure for Spectral Analysis
• Establish training sites that are representative of erodibility categories
• Perform supervised classification of pan-sharpened, high spatial resolution satellite imagery
• Determine classification mapping accuracy by constructing an error matrix
21
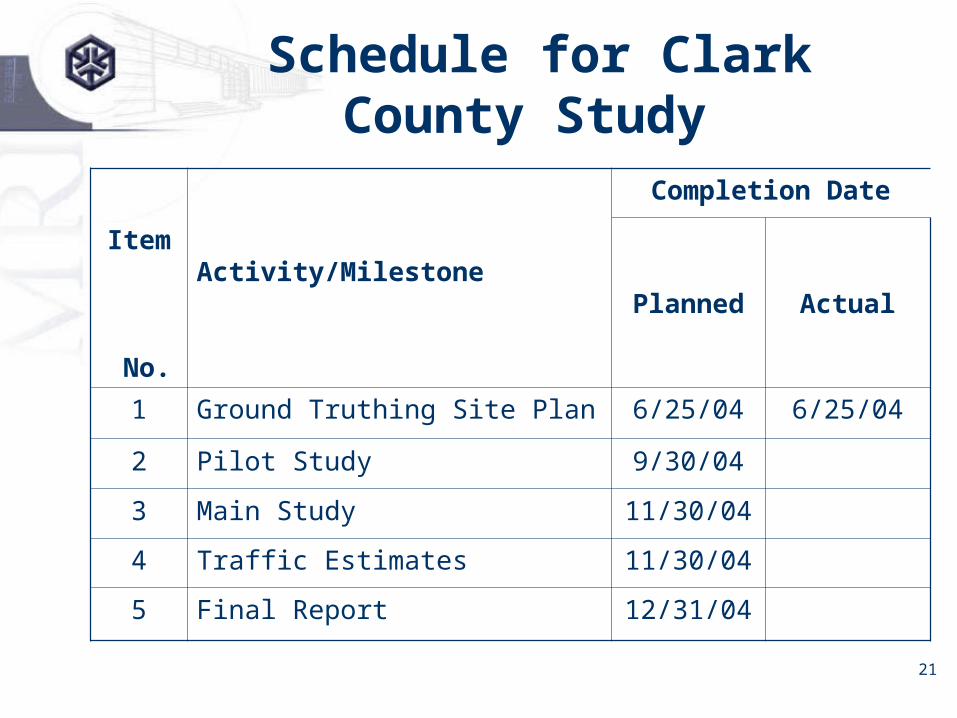
Schedule for Clark County Study
Completion Date
Item No.
Activity/Milestone Planned
Actual
1 Ground Truthing Site Plan 6/25/04 6/25/04
2 Pilot Study 9/30/04
3 Main Study 11/30/04
4 Traffic Estimates 11/30/04
5 Final Report 12/31/04
22
23
Summary
• Use satellite imagery to inventory erodible lands in the Las Vegas Valley
• Begin with pilot study to develop and verify predictive algorithms
• Balance imagery resolution against emission intensity variation to maximize cost-effectiveness