Embed Size (px)
Citation preview
1
Methods of Experimental Particle Physics
Alexei Safonov
Lecture #23
2
Today Lecture• We will consider examples of using the
ML technique • Building the likelihood function• Hypothesis testing• Comparison of two hypotheses• Comparison of two hypotheses when there
are unknown parameters• Other methods: MLS
3
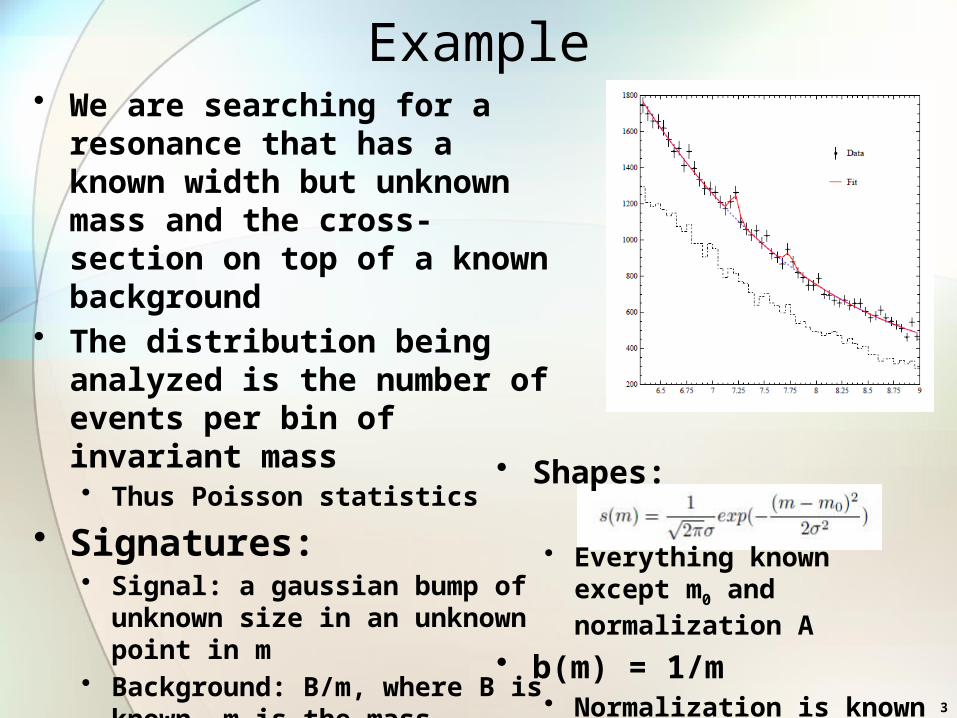
Example• We are searching for a
resonance that has a known width but unknown mass and the cross-section on top of a known background
• The distribution being analyzed is the number of events per bin of invariant mass• Thus Poisson statistics
• Signatures:• Signal: a gaussian bump of
unknown size in an unknown point in m
• Background: B/m, where B is known, m is the mass
• Shapes:
• Everything known except m0 and normalization A
• b(m) = 1/m• Normalization is known (=B)

4
Single Hypothesis• Single Hypothesis:
• • Where • If S+B: defined for specific S and m0
• If B only: • Testing: make pseudo-data following background only model or (s+b)
model and determine how often you get likelihoods smaller than the one observed in data
• Can test any specific hypothesis with fixed parameters, but can’t distinguish between the “signal with unknown parameters” and “background only”
• Note that in this definition when you test for background only hypothesis, you are asking a question of “how likely I am to observe a distribution as discrepant as the one I see in data”• It automatically accounts for bumps showing up at any mass

5
Two Hypotheses• Hypothesis comparison:
• Define a different test statistic:
• Well defined for any fixed S and m0 and well suitable for comparisons of two specific hypotheses but not yet for any
• In this case you ask a question of “assuming that it’s one (signal w/ fixed parameters) or the other (background only), what is the probability that what you see is a background fluctuation versus you seeing a signal with these parameters?”

6
Generalized Hypotheses• Hypothesis comparison:• If the question you ask is how likely that this is
signal of some mass and strength versus background, need to do more:• Define a different test statistic:
• You are now watching for “worst possible” signal-like fluctuation anywhere in S and m0 space
• If max is hard to imagine, think of lambda as a function of S and m0, if it’s an analytical function, you can always find max or minimum
• Can run now pseudo-experiments using background only hypothesis and see how often you get lambda even less than for the distribution in data
• Tricks of taking maximum usually referred as “profiling” as in “profile likelihood”

7
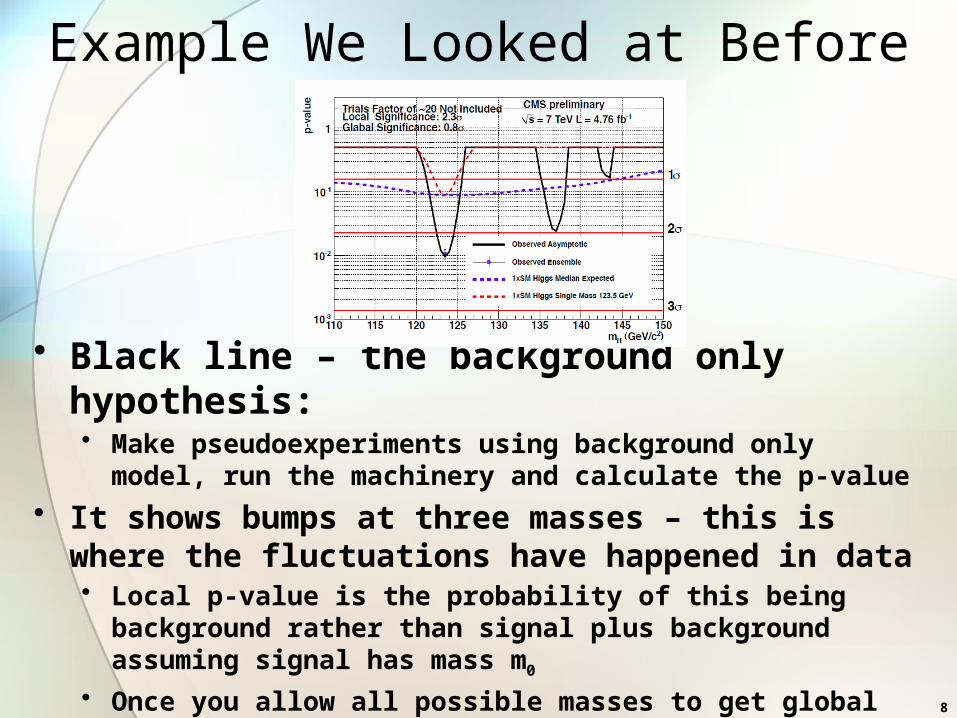
Example We Looked at Before• The p-value calculated here is
almost what we just defined• One exception: the statistic was not
max’ed over all possible m0, but separately calculated for each m0
• This is “local p-value” versus “global” in our definition
• Still scan over all possible signal strengths
• You get p-value versus mass - nice, but the drawback is the look elsewhere effect• If we were to maximize over m0 as well,
we would get a single number• For a given data distribution, the
“global” p-value we get will be higher
8
Example We Looked at Before
• Black line – the background only hypothesis:• Make pseudoexperiments using background only model, run
the machinery and calculate the p-value
• It shows bumps at three masses – this is where the fluctuations have happened in data• Local p-value is the probability of this being background rather
than signal plus background assuming signal has mass m0
• Once you allow all possible masses to get global p-value, it degrades from 2.3 to 0.8 sigma
• Ballpark p is increased by ~ ratio of the x-range divided by signal width in x

9
Example We Looked at Before
• Blue line – signal+background hypothesis:• Make pseudoexperiments using signal+background model,
where signal strength is what SM says it should be• But estimate the p-value by doing pseudoexperiments with no signal
• Scan over all possible masses run the machinery and calculate the median value of the p-value at the “correct” mass
• Red line:• Pick a single value of mass, generate pseudoexperiments
following this hypothesis, calculate p-value versus mass• Essentially what you would expect on average if the signal was
there

10
Other Ways for Hypothesis Testing• The ML technique is powerful, but the
machinery involved is complex and slow• In simple cases you may not need it, e.g. if you are
comparing data and a fit, there are simpler ways to establish if the two are consistent with each other or not
• The Method of Least Squares (chi-square):
• Estimators for parameters are values that maximize the measured value of c2• As you see, it is related to ML method• In Poisson case:
• Compare the number of observed events to the expected rate, variance in Poisson case is the mean rate

11
Distribution for c2
• P-value versus c2
• N – the number of degrees of freedom• The number of bins for testing a fixed hypothesis
• Smaller c2 – larger p-value

12
Distribution for c2
• Rule of thumb: the reduced c2 (divided by the number of degrees of freedom) should be about 1 (that’s where the p-value is about 50%)
• Too large c2 indicates small p-value and the small probability that the data and hypothesis are compatible
• Too small value usually indicates that you made a mistake somewhere

13
Next Time• We will focus on interpreting the
likelihood functions to extract parameters • Parameter estimation and conventions for
reporting measurements• Limit setting procedures• Some related topics: binned likelihood
versus un-binned likelihood• Combining datasets
• Importance of likelihood functions