Embed Size (px)
Citation preview

1
Merrill Lynch Global Pharmaceutical, Biotechnology and Medical Device Conference 2008
Dr. John ClimaxExecutive Chairman

2
Certain statements contained herein including, without limitation, statements containing the words “believes,” “anticipates,” “intends,” “expects” and words of similar import, constitute forward-looking statements concerning the Company's operations, performance, financial condition and prospects. Because such statements involve known and unknown risks and uncertainties, actual results may differ materially from those expressed or implied by such forward-looking statements. Given these uncertainties, prospective investors are cautioned not to place undue reliance on such forward-looking statements. The Company undertakes no obligation to publicly update or revise any forward-looking statements, whether as a result of new information, future events or otherwise.
Forward Looking Statements

3
2006
• Revenues $456 million
• EPS $1.33
• Staff 4,300
1990
• Revenues $0.5 million
• Staff 5
The Journey So Far
2007 Guidance
• Revenues $615 - $625m
• EPS $1. 82 - $1.85
• Staff 5,500
2008 Guidance
• Revenues $750 - $770m
• EPS $2.27 - $2.36
• Staff 6,250

4
Global Full Service Clinical Development
US 53%
EU 41%
ROW 6%
Revenue by Region
5
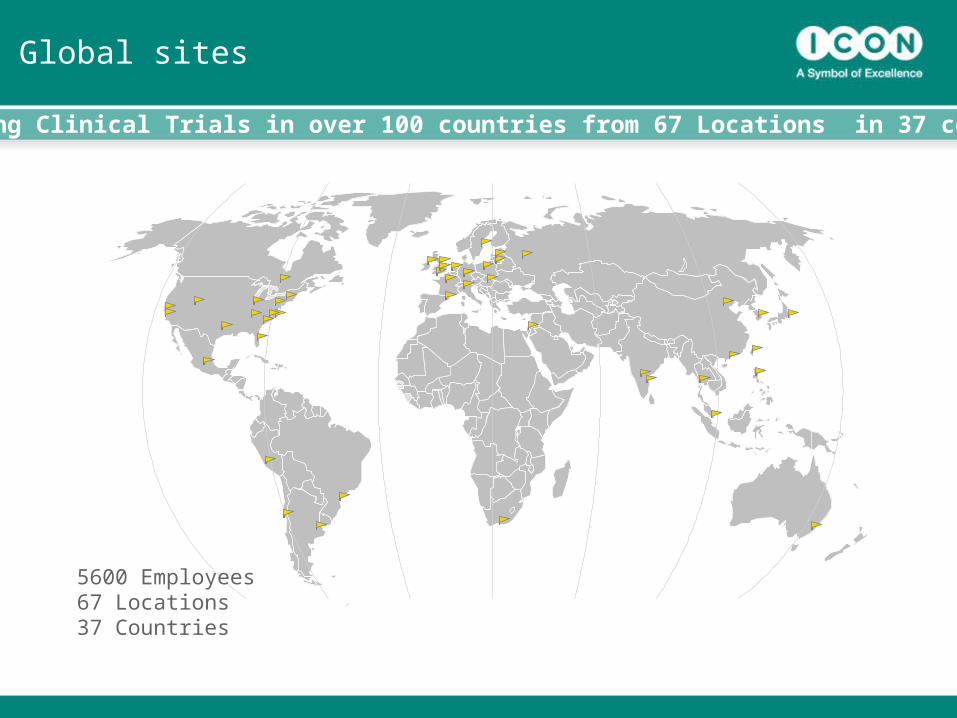
Global sites
5600 Employees67 Locations37 Countries
Conducting Clinical Trials in over 100 countries from 67 Locations in 37 countries

6
Market Environment

7
Strong Market Environment with...
• Fundamental R&D Spending Growth Trend 6%- 8% p.a.¯ Phase II / III pipelines strengthening
• Increased Outsourcing ¯ Being accelerated by activity & funding in Biotech / Speciality
¯ Globalisation of clinical research
¯ Cost containment pressures
¯ Evidence that projects, where CROs are engaged, complete faster than “internal only” studies*
¯ Growth c.15% p.a. since 2001*
• Increasing Regulation ¯ More patients/ more studies
¯ Post marketing surveillance
*Source: Tufts Centre for Study of Drug Development

8
$18.1
$22.4
$29.2
$33.1
$38.6
$0.0
$5.0
$10.0
$15.0
$20.0
$25.0
$30.0
$35.0
$40.0
$45.0
2003 2004 2005 2006 2007
$Bil
lio
n
Source: Burrill and Company
…US Biotech Funding Environment continuing to grow
Biotech fund raising ($billions)

9
956 9981,071
1,167 1,195
1,4811,599
1,720
1997 1998 1999 2000 2001 2002 2003 2004
Source: Informa Health
…significant growth in the number of companies with active clinical projects,….
Number of companies running clinical projects

10
…which is enriching pipelines.
0
200
400
600
800
1000
1200
Phase I Phase II Phase III Registration
Dec-02 Dec-03 Dec-04 Dec-05 Dec-06
Source: IMS R&D Focus, Dec 2006 and previous year SMRs
2002 – 2006 46% Growth Phase I – II

11
4,157
4,5444,827
5,023
5,445
3,8833,6113,600 3,661
2,000
3,000
4,000
5,000
6,000
1998 1999 2000 2001 2002 2003 2004 2005 2006
Source: FDA
Number of Active INDs
… and significant growth in the number of active INDs,…
49% Increase since 2000

12
ICON in this Market Environment

13
Strong Gross Business wins has led to…
$127
$165
$186 $189 $193$207
$245$264
$246
Q3 05 Q4 05 Q1 06 Q2 06 Q3 06 Q4 06 Q1 07 Q2 07 Q3 07
ICON Gross Business Wins - Last 9 Quarters ($ millions)

14
.. excellent Net New Business wins and very strong book to bill ratios…
$122
$140
$171$166
$157
$171
$223$230$230
Q3 05 Q4 05 Q1 06 Q2 06 Q3 06 Q4 06 Q1 07 Q2 07 Q3 07
1.4
1.6
1.3
1.6
1.41.3
1.6
1.7
1.6
Net Business Wins Book to Bill Ratio

15
…leading to record Total Backlog levels. ($ millions)
$568
$633
$707
$772$815
$872
$963
$1,049
$1,125
Q3 05 Q4 05 Q1 06 Q2 06 Q3 06 Q406 Q1 07 Q2 07 Q3 07

16
From this backlog, coverage of next 4 quarters revenues is robust……..
$279$296 $307
$360
$395$415
$470$493
$542
Q3 '05 Q4 '05 Q1 '06 Q2 '06 Q3 '06 Q4 '06 Q1 '07 Q2 07 Q3 '07
71%
76% 76% 76%76%
77%76%
77%
76%
Value of backlog forecast to be earned in next 4 quarters
% coverage of next 4 quarters forecast revenues

17
…..and the customer base continues to diversify.
42.6%
34.6%30.8%
62.7%
51.1%
45.0%
81.4%
72.0%
66.7%
8.1%9.6%12.3%
FY To May 2005 FY 2006 2007 YTD
Largest Client
Top 5
Top 10
Top 25
Client Concentration 2005, 2006, YTD 2007

18
YTD ‘07 Revenue Breakdown
Revenue by Customer Segment Revenue by Therapeutic Area
Estimate 2007 Revenue $620m*
* Mid Point of Calendar year Guidance issued October 2007
19
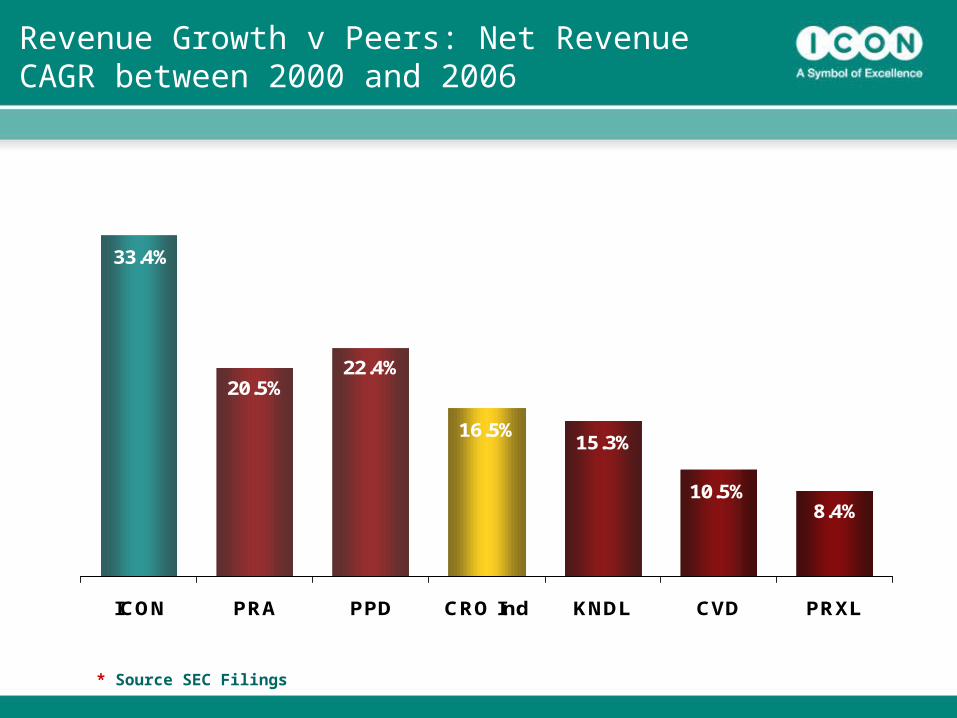
Revenue Growth v Peers: Net Revenue CAGR between 2000 and 2006
8.4%10.5%
15.3%16.5%
22.4%20.5%
33.4%
ICON PRA PPD CRO Ind KNDL CVD PRXL
* Source SEC Filings

20
Strategy

21
Core Strategy is Organic Growth, with acquisitions adding new services or scale.
Capitalise on market fundamentals to drive organic growth in all business units.
Expand geographic footprint to exploit globalisation.
Pursue acquisitions to enhance depth and scale of current operations and to add additional complementary services e.g.
Phase I
Bioanalytical / Biomarkers
Therapeutic specialists
Safety / Phase IV
Patient Recruitment
Staffing
Cross-sell services to grow sales and margin
22
Financial Performance

23
Recent Financial Performance ($ millions, except EPS; includes stock option expense)
Q3 ’07 Q3 ’06 % Increase
Net Revenue 167.0 120.7 38.3%
Direct Costs 91.7 68.4 34.1%
SG & A 51.5 35.8 43.9%
D & A 5 3.9 28%_____ _____ _____
Operating Income 18.7 12.6 48.3%
Net Income 14.5 10.1 43.7%_____ _____ _____
EPS (Inc SFAS123R) 49c 35c 40%
Weighted Average no. of Shares (Inc SFAS123R)
29.8m 29.1m 2.4%
Backlog 1125 815 38%
24
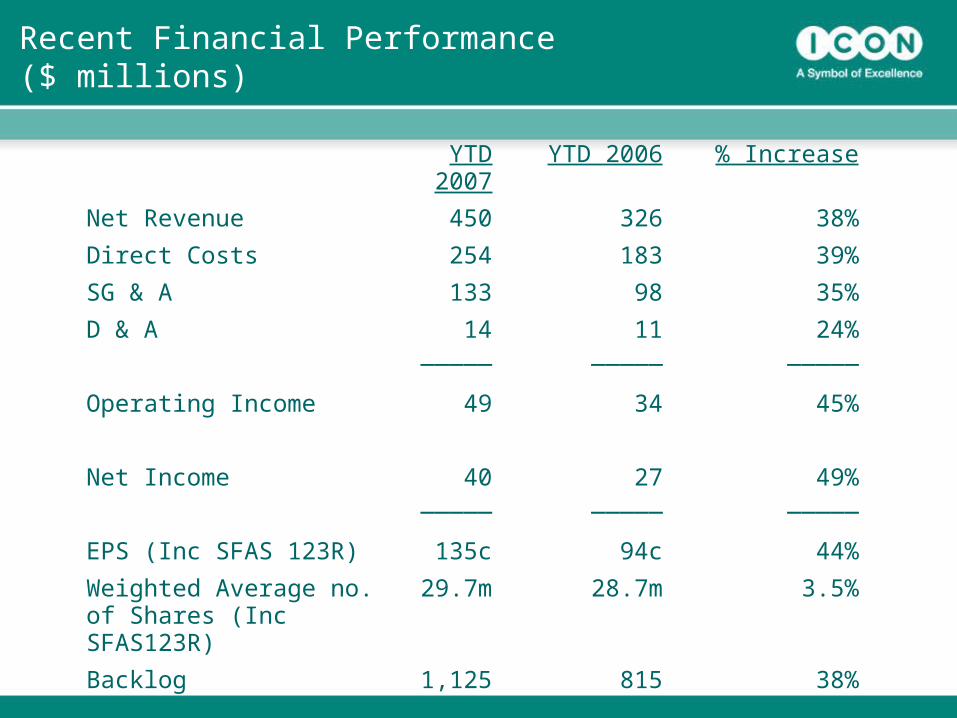
Recent Financial Performance ($ millions)
YTD 2007
YTD 2006 % Increase
Net Revenue 450 326 38%
Direct Costs 254 183 39%
SG & A 133 98 35%
D & A 14 11 24%_____ _____ _____
Operating Income 49 34 45%
Net Income 40 27 49%_____ _____ _____
EPS (Inc SFAS 123R) 135c 94c 44%
Weighted Average no. of Shares (Inc SFAS123R)
29.7m 28.7m 3.5%
Backlog 1,125 815 38%

25
Net Revenue CAGR in excess of 30% over 6 Years
$157
$226
$296$327
$456
$620(E)*
$0
$100
$200
$300
$400
$500
$600
$700
FY2002 FY2003 FY2004 FY2005 FY2006 FY2007
Mill
ions
CAGR 31.6%
* Mid Point of Calendar year Guidance issued October 2007
** Mid Point of Calendar year Guidance issued December, 2007
$760(E)**
FY2008(E)(E)

26
Earnings Per Share Growth
$0.58
$0.75
$0.94$0.85
$1.84(E)*
$1.35
$0.00
$0.20
$0.40
$0.60
$0.80
$1.00
$1.20
$1.40
$1.60
$1.80
$2.00
FY2002 FY2003 FY2004 FY2005 FY2006 FY2007
CAGR 25.9%
(E)
** Mid Point of Guidance issued December 2007* Mid Point of Guidance issued October 2007
$2.32(E)**
FY2008(E)

27
Summary Balance Sheet and Cash Flow ($ millions)
May 31, 05(Year)
Dec 31, 05(7 mths)
Dec 31, 06(Year)
Sept 30, 07 (YTD)
Net Cash $78.4 $82.3 $98 $27.7
Total assets $347.6 $349.1 $476.3 $631.8
Shareholder’s equity $233.1 $241.6 $302.7 $631.8
Cashflow from operations
$23.8 $11.7 $51.5 $0.6
Capital expenditures $15.6 $7.8 $12.3 $19.3
Shares outstanding 27.8 28.0 28.5 29.8

28
Improving Margins

29
Quarterly Operating margins have beenimproving and ….
10.8%
11.20%
10.7%10.4%
10.6%
10.2%
9.2%
8.7%
7.6%
10.9%
7.0%
8.0%
9.0%
10.0%
11.0%
12.0%
Q2 2005 Q32005*
Q42005*
Q12006*
Q2 2006 Q3 2006 Q4 2006 Q1 2007 Q2 2007 Q3 2007
* Includes an estimated SFAS 123 non cash stock compensation charge for the 2005 figures
Turnaround in Lab
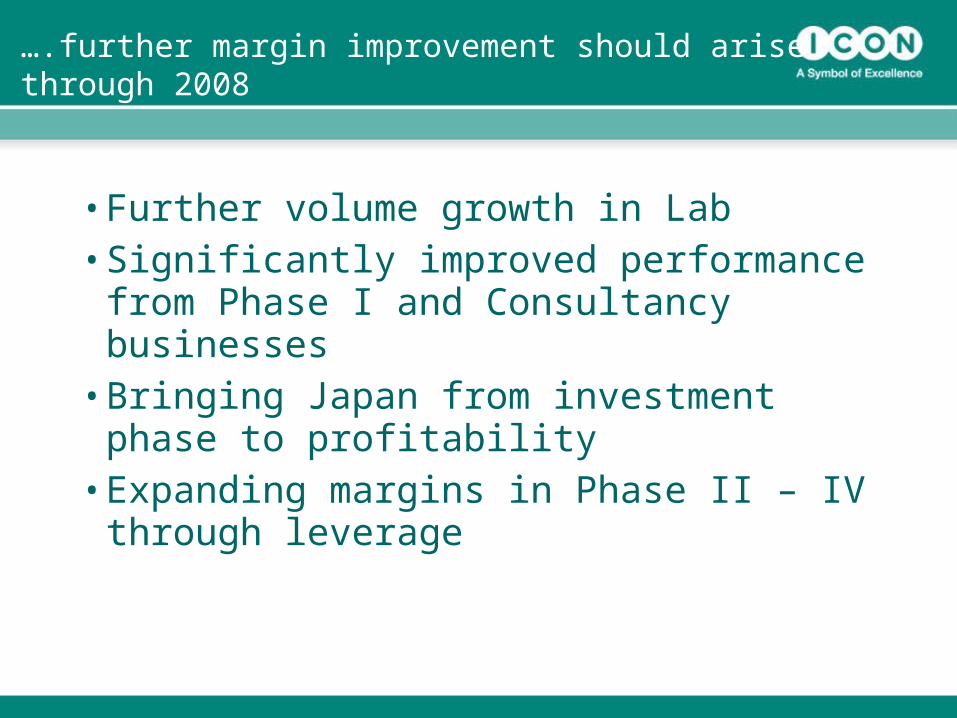
30
• Further volume growth in Lab • Significantly improved performance from Phase
I and Consultancy businesses • Bringing Japan from investment phase to
profitability • Expanding margins in Phase II – IV through
leverage
….further margin improvement should arisethrough 2008

31
• Top Global Clinical CRO - #4• Outstanding record of growth • Strong market fundamentals • Excellent strategic position• Strong balance sheet• Margin expansion opportunity
Investment Case Summary