Embed Size (px)
Citation preview

1
Measuring and Forecasting Production Metrics Using The Barringer Process
Reliability Methodology
Presented To:
SMRP Reliability Analytics SIG
SMRP 2012 Annual Conference
Orlando, Florida
Presented by: Michael Eisenbise

Annual Production Data – Plotted in “Rain Cloud Chart
Daily
Ou
tpu
t W
idg
ets
/Day
Day of Year

Annual Production Data – Plotted in “Rain Cloud Chart
Daily
Ou
tpu
t W
idg
ets
/Day
Day of Year
All production rates below a “target” production rate identified by most record keeping systems -Normally equipment failures or TAR related
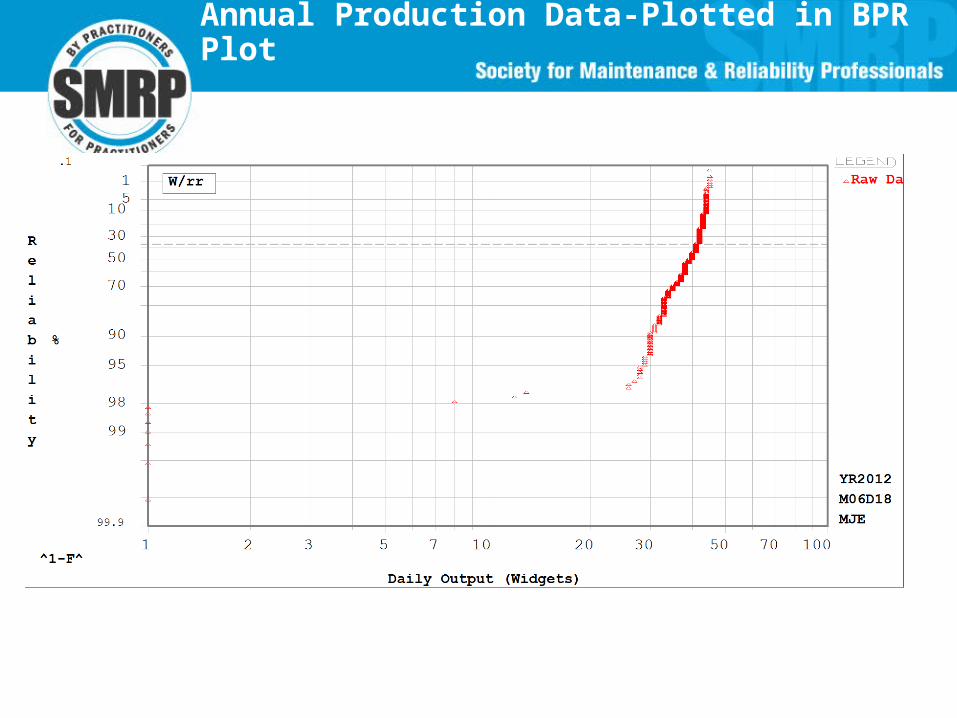
Annual Production Data-Plotted in BPR Plot

Annual Production Data – Plotted in “Rain Cloud Chart
Day of Year
“Bandwidth” of lower and upper daily production rate when unit was “under control”
Daily
Ou
tpu
t W
idg
ets
/Day

Bandwidth Shown on BPR
Bandwidth of our competitors, for this process, is 250

Annual Production Data – Plotted in “Rain Cloud Chart”
Day of Year
What is daily average production that can be counted on in the future?
Daily
Ou
tpu
t W
idg
ets
/Day
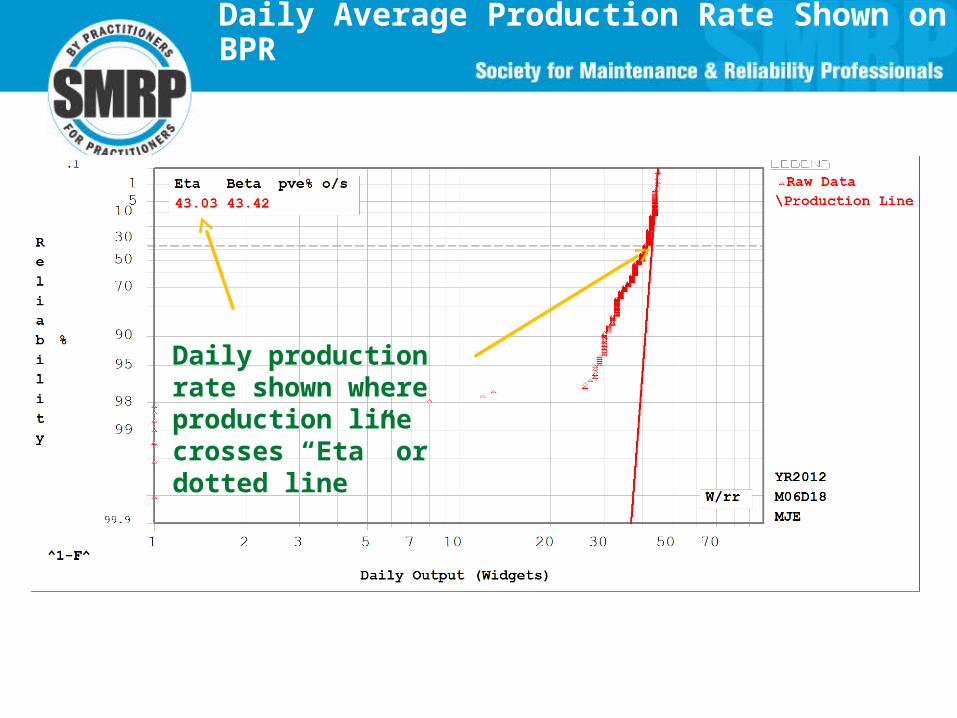
Daily Average Production Rate Shown on BPR
Daily production rate shown where production line crosses “Eta” or dotted line

Annual Production Data – Plotted in “Rain Cloud Chart”
Day of Year
What percentage of time was unit operated within this bandwidth?
Daily
Ou
tpu
t W
idg
ets
/Day

Bandwidth Shown on BPR
Point at which raw data is not located on production line is percent of time unit operated within bandwidth – Shown as reliability %. Our competitors at 80% on this process

What are our competitors doing, or what is nameplate?
Us
Our Competitors

What are our losses due to “crash and burn issues”?
Losses are area under “raw data” and “production line”. In this case 1,839 Widgets/Year

Losses due to the way we operate and manage this unit?
Losses are area under “production line” and “nameplate line”. In this case 720 Widgets/Year

Data points are mechanical failures or TAR related. In this examples losses are 41 units/year or amount normally captured in a your failure database. Most losses do not fall in this area of curve.
Very few total losses are due to mechanical failures

Production Analysis

© Barringer & Associates, Inc., 2000-2001
Slide 1-63

© Barringer & Associates, Inc., 2000-2001
Slide 1-64

18
Any Questions