Embed Size (px)
Citation preview
1
MEASUREMENT PROBLEMS MEASUREMENT PROBLEMS OF TFP PERFORMANCE IN AN OF TFP PERFORMANCE IN AN
UNSTABLE ECONOMY: UNSTABLE ECONOMY: ARGENTINA 1990-2004ARGENTINA 1990-2004
““A Case of the Tyranny of Methodology”A Case of the Tyranny of Methodology”
ARIEL COREMBERGARIEL COREMBERGECLAC Buenos AiresECLAC Buenos Aires
CONICET/IDESCONICET/[email protected]@[email protected]
The 2008 World Congress on National Accounts and Economic Performance Measures for Nations
May 12–17, 2008Key Bridge Marriott (Arlington, VA—minutes from Washington D.C.)
2
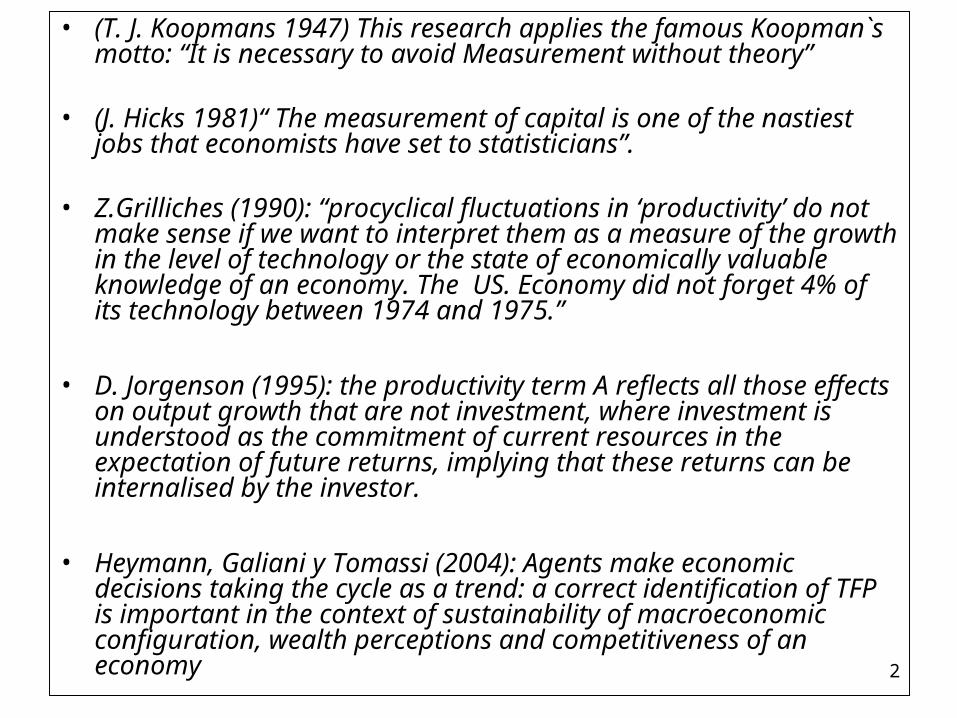
• (T. J. Koopmans 1947) This research applies the famous Koopman`s motto: “It is necessary to avoid Measurement without theory”
• (J. Hicks 1981)“ The measurement of capital is one of the nastiest jobs that economists have set to statisticians”.
• Z.Grilliches (1990): “procyclical fluctuations in ‘productivity’ do not make sense if we want to interpret them as a measure of the growth in the level of technology or the state of economically valuable knowledge of an economy. The US. Economy did not forget 4% of its technology between 1974 and 1975.”
• D. Jorgenson (1995): the productivity term A reflects all those effects on output growth that are not investment, where investment is understood as the commitment of current resources in the expectation of future returns, implying that these returns can be internalised by the investor.
• Heymann, Galiani y Tomassi (2004): Agents make economic decisions taking the cycle as a trend: a correct identification of TFP is important in the context of sustainability of macroeconomic configuration, wealth perceptions and competitiveness of an economy
3
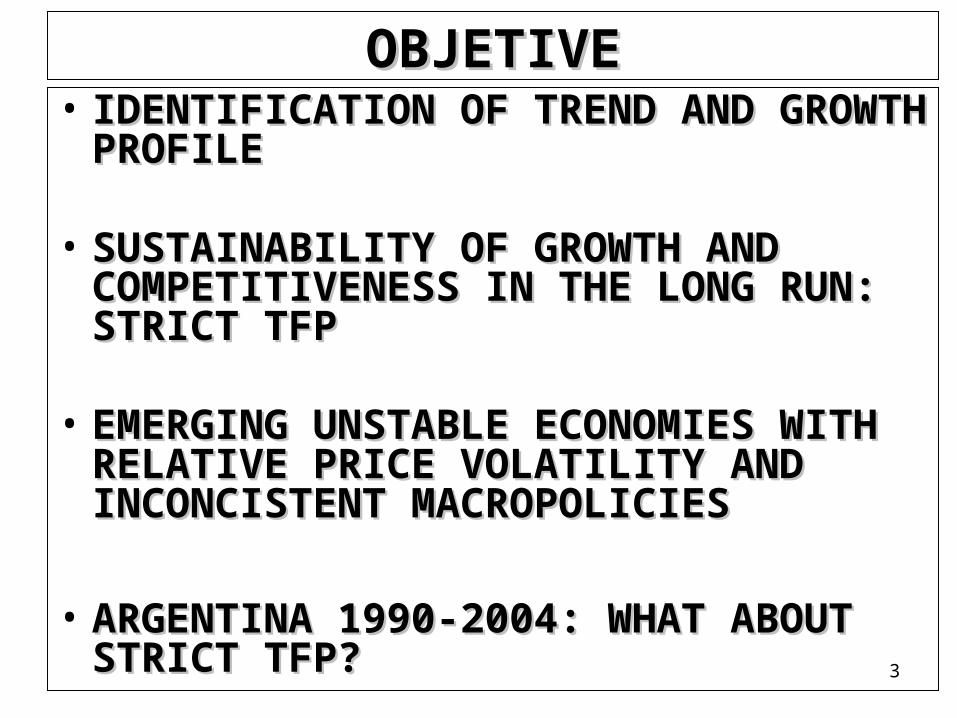
OBJETIVEOBJETIVE• IDENTIFICATION OF TREND AND IDENTIFICATION OF TREND AND
GROWTH PROFILEGROWTH PROFILE
• SUSTAINABILITY OF GROWTH AND SUSTAINABILITY OF GROWTH AND COMPETITIVENESS IN THE LONG RUN: COMPETITIVENESS IN THE LONG RUN: STRICT TFPSTRICT TFP
• EMERGING UNSTABLE ECONOMIES EMERGING UNSTABLE ECONOMIES WITH RELATIVE PRICE VOLATILITY WITH RELATIVE PRICE VOLATILITY AND INCONCISTENT MACROPOLICIESAND INCONCISTENT MACROPOLICIES
• ARGENTINA 1990-2004: WHAT ABOUT ARGENTINA 1990-2004: WHAT ABOUT STRICT TFP? STRICT TFP?

4
ARGENTINA-STYLIZED FACTS: 90´SARGENTINA-STYLIZED FACTS: 90´S
• 90`s: deregulation & privatization, trade & financial
openness
• apparent productivity gains compensate real
appreciation due to convertibility plan
• Lower relative capital costs: K intensity
• Previous Underutilization of K: Ku (60-75)
• After Brazilian devaluation, inconsistent macro
policy could not generate S and TFP in l.r.
5
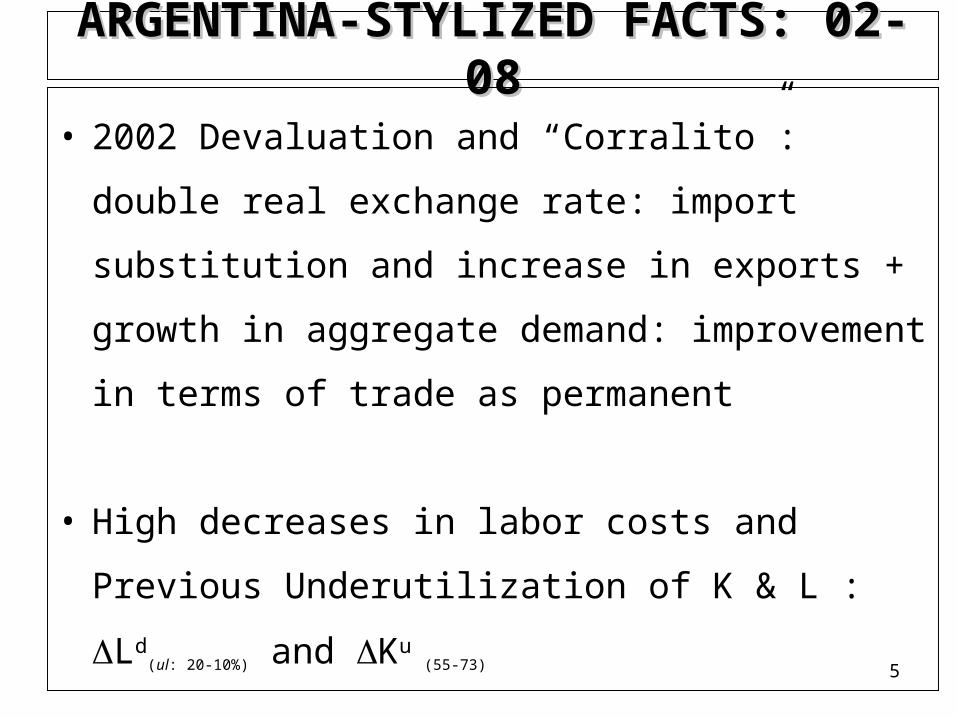
ARGENTINA-STYLIZED FACTS: 02-08ARGENTINA-STYLIZED FACTS: 02-08
• 2002 Devaluation and “Corralito”: double real
exchange rate: import substitution and increase in
exports + growth in aggregate demand:
improvement in terms of trade as permanent
• High decreases in labor costs and Previous
Underutilization of K & L : Ld(ul: 20-10%) and Ku
(55-73)
6
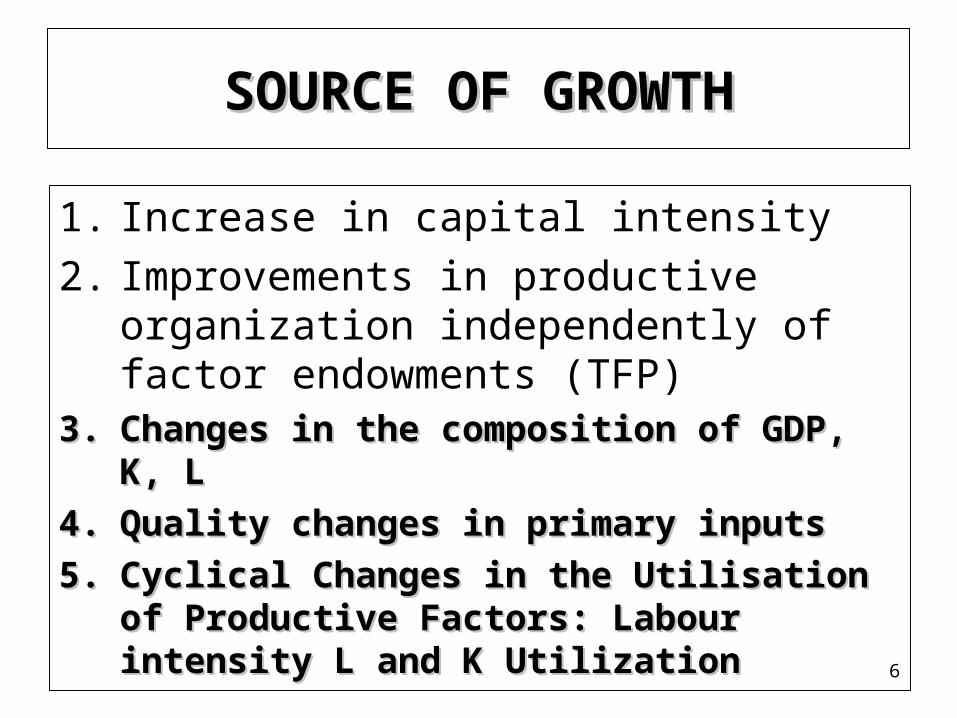
SOURCE OF GROWTHSOURCE OF GROWTH
1. Increase in capital intensity
2. Improvements in productive organization independently of factor endowments (TFP)
3.3. Changes in the composition of GDP, K, LChanges in the composition of GDP, K, L
4.4. Quality changes in primary inputsQuality changes in primary inputs
5.5. Cyclical Changes in the Utilisation of Cyclical Changes in the Utilisation of Productive Factors: Labour intensity L and Productive Factors: Labour intensity L and K UtilizationK Utilization
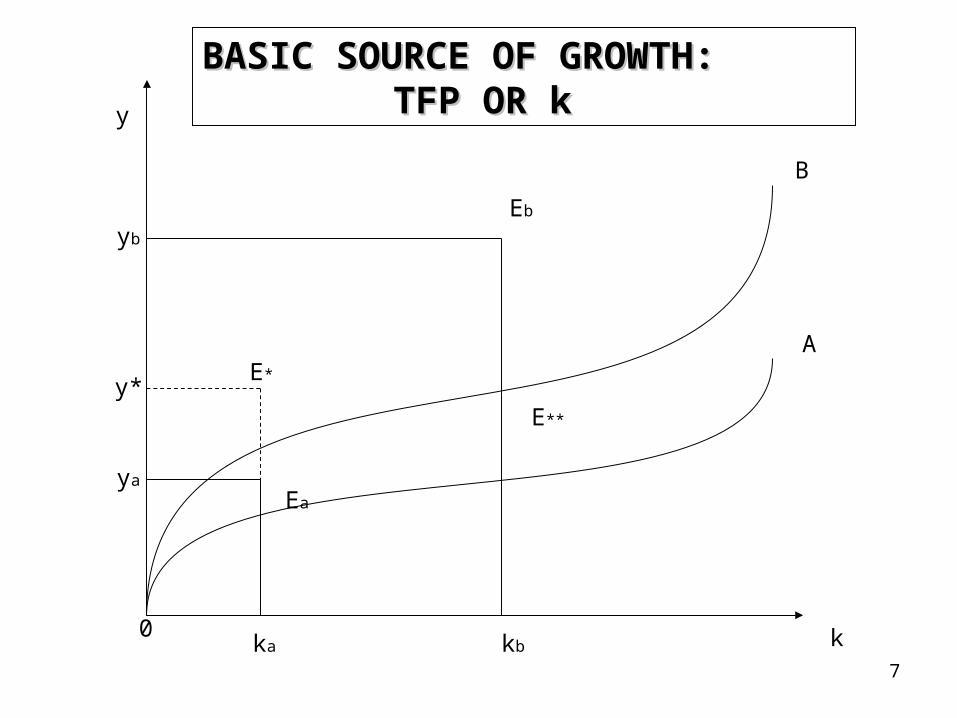
7
y
k
Eb
E*
E**
yb
y*
0
B
A
kbka
BASIC SOURCE OF GROWTH: BASIC SOURCE OF GROWTH: TFP OR kTFP OR k
ya
Ea
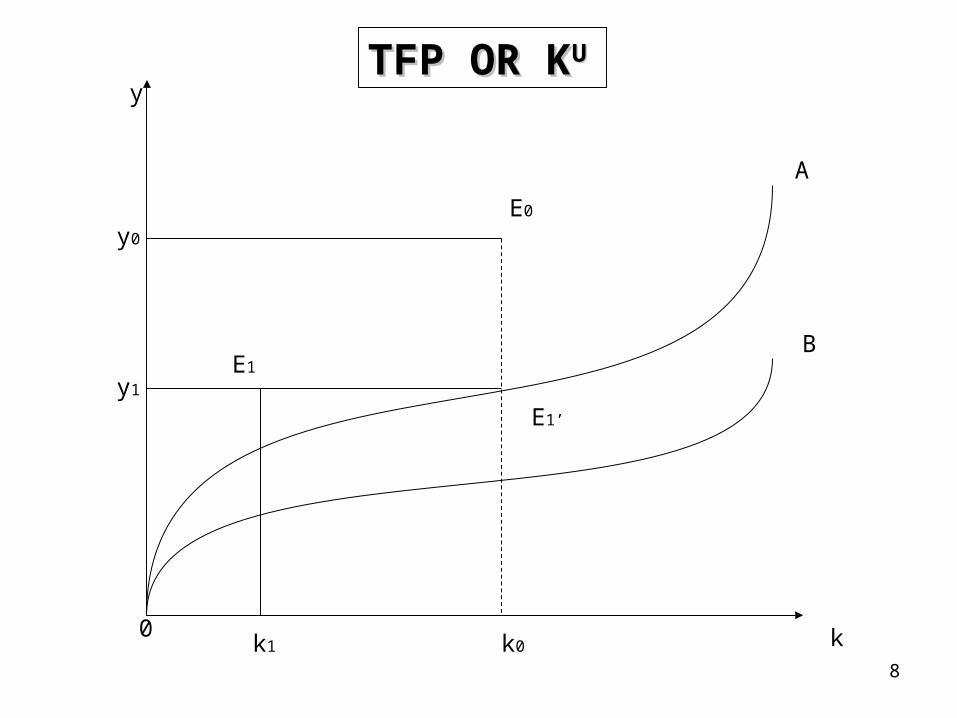
8
y
k
E0
E1
E1’
y0
y1
0
A
B
k0k1
TFP OR KTFP OR KUU
9
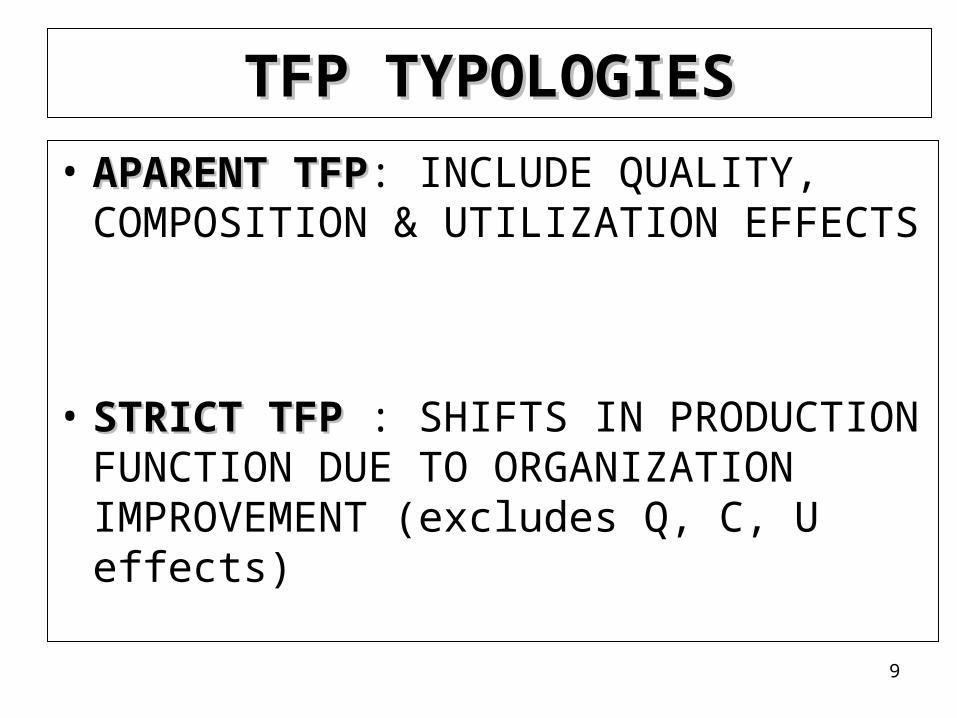
TFP TYPOLOGIESTFP TYPOLOGIES
• APARENT TFPAPARENT TFP: INCLUDE QUALITY, COMPOSITION & UTILIZATION EFFECTS
• STRICT TFPSTRICT TFP : SHIFTS IN PRODUCTION FUNCTION DUE TO ORGANIZATION IMPROVEMENT (excludes Q, C, U effects)
10
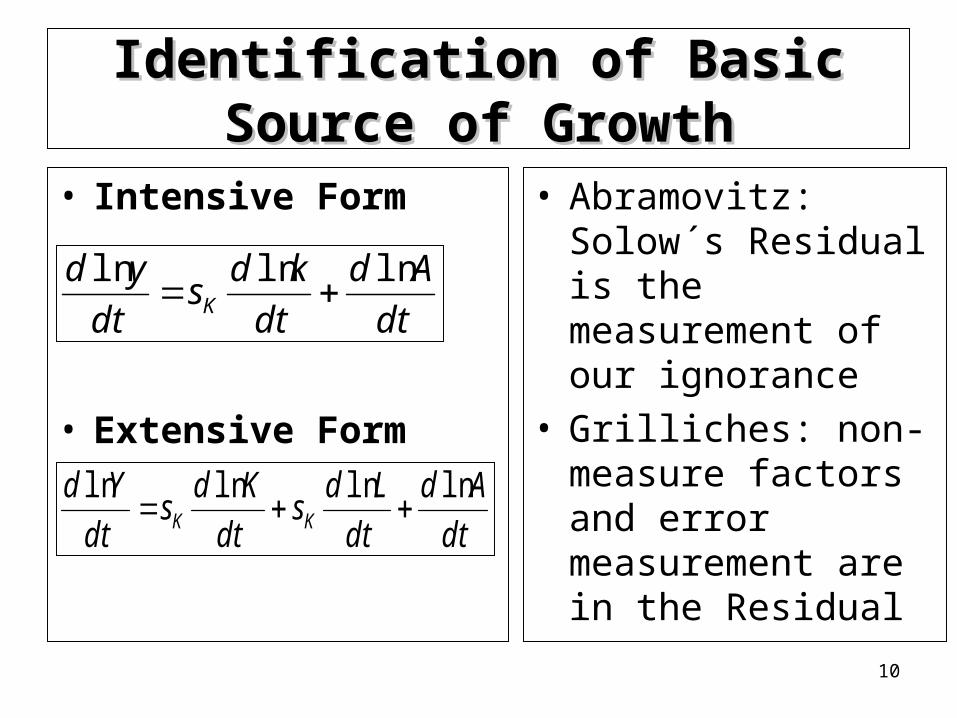
Identification of Basic Source of Identification of Basic Source of GrowthGrowth
• Intensive Form
• Extensive Form
• Abramovitz: Solow´s Residual is the measurement of our ignorance
• Grilliches: non-measure factors and error measurement are in the Residual
dt
Ad
dt
kds
dt
ydK
lnlnln
dt
Ad
dt
Lds
dt
Kds
dt
YdKK
lnlnlnln
11
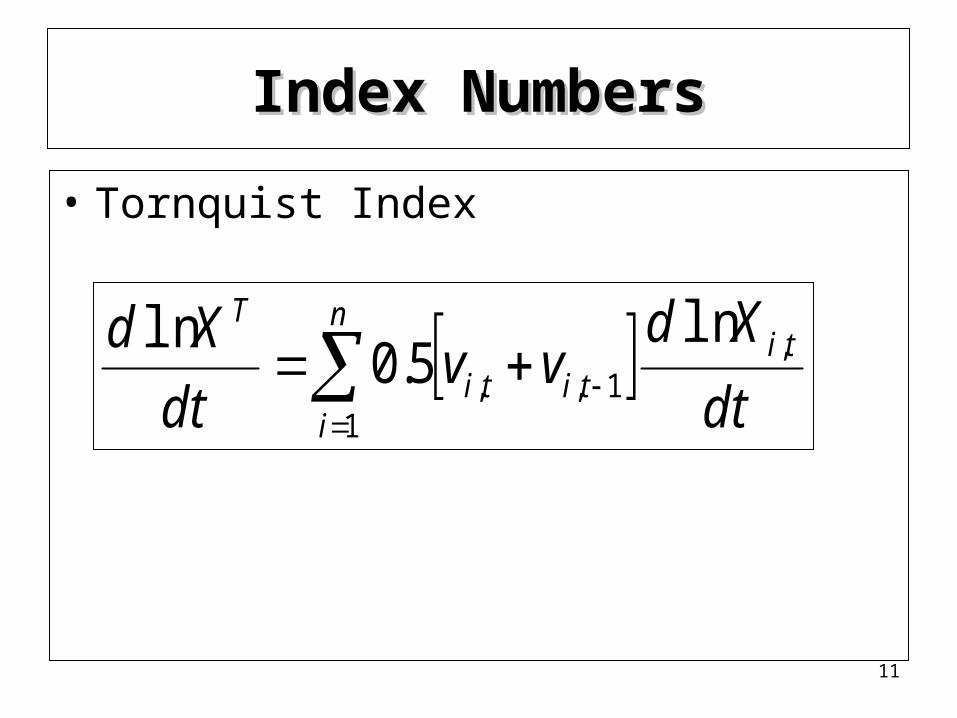
Index NumbersIndex Numbers
• Tornquist Index
n
i
tititi
T
dt
Xdvv
dt
Xd
1
,1,,
ln5.0
ln
12
dt
Xd
dt
Xd
dt
Xd tiB
tiOC
,, lnlnln
dt
Xd
dt
Xd
dt
Xd tiU
tiBQ
,, lnlnln
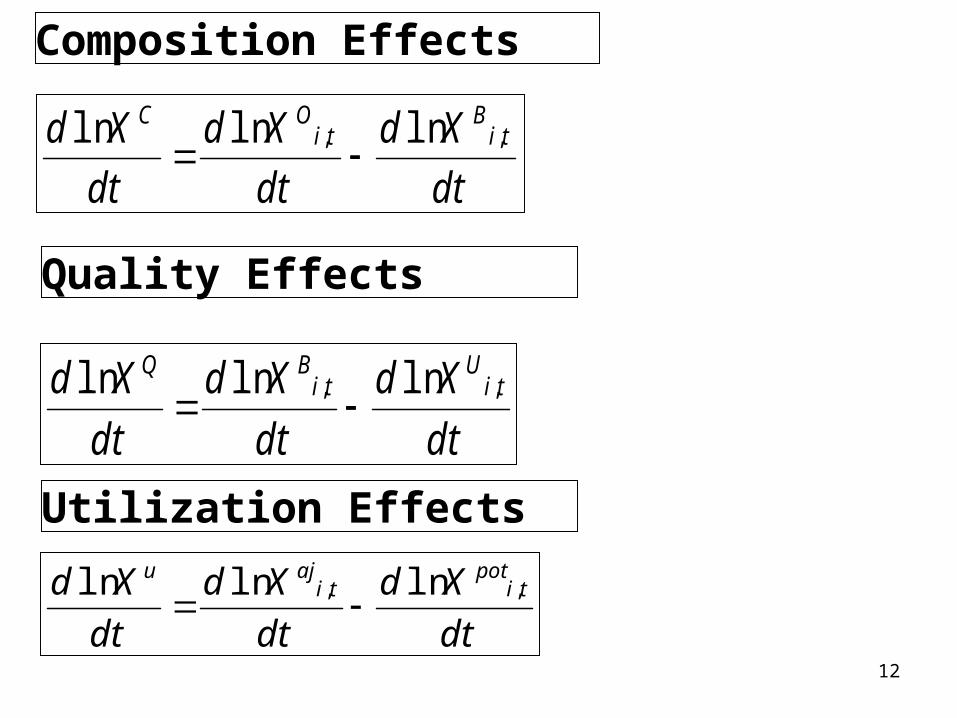
Composition Effects
Quality Effects
Utilization Effects
dt
Xd
dt
Xd
dt
Xd tipot
tiaju
,, lnlnln
13
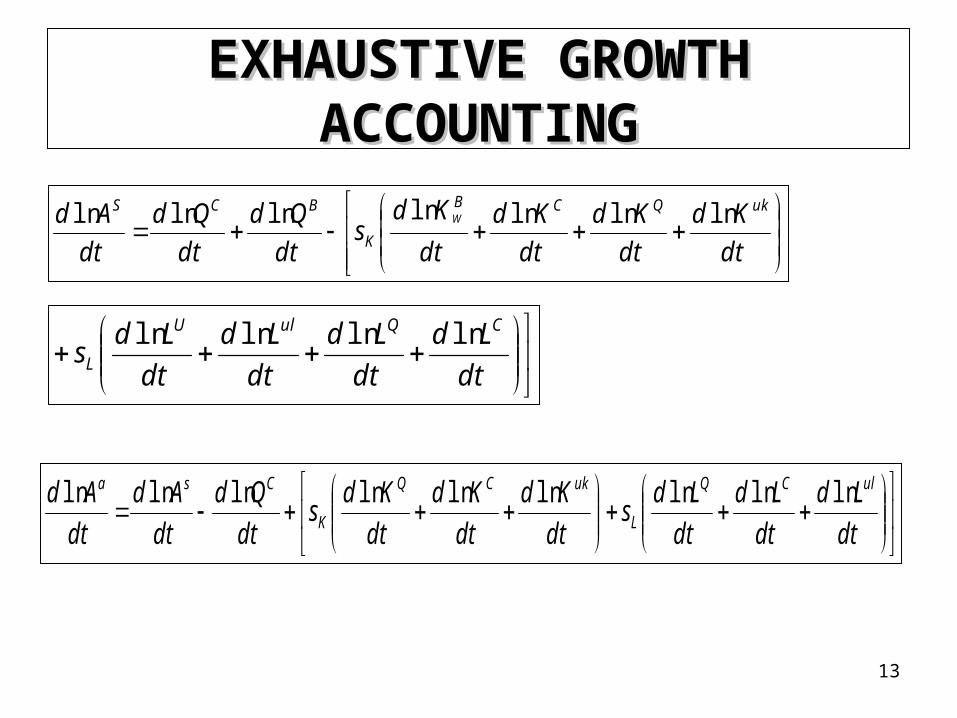
EXHAUSTIVE GROWTH EXHAUSTIVE GROWTH ACCOUNTINGACCOUNTING
dt
Kd
dt
Kd
dt
Kd
dt
Kds
dt
Qd
dt
Qd
dt
Ad ukQCB
K
BCSW lnlnlnlnlnlnln
dt
Ld
dt
Ld
dt
Lds
dt
Kd
dt
Kd
dt
Kds
dt
Qd
dt
Ad
dt
Ad ulCQ
L
ukCQ
K
Csa lnlnlnlnlnlnlnlnln
dt
Ld
dt
Ld
dt
Ld
dt
Lds
CQulU
L
lnlnlnln

14
MAIN RESULTSMAIN RESULTS
15
GDPGDP

16
GROSS DOMESTIC PRODUCT IN ARGENTINA1993=100
70
80
90
100
110
120
130
1990 1991 1992 1993 1994 1995 1996 1997 1998 1999 2000 2001 2002 2003 2004
LASPEYRES INDEX
OPTIMAL INDEX
Source: Author´s estimation based on National Accounts- INDEC
17
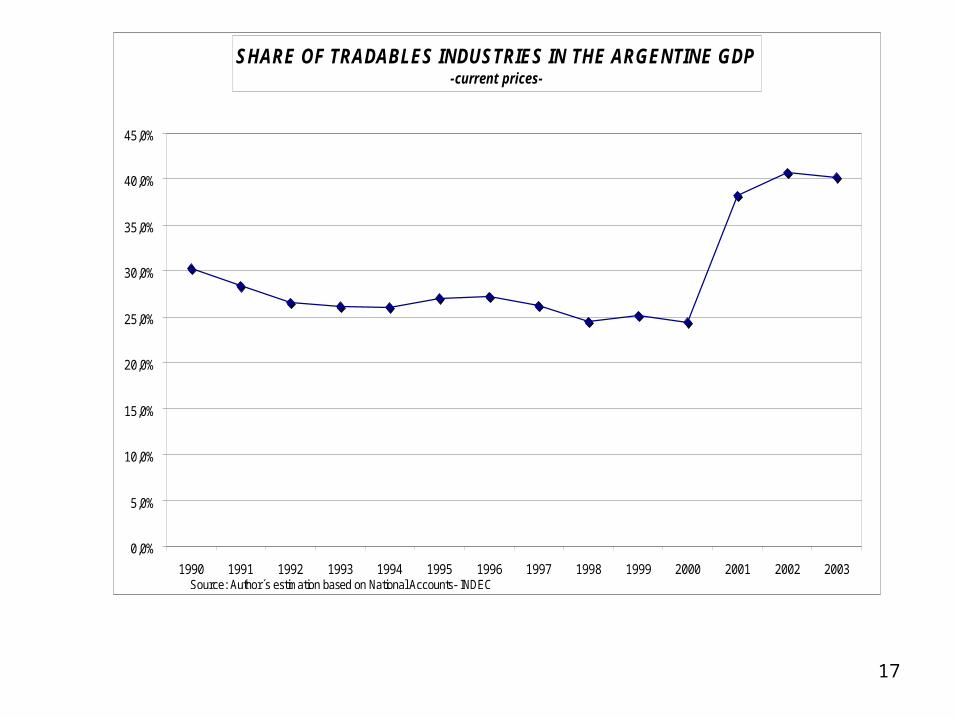
SHARE OF TRADABLES INDUSTRIES IN THE ARGENTINE GDP-current prices-
0,0%
5,0%
10,0%
15,0%
20,0%
25,0%
30,0%
35,0%
40,0%
45,0%
1990 1991 1992 1993 1994 1995 1996 1997 1998 1999 2000 2001 2002 2003Source: Author´s estimation based on National Accounts- INDEC
18
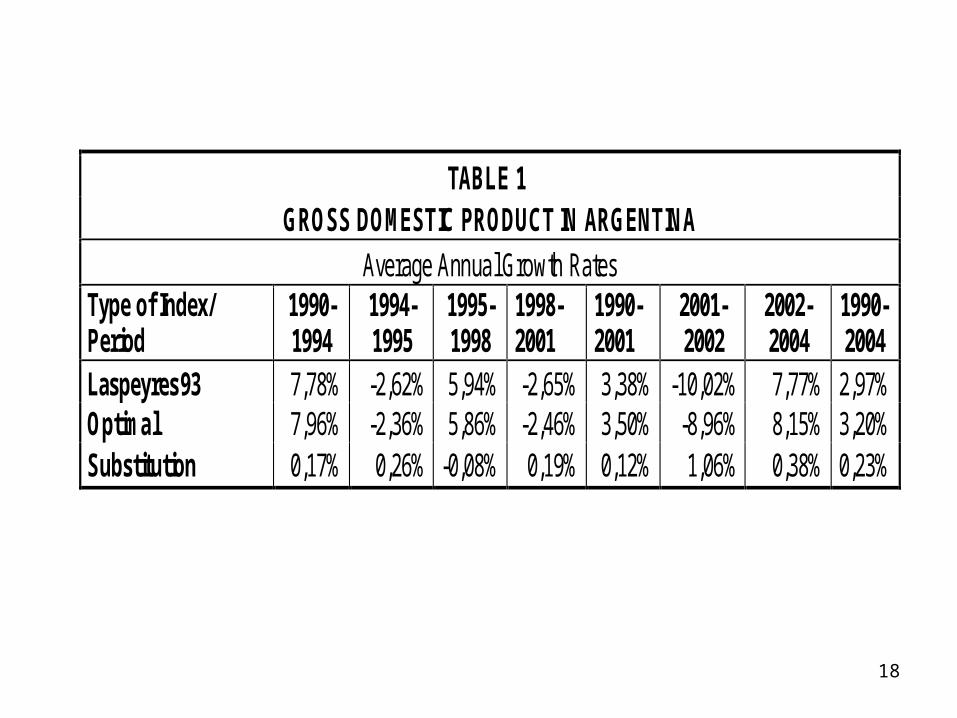
TABLE 1 GROSS DOMESTIC PRODUCT IN ARGENTINA
Average Annual Growth Rates Type of Index/ Period
1990-1994
1994-1995
1995-1998
1998-2001
1990-2001
2001-2002
2002-2004
1990-2004
Laspeyres93 7,78% -2,62% 5,94% -2,65% 3,38% -10,02% 7,77% 2,97% Optimal 7,96% -2,36% 5,86% -2,46% 3,50% -8,96% 8,15% 3,20% Substitution 0,17% 0,26% -0,08% 0,19% 0,12% 1,06% 0,38% 0,23%
19
LABOR INPUTLABOR INPUT
20
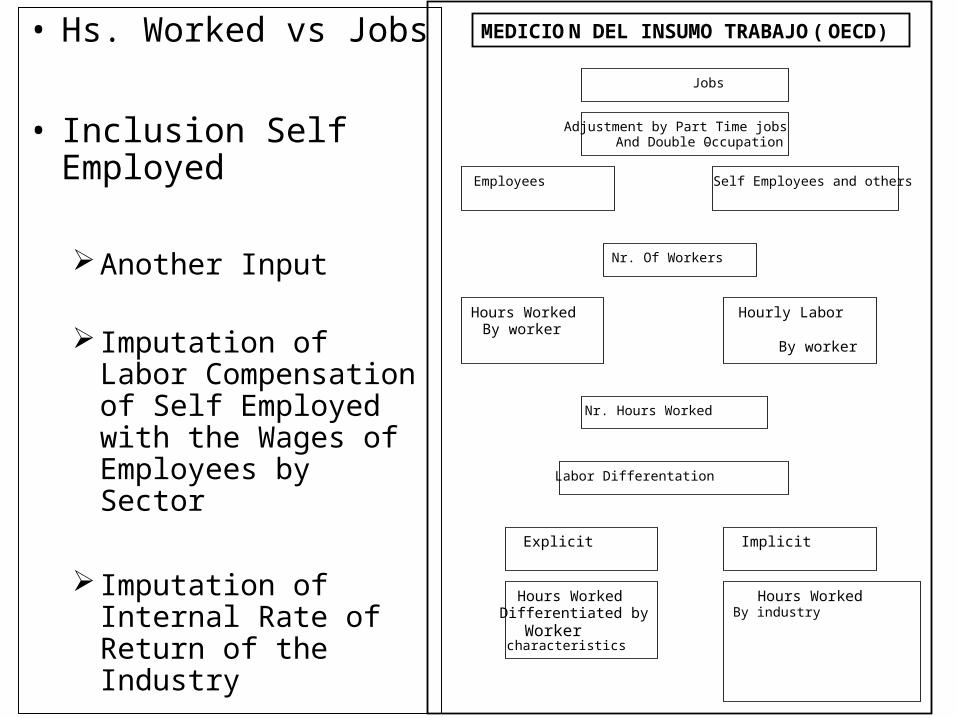
• Hs. Worked vs Jobs
• Inclusion Self Employed
Another Input
Imputation of Labor Compensation of Self Employed with the Wages of Employees by Sector
Imputation of Internal Rate of Return of the Industry
Jobs
Adjustment by Part Time jobs And Double Occupation-
Employees Self Employees and others
Nr. Of Workers
Hourly Labor
By worker
Hours WorkedBy worker
Nr. Hours Worked
Labor Differentation
Explicit
Implicit
Hours Worked Differentiated by Worker
characteristics
Hours Worked By industry
MEDICION DEL INSUMO TRABAJO ( OECD)
21
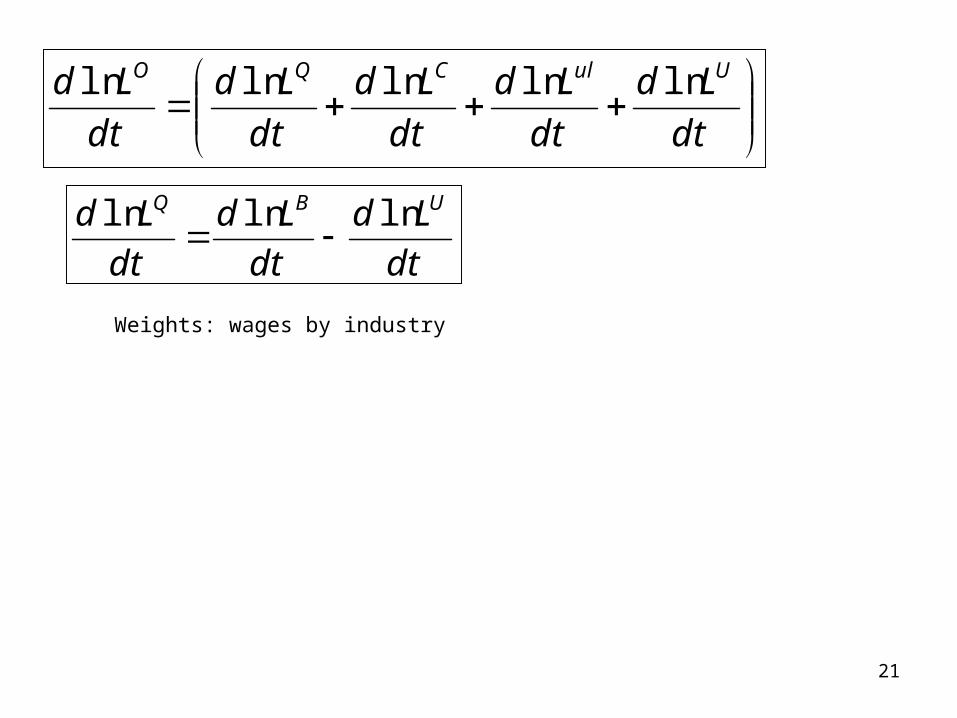
dt
Ld
dt
Ld
dt
Ld
dt
Ld
dt
Ld UulCQO lnlnlnlnln
Weights: wages by industry
dt
Ld
dt
Ld
dt
Ld UBQ lnlnln

22
LABOUR INPUT IN ARGENTINA BY INDICATOR1993=100
70
80
90
100
110
120
1990 1991 1992 1993 1994 1995 1996 1997 1998 1999 2000 2001 2002 2003 2004
Hours Worked
Jobs
Source: Author´s estimation based on National Accounts- INDEC

23
TABLE 1 LABOUR INPUT IN ARGENTINA*
Annual Average Growth Rates
Labour Input Indicator / Period
1990-1994
1994-1995
1995-1998
1998-2001
1991-2001
2001-2002
2002-2004
1990-2004
Jobs 2,44% -2,87% 3,76% -0,34% 1,54% -5,68% 6,33% 1,67%
Hours Worked 4,09% -3,64% 3,27% -1,60% 1,57% -10,60% 10,46% 1,86% Labour Intensity 1,64% -0,77% -0,49% -1,25% 0,03% -4,92% 4,13% 0,19%
24
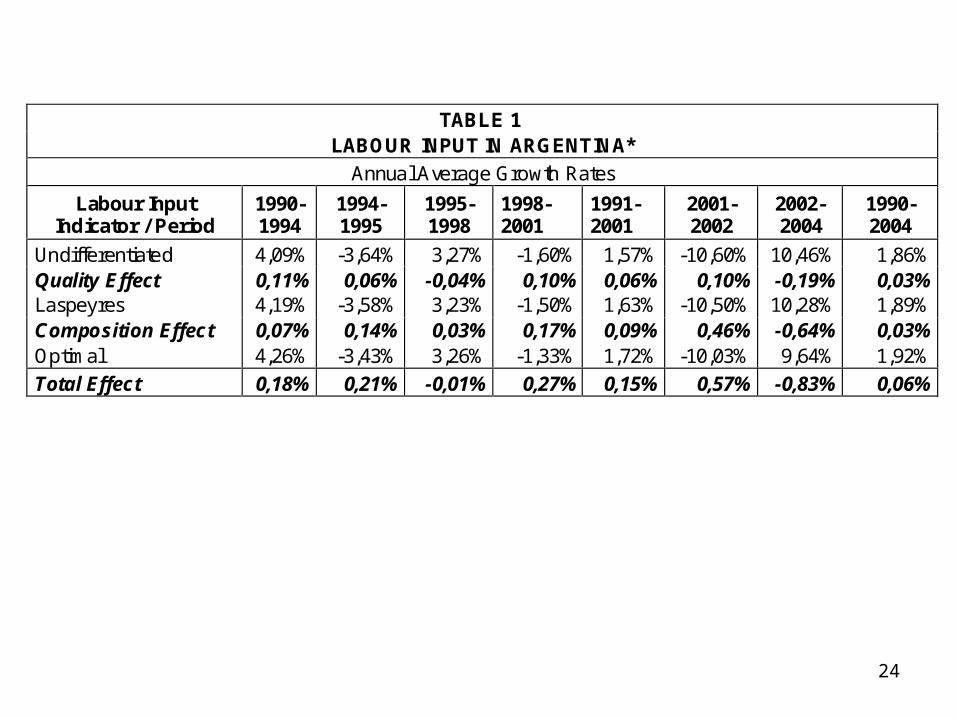
TABLE 1 LABOUR INPUT IN ARGENTINA*
Annual Average Growth Rates
Labour Input Indicator / Period
1990-1994
1994-1995
1995-1998
1998-2001
1991-2001
2001-2002
2002-2004
1990-2004
Undifferentiated 4,09% -3,64% 3,27% -1,60% 1,57% -10,60% 10,46% 1,86% Quality Effect 0,11% 0,06% -0,04% 0,10% 0,06% 0,10% -0,19% 0,03% Laspeyres 4,19% -3,58% 3,23% -1,50% 1,63% -10,50% 10,28% 1,89% Composition Effect 0,07% 0,14% 0,03% 0,17% 0,09% 0,46% -0,64% 0,03% Optimal 4,26% -3,43% 3,26% -1,33% 1,72% -10,03% 9,64% 1,92%
Total Effect 0,18% 0,21% -0,01% 0,27% 0,15% 0,57% -0,83% 0,06%

25
CAPITAL SERVICESCAPITAL SERVICES
26
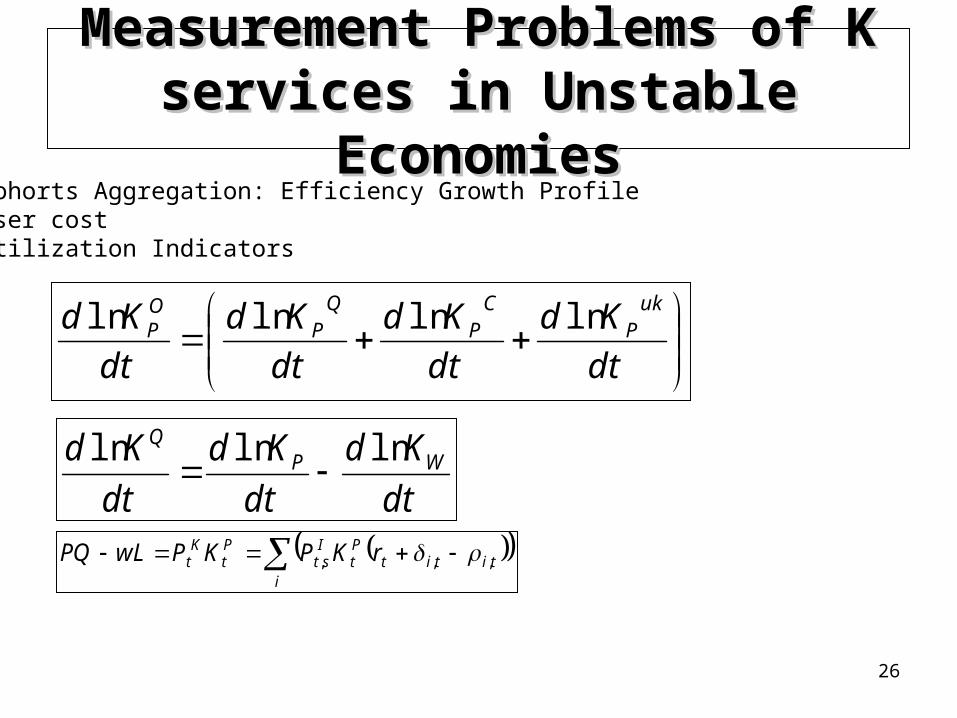
dt
Kd
dt
Kd
dt
Kd
dt
Kd ukP
CP
QP
OP lnlnlnln
dt
Kd
dt
Kd
dt
Kd WPQ lnlnln
i
tititPt
Ist
Pt
Kt rKPKPwLPQ ,,,
Measurement Problems of K Measurement Problems of K services in Unstable Economiesservices in Unstable Economies
•Cohorts Aggregation: Efficiency Growth Profile•User cost•Utilization Indicators
27
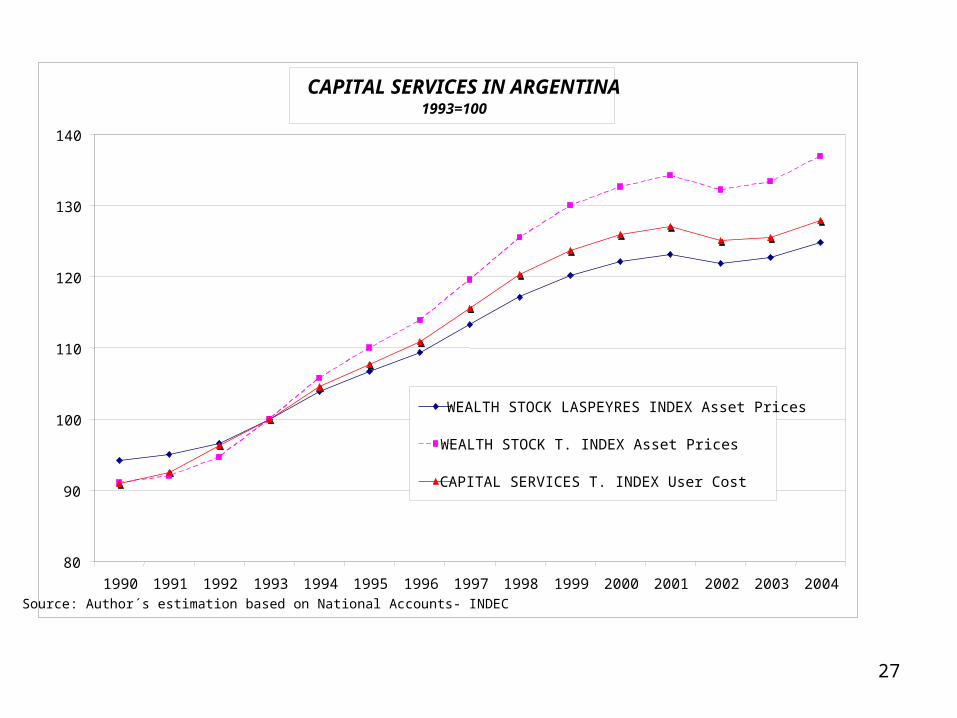
CAPITAL SERVICES IN ARGENTINA1993=100
80
90
100
110
120
130
140
1990 1991 1992 1993 1994 1995 1996 1997 1998 1999 2000 2001 2002 2003 2004
WEALTH STOCK LASPEYRES INDEX Asset Prices
WEALTH STOCK T. INDEX Asset Prices
CAPITAL SERVICES T. INDEX User Cost
Source: Author´s estimation based on National Accounts- INDEC
28
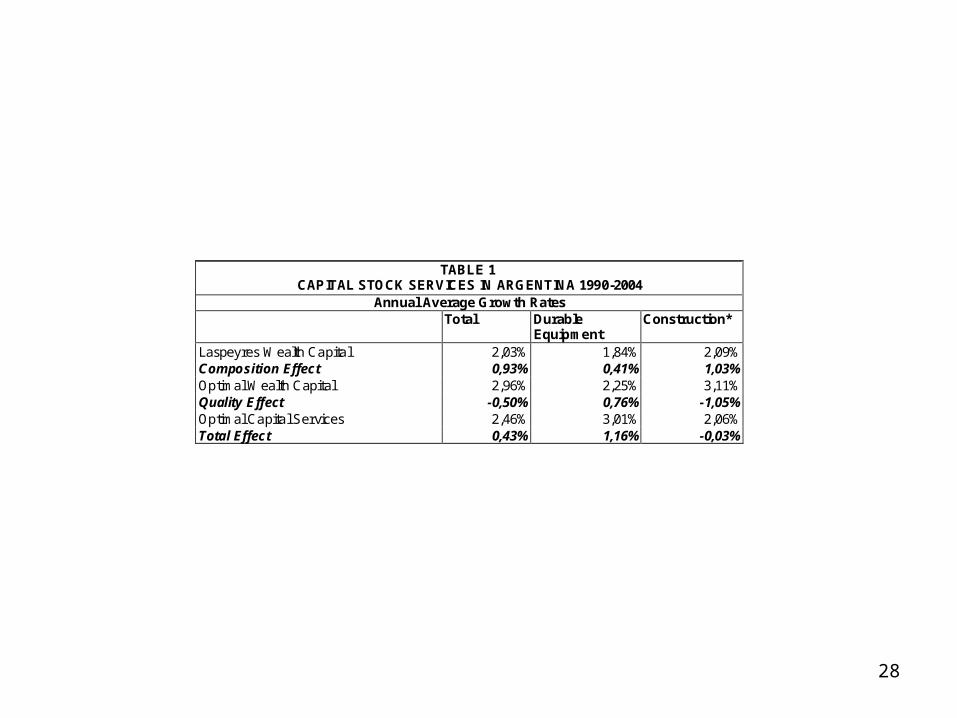
TABLE 1 CAPITAL STOCK SERVICES IN ARGENTINA 1990-2004
Annual Average Growth Rates Total Durable
Equipment Construction*
Laspeyres Wealth Capital 2,03% 1,84% 2,09% Composition Effect 0,93% 0,41% 1,03% Optimal Wealth Capital 2,96% 2,25% 3,11% Quality Effect -0,50% 0,76% -1,05% Optimal Capital Services 2,46% 3,01% 2,06% Total Effect 0,43% 1,16% -0,03%

29
TABLE 1 PROXY INDICATORS OF INSTALLED CAPACITY USE
Assumption Statistical Coverage in Argentina
Output Gap Usual interpretation of Okun: Natural Unemployment Rate
According to the analyst subjectivity, econometric estimations
Employment Rate Complementarity
Hours Worked Complementarity
By Household Surveys in Urban Conglomerates
Energy Consumption Complementarity Energy Demand Surveys Representativity Indicators limited to Manufacturing Indust.
30
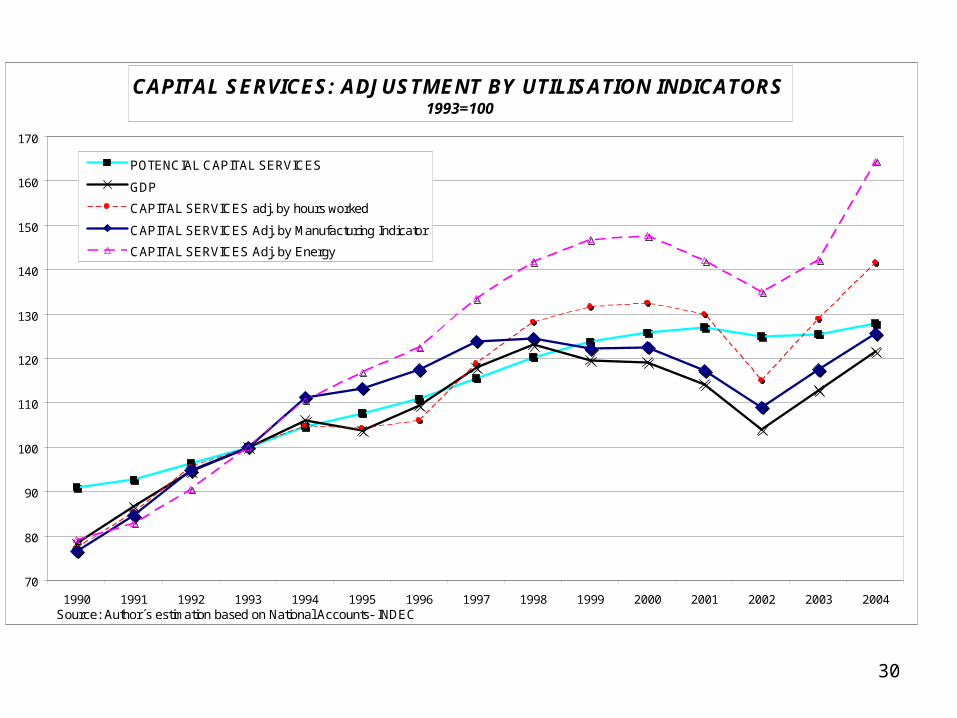
CAPITAL SERVICES: ADJUSTMENT BY UTILISATION INDICATORS1993=100
70
80
90
100
110
120
130
140
150
160
170
1990 1991 1992 1993 1994 1995 1996 1997 1998 1999 2000 2001 2002 2003 2004
POTENCIAL CAPITAL SERVICES
GDP
CAPITAL SERVICES adj. by hours worked
CAPITAL SERVICES Adj. by Manufacturing Indicator
CAPITAL SERVICES Adj. by Energy
Source: Author´s estimation based on National Accounts- INDEC
31
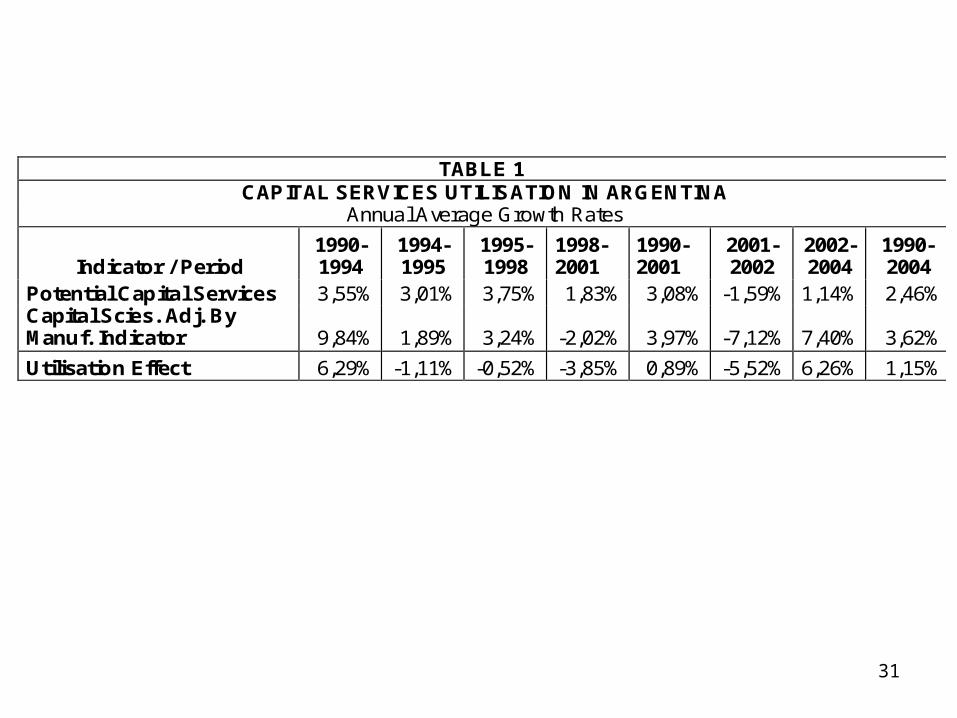
TABLE 1 CAPITAL SERVICES UTILISATION IN ARGENTINA
Annual Average Growth Rates
Indicator / Period 1990-1994
1994-1995
1995-1998
1998-2001
1990-2001
2001-2002
2002-2004
1990-2004
Potential Capital Services 3,55% 3,01% 3,75% 1,83% 3,08% -1,59% 1,14% 2,46% Capital Scies. Adj. By Manuf. Indicator 9,84% 1,89% 3,24% -2,02% 3,97% -7,12% 7,40% 3,62%
Utilisation Effect 6,29% -1,11% -0,52% -3,85% 0,89% -5,52% 6,26% 1,15%
32
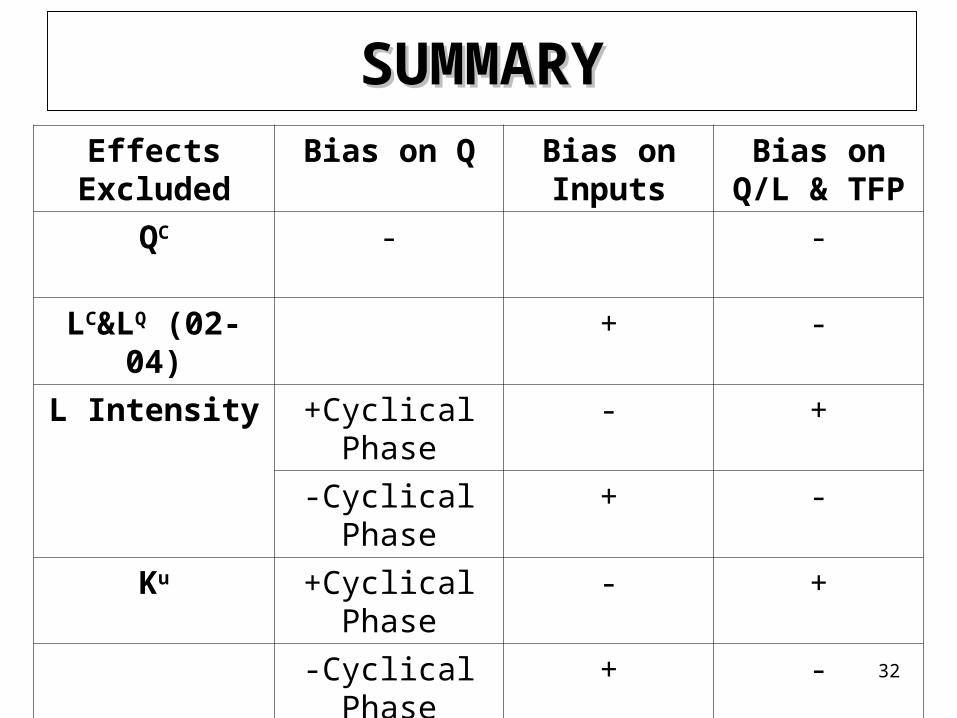
SUMMARYSUMMARYEffects
ExcludedBias on Q Bias on
InputsBias on Q/L
& TFP
QC - -
LC&LQ (02-04) + -
L Intensity +Cyclical Phase - +
-Cyclical Phase + -
Ku +Cyclical Phase - +
-Cyclical Phase + -
KC&KQ - +
33
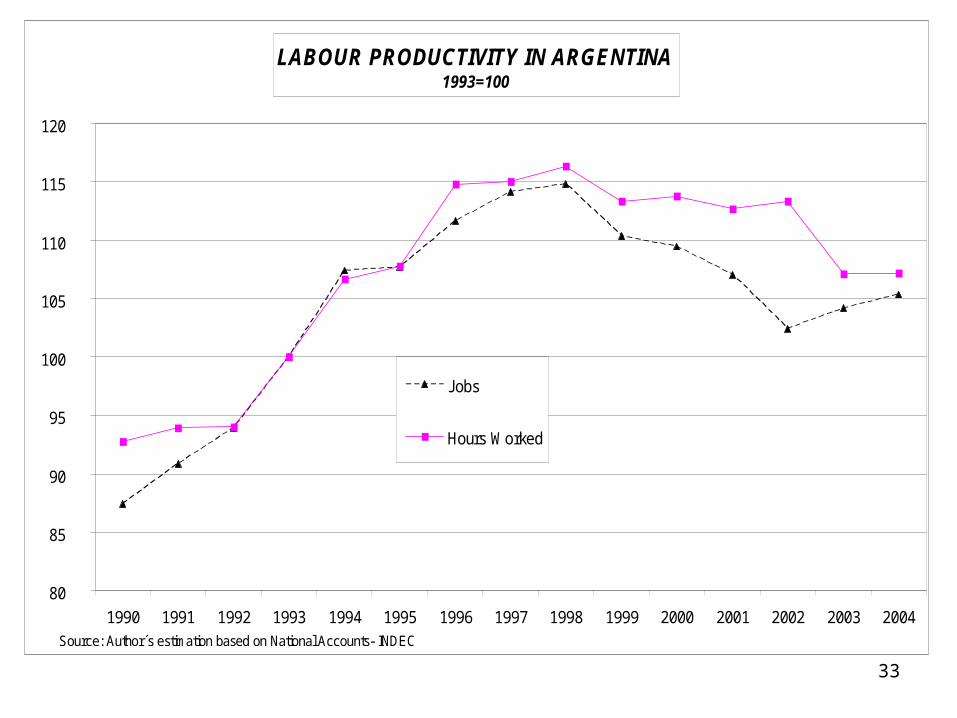
LABOUR PRODUCTIVITY IN ARGENTINA1993=100
80
85
90
95
100
105
110
115
120
1990 1991 1992 1993 1994 1995 1996 1997 1998 1999 2000 2001 2002 2003 2004
Jobs
Hours Worked
Source: Author´s estimation based on National Accounts- INDEC
34
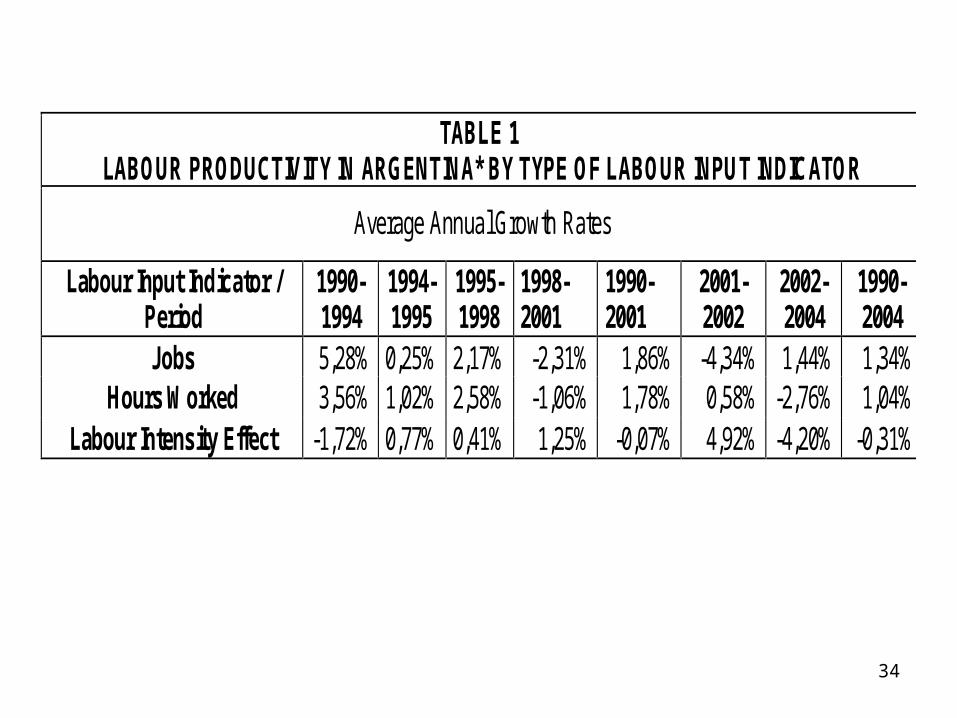
TABLE 1 LABOUR PRODUCTIVITY IN ARGENTINA* BY TYPE OF LABOUR INPUT INDICATOR
Average Annual Growth Rates
Labour Input Indicator / Period
1990-1994
1994-1995
1995-1998
1998-2001
1990-2001
2001-2002
2002-2004
1990-2004
Jobs 5,28% 0,25% 2,17% -2,31% 1,86% -4,34% 1,44% 1,34% Hours Worked 3,56% 1,02% 2,58% -1,06% 1,78% 0,58% -2,76% 1,04%
Labour Intensity Effect -1,72% 0,77% 0,41% 1,25% -0,07% 4,92% -4,20% -0,31%
35
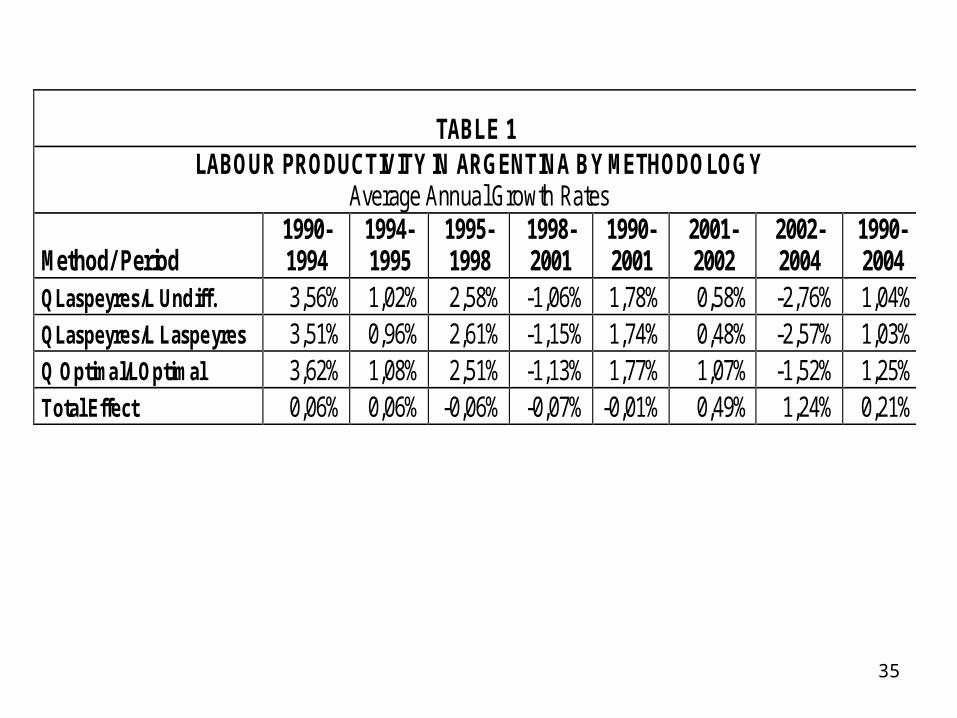
TABLE 1 LABOUR PRODUCTIVITY IN ARGENTINA BY METHODOLOGY
Average Annual Growth Rates
Method/ Period 1990-1994
1994-1995
1995-1998
1998-2001
1990-2001
2001-2002
2002-2004
1990-2004
QLaspeyres/L Undiff. 3,56% 1,02% 2,58% -1,06% 1,78% 0,58% -2,76% 1,04% QLaspeyres/L Laspeyres 3,51% 0,96% 2,61% -1,15% 1,74% 0,48% -2,57% 1,03% Q Optimal/LOptimal 3,62% 1,08% 2,51% -1,13% 1,77% 1,07% -1,52% 1,25% Total Effect 0,06% 0,06% -0,06% -0,07% -0,01% 0,49% 1,24% 0,21%
36
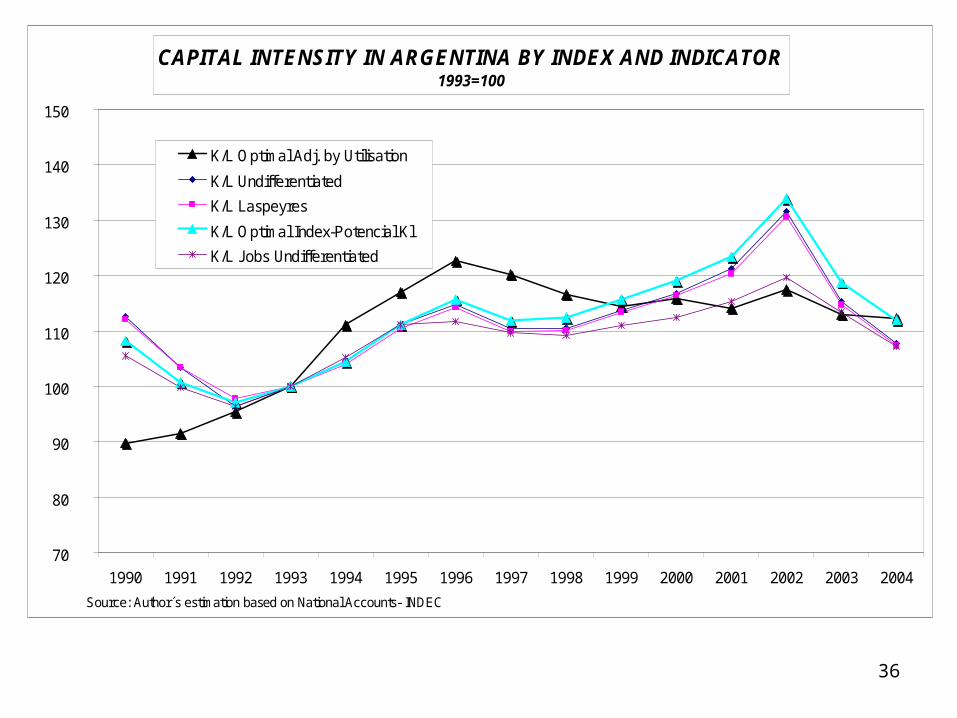
CAPITAL INTENSITY IN ARGENTINA BY INDEX AND INDICATOR1993=100
70
80
90
100
110
120
130
140
150
1990 1991 1992 1993 1994 1995 1996 1997 1998 1999 2000 2001 2002 2003 2004
K/L Optimal Adj. by Utilisation
K/L Undifferentiated
K/L Laspeyres
K/L Optimal Index-Potencial Kl
K/L Jobs Undifferentiated
Source: Author´s estimation based on National Accounts- INDEC
37
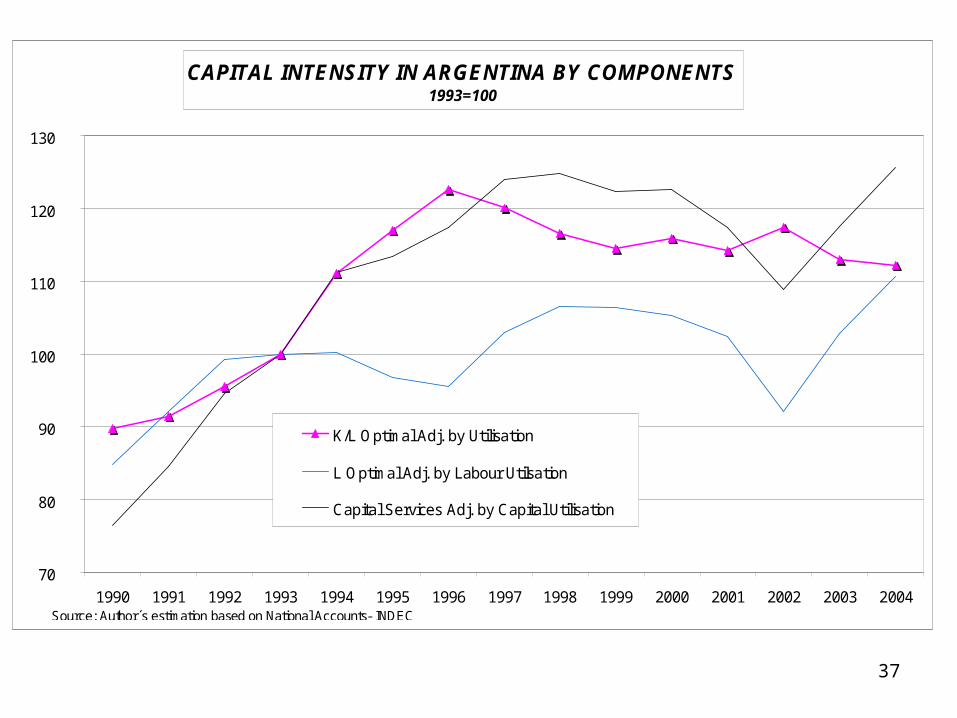
CAPITAL INTENSITY IN ARGENTINA BY COMPONENTS1993=100
70
80
90
100
110
120
130
1990 1991 1992 1993 1994 1995 1996 1997 1998 1999 2000 2001 2002 2003 2004
K/L Optimal Adj. by Utilisation
L Optimal Adj. by Labour Utilsation
Capital Services Adj. by Capital Utilisation
Source: Author´s estimation based on National Accounts- INDEC
38
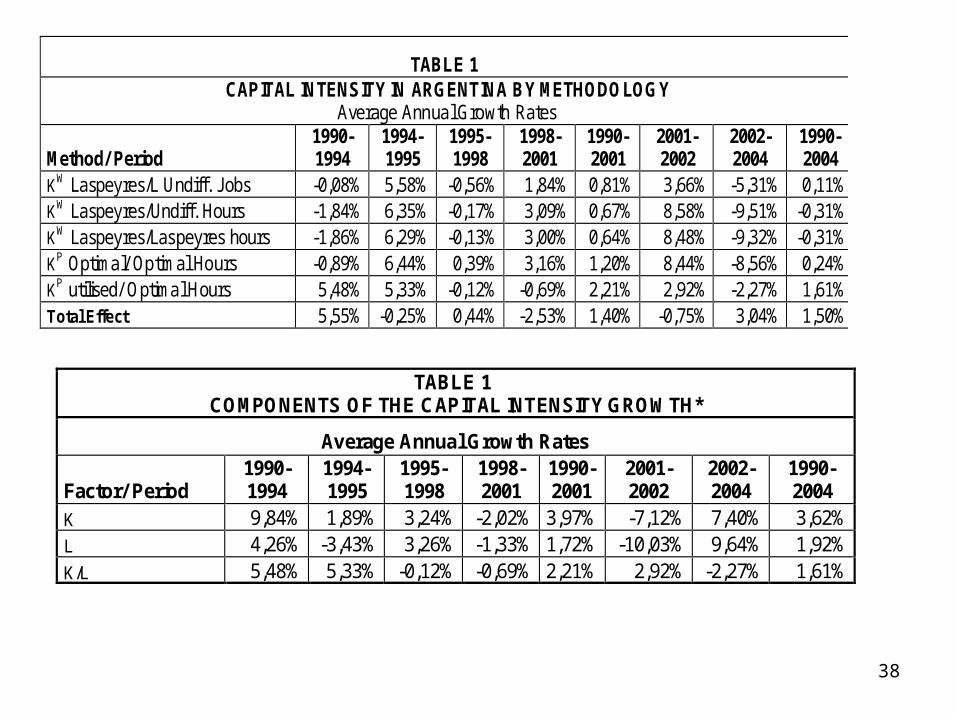
TABLE 1 CAPITAL INTENSITY IN ARGENTINA BY METHODOLOGY
Average Annual Growth Rates
Method/ Period 1990-1994
1994-1995
1995-1998
1998-2001
1990-2001
2001-2002
2002-2004
1990-2004
KW Laspeyres/L Undiff. Jobs -0,08% 5,58% -0,56% 1,84% 0,81% 3,66% -5,31% 0,11% KW Laspeyres/Undiff. Hours -1,84% 6,35% -0,17% 3,09% 0,67% 8,58% -9,51% -0,31% KW Laspeyres/Laspeyres hours -1,86% 6,29% -0,13% 3,00% 0,64% 8,48% -9,32% -0,31% KP Optimal/ Optimal Hours -0,89% 6,44% 0,39% 3,16% 1,20% 8,44% -8,56% 0,24% KP utilised/ Optimal Hours 5,48% 5,33% -0,12% -0,69% 2,21% 2,92% -2,27% 1,61% Total Effect 5,55% -0,25% 0,44% -2,53% 1,40% -0,75% 3,04% 1,50%
TABLE 1 COMPONENTS OF THE CAPITAL INTENSITY GROWTH*
Average Annual Growth Rates
Factor/ Period 1990-1994
1994-1995
1995-1998
1998-2001
1990-2001
2001-2002
2002-2004
1990-2004
K 9,84% 1,89% 3,24% -2,02% 3,97% -7,12% 7,40% 3,62% L 4,26% -3,43% 3,26% -1,33% 1,72% -10,03% 9,64% 1,92% K/L 5,48% 5,33% -0,12% -0,69% 2,21% 2,92% -2,27% 1,61%
39
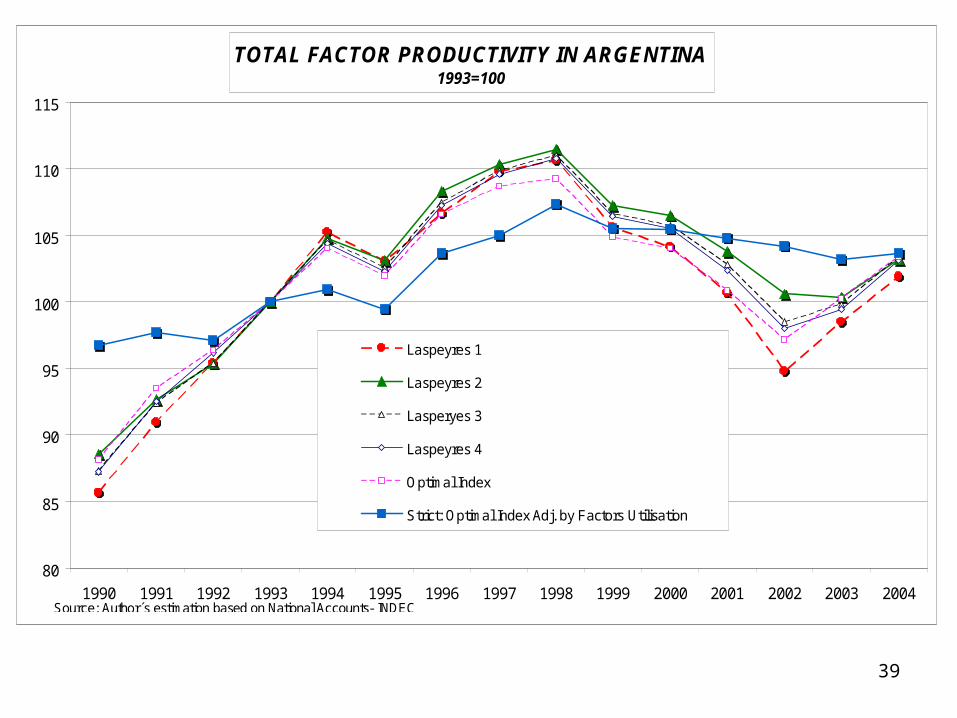
TOTAL FACTOR PRODUCTIVITY IN ARGENTINA1993=100
80
85
90
95
100
105
110
115
1990 1991 1992 1993 1994 1995 1996 1997 1998 1999 2000 2001 2002 2003 2004
Laspeyres 1
Laspeyres 2
Lasperyes 3
Laspeyres 4
Optimal Index
Strict: Optimal Index Adj. by Factors Utilisation
Source: Author´s estimation based on National Accounts- INDEC

40
TABLE 1 TOTAL FACTOR PRODUCTIVITY IN ARGENTINA BY METHODOLOGY
Average Annual Growth Rates
Method/ Period 1990-1994
1994-1995
1995-1998
1998-2001
1990-2001
2001-2002
2002-2004
1990-2004
Laspeyres 1 5,3% -2,1% 2,4% -3,1% 1,5% -5,9% 3,7% 1,2% Laspeyres 2 4,3% -1,7% 2,7% -2,4% 1,5% -3,0% 1,3% 1,1% Laspeyres 3 4,6% -2,0% 2,7% -2,5% 1,5% -4,2% 2,5% 1,2% Laspeyres 4 4,6% -2,0% 2,7% -2,6% 1,5% -4,3% 2,5% 1,2% Optimal Index 4,2% -2,0% 2,3% -2,6% 1,2% -3,7% 3,2% 1,1% Strict 1,1% -1,5% 2,6% -0,8% 0,7% -0,6% -0,3% 0,5%
41
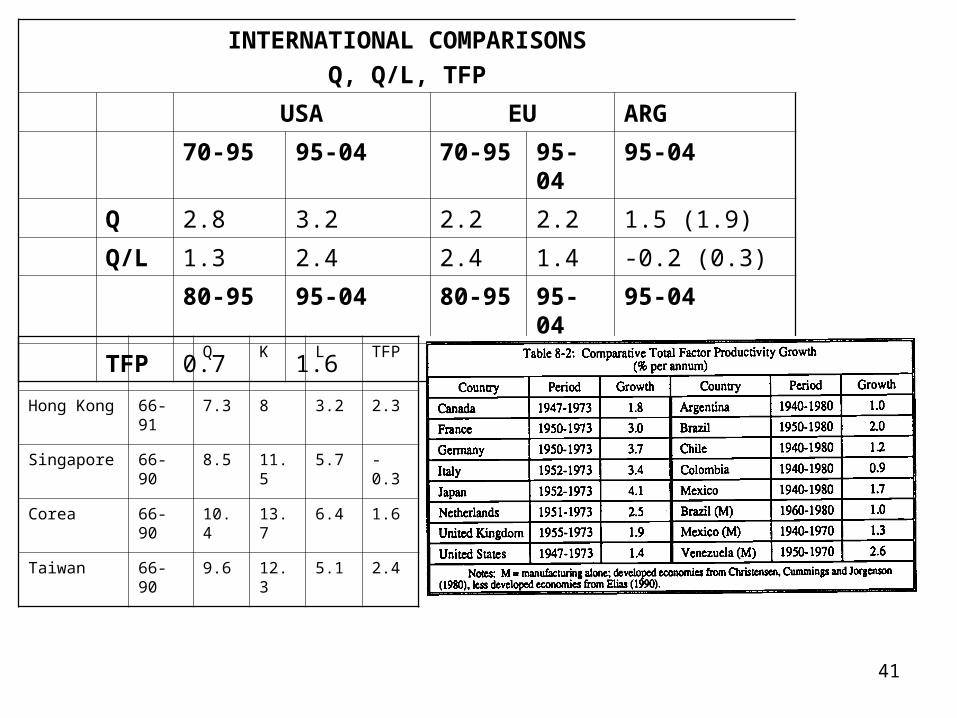
INTERNATIONAL COMPARISONS
Q, Q/L, TFP
USA EU ARG
70-95 95-04 70-95 95-04 95-04
Q 2.8 3.2 2.2 2.2 1.5 (1.9)
Q/L 1.3 2.4 2.4 1.4 -0.2 (0.3)
80-95 95-04 80-95 95-04 95-04
TFP 0.7 1.6 0.7 0.3 0.3a (-0.1S)
Q K L TFP
Hong Kong 66-91 7.3 8 3.2 2.3
Singapore 66-90 8.5 11.5 5.7 -0.3
Corea 66-90 10.4 13.7 6.4 1.6
Taiwan 66-90 9.6 12.3 5.1 2.4

42
SOURCE OF GROWTH IN ARGENTINA 1990-2004
59%
-38%
28%40%
56%44% 50% 57%
14%
-44%
23%
-24%
31%9% 6%
27%
28%
76% 28%28%
25% 49%53% 30%
18%63%
37%
7%
26%
33% 47%
33%
13%
62%
45%32%
19%6%
-3%
13%
68%
80%
41%
116%
43%59%
47% 40%
-100%
-50%
0%
50%
100%
150%
200%
1990-1994
1994-1995
1995-1998
1998-2001
1990-2001
2001-2002
2002-2004
1990-2004
1990-1994
1994-1995
1995-1998
1998-2001
1990-2001
2001-2002
2002-2004
1990-2004
Co
ntr
ibu
tio
n t
o A
vera
ge
An
ual
GD
P G
row
h(%
)
K L TFP
OPTIMAL METHODOLOGYTRADITIONAL METHODOLOGY
Source: Author´s estimation based on National Accounts- INDEC
43
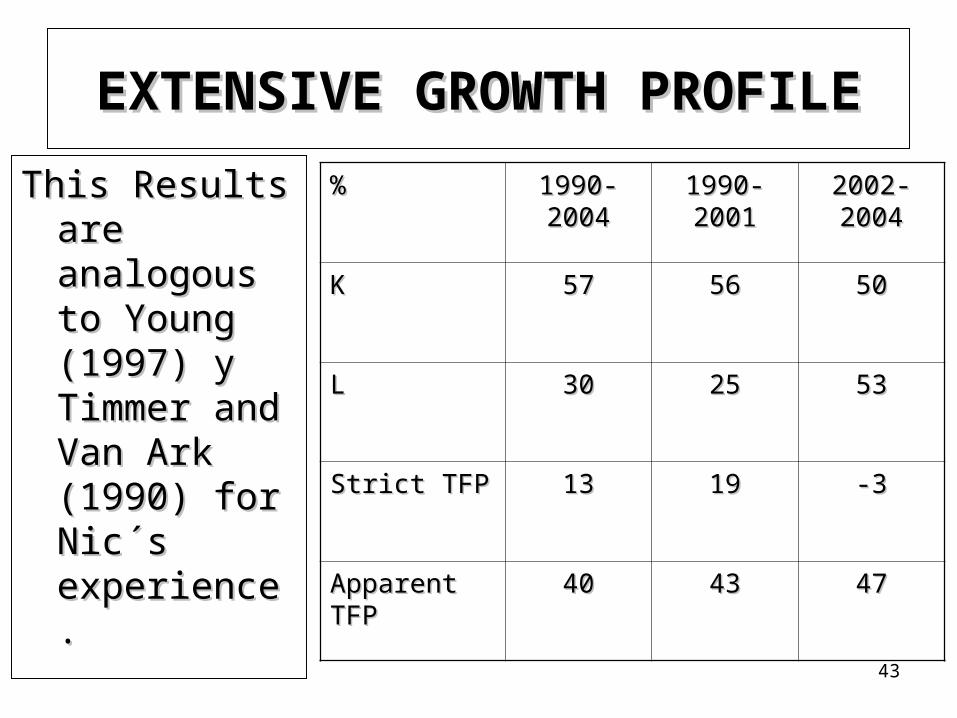
EXTENSIVE GROWTH PROFILEEXTENSIVE GROWTH PROFILE
This Results are This Results are analogous to analogous to Young (1997) Young (1997) y Timmer and y Timmer and Van Ark Van Ark (1990) for Nic(1990) for Nic´s experience.´s experience.
%% 1990-1990-20042004
1990-1990-20012001
2002-2002-20042004
KK 5757 5656 5050
LL 3030 2525 5353
Strict TFPStrict TFP 1313 1919 -3-3
Apparent TFPApparent TFP 4040 4343 4747
44
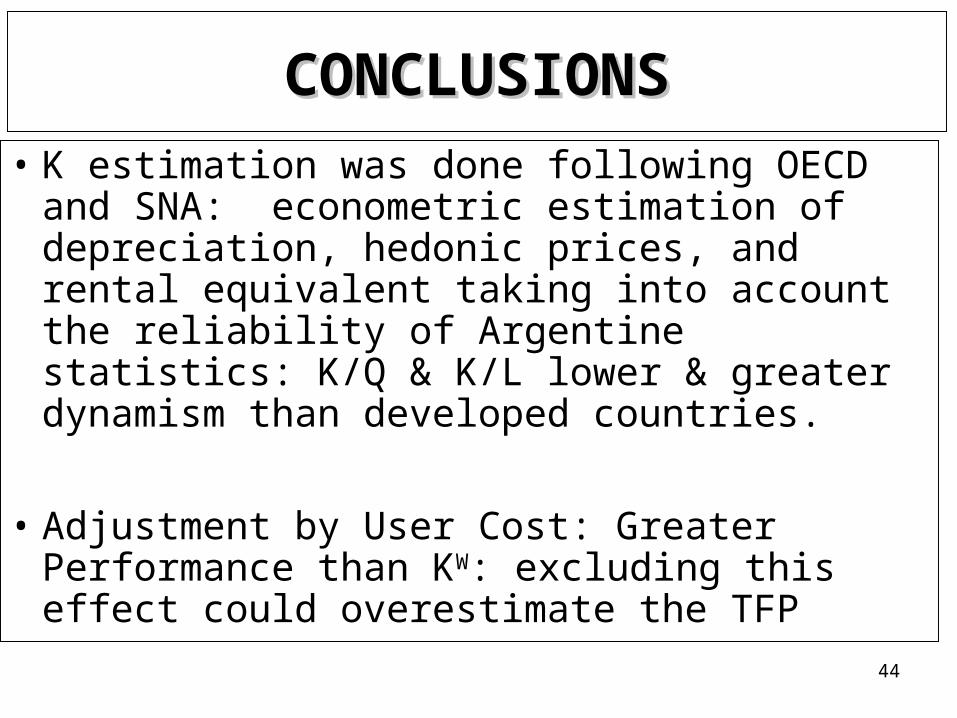
CONCLUSIONSCONCLUSIONS
• K estimation was done following OECD and SNA: econometric estimation of depreciation, hedonic prices, and rental equivalent taking into account the reliability of Argentine statistics: K/Q & K/L lower & greater dynamism than developed countries.
• Adjustment by User Cost: Greater Performance than KW: excluding this effect could overestimate the TFP

45
CONCLUSIONSCONCLUSIONS
• Non-measure of Composition and Quality Effects in L & Substitution in Q underestimate Q/L & Strict TFP (2002-2004)
• The adjustment by Labour Intensity and K utilisation reduce the pro cyclical behaviour of TFP
46
• The importance of competitive gains of the Argentine economy through improvements in apparent cyclical TFP, generated both during the nineties and after 2002 devaluation, are unquestionable. However, doubts arise about the ability of the Argentine economy to generate the necessary productivity gains in the strict sense, independently of composition and quality effects and cyclical variations in factor utilisation, that allow to maintain a sustainable long run growth.
• The extensive growth profile diagnosed for the Argentine economy, especially during the nineties, contrasts with assessments of other authors and institutions based on the traditional methodology: without adjusting by relative price effects and factor utilisation. On the contrary, our results are analogous to the evidence found by Young (1995) and Timmer and Van Ark (2000) for Nic´s countries.
• This conclusion is based not only in what Young (1995) called the “tyranny of numbers”, by assessing strictly the consistency of the country statistical information, but also a consequence of the “tyranny of the economic cycle, macroeconomic and methodological consistency”.