Embed Size (px)
Citation preview
1
Mapping the Fear of Crime, a Web Based GIS Solution to
Capturing “Fuzzy” Geography –
or
Andy Evans – Leeds Universityhttp://www.ccg.leeds.ac.uk/
Centre for Computational Geography, School of Geography, University of Leeds
Leeds, UK, LS2 9JT
Tim Waters – Bradford Councilhttp://www.bradford.gov.uk
Jacobs Well,
Bradford,
BD1 5RW
what “the dodgy area near me Gran’s” means
2
In Brief• The Geography of everyday – the
vernacular.
• Fear of crime, and how to map it
• What sort of results can we get
• What can we do with these results
3
How do people relate to the world?
• How people relate to the world
• Fear of Crime
• Capturing vernacular geography
• Using vernacular geography
• Case study on West Yorkshire Town
4
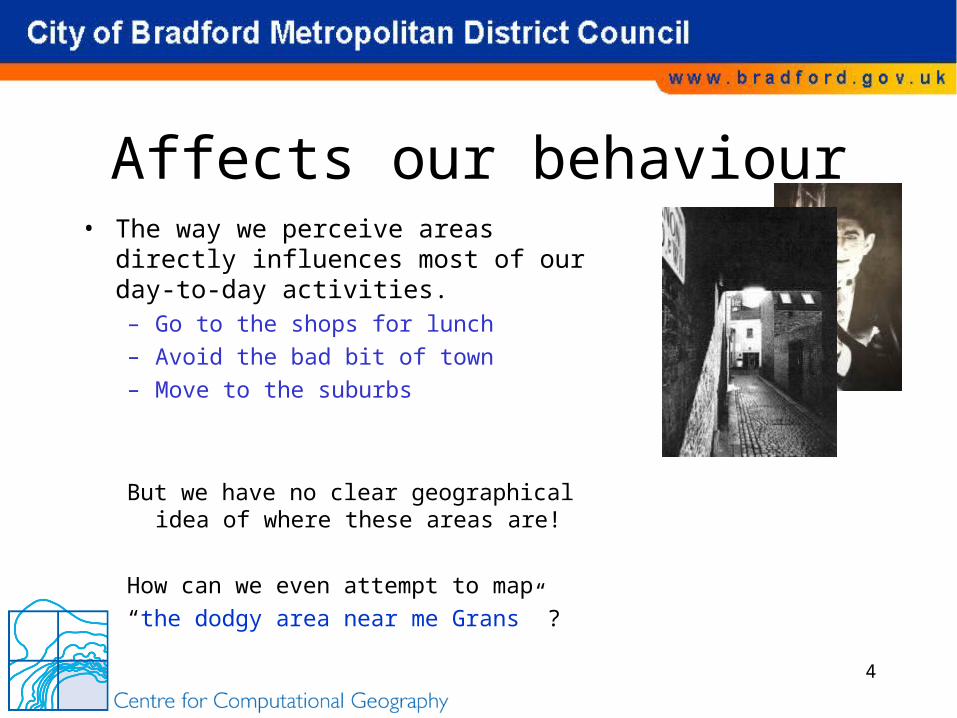
Affects our behaviour• The way we perceive areas directly
influences most of our day-to-day activities. – Go to the shops for lunch
– Avoid the bad bit of town
– Move to the suburbs
But we have no clear geographical idea of where these areas are!
How can we even attempt to map
“the dodgy area near me Grans” ?
5
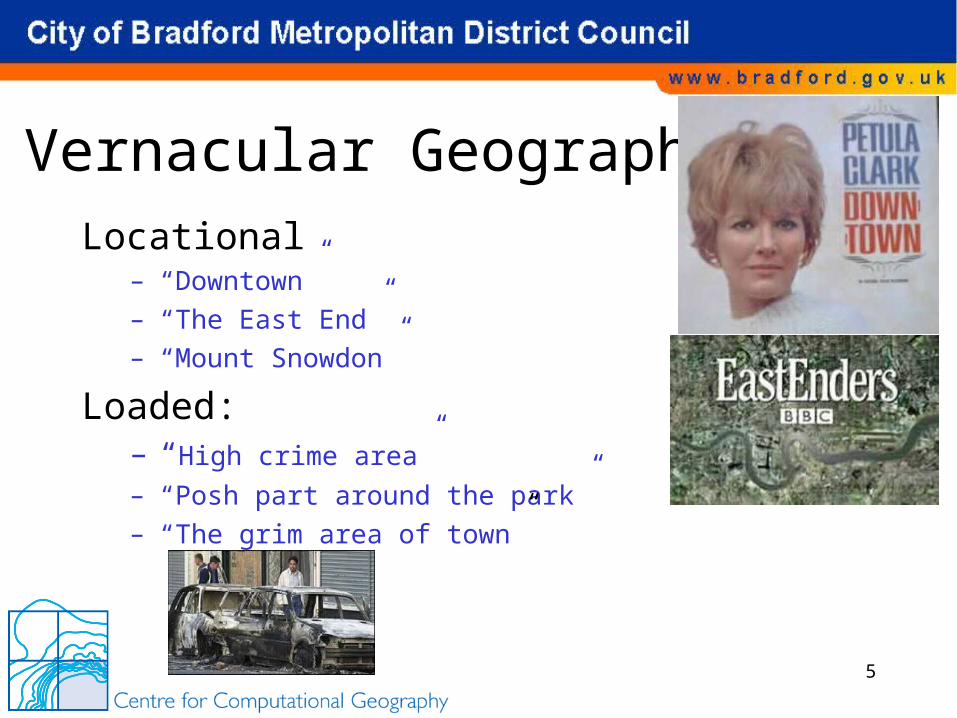
Vernacular GeographyLocational
– “Downtown”– “The East End”– “Mount Snowdon”
Loaded:– “High crime area”
– “Posh part around the park”– “The grim area of town”
6
Think GIS?Pretty much everyone:• Doesn’t think GIS• Uses geographical terms they cant define• Mixes up attribute datasets• Rarely puts anything precisely on a map
Causes a problem for the crime mappers!
7
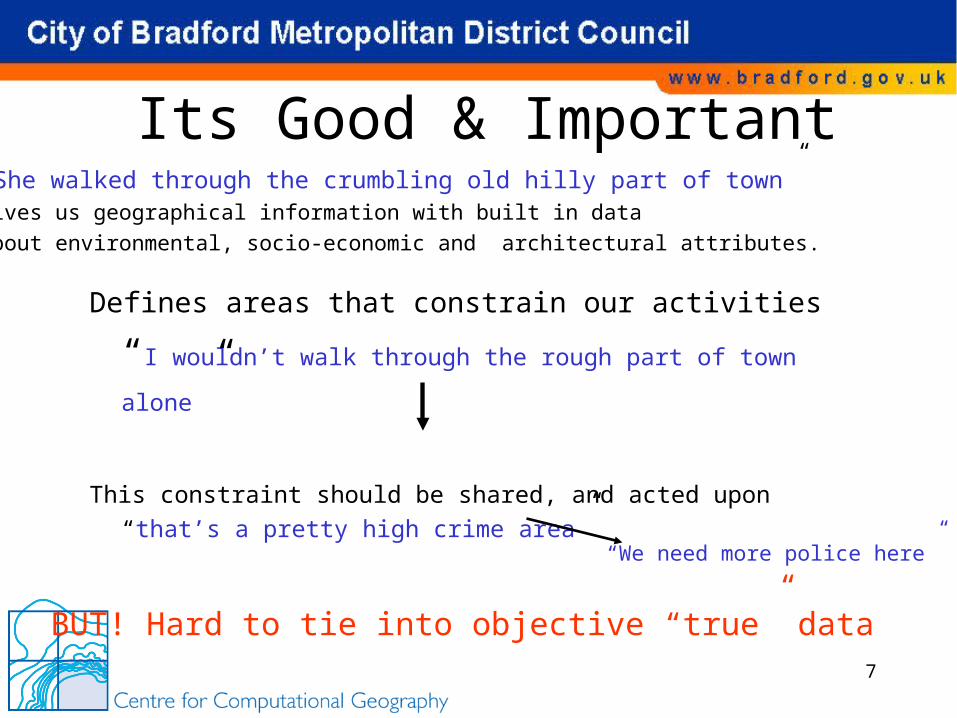
Its Good & Important
Defines areas that constrain our activities
“I wouldn’t walk through the rough part of town alone”
This constraint should be shared, and acted upon
“that’s a pretty high crime area”
BUT! Hard to tie into objective “true” data
“We need more police here”
“She walked through the crumbling old hilly part of town”Gives us geographical information with built in data
about environmental, socio-economic and architectural attributes.
8
Vernacular is also fuzzy• Fuzzy boundaries occur:
– Continuousness– Where does a mountain start?– Crime hotspots – lukewarm?
– Aggregation– Soil types
– Averaging– River on a map
– Ambiguity– Definition of “high” crime areas
9
Fear of crime examplevernacular = fuzzy
If you asked 10 people in the street:
Define and explain areas where they are afraid to walk in the dark:
• Datasets people use are continuous and discrete at differing scales, historical, architectural, temporal and mythological.
• “Smart end of town” “25 Cromwell Street”
• Areas are linguistically ambiguous
• Areas may by bound by landscape (I.e. “within the ring-road”) but more usually diffuse
• Often have different levels of intensity with the areas
• Differences between people.
10
Fear of Crime• How people relate to the world
• Fear of Crime
• Capturing vernacular geography
• Using vernacular geography
• Case study of West Yorkshire Town
11
Importance of Perceptions• Susan Smith (1989) summarises fear of crime: “Fear is more than simply
awareness about crime, and more than concern about the problem of local deviance. …Rather, fear is a state of constant or intermittent anxiety: its effects reach beyond the prudent management of risk to impinge on public morale, individual well-being and the quality of social life.”
• Garofalo (1981) connects fear of crime with the environment; “an emotional reaction characterised by a sense of danger and anxiety…produced by the threat of physical harm…elicited by perceived cues in the environment that relate to some aspect of crime”
“fear of crime will grow unless unchecked.
As an issue of social concern, it has to be taken as seriously
as…crime prevention and reduction” (Home Office 1989).
12
Reality != Perception but Perception > Reality
Most studies:
The pattern of fear does not equal the pattern of reality
“Although fears of being victimised are widely held and influence behaviour in space, they are out of proportion to real levels of risk” (Evans 1989)
“It is the fear, often exaggerated, of victimisation which creates most of the stress… The police actually witness and discover very few offences, citizen vigilante groups have disbanded out of the frustration of seeing nothing to report; crime prevention should focus on its passive role of allying fear as well as on its active role as a deterrent to offenders.” (Herbert 1982)
This may seem controversial. Why exaggerate?
So is Fear more important?
13
Effects of Fear of Crime• It ruins the sense of community and makes some places “no-go” areas.
• Wealthy people protecting themselves or moving from the area, this may lead to crime being displaced onto those already suffering.
• It could lead to people being disillusioned with the criminal justice system, with a feeling of helplessness. This could lead to vigilante groups or even lynch mobs.
• When people are afraid, they change their habits. They tend to stay at home more. When they go out they avoid “dangerous” activities like taking public transport, walking down a certain road, being near certain “types of people” etc.
• For people fearing victimisation at any time,
a journey outside the home, (or even within it) is
“like walking through a minefield”
14
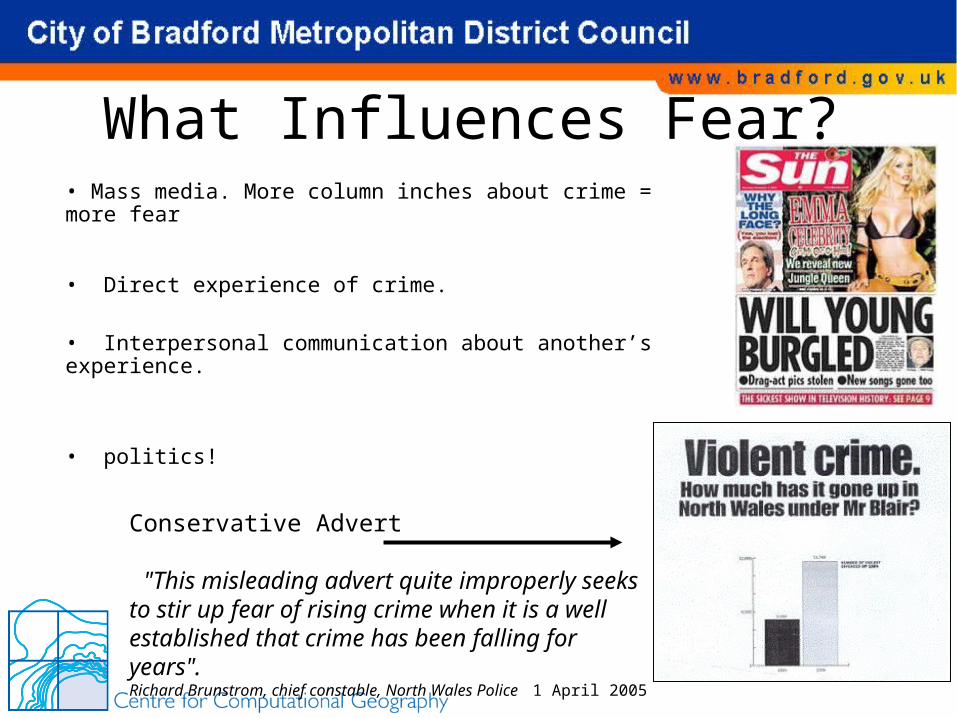
What Influences Fear?• Mass media. More column inches about crime = more fear
• Direct experience of crime.
• Interpersonal communication about another’s experience.
• politics!
Conservative Advert
"This misleading advert quite improperly seeks to stir up fear of rising crime when it is a well established that crime has been falling for years".Richard Brunstrom, chief constable, North Wales Police 1 April 2005
15
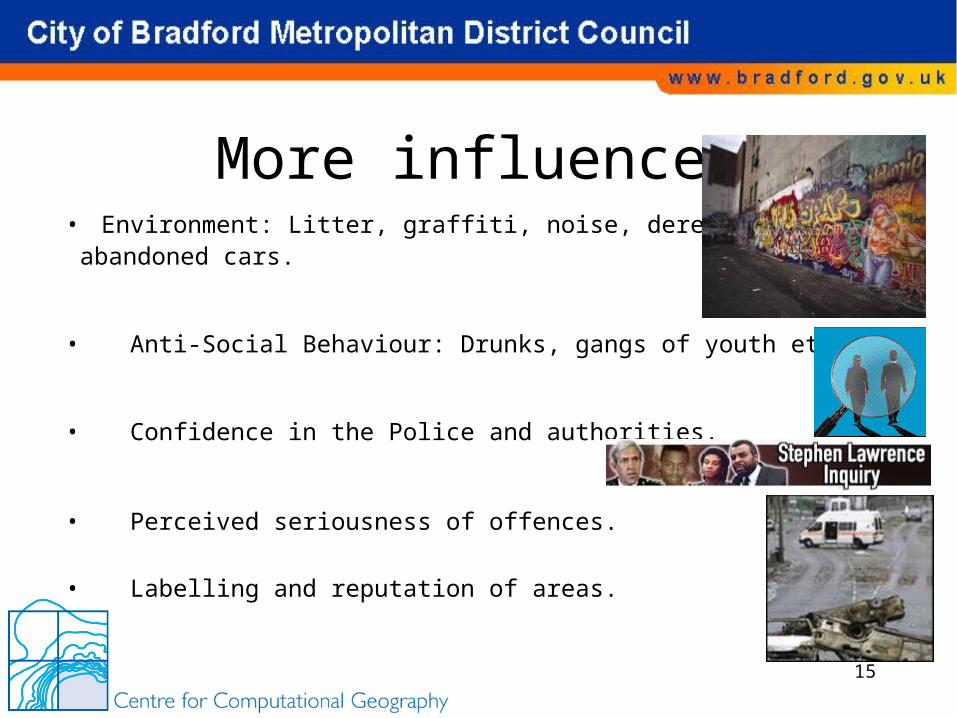
More influences• Environment: Litter, graffiti, noise, dereliction, abandoned cars.
• Anti-Social Behaviour: Drunks, gangs of youth etc.
• Confidence in the Police and authorities.
• Perceived seriousness of offences.
• Labelling and reputation of areas.
16
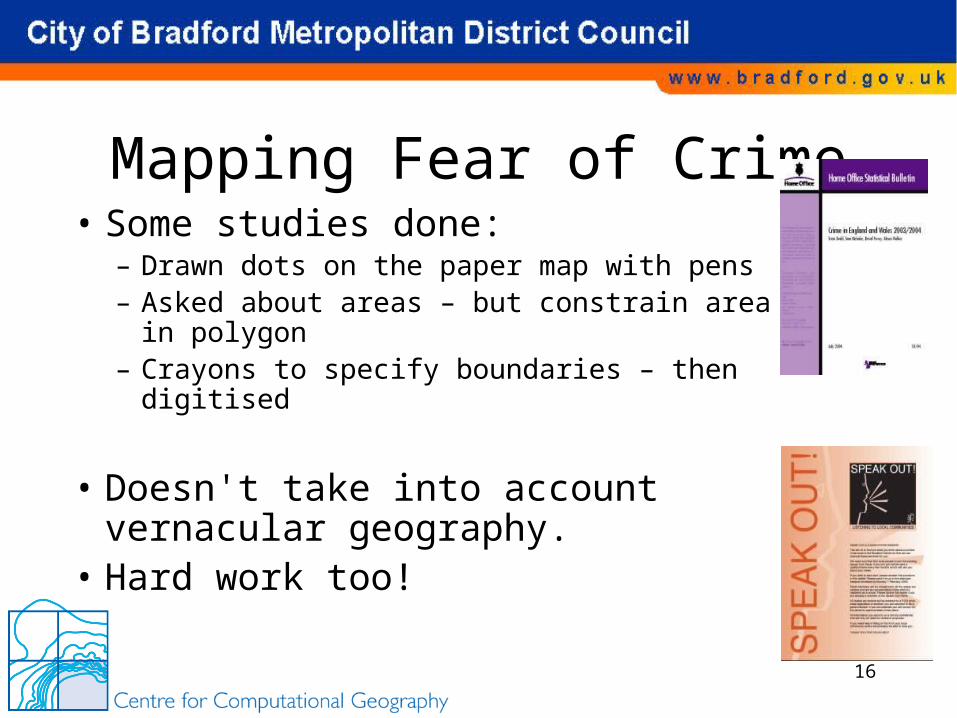
Mapping Fear of Crime• Some studies done:
– Drawn dots on the paper map with pens– Asked about areas – but constrain area in
polygon– Crayons to specify boundaries – then
digitised
• Doesn't take into account vernacular geography.
• Hard work too!
17
Capturing vernacular (fuzzy) geography
• How people relate to the world
• Fear of Crime
• Capturing vernacular geography
• Using fuzzy geography– Case study on West Yorkshire Town
18
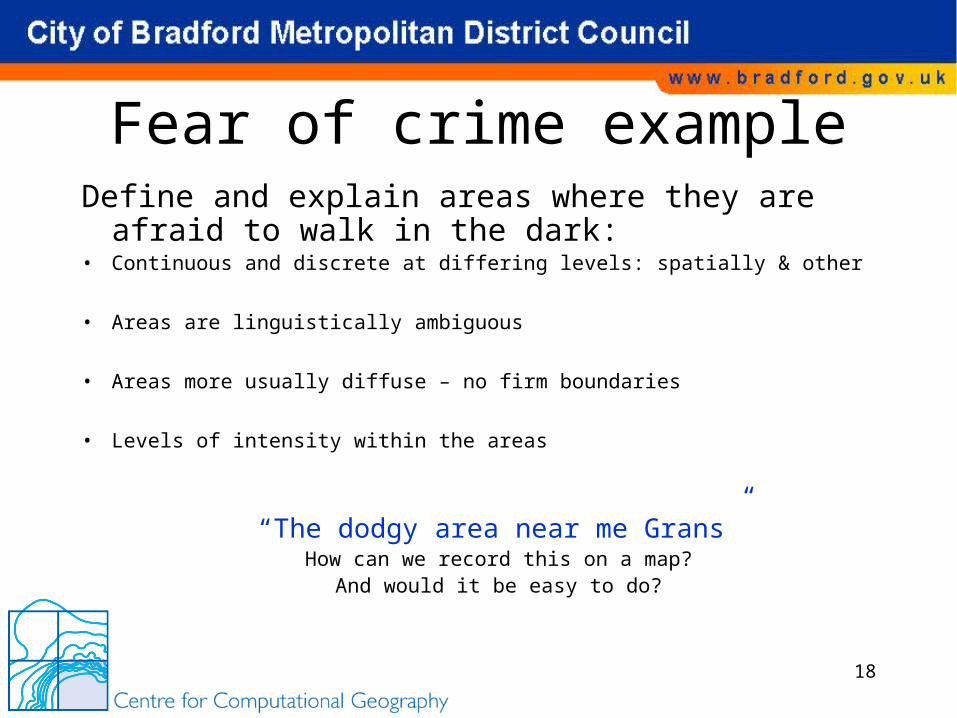
Fear of crime exampleDefine and explain areas where they are afraid to
walk in the dark:• Continuous and discrete at differing levels: spatially & other
• Areas are linguistically ambiguous
• Areas more usually diffuse – no firm boundaries
• Levels of intensity within the areas
“The dodgy area near me Grans”How can we record this on a map?
And would it be easy to do?
19
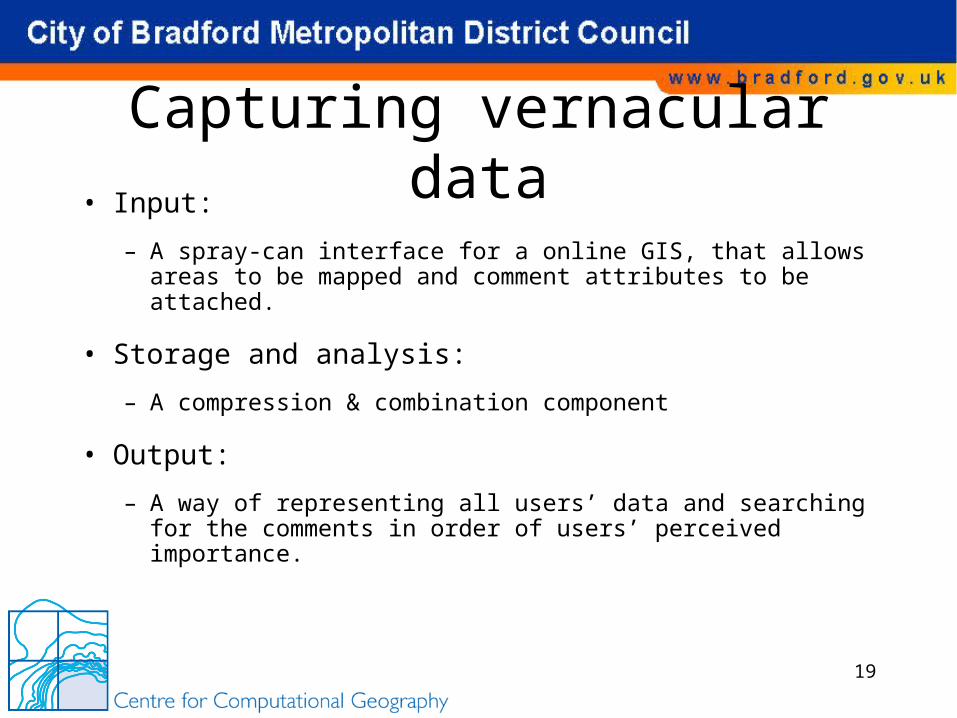
Capturing vernacular data• Input:
– A spray-can interface for a online GIS, that allows areas to be mapped and comment attributes to be attached.
• Storage and analysis:
– A compression & combination component
• Output:
– A way of representing all users’ data and searching for the comments in order of users’ perceived importance.
20
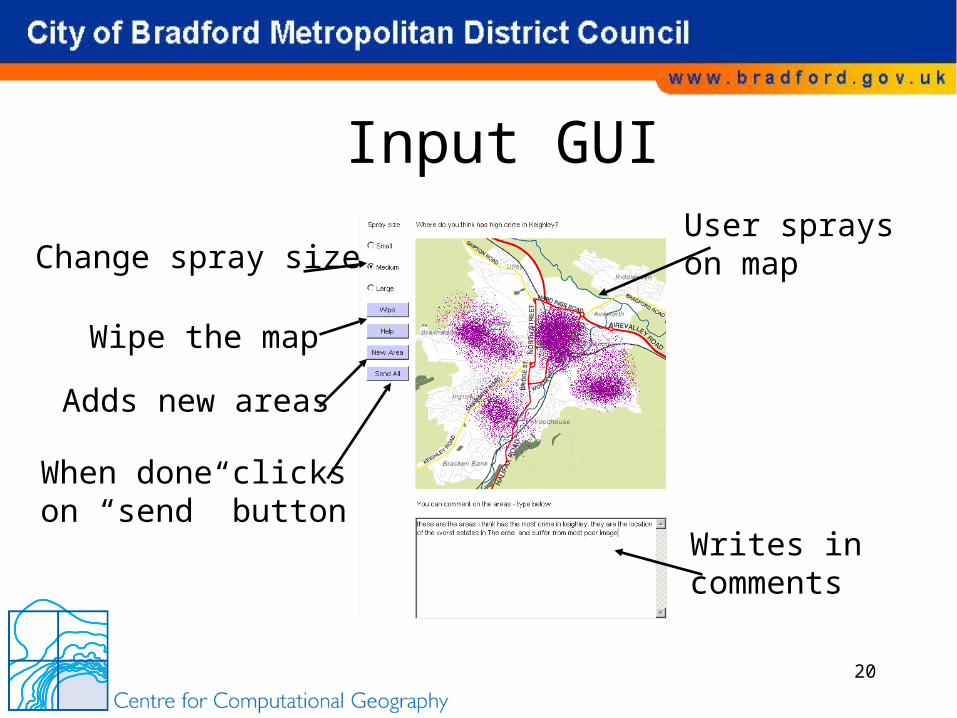
Input GUIUser sprayson mapChange spray size
Adds new areas
Wipe the map
Writes in comments
When done clicks on “send” button
21
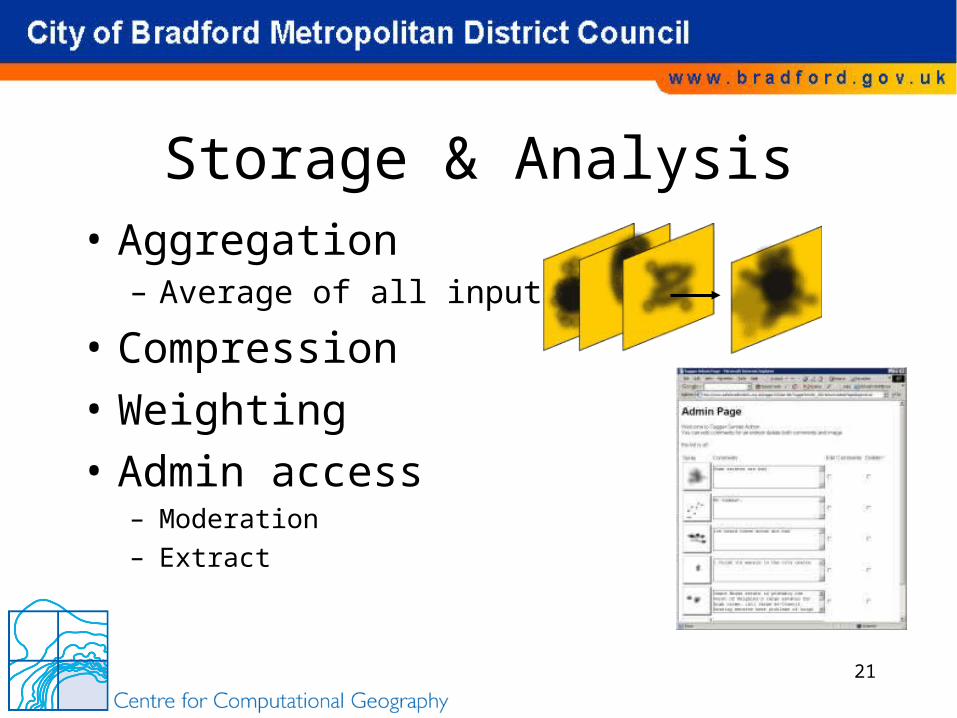
Storage & Analysis• Aggregation
– Average of all inputs
• Compression
• Weighting
• Admin access– Moderation– Extract
22
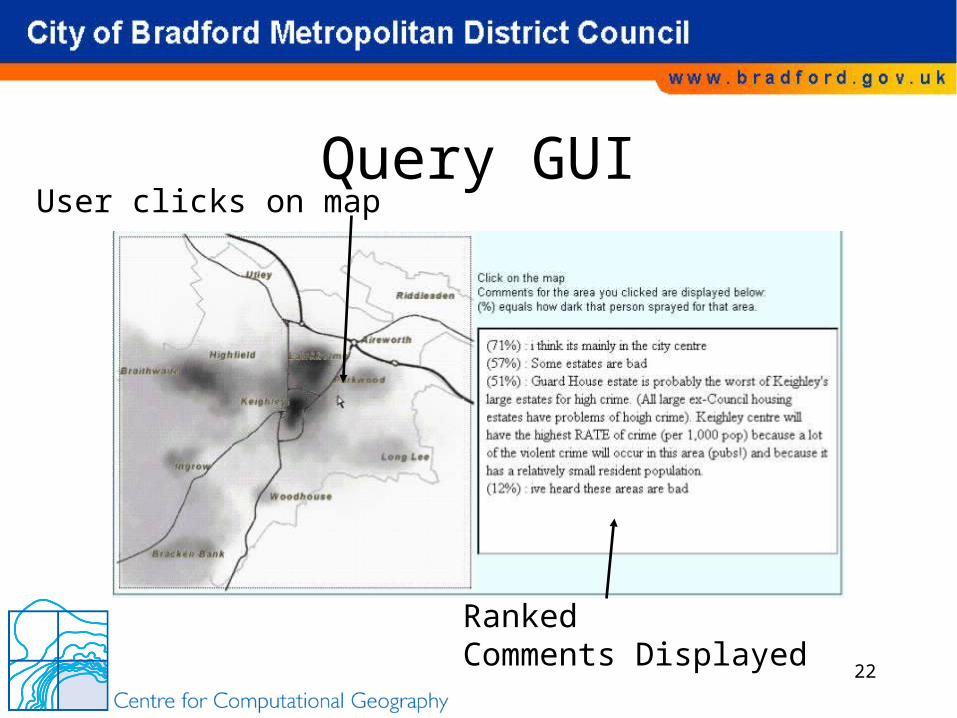
Query GUIUser clicks on map
RankedComments Displayed
23
System Demonstration• Crime Mapping Conference Demo
• Feel free to play with this!
http://tinyurl.com/4dvn8 My Admin: http://tinyurl.com/5qgww
24
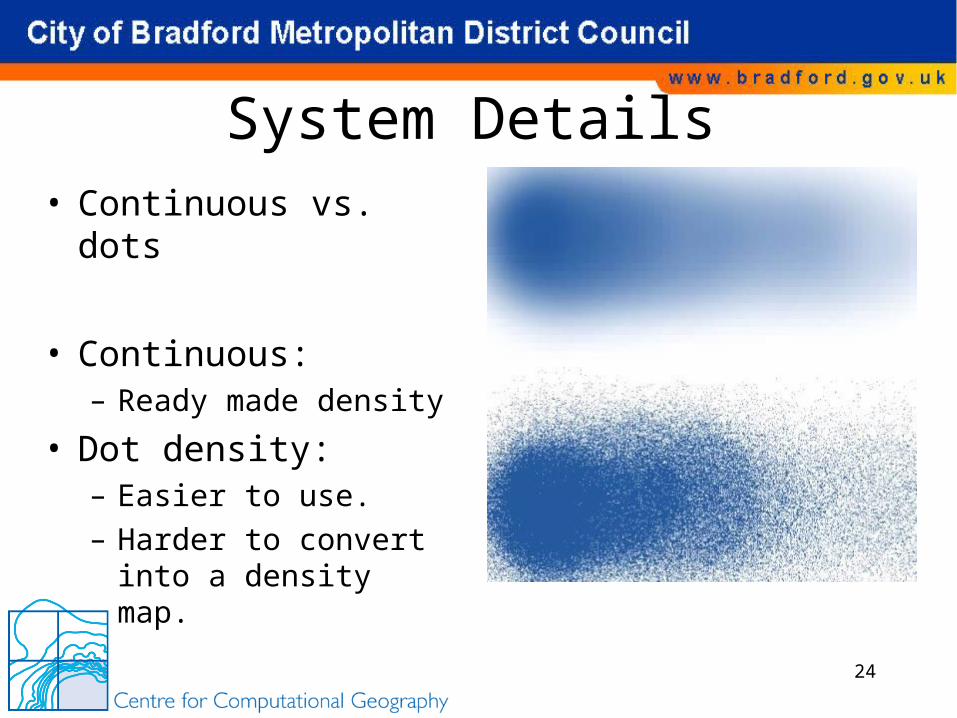
System Details• Continuous vs. dots
• Continuous:– Ready made density
• Dot density:– Easier to use.– Harder to convert into a
density map.
25
On the internet• File sizes – traffic & processing costs
– Could make smaller:• Clipping esp. if sprayed small area• Complex gradient mapping.• Vector paths
– Basically Raster is easier. • Raster layers with lots of variation• Raster is big!
– Solution : Compression
26
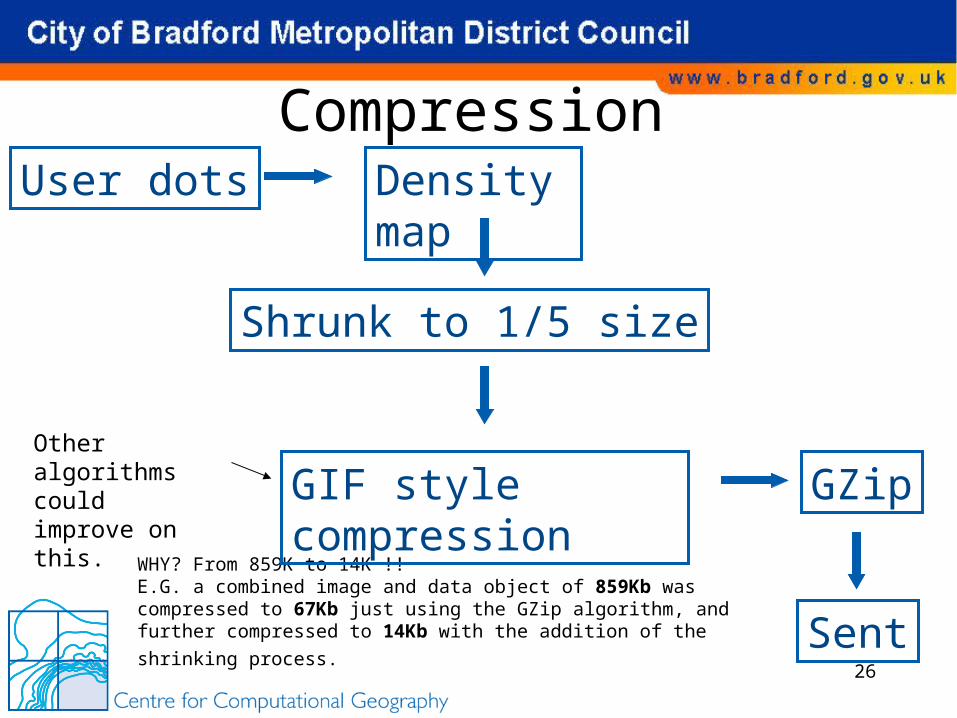
Compression
WHY? From 859K to 14K !!E.G. a combined image and data object of 859Kb was compressed to 67Kb just using the GZip algorithm, and further compressed to 14Kb with the
addition of the shrinking process.
Other algorithms could improve on this.
User dots Density map
Shrunk to 1/5 size
GIF style compression GZip
Sent
27
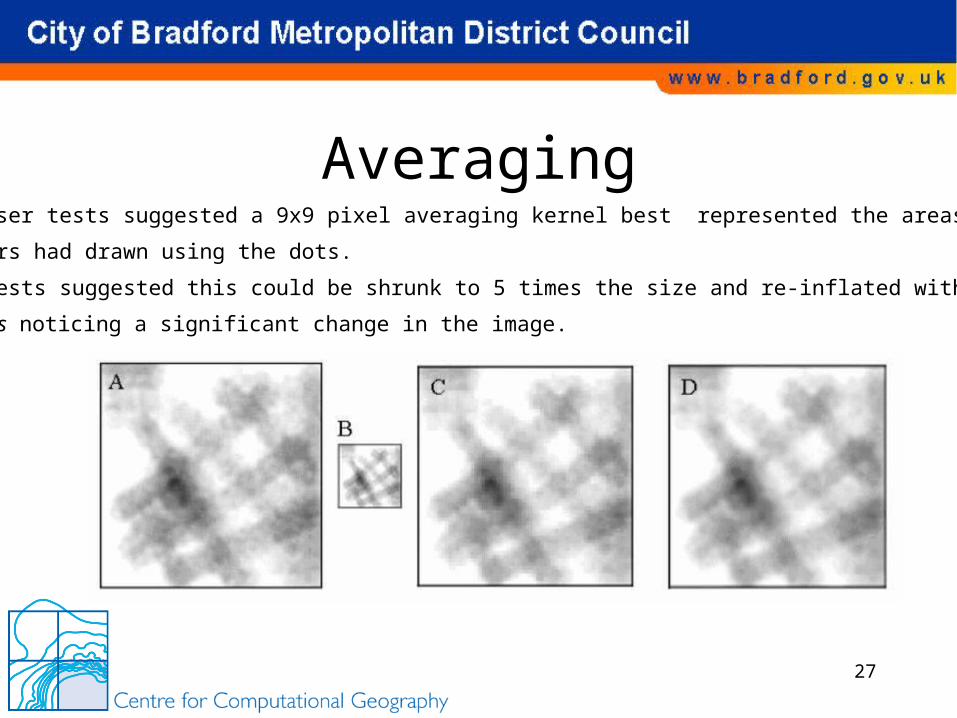
Averaging- User tests suggested a 9x9 pixel averaging kernel best represented the areas
users had drawn using the dots.
- Tests suggested this could be shrunk to 5 times the size and re-inflated without
users noticing a significant change in the image.
28
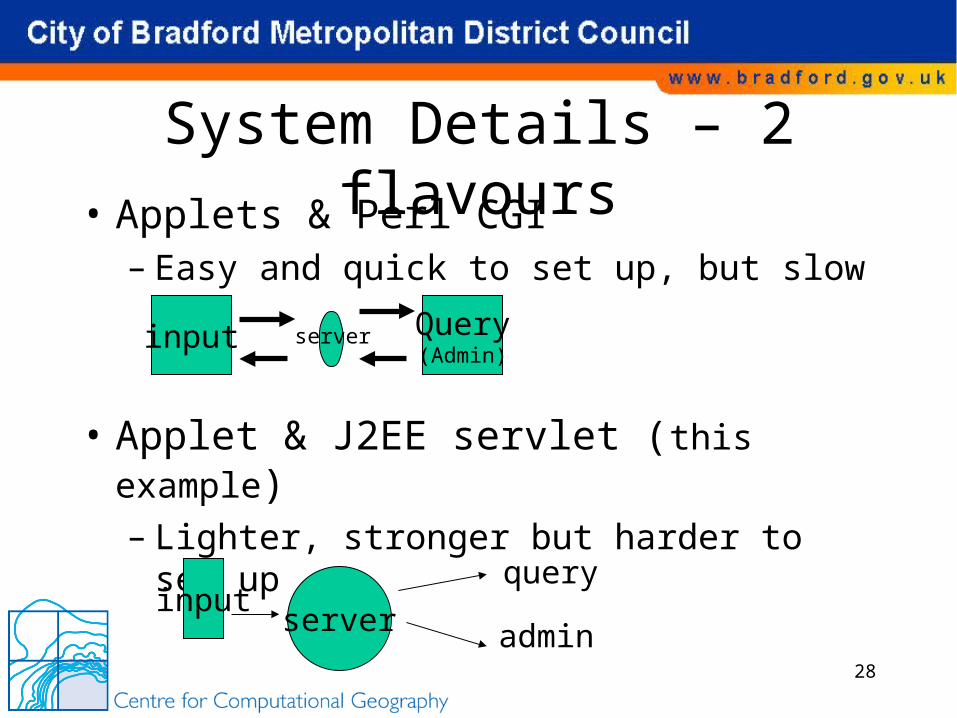
System Details – 2 flavours• Applets & Perl CGI
– Easy and quick to set up, but slow
• Applet & J2EE servlet (this example)– Lighter, stronger but harder to set up
inputserver
query
admin
input Query(Admin)
server
29
System Developments• Desktop GIS tool
• Zoom, pan tools
• Stronger admin / moderation
• Easier GIS export
30
Case Study• How people relate to the world
• Fear of Crime
• Capturing fuzzy geography
• Using fuzzy geography– Case study on West Yorkshire Town
31
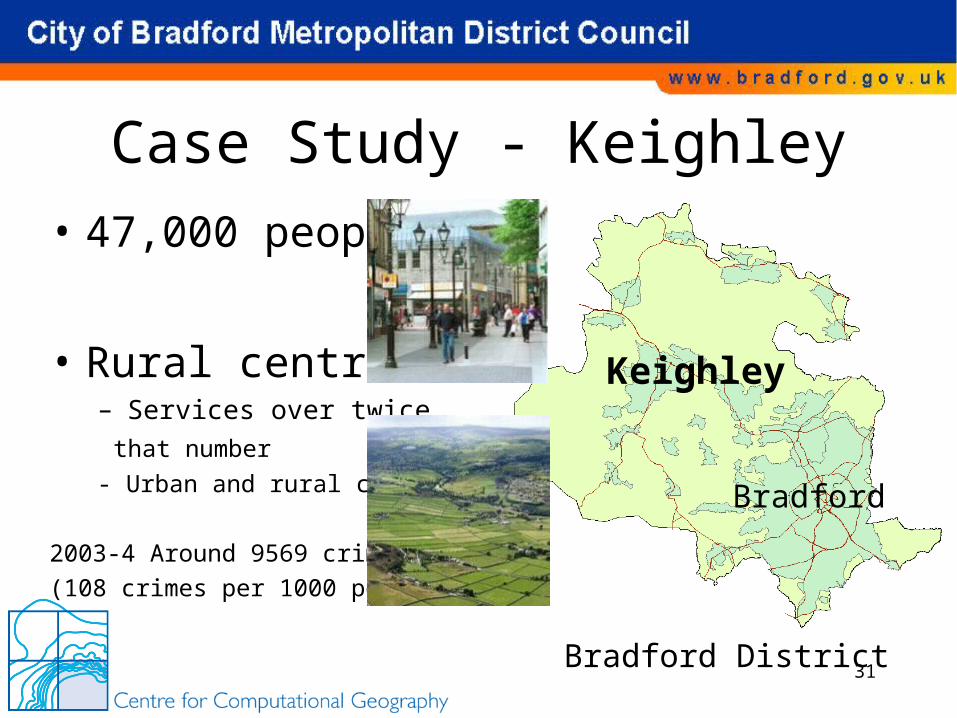
Case Study - Keighley
• 47,000 people
• Rural centre:– Services over twice
that number
- Urban and rural crime
2003-4 Around 9569 crimes
(108 crimes per 1000 pop)
Keighley
Bradford
Bradford District
32
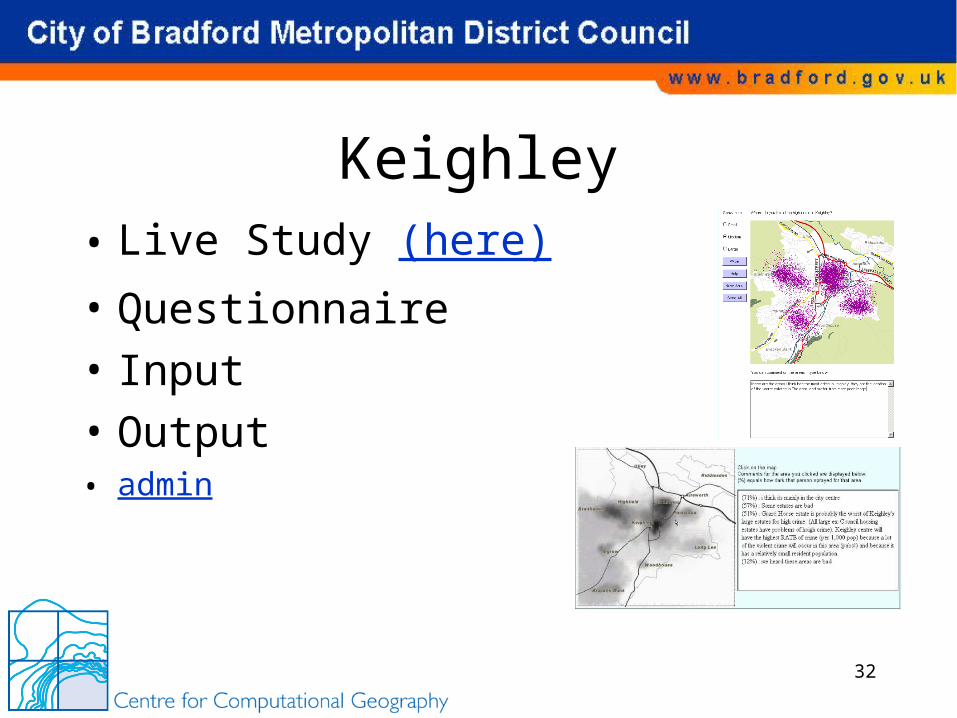
Keighley• Live Study (here)
• Questionnaire
• Input
• Output• admin
33
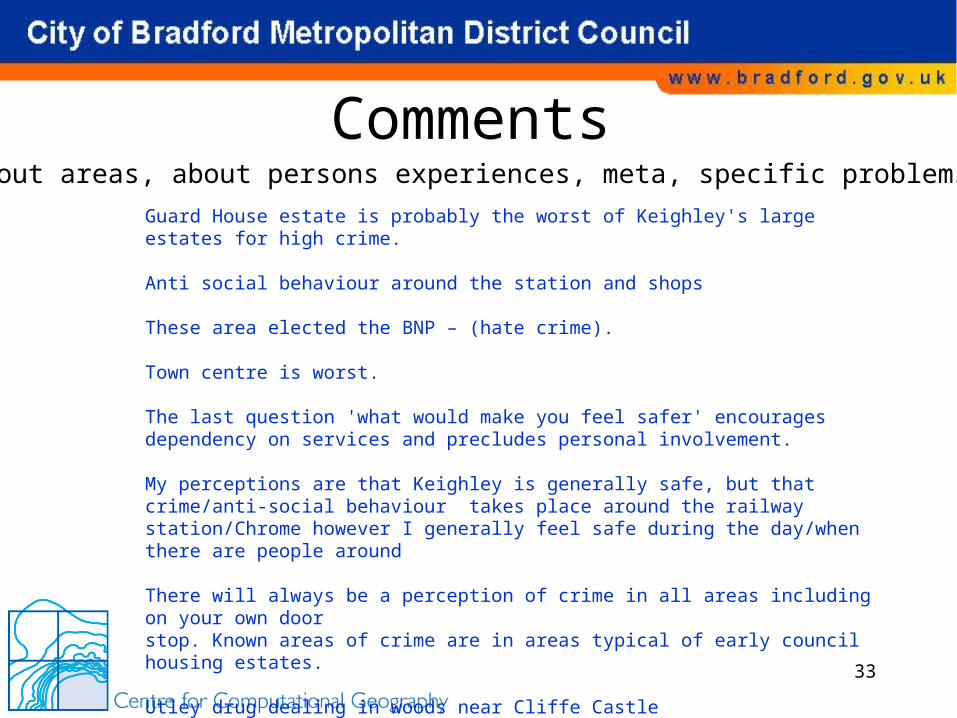
Comments
Guard House estate is probably the worst of Keighley's large estates for high crime. Anti social behaviour around the station and shops
These area elected the BNP – (hate crime). Town centre is worst.
The last question 'what would make you feel safer' encourages dependency on services and precludes personal involvement.
My perceptions are that Keighley is generally safe, but that crime/anti-social behaviour takes place around the railway station/Chrome however I generally feel safe during the day/when there are people around There will always be a perception of crime in all areas including on your own door stop. Known areas of crime are in areas typical of early council housing estates. Utley drug dealing in woods near Cliffe Castle
About areas, about persons experiences, meta, specific problems
34
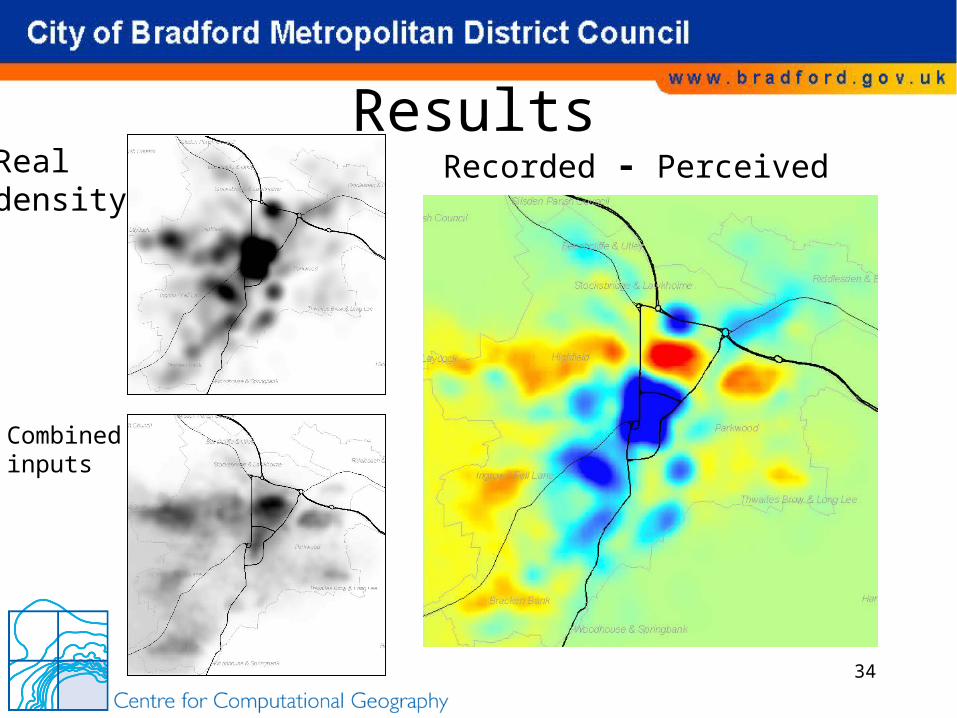
ResultsReal density
Combinedinputs
Recorded - Perceived
35
What the results tell us• “toy” analysis?• For us:
– “where do people have mis-perceptions as to the level of risk from crime?” (If areas don’t match)
– “what level of crime do people notice as high?” If areas match)
– What areas (don’t) have a bad reputation?
• For users:– “How scared of crime are my neighbours”– “Does anyone else feel the same way as me”
36
Other Uses• Fuzzy Logic
• Demographics
• Geodemographics for highlighted areas
• Questionnaires
• Familiarity
• Analysis of comments
37
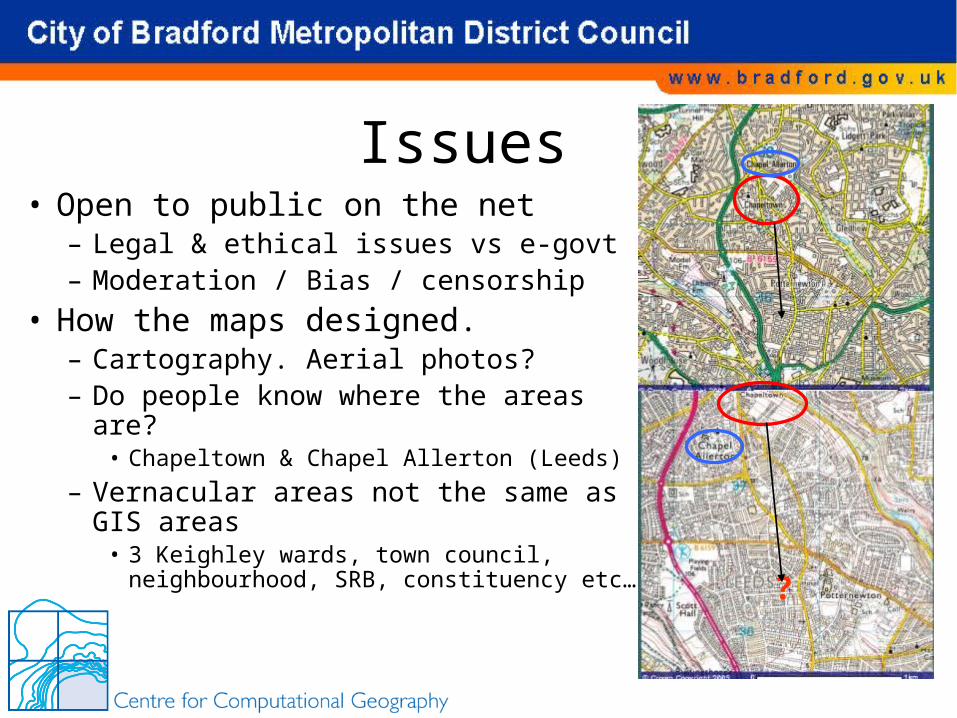
Issues• Open to public on the net
– Legal & ethical issues vs e-govt– Moderation / Bias / censorship
• How the maps designed.– Cartography. Aerial photos?– Do people know where the areas are?
• Chapeltown & Chapel Allerton (Leeds)
– Vernacular areas not the same as GIS areas
• 3 Keighley wards, town council, neighbourhood, SRB, constituency etc… ?
38
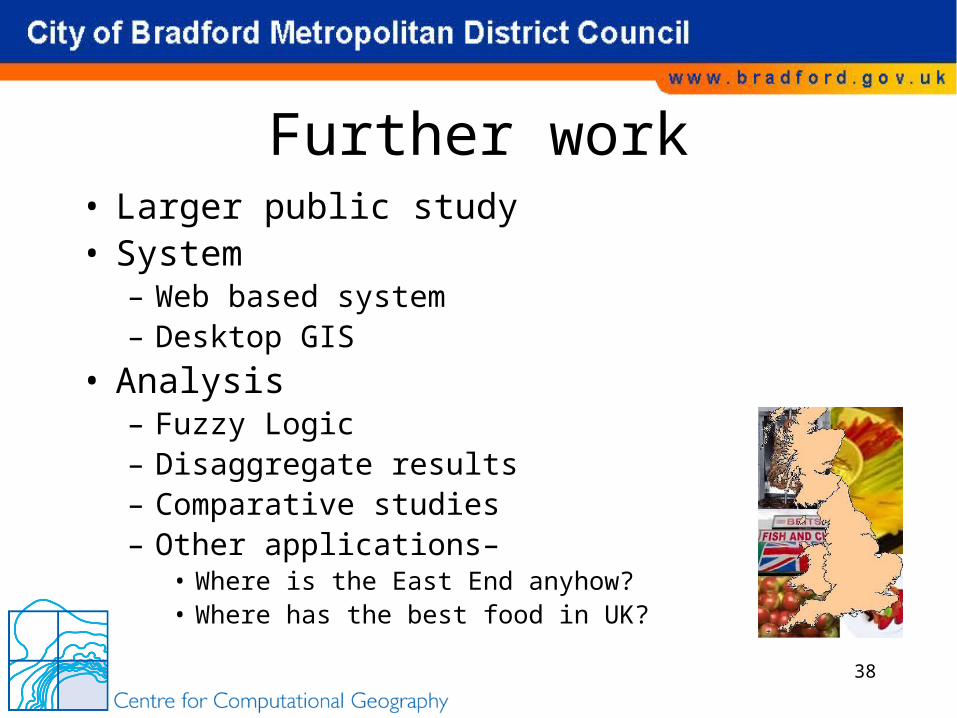
Further work• Larger public study• System
– Web based system– Desktop GIS
• Analysis– Fuzzy Logic– Disaggregate results– Comparative studies– Other applications–
• Where is the East End anyhow?• Where has the best food in UK?
39
Summary• How people refer to areas
• Vernacular / fuzzy geography
• Perceptions of crime
• How we can capture it on a map
• What it can tell us
Now we can map
“the dodgy area near me grans”
40
Tagger
http://www.ccg.leeds.ac.uk/software/tagger/
Andrew Evans [email protected]
Play http://tinyurl.com/4dvn8