Embed Size (px)
Citation preview
1
Management Directive 715 Broad Based Deficiencies
and Recommended Actions
(Bureau Name)
This template is for your use to create your bureau State of the Agency briefing. This template is not all inclusive and can be altered/tailored to your bureau specific needs. Delete this box when editing
2
General Workforce Demographics
-3-
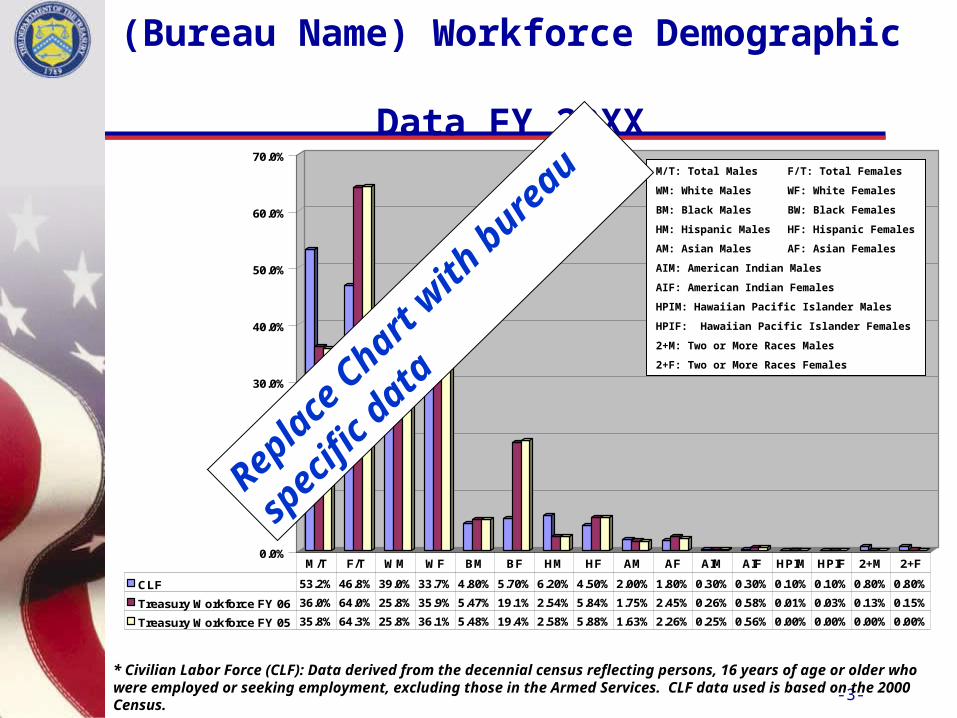
(Bureau Name) Workforce Demographic Data FY 20XX
* Civilian Labor Force (CLF): Data derived from the decennial census reflecting persons, 16 years of age or older who were employed or seeking employment, excluding those in the Armed Services. CLF data used is based on the 2000 Census.
0.0%
10.0%
20.0%
30.0%
40.0%
50.0%
60.0%
70.0%
CLF 53.2% 46.8% 39.0% 33.7% 4.80% 5.70% 6.20% 4.50% 2.00% 1.80% 0.30% 0.30% 0.10% 0.10% 0.80% 0.80%
Treasury Workforce FY 06 36.0% 64.0% 25.8% 35.9% 5.47% 19.1% 2.54% 5.84% 1.75% 2.45% 0.26% 0.58% 0.01% 0.03% 0.13% 0.15%
Treasury Workforce FY 05 35.8% 64.3% 25.8% 36.1% 5.48% 19.4% 2.58% 5.88% 1.63% 2.26% 0.25% 0.56% 0.00% 0.00% 0.00% 0.00%
M/T F/T WM WF BM BF HM HF AM AF AIM AIF HPIM HPIF 2+M 2+F
M/T: Total Males F/T: Total Females
WM: White Males WF: White Females
BM: Black Males BW: Black Females
HM: Hispanic Males HF: Hispanic Females
AM: Asian Males AF: Asian Females
AIM: American Indian Males
AIF: American Indian Females
HPIM: Hawaiian Pacific Islander Males
HPIF: Hawaiian Pacific Islander Females
2+M: Two or More Races Males
2+F: Two or More Races Females
Repla
ce C
hart w
ith b
ureau
spec
ific
data
-4-
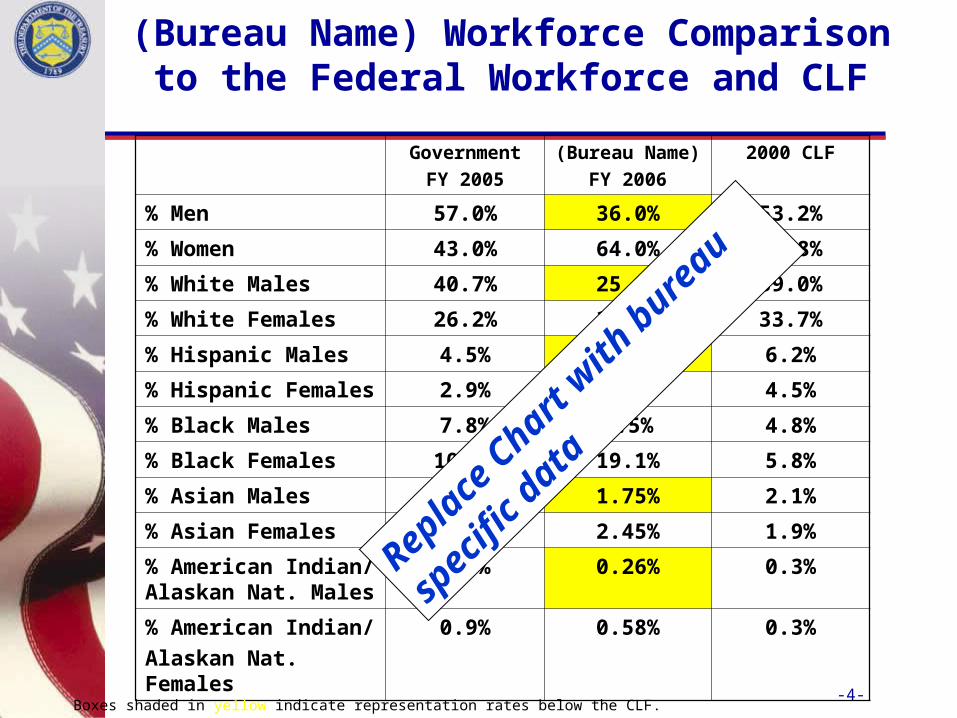
(Bureau Name) Workforce Comparison to the Federal Workforce and CLF
Government
FY 2005
(Bureau Name)
FY 2006
2000 CLF
% Men 57.0% 36.0% 53.2%
% Women 43.0% 64.0% 46.8%
% White Males 40.7% 25.8% 39.0%
% White Females 26.2% 35.9% 33.7%
% Hispanic Males 4.5% 2.5% 6.2%
% Hispanic Females 2.9% 5.8% 4.5%
% Black Males 7.8% 5.5% 4.8%
% Black Females 10.4% 19.1% 5.8%
% Asian Males 3.3% 1.75% 2.1%
% Asian Females 2.5% 2.45% 1.9%
% American Indian/ Alaskan Nat. Males
0.7% 0.26% 0.3%
% American Indian/
Alaskan Nat. Females
0.9% 0.58% 0.3%
Boxes shaded in yellow indicate representation rates below the CLF.
Repla
ce C
hart w
ith b
ureau
spec
ific
data
5
Trigger or Deficiency:Example:
Potential Glass Ceiling for Females and Minorities
-6-
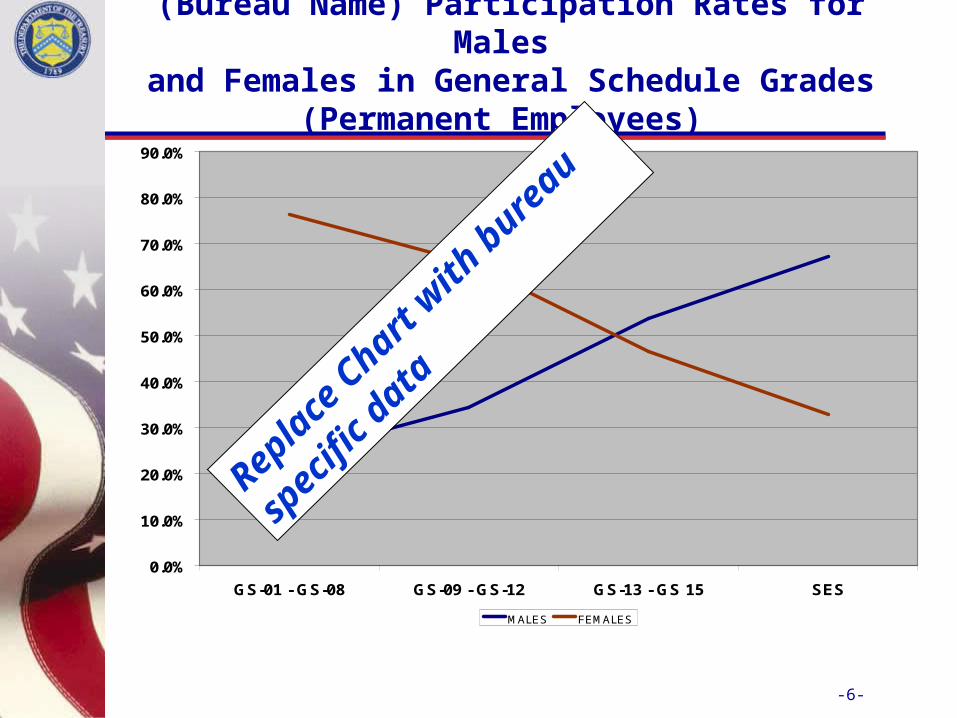
(Bureau Name) Participation Rates for Males and Females in General Schedule Grades
(Permanent Employees)
0.0%
10.0%
20.0%
30.0%
40.0%
50.0%
60.0%
70.0%
80.0%
90.0%
GS-01 - GS-08 GS-09 - GS-12 GS-13 - GS 15 SES
MALES FEMALES
Repla
ce C
hart w
ith b
ureau
spec
ific
data
-7-
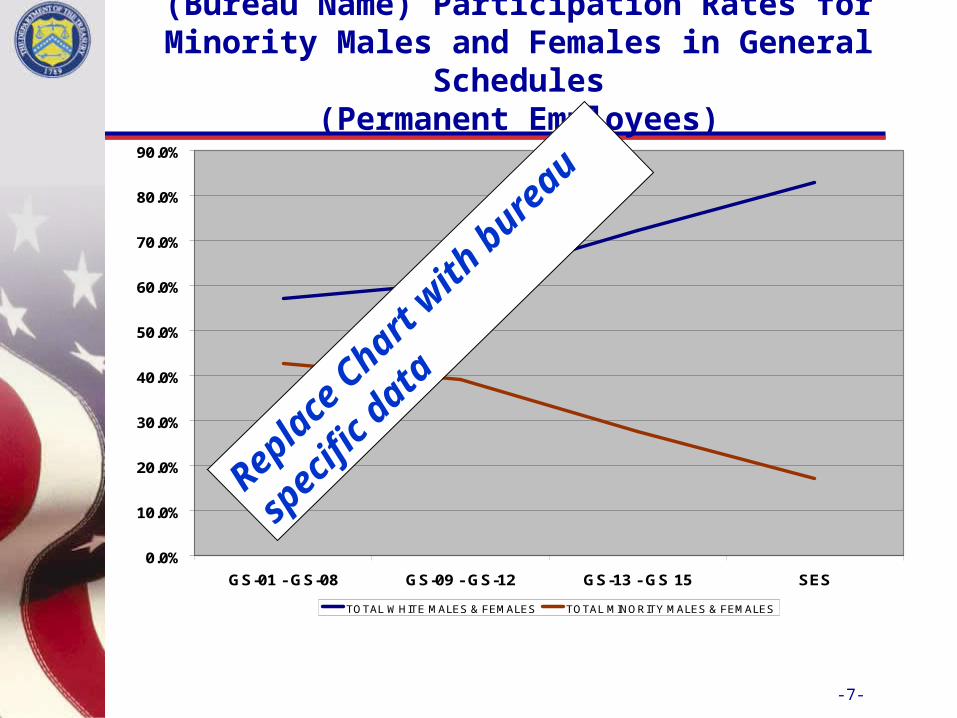
(Bureau Name) Participation Rates for Minority Males and Females in General Schedules
(Permanent Employees)
0.0%
10.0%
20.0%
30.0%
40.0%
50.0%
60.0%
70.0%
80.0%
90.0%
GS-01 - GS-08 GS-09 - GS-12 GS-13 - GS 15 SES
TOTAL WHITE MALES & FEMALES TOTAL MINORITY MALES & FEMALES
Repla
ce C
hart w
ith b
ureau
spec
ific
data
-8-
Identified Deficiency/Trigger – Example: Potential Glass Ceiling
• There appears to be a “glass ceiling” for females and minorities at the GS xx-xx pay grades.
• Unclear at this time if problem is in recruitment of (or) career development.
Repla
ce w
ith b
ureau
spec
ific
issu
es
-9-
• Recommendations– State your bureau specific recommendations
here on how to address the trigger/deficiency.
Develop… Provide… Identify… Establish…
Identified Deficiency/Trigger – Potential Glass Ceiling
Repla
ce w
ith b
ureau
spec
ific
issu
es
10
Targeted Disability Participation Rates
-11-
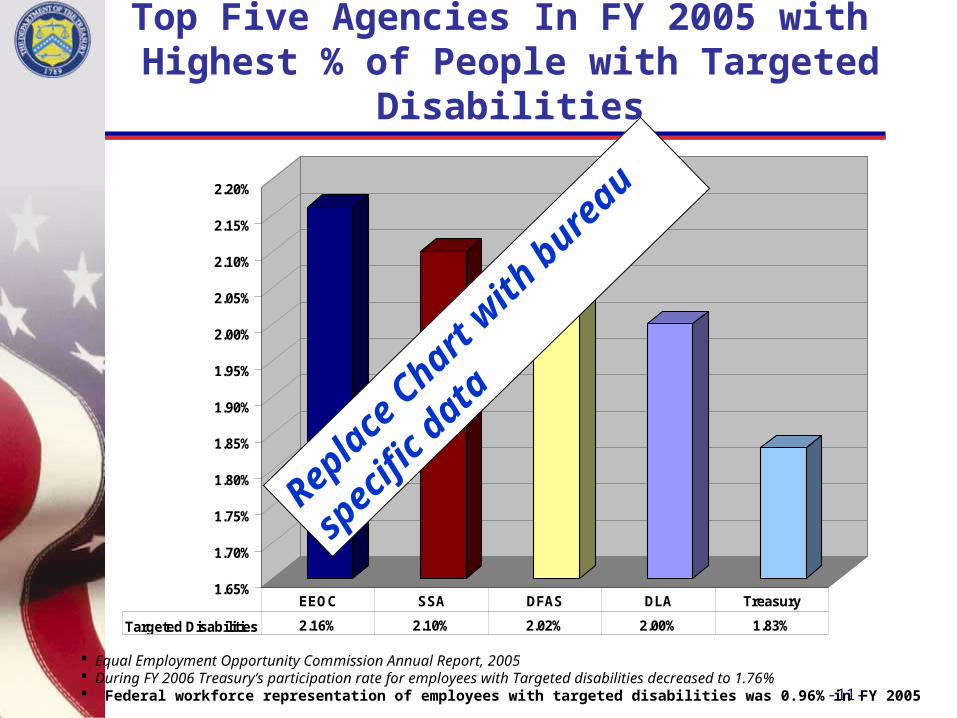
Top Five Agencies In FY 2005 with Highest % of People with Targeted
Disabilities
Equal Employment Opportunity Commission Annual Report, 2005 During FY 2006 Treasury’s participation rate for employees with Targeted disabilities decreased to 1.76% Federal workforce representation of employees with targeted disabilities was 0.96% in FY 2005
1.65%
1.70%
1.75%
1.80%
1.85%
1.90%
1.95%
2.00%
2.05%
2.10%
2.15%
2.20%
Targeted Disabilities 2.16% 2.10% 2.02% 2.00% 1.83%
EEOC SSA DFAS DLA Treasury
Repla
ce C
hart w
ith b
ureau
spec
ific
data
-12-
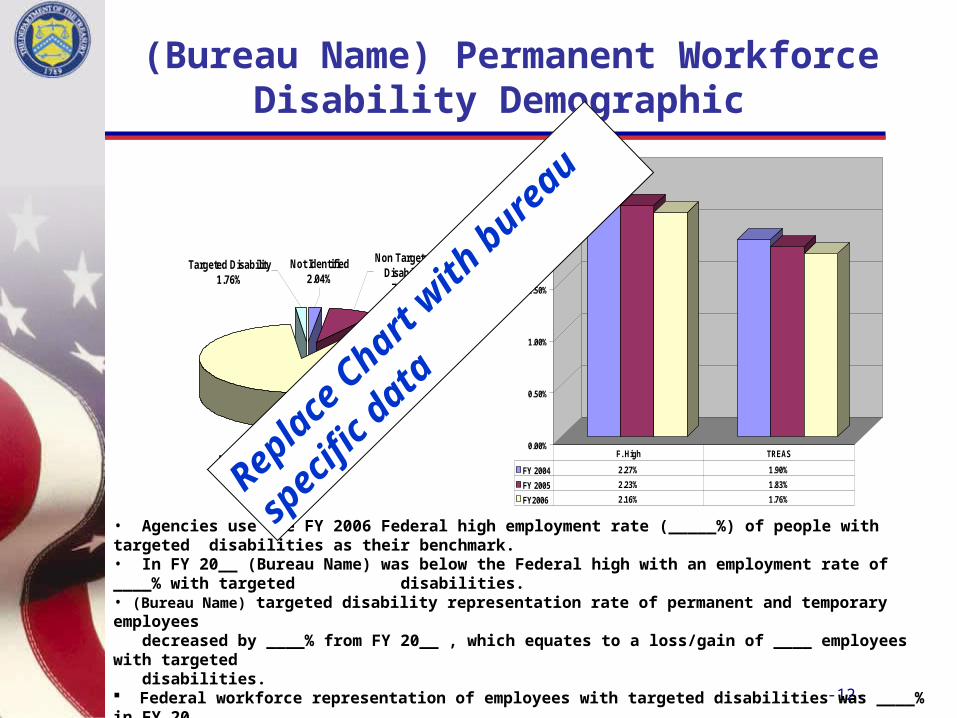
(Bureau Name) Permanent WorkforceDisability Demographic
Targeted Disability1.76%
Not Identified2.04%
Non Targeted Disability
7.65%
No Disability88.55%
• Agencies use the FY 2006 Federal high employment rate (_____%) of people with targeted disabilities as their benchmark. • In FY 20__ (Bureau Name) was below the Federal high with an employment rate of ____% with targeted
disabilities. • (Bureau Name) targeted disability representation rate of permanent and temporary employees decreased by ____% from FY 20__ , which equates to a loss/gain of ____ employees with targeted disabilities. Federal workforce representation of employees with targeted disabilities was ____% in FY 20___• Targeted disabilities includes deafness, blindness, missing limbs, partial paralysis, convulsive disorder, mental retardation, mental illness, and distortion of limb/spine.
0.00%
0.50%
1.00%
1.50%
2.00%
2.50%
FY 2004 2.27% 1.90%
FY 2005 2.23% 1.83%
FY2006 2.16% 1.76%
F. High TREAS
Repla
ce C
hart w
ith b
ureau
spec
ific
data
-13-
• Recommendations– State your bureau specific recommendations
here on how to address the trigger/deficiency.
Develop… Provide… Identify… Establish…
Identified Deficiency/Trigger – Low Representation –Targeted Disabilities
Repla
ce w
ith b
ureau
spec
ific
issu
es
14
Treasury Employee Separation Rates
-15-
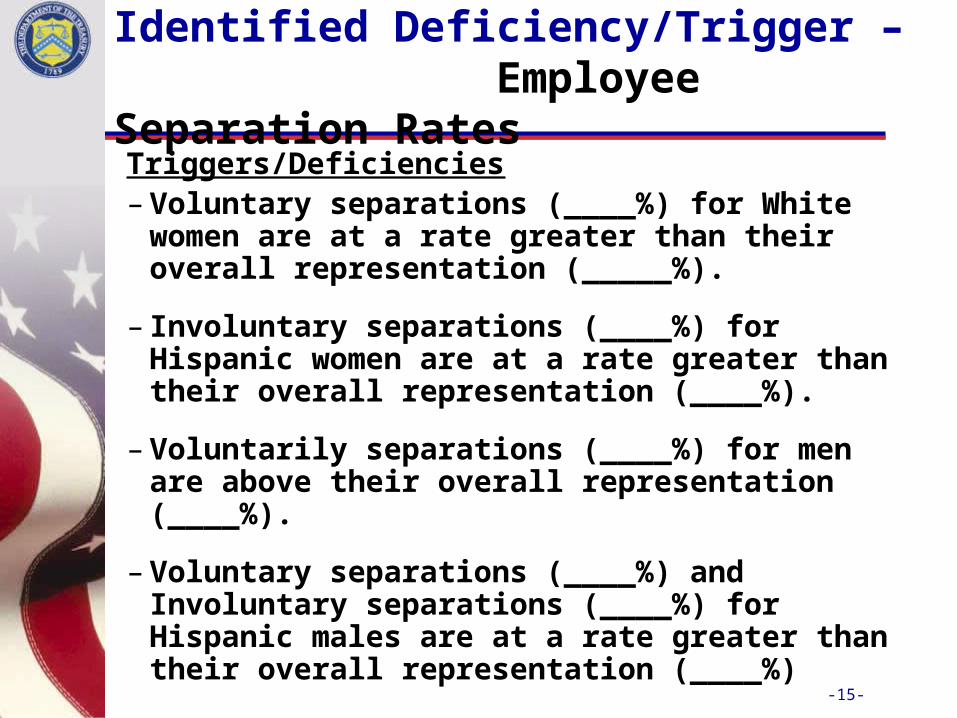
Triggers/Deficiencies– Voluntary separations (____%) for White women
are at a rate greater than their overall representation (_____%).
– Involuntary separations (____%) for Hispanic women are at a rate greater than their overall representation (____%).
– Voluntarily separations (____%) for men are above their overall representation (____%).
– Voluntary separations (____%) and Involuntary separations (____%) for Hispanic males are at a rate greater than their overall representation (____%)
Identified Deficiency/Trigger – Employee Separation Rates
-16-
Recommendations:– State your bureau specific recommendations here
on how to address the trigger/deficiency. Develop… Provide… Identify… Establish…
Identified Deficiency/Trigger – Employee Separation Rates
Repla
ce w
ith b
ureau
spec
ific
issu
es

17
Alternative Dispute Resolution (ADR)
-18-
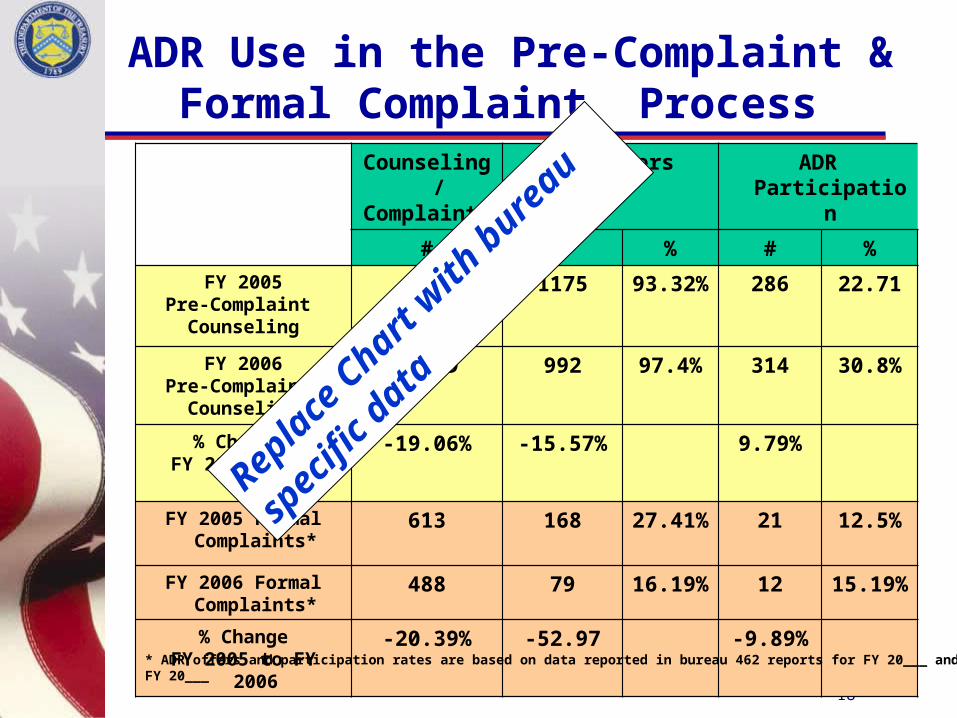
ADR Use in the Pre-Complaint & Formal Complaint Process
Counseling/Complaints
ADR Offers ADR Participation
# # % # %
FY 2005Pre-Complaint
Counseling
1259 1175 93.32% 286 22.71
FY 2006Pre-Complaint
Counseling
1,019 992 97.4% 314 30.8%
% Change FY 2005 to FY 2006
-19.06% -15.57% 9.79%
FY 2005 Formal Complaints*
613 168 27.41% 21 12.5%
FY 2006 Formal Complaints*
488 79 16.19% 12 15.19%
% ChangeFY 2005 to FY 2006
-20.39% -52.97 -9.89%
* ADR offers and participation rates are based on data reported in bureau 462 reports for FY 20___ and FY 20___
Repla
ce C
hart w
ith b
ureau
spec
ific
data
-19-
• ADR participation rates in the informal process, has increased. However, the majority of the employees are declining ADR.
• There is a decrease in ADR participation during the formal complaint process.
Identified Deficiency/Trigger – Alternative Dispute Resolution (ADR)
Repla
ce w
ith b
ureau
spec
ific
issu
es
-20-
• Recommendations ––State your bureau specific
recommendations here on how to address the trigger/deficiency. Develop… Provide… Identify… Establish…
Identified Deficiency/Trigger – Alternative Dispute Resolution (ADR)
Repla
ce w
ith b
ureau
spec
ific
issu
es
21
Complaint Data
-22-
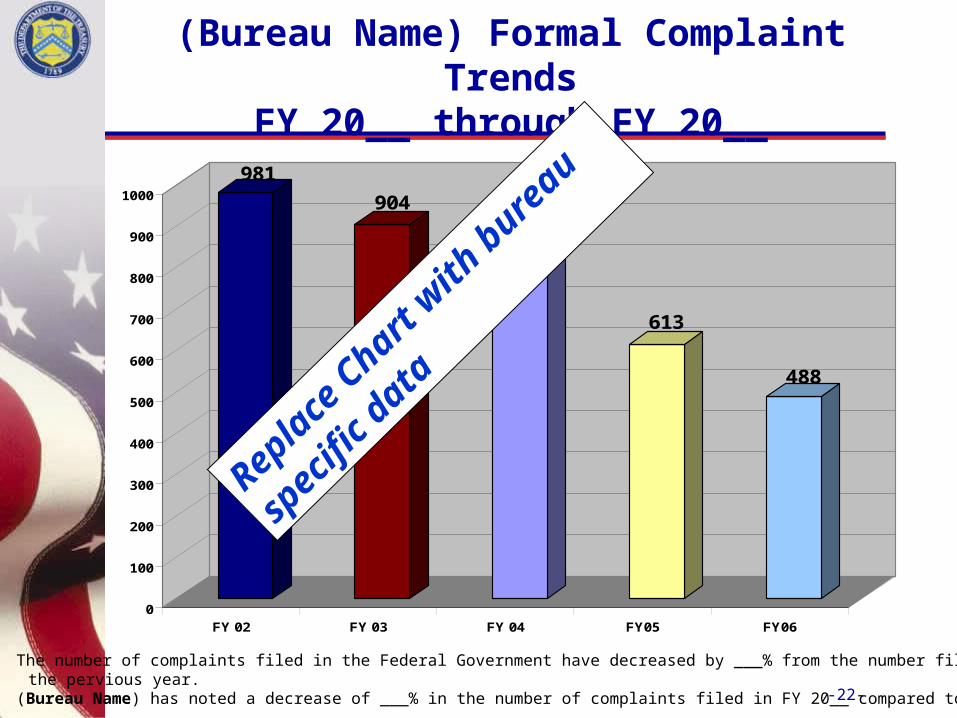
(Bureau Name) Formal Complaint TrendsFY 20__ through FY 20__
The number of complaints filed in the Federal Government have decreased by ___% from the number filed from the pervious year. (Bureau Name) has noted a decrease of ___% in the number of complaints filed in FY 20__ compared to FY 20__.
981
904
804
613
488
0
100
200
300
400
500
600
700
800
900
1000
FY 02 FY 03 FY 04 FY05 FY06
Repla
ce C
hart w
ith b
ureau
spec
ific
data
-23-
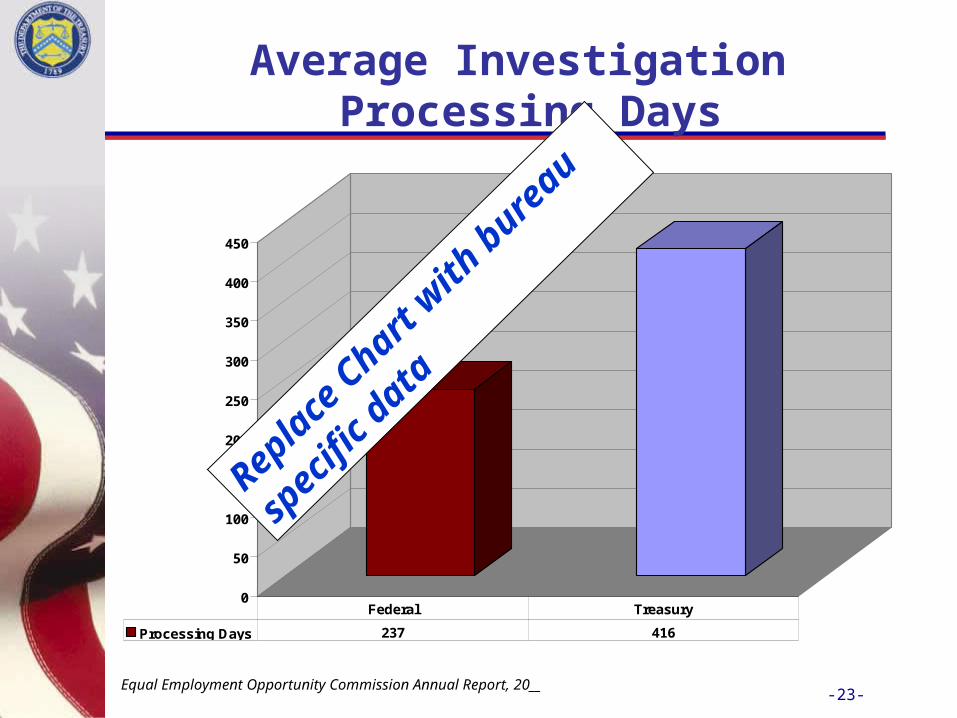
Average Investigation Processing Days
Equal Employment Opportunity Commission Annual Report, 20__
0
50
100
150
200
250
300
350
400
450
Processing Days 237 416
Federal Treasury
Repla
ce C
hart w
ith b
ureau
spec
ific
data
-24-
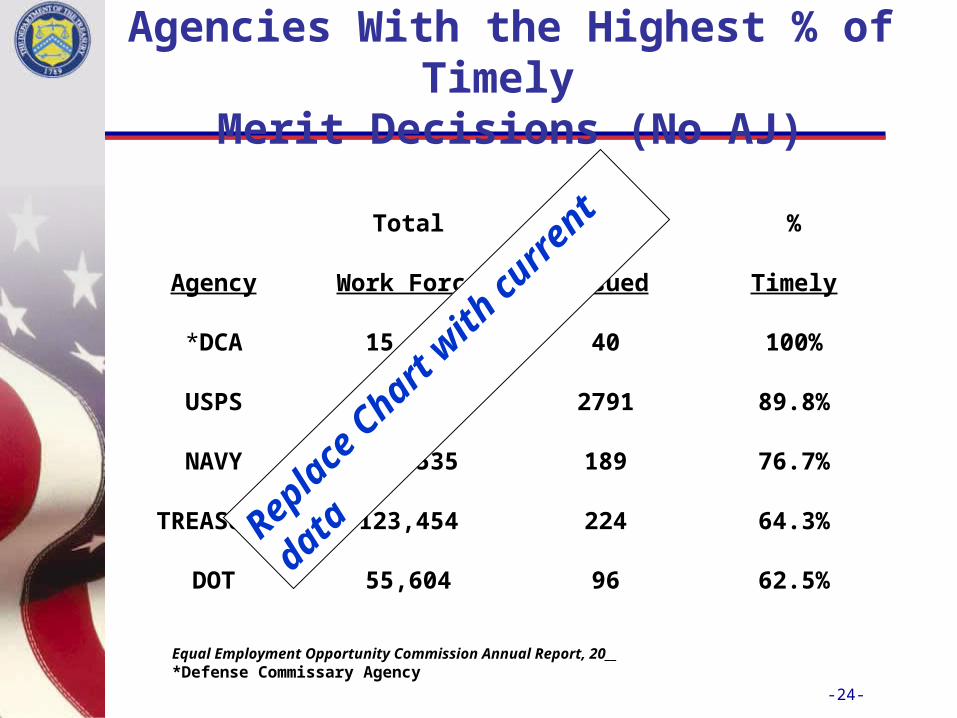
Agencies With the Highest % of Timely
Merit Decisions (No AJ)
Total Number %
Agency Work Force Issued Timely
*DCA 15,923 40 100%
USPS 800,742 2791 89.8%
NAVY 187,535 189 76.7%
TREASURY 123,454 224 64.3%
DOT 55,604 96 62.5%
Equal Employment Opportunity Commission Annual Report, 20__ *Defense Commissary Agency
Repla
ce C
hart w
ith c
urrent
data
-25-
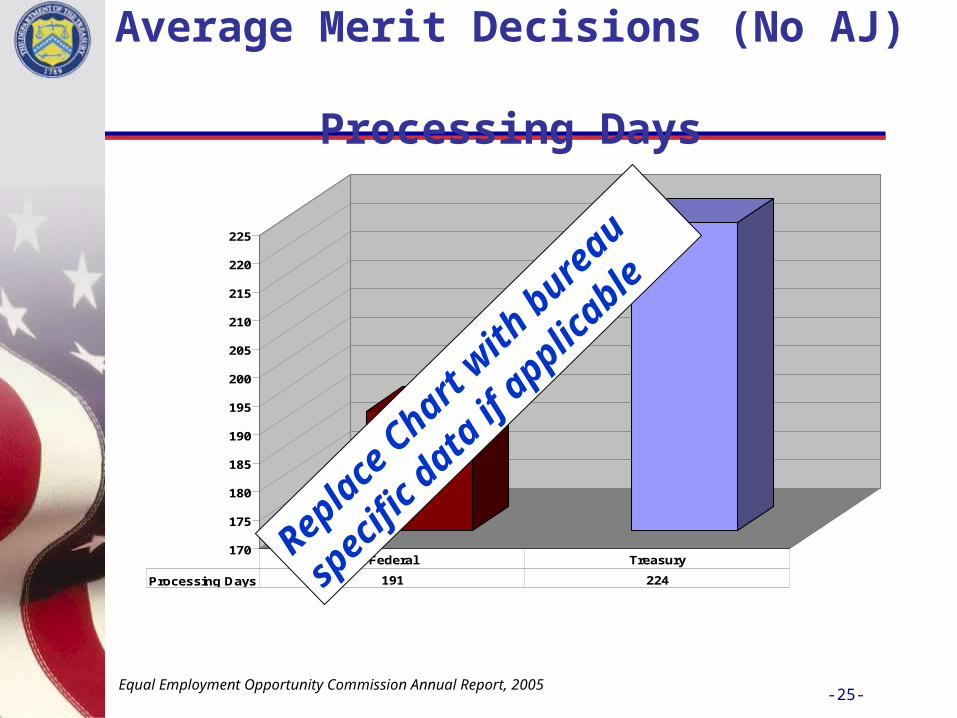
Average Merit Decisions (No AJ) Processing Days
Equal Employment Opportunity Commission Annual Report, 2005
170
175
180
185
190
195
200
205
210
215
220
225
Processing Days 191 224
Federal TreasuryRepla
ce C
hart w
ith b
ureau
spec
ific
data
if ap
plicab
le
-26-
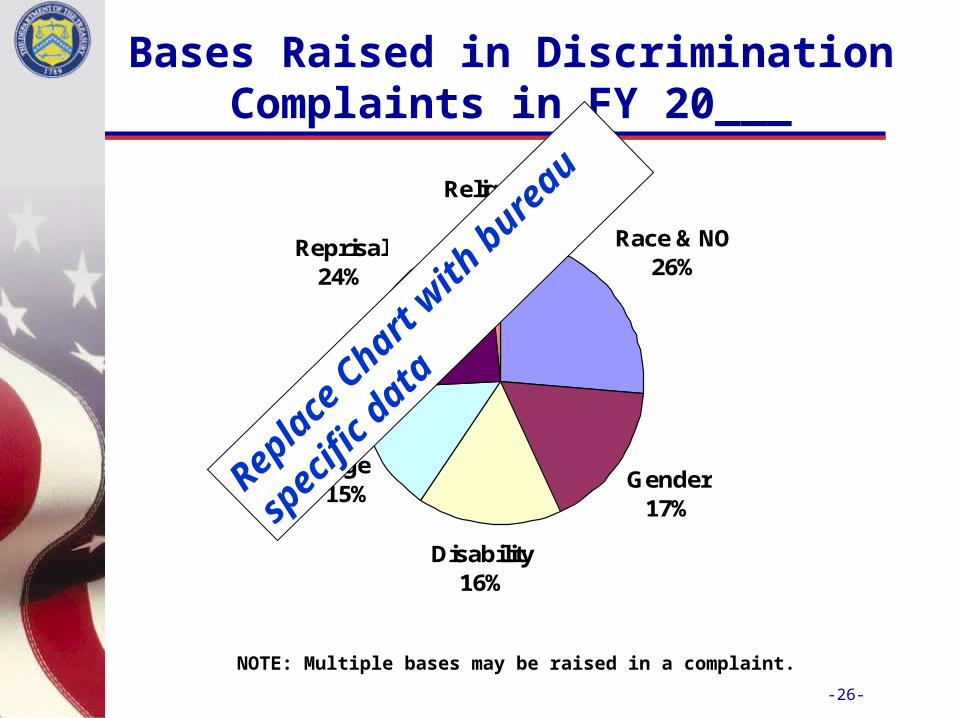
Race & NO 26%
Gender17%
Disability16%
Age15%
Reprisal24%
Religion2%
Bases Raised in Discrimination Complaints in FY 20___
NOTE: Multiple bases may be raised in a complaint.
Repla
ce C
hart w
ith b
ureau
spec
ific
data
-27-
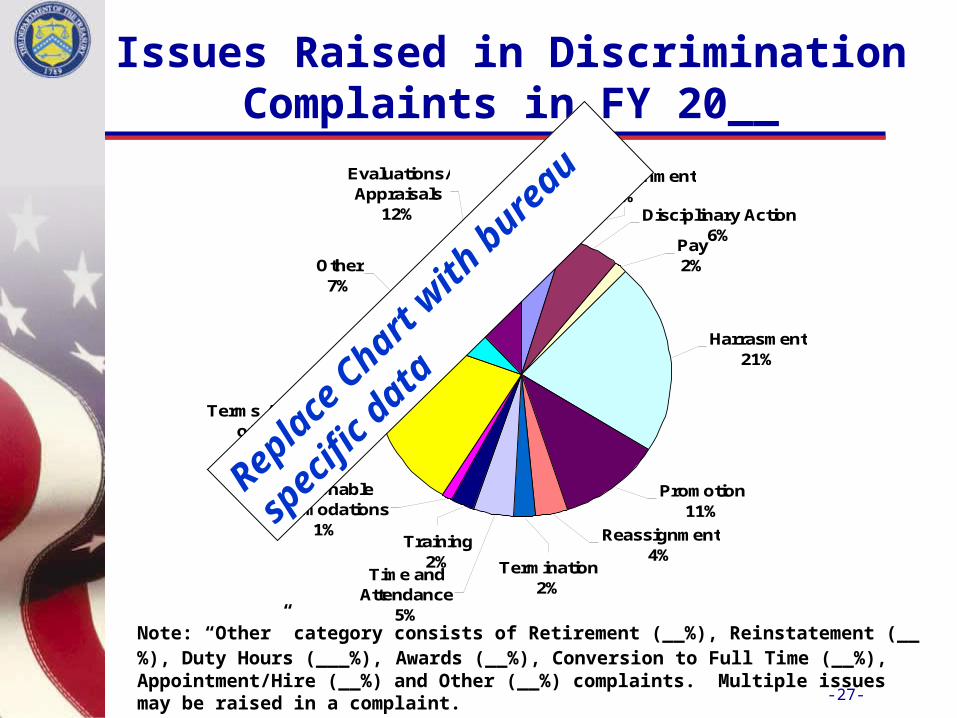
Reasonable Accomodations
1%
Time and Attendance
5%
Training2%
Pay2%
Disciplinary Action6%
Duty Assignment5%
Terms /Condition of Employ
22%
Other7%
Evaluations/Appraisals
12%
Harrasment21%
Promotion11%
Reassignment4%
Termination2%
Note: “Other” category consists of Retirement (__%), Reinstatement (__%), Duty Hours (___%), Awards (__%), Conversion to Full Time (__%), Appointment/Hire (__%) and Other (__%) complaints. Multiple issues may be raised in a complaint.
Issues Raised in Discrimination Complaints in FY 20__
Repla
ce C
hart w
ith b
ureau
spec
ific
data
-28-
– State your bureau specific recommendations here on how to address the trigger/deficiency.
Develop… Provide… Identify… Establish…
Identified Deficiency/Trigger – Efficiencies in Complaint Processing
Repla
ce w
ith b
ureau
spec
ific
issu
es
29
EEO/HR Collaboration
-30-
– State your bureau specific recommendations here on how to address the trigger/deficiency.
Develop… Provide… Identify… Establish…
Identified Deficiency/Trigger – Bureau Collaboration
Repla
ce w
ith b
ureau
spec
ific
issu
es