Embed Size (px)
Citation preview

Advanced Nanomaterials ; H.Hofmann, Version 2011
1
1 MAGNETISM
1.1 Introduction
Over the past several decades, amorphous and more recently nanocrystalline
materials have been investigated for applications in magnetic devices requiring
magnetically soft materials such as transformers, inductive devices, etc. Most
recently, research interest in nanocrystalline soft magnetic alloys has dramatically
increased. This is due, in part, to the properties common to both amorphous and
crystalline materials and the ability of these alloys to compete with their amorphous
and crystalline counterparts. The benefits found in the nanocrystalline alloys stem
from their chemical and structural variations on a nanoscale which are important for
developing optimal magnetic properties.
In the following sections, we will first revisit the magnetic properties of matter
and then pass on to discuss about the magnetic nanomaterials.
1.1.1 Concept
The magnetic field parameters at a given point in space are defined to be the
magnetic field strength H, the magnetic flux density or magnetic induction B and the
magnetization of the material M. Inside a magnetic material:
)(0 MHB += μ (1. 1)
μ0 = 4π x 10-7 H/m is the permeability of free space. (H = Henry, Vs/A)
We can also define the magnetic field parameters by this way:
B = μ0 H(1 + χ) =μH (1. 2)
Where μ = μ0(1 + χ) is the permeability of the material and χ = M/H is the magnetic
susceptibility of the material.
Finally, we need to define the magnetic moment, μm, through the following equation:
M = μm / V (1. 3)

Advanced Nanomaterials ; H.Hofmann, Version 2011
2
It needs to be noted that in magnetic theory several unit systems are
commonly in use. Historically, workers in magnetic materials have used the cgs
(centimetre, gram, second) or Gaussian system. More recently attempts have been
made to change over the SI system. As you can see on the next figure, two SI
systems are used; we will focus on the Sommerfield convention.
Table 1-1 : Magnetic units. A is ampere, cm is centimeter, m is meter, emu is electromagnetic unit, B
is magnetic induction, H is magnetic field strength, M is magnetization of a substance per unit volume.
[K. J Klabunde, Nanoscale Materials in Chemistry, Wiley-Interscience, 2001]
1.1.2 Phenomena
1.1.2.1 Atomic origins Magnetic fields are a result of moving charges. From an atomic view of matter, there
are two electronic motions:
- the orbital motion of the electron (revolution of electron around the core)
- and the spin motion of the electron (revolve around its own axis).
These two electron motions are the source of macroscopic magnetic phenomena in
materials.
1.1.2.2 Classification of magnetic phenomena We use the word magnetism very loosely when implying the mutual magnetic
attraction of pieces of iron. There are, however, several classes of magnetic
materials that differ in kind and degree in their mutual interaction. We shall
distinguish in the following between:
- Ferromagnetism: Imagine the external field strength is increased (in a
ferromagnetic solid), then the magnetization rises at first slowly and then more
rapidly. Finally, M levels off and reaches a constant value, called the saturation
magnetization Ms. When H is reduced to zero, the magnetization retains a positive
value, called the remanent magnetization or remanence Mr. It is this retained

Advanced Nanomaterials ; H.Hofmann, Version 2011
3
magnetization which is utilized in permanent magnets. The remanent magnetization
can be removed by reversing the magnetic field strength to a value Hc, called the
coercive field.
- Paramagnetism: Without an external magnetic field, orbiting electrons
magnetic moments are randomly oriented and thus they mutually cancel one another.
As a result, the net magnetization is zero. However, when an external field is applied
the individual magnetic vectors tend to turn into the field direction, which is
counteracted by thermal agitation alignment (see the Curie law).
- Diamagnetism: may be explained by postulating that the external
magnetic field induces a change in the magnitude of inner-atomic currents, that is,
the external field accelerates or decelerates the orbiting electrons, in order that their
magnetic moment is in the opposite direction from the external magnetic field.
- Antiferromagnetism: Antiferromagnetic materials exhibit, just as
ferromagnetics a spontaneous alignment of moments below a critical temperature.
However, the responsible neighbouring atoms in antiferromagnetics are aligned in an
antiparallel fashion. Antiferromagnetic materials are paramagnetic above the Neel
temperature TN
- Ferrimagnetism: Ferrimagnets are similar to antiferromagnets in that two
sublattices exist that couple through a superexchange mechanism to create an
antiparallel alignment. However the magnetic moments on the ions of the sublattices
are not equal and hence they do not cancel; rather, a finite difference remains to
leave a net magnetization. This spontaneous magnetization is defeated by the
thermal energy above the Curie temperature, and then the system is paramagnetic
having a nonlinear 1/x versus T relationship.

Advanced Nanomaterials ; H.Hofmann, Version 2011
4
1.2 Magnetic Properties of small atomic clusters
1.2.1 Introduction
One of the areas of cluster research currently being pursued is the
investigation of the magnetic properties of small atomic clusters. Since large numbers
of atoms of the clusters are on the surface, one expects the clusters of these
elements to exhibit larger magnetic moments. Being small particles, it is possible to
measure the magnetic moment directly by measuring the interaction with a magnetic
field in terms of their deflection from the original trajectories.
1.2.2 Size dependence
The magnetic moment of transition metals decreases in general with the increase of
number of atoms (size) in the clusters. However, the moment of different transition
metal clusters are found to depend differently on the number of atom per clusters (N).
0
0.5
1
1.5
2
2.5
3
0 100 200 300 400 500 600 700 800
Cluster Size (N) [Number of atoms]
Bulk Fe
Fe-clusters
Co-clusters
Bulk NiNi-clusters
Rh-clusters
Bulk Co
Mag
netic
mom
ent p
er a
tom
Figure 1-1: Magnetic moment per atom in units of Bohr magnetron for iron, cobalt, nickel and rodium
clusters as a function of cluster size (number of atom). The enclosed data points show the sizes of the

Advanced Nanomaterials ; H.Hofmann, Version 2011
5
respective clusters at which they attain bulk moments. Only the maximum error in the data for each
clusters are shown. Iron, cobalt and nickel data are from W. A. de Heer et al.i and Billas. The rodhium
data is from Cox et. al
Among the ferromagnetic 3d transition metals, Nickel clusters attain the bulk
moment at N=150, whereas Cobalt and Iron clusters reach at the corresponding bulk
limit at N=450 and N=550 respectively (
Figure 1-1). In icosahedral configuration these numbers correspond to 3, 4 and 5
shells respectively.ii
The results show that in the lower size limit the clusters have high spin majority
configuration and the behaviour is more like an atom, but with the increase of size an
overlap of the 3d-band with the Fermi level occurs, which reduces the moment
towards that of the bulk with slow oscillations. In analogy with the layer-by-layer
magnetic moments in the studies of surface magnetism, the clusters are assumed to
be composed of spherical layers of atoms forming shells and the value of moment of
an atom in a particular shell is considered to be independent of the size of cluster.
The magnetic moment values of the different shells are optimized to fit with the total
moment per atom maintaining the overall trend of observed decrease with size. It is
generally observed that the per atom moment for the surface atoms in the 1st layer
are close to that of an atom and deep layers correspond the bulk. The intermediate
layers show an overall decreasing trend. For both nickel and cobalt, there are
oscillations in the values at least up to the 5th shell. For nickel, the second layer is
found to have a negative coupling with the surface atoms and the 3rd-4th layers in
iron are magnetically dead. The model gives more or less close agreement with the
experimental results for cobalt and nickel. But in a more realistic model one has to
account for both the geometric shell closing as well as the electronic structure.
However this model provides a good first order picture to understand the magnetic
behaviour of 3d transition metal clusters.
Though the 4d transition metals are non-magnetic, the small clusters of
rhodium are found to be magnetic following the calculations.iii Within the size range
N=10-20, the moment varies between 0.8 to 0.1μB per atom but the clusters become
non-magnetic within N=100. Due to reduced size, the individual moments on the
atoms in clusters are aligned. First principal calculations show that the ground state
of Rh6 is non-ferromagnetic, while Rh9, Rh13 and Rh19 clusters have non-zero

Advanced Nanomaterials ; H.Hofmann, Version 2011
6
magnetic moments. Rh43 is found to be non-magnetic as the bulk. Ruthenium,
palladium, Chromium, Vanadium and Aluminium clusters are found to be non-
magnetic.Error! Bookmark not defined.
1.2.3 Thermal behaviour
Since ferromagnetic state requires the moments to remain mutually aligned
even at relatively high temperatures, it is important to study the thermal behaviour of
the magnetic clusters. Temperature dependent studies show that up to 300K the
moment remains constant for nickel clusters and then it decreases at higher
temperatures resembling closely the bulk behaviour. This indicates that the
interactions affecting the mutual alignment of moments with temperature are in the
same order of magnitude as in the bulk. Ni550-600 is almost bulk-like. Cobalt clusters
also follow the same trend but the moment increases slightly, between 300K to 500K,
which might be due to a structural phase transition corresponding to the hcp-fcc
phase transition in bulk at 670K, where the moment increases by 1.5%. Clusters of
different size ranges of iron behave differently; Fe50-60 shows a gradual reduction of
moments from 3μB at 120K to 1.53μB at 800K. Up to 400K, Fe120-140 remains with a
constant moment of 3μB and then decreases to finally level off at 700K to 0.7μB. The
size range N=82-92 behaves like Fe120-140 below 400K and like Fe50-60 above 400K.
The moment for the higher size ranges decreases steadily with the increase of
temperature but Fe250-290 levels off at 700K whereas Fe500-600 levels off between 500-
600K to 0.4μB. Comparing with the thermal behaviour of bulk iron, the level-off
temperature can be termed as the critical temperature (TC) for clusters of a particular
size and it decreases with the increase of size of the clusters. But, since the bulk
Curie temperature is 1043K, one realizes clearly that this trend must reverse at
higher sizes to reach the bulk. It is also interesting to note that for Fe120-140 the
moment decreases more rapidly within 600-700K. The specific heat measurement for
both Fe120-140 and Fe250-290 also show a peak at 650K. This might be because iron
clusters undergo a structural phase transition in this temperature range similar to the
bulk iron which undergoes bcc-fcc-bcc phase transition, but only beyond the Curie
temperature.

Advanced Nanomaterials ; H.Hofmann, Version 2011
7
1.2.4 Rare earth clusters The magnetic interaction in rare earth solids are RKKY type which is mediated
by the conduction electrons. RKKY stands for Ruderman-Kittel-Kasuya-Yosida and
refers to a coupling mechanism of nuclear magnetic moments or localized inner d or f
shell electron spins in a metal by means of an interaction through the conduction
electrons. Since in clusters, structure and filling up of the conduction band differs
from that in the bulk, rare-earth clusters are expected to exhibit an altogether different
magnetism compared to the bulk. Magnetic properties of gadolinium, terbium and
dysprosium clusters show a very size-specific behaviour. Gd22 behaves super-
paramagnetically (1.3.4) but Gd23 shows a behaviour like a rigid magnetic rotor as if
the moment is locked to the cluster lattice. Gd17 shows super-paramagnetism near
room temperature but at low temperatures it shows locked-moment behaviour. It
indicates that there are at least two groups of clusters sharing the same number of
atoms which might correspond to two different isomers, either magnetic or structural.
But it is not clear whether the two isomers co-exist in the beam or there occurs a
phase transition of any kind. The behaviour of other clusters from N=11-30, is like
Gd22 or Gd23 or Gd17. Similar is the case for Tb and Dy clusters. Tb17, Tb22, Tb27, Dy22
and Dy27 show super-paramagnetic behaviour but Tb23 and Tb26 show locked-
moment behaviour. In fact Tb26 is temperature dependent like Gd17.
1.3 Small particle magnetism
1.3.1 Classifications of magnetic nanomaterial
The correlation between nanostructure and magnetic properties suggests a
classification of nanostructure morphologies. The following classification is designed
to emphasize the physical mechanisms responsible for the magnetic behaviour.
Figure 1-2 schematically represents the classification. At one extreme are systems of
isolated particles with nanoscale diameters, which are denoted by type A. These non
interacting systems derive their unique magnetic properties strictly from the reduced
size from the components, with no contribution from interparticle interactions. At the
other extreme are bulk materials with nanoscale structure denoted by type D, in

Advanced Nanomaterials ; H.Hofmann, Version 2011
8
which a significant fraction (up to 50%) of the sample volume is composed of grain
boundaries and interfaces. In contrast to type A systems, magnetic properties here
are dominated by interactions. The length of the interactions can span many grains
and is critically dependent on the character of interface. Due to this dominance of
interaction and grain boundaries, the magnetic behaviour of type D nanostructures
cannot be predicted simply by applying theories of polycrystalline materials with
reduced length scale. In type B particles, the presence of a shell can help prevent
particle interactions, but often at the cost of interaction between the core and the
shell. In many cases the shells are formed via oxidation and may themselves be
magnetic. In type C materials, the magnetic interactions are determined by the
volume fraction of the magnetic particles and the character of the matrix they are
embedded in.
A
B
C
D
Figure 1-2 : Schematic representation of the different types of magnetic nanostructures. Type-A
materials include the ideal ultrafine particle system, with interparticle spacing large enough to
approximate the particles as noninteracting. Ferrofluids, in which magnetic particles are surrounded
by a surfactant preventing interactions, are a subgroup of Type-A materials. Type-B materials are
ultrafine particles with a core-shell morphology. Type-C nanocomposites are composed of small
magnetic particles embedded in a chemically dissimilar matrix. The matrix may or may not be
magnetoactive. Type-D materials consist of small crystallites dispersed in a noncrystalline matrix. The
nanostructure may be two-phase, in which nanocrystallites are distinct phases from the matrix, or the
ideal case in which both the crystallites and the matrix are made of the same material.

Advanced Nanomaterials ; H.Hofmann, Version 2011
9
1.3.1.1 Ferrofluid
A ferrofluid is a synthetic liquid that holds small magnetic particles in a colloidal
suspension, with particles held aloft their thermal energy. The particles are
sufficiently small that the ferrofluid retains its liquid characteristics even in the
pressure of a magnetic field, and substantial magnetic forces can be induced which
results in fluid motion.
A ferrofluid has three primary components. The carrier is the liquid element in
which the magnetic particles are suspended. Most ferrofluids are either water based
or oil based. The suspended materials are small ferromagnetic particles such as iron
oxide, on the order of 10 – 20 nm in diameter. The small size is necessary to
maintain stability of the colloidal suspension, as particles significantly larger than this
could agglomarete. A surfactant coats the ferrofluid particles to help maintain the
consistency of the colloidal suspension.
The magnetic properties of the ferrofluid are strongly dependent on particle
concentration and on the properties of the applied magnetic field. With an applied
field, the particles align in the direction of the field, magnetizing the fluid. The
tendency for the particles to agglomerate due to magnetic interaction between
particles is opposed by the thermal energy of the particles and by the coating with
surfactants. Although, particles vary in shape and size distribution, insight into fluid
dynamics can be gained by considering a simple spherical model of the suspended
particles.
S
2R σ ,μ
Figure 1-3: Representative model of a typical ferrofluid.

Advanced Nanomaterials ; H.Hofmann, Version 2011
10
The particles are free to move in the carrier fluid under the influence of an applied
magnetic field, but on average the particles maintain a spacing S to nearest
neighbours. In a low density fluid, the spacing S is much larger than the mean
particle radius 2R, and magnetic dipole – dipole interactions are minimal.
Applications for ferrofluids exploit the ability to position and shape the fluid
magnetically. Some applications are:
• rotary shaft seals
• magnetic liquid seals, to form a seal between region of different pressures
• cooling and resonance damping for loudspeaker coils
• printing with magnetic inks
• inertial damping, by adjusting the mixture of the ferrofluid, the fluid viscosity
may be change to critically damp resonances accelerometers,
• level and attribute sensors
• electromagnetically triggered drug delivery
1.3.2 Anisotropy
In many situations the susceptibility of a material will depend on the direction in which
it is measured. Such a situation is called magnetic anisotropy. When magnetic
anisotropy exists, the total magnetization of a ferromagnet M will prefer to lie along a
special direction called the easy axis. The energy associated with this alignment is
called the anisotropy energy and in its lowest form is given by
Ea = K sin²θ (1. 4)
Where θ is the angle between M and the easy axis. K is the anisotropy constant.
Most materials contain some type of anisotropy affecting the behaviour of the
magnetization. The most common forms of anisotropy are:
• Crystal anisotropy
• Shape anisotropy
• Stress anisotropy
• Externally induced anisotropy
• Exchange anisotropy.

Advanced Nanomaterials ; H.Hofmann, Version 2011
11
The two most common anisotropies in nanostructure materials are crystalline
and shape anisotropy.
1.3.2.1 Magnetocrystalline anisotropy
Only magnetocrystalline anisotropy, or simply crystal anisotropy, is intrinsic to the
material; all other anisotropies are induced. In crystal anisotropy, the ease of
obtaining saturation magnetization is different for different crystallographic directions.
An example is a single crystal of iron for which Ms is most easily obtained in the [100]
direction, then less easy for the [110] direction, and most difficult for the [111]
directions. These directions and magnetization curves for iron are given in Figure 1-4. The [100] direction is called the easy direction, or easy axis, and because the other
two directions have an overall smaller susceptibility, the easy axis is the direction of
spontaneous magnetization when below Tc (Curie Temperature). Both iron and
nickel are cubic and have three different axes, whereas cobalt is hexagonal with a
single easy axis perpendicular to the hexagonal symmetry. Figure 1-4 also gives
magnetization curves for cobalt and nickel.
Figure 1-4 : Magnetization curves for single crystals of iron, cobalt and nickel along different
directions. [K. J Klabunde, Nanoscale Materials in Chemistry, Wiley-Interscience, 2001]
We would now imagine a situation in which the system has spontaneous
magnetization along the easy axis but a field is applied in another direction.
Redirection of the magnetization to be aligned with the applied field requires energy
(through the change in HM ⋅ ), hence the crystal anisotropy must imply a crystal
anisotropy energy given by equation Ea = K sin²θ (1. 4) for a uniaxial material.
This energy is an intrinsic property of the material and is parametrized, to lowest
order, by the anisotropy constant K=K1 which has units of energy per volume of
material. Roughly speaking K1 is the energy necessary to redirect the magnetization.

Advanced Nanomaterials ; H.Hofmann, Version 2011
12
For a uniaxial material with only K1, the magnetic field necessary to rotate the
magnetization 90° away from the easy axis is
H = 2K1/Ms (1. 5)
The physical origin of the magnetocrystalline anisotropy is the coupling of the
electron spins, which carry the magnetic moment, to the electronic orbit, which in turn
is coupled to the lattice. Recall it was the strong coupling of the orbit to the lattice via
the crystal field that quenched the orbital angular momentum.
A polycrystalline sample with no preferred grain orientation has no net crystal
anisotropy due to averaging over all orientations.
1.3.2.2 Shape anisotropy
It is easier to induce a magnetization along a long direction of a nonspherical piece of
material than along a short direction. This is so because the demagnetizing field is
less in the long direction, because the induced poles at the surface are farther apart.
Thus, a smaller applied field will negate the internal, demagnetizing field. For a
prolate spheroid with major axis c greater than the other two and equal axes of
length a, the shape anisotropy constant is
( ) 2
21 MNNK caS −= (1. 6)
Where Na and Nc are demagnetization factors.
For spheres, Na = Nc because a = c.
It can be shown that 2Na + Nc = 4π; then the limit c>>a, that is, a long rod,
Ks = 2πM².
Thus a long rod of iron with Ms = 1714 A m-1 would have a shape anisotropy constant
of Ks = 1.85 x 10⁷erg cm-3. This is significantly greater than the crystal anisotropy so
we see that shape anisotropy can be very important for nonspherical particles.
1.3.2.3 Other anisotropy
Stress anisotropy result from internal or external stresses that occur due to
rapid cooling, application of external pressure etc. Anisotropy may also be induced by
annealing in a magnetic field, plastic deformation, or by ion beam irradiation.
Exchange anisotropy occurs when a ferromagnet is in close proximity to an
antiferromagnet or ferromagnet. Magnetic coupling at the interface of the two

Advanced Nanomaterials ; H.Hofmann, Version 2011
13
materials can create a preferential direction in the ferromagnetic phase, which takes
the form of a unidirectional anisotropy. This type of anisotropy is most commonly
observed in type – B particles, when an antiferromagnetic or ferromagnetic oxide
forms around a ferromagnetic core.
1.3.3 Single Domain Particles
The magnetism of small ferromagnetic particles is dominated by two key features.
The first one is the size limit below which the specimen can no longer gain a
favourable energy configuration by breaking up into domains, hence it remains with
one domain. The second one is the thermal energy that can decouple the
magnetization from the particle itself to give rise to the phenomenon of
superparamagnetism.
1.3.3.1 The role of the particle volume
The most obvious finite-size effect in magnetic fine-particle systems consists in the
fact that each entity (magnetic particle) has a very small volume compared to the
typical sizes of the magnetic domains in the corresponding bulk materials. In a sense,
the volume of a particle is so small (commonly, a few tens or hundreds of nm3) that it
can be considered as a zero-dimension magnetic system, which strongly affects its
magnetic behaviour. In real systems, the size of the particles is usually not uniform
and distributed following a function f(V) which is satisfactorily described by a
logarithmic-linear distribution of the form
⎥⎦⎤
⎢⎣⎡−=
²2)/²(ln
exp2
1)( 0
σσπVV
VVf (1. 7)
Where V0 is the most probable particle volume and σ is the standard deviation of
ln(V).
One fundamental question related to the finite and small volume of the particles is
how such volume determines the internal domain structure. In magnetic bulk
materials, it is well known that there exists a multidomain structure constituted by
regions of uniform magnetization separated by Domain Walls (DWs). The size and
shape of these domains depends on the interplay between the exchange,
magnetostatic and anisotropy energies of the system. As the volume of the magnetic

Advanced Nanomaterials ; H.Hofmann, Version 2011
14
system decreases, the size of the domains and the width of the walls are reduced,
modifying, at the same time, their inner structure. Below a certain critical volume, the
energy cost to produce a DW is greater than the corresponding reduction in the
magnetostatic energy. Consequently, the system no longer divides in smaller
domains, instead maintaining the magnetic structure of a single domain. This critical
value depends on the saturation magnetization of the particle, anisotropy energy and
exchange interactions between individual spins. For example, for spherical particles
the critical diameter is within 10–800 nm. Typical values for Fe and Co metallic
particles are 15 and 35 nm, respectively, while for SmCo5 it is as large as 750 nm.
In many fine-particle systems, f(V) is narrow and centred at very small V0 below the
critical value, so that all the particles constituting the system can be considered as a
single domain.
This is the situation that we are going to assume in what follows. In thermal
equilibrium, the resulting magnetization of a particle points in a direction tending to
minimize its total anisotropy energy, which for a single-domain particle can be
considered as proportional to its volume, at least, in first approximation (Figure 1-6).
The total anisotropy of the particle can often be assumed to have uniaxial character,
being determined by a single constant K. Therefore, the anisotropy energy can be
expressed as
E(θ) = kV sin2θ (1. 8)
where θ is the angle between anisotropy axis and magnetization, and KV is the
anisotropy energy barrier (1.3.2) separating both easy directions for magnetization,
which in zero magnetic field correspond to θ = 0 and θ = π. Taking into account the
spread of volumes f(V) given by equation E(θ) = kV sin2θ (1.
8 ⎥⎦⎤
⎢⎣⎡−=
²2)/²(ln
exp2
1)( 0
σσπVV
VVf (1. 7), it is a matter of fact that the
magnetization of the particles will behave as if it were driven by an energy barrier
distribution )( 0BEf , where 0
BE = kV.
Under the application of a magnetic field H forming an angle ψ with the anisotropy
axis, the energy of a particle is modified as
)cossinsincos(cos²sin)( ϕψθψθθθ ++−= SHMKVE (1. 9)

Advanced Nanomaterials ; H.Hofmann, Version 2011
15
Where Ms is the spontaneous magnetization of the particle, and the axis system is
defined in Figure 1-5. (Spontaneous magnetization is the term used to describe the
appearance of an ordered spin state (magnetization) at zero applied magnetic field in
a ferromagnetic or ferrimagnetic material below a critical point called the Curie
temperature or TC.)
Figure 1-5 : Definition of the axis system for a fine particle. The uniaxial-anisotropy axis is along the z-
axis. [X. Batle, A. Labarta, Finite-size effects in fine particles: magnetic and transport properties,
Journal of Physics, 2002, ppR15-R42].
Under zero field, the equilibrium direction for the magnetization vector M coincides
with the anisotropy axis, while when a magnetic field is applied, it rotates away from
the anisotropy axis towards the field direction, forming an angle ψ−θ with H, and the
stability problem can be reduced to a two-dimensional one (ϕ = 0). In this case, and if
H is lower than a certain critical value known as switching field at zero temperature, 0SWH , E(θ) has two minima at different heights which are separated by an energy
barrier. When the field is applied opposite to the magnetization, the unstable
minimum is separated from the stable one by an energy barrier EB, which can be
approximated by the following expression:
κ
⎟⎟⎠
⎞⎜⎜⎝
⎛−= 0
0 1)(SW
BB HHEHE (1. 10)
Where κ is a phenomenological exponent that depends on ψ. Consequently, 0SWH
is the minimum value of the field at zero T, at which EB vanishes, and the

Advanced Nanomaterials ; H.Hofmann, Version 2011
16
magnetization inverts its orientation. When H is applied along the anisotropy axis and
in the opposite direction to magnetization, equation
κ
⎟⎟⎠
⎞⎜⎜⎝
⎛−= 0
0 1)(SW
BB HHEHE
(1.
10) is exact with κ = 2. In this case, M irreversably rotates at zero T when H = 0SWH =
Ha = 2K/Ms, where Ha is the anisotropy field. If H is applied at an arbitrary angle ψ,
there is not a simple analytical expression. However, equation
κ
⎟⎟⎠
⎞⎜⎜⎝
⎛−= 0
0 1)(SW
BB HHEHE
(1. 10) works quite well with κ ≈ 1.5, provided that the applied field forms an
angle of a few degrees with the anisotropy axis. On the other hand, Pffeifer gave the
following phenomenological approximation for any angle ψ
a
SW
HH 014.1
86.0 +=κ (1. 11)
A method frequently used to characterize the nature and strength of the particle
anisotropy consists in the determination of 0SWH as a function of ψ. The resulting
curve turns to be the so-called Stoner Wohlfarth (SW) astroid. In fact, the SW astroid
represents the set of fields (applied opposite to the particle magnetization) at which
irreversible jumps occur. For uniaxial anisotropy, 0SWH can be evaluated from
equation )cossinsincos(cos²sin)( ϕψθψθθθ ++−= SHMKVE (1. 9) with the
conditions dE/dθ = d²E/dθ² = 0, since irreversible jumps occur when the energy
barrier vanishes and the maximum in E(θ) is substituted by an inflection point. The
obtained expression is
2/33/23/20
)cos(sin ψψ += a
SWH
H (1. 12)
Many groups have attempted to study the reversal process in single particles but the
experimental precision did not yield quantitative information.

Advanced Nanomaterials ; H.Hofmann, Version 2011
17
Single domain
Multi domain
SuperParamagnetic
H c
Dc
D
Figure 1-6 : Qualitative illustration of the behaviour of the coercivity in ultrafine particle systems are
the particles size changes.
As the particles size continues to decrease (towards some critical particle diameter,
Dc) below the single domain value, the spins get increasing affected by thermal
fluctuations and the system becomes superparamagnetic. Particles with sufficient
shape anisotropy can remain single domain to much larger dimensions than their
spherical counterparts.
1.3.3.2 Single-Domain Characteristics:
In a granular magnetic solid with a low volume fraction, one has a collection of single
domain particles each with a magnetic axis along which all the moments are aligned.
In the absence of a magnetic field, parallel and anti parallel orientations along the
magnetic axis are energetically equivalent but separated by an energy barrier of KV,
where K is the total anisotropy per volume, and V is the particle volume. Since the
orientation of each single domain remains fixed, under an external field, only the
magnetic axes rotate. Thus the measured magnetization M of a granular magnetic
field solid with a collection of single domain particles is the global magnetization
.cosS
M HM M
Hθ= = (1. 13)
Where θ is the angle between the magnetic axis of a particle. SM , is the saturation
magnetization, H is the external field, and the average <cos θ> is taken over many
ferromagnetic particles. The hysterisis loop of a granular solid is thus a signature of

Advanced Nanomaterials ; H.Hofmann, Version 2011
18
the rotation of the magnetic area of the single-domain particles. This should be
contrasted with the hysterisis loop of a bulk ferromagnet, in which the sizes and the
direction of the domains are altered drastically under an external field.
M
H
MS
MR
M C
(a)
TBT
H C (c)
M S
M
M S /2
T B T
e c
d f
b
a
T B
(b) (d) χ
T
Figure 1-7 : (a) Hysterisis loop at 5K; (b) temperature dependence of saturation magnetization (MS)
and remnant magnetization (MR=MS/2); (c) temperature dependence of field cooled (FC) and zero-field
cooled (ZFC) susceptibility. At the blocking temperature (TB), MR and HC vanish, whereas the ZFC
susceptibility shows a cusp like feature.
An example of a hysterisis loop of a granular magnetic solid at low temperature is
shown in Figure 1-7a. In the initial unmagnetized state with M = 0 at H = 0, the
magnetic axes of the particles are randomly oriented, each along its own magnetic
axis, which is determine by the total magnetic anisotropy of the particles. The
directions of the giant moments are random and static at low temperatures. A
saturation magnetization (M = MS) is realized under a large field when all the
magnetic axes are aligned. In the remnant state when H is reduced to H = 0, one
observes the remnant magnetization (MR), whose values at low temperature is MR =
MS/2. This is because the magnetic axes are oriented only in one hemisphere due to
the uniaxial anisotropy of the single-domain particle.

Advanced Nanomaterials ; H.Hofmann, Version 2011
19
It should be noted that the initial M=0 state and the initial magnetization curve if in
Figure 1-7a does not reappear, whereas the field cycle part does. The simples way to
recover the initial M=0 state is to heat the sample above the blocking temperature
and cool the sample in zero field back to low temperatures.
Because of the single domain nature of the magnetic entities, the coercivity
(HC) of the ultra fine particles is much higher than that in bulk material.
1.3.4 Superparamagnetism
1.3.4.1 The SPM regime
Below the Curie temperature of a ferromagnet or ferrimagnet, all the spins are
coupled together and so cooperate to yield a large moment. This moment is bound
rigidly to the particle by one or more of the variety of anisotropies that we have
discussed (1.3.2). With decreasing particle size, the energy Barrier EB decreases
until the thermal energy kT can disrupt the bonding of the total moment to the
particle.
Then this moment is free to move and respond to an applied field independent of the
particle. This moment is the particle magnetic moment and is equal to
μp=MSV (1. 14)
It can be quite large, thousands of Bohr magnetons. An applied field would tend to
align this giant (super) moment, but kT would fight he alignment just as it does in a
paramagnet. Thus, this phenomenon is called superparamagnetism.
It is good to notice that if the anisotropy is very weak (zero), one would expect that
the total moment μp could point in any direction, hence the Langevin law would apply.
The phenomenon of superparamagnetism is, in fact, timescale-dependent due to the
stochastic nature of the thermal energy. The anisotropy energy EB represents an
energy barrier to the total spin reorientation; hence the probability for jumping this
barrier is given by Arrhenius law:
⎟⎠⎞
⎜⎝⎛=
kTEBexp0ττ (1. 15)

Advanced Nanomaterials ; H.Hofmann, Version 2011
20
Where 0τ is the attempt time by supposing that the particle spins are rigidly coupled
and reverse as a whole. This pre-factor depends on a large variety of parameters:
temperature, gyromagnetic ratio, saturation magnetization, energy barrier, direction
of the applied field and damping constant. τ 0 is assumed to be constant and
equation ⎟⎠⎞
⎜⎝⎛=
kTEBexp0ττ (1. 15), together with this assumption, is known as the
Neel–Brown model. If the characteristic time window of an experiment is much
shorter than τ at a fixed temperature, the particle moment remains blocked during
the observation period (blocked regime), while, in the opposite situation, the rapid
fluctuations of the particle moment mimics the atomic paramagnetism (SPM regime).
In the intermediate regime, the probability that the magnetization has not switched
after an observation time t is given by
⎟⎠⎞
⎜⎝⎛ −
=τttP exp)( (1. 16)
A method used to verify the Neel–Brown model in real systems is the scaling of the
switching field distributions measured at different T and rates of field ramping.
Thermal activation leads to a switching field distribution from the Stoner Wohlfahrt
model, the mean switching field being given by
⎥⎥⎦
⎤
⎢⎢⎣
⎡⎟⎟⎠
⎞⎜⎜⎝
⎛⎟⎠⎞
⎜⎝⎛−= −
κ
κυε
/1
10 ln1 cT
ETk
HHB
BSWSW (1. 17)
Where )/( 00
BSWB EHkc ατ= , )/1( 0SWHH−=ε and υ is the field sweeping rate. From
the equation above, it is evident that Hsw measured at different T and υ can be
collapsed in a single master curve when they are plotted as a function of the scaling
variable (T ln(cT / υ εκ−1))1/κ . In fact, the collapse is obtained by choosing the
appropriate values of κ and c (obtaining κ = 1.5, as expected for measurements with
the field slightly deviated from the anisotropy axis, see paragraph 1.3.3.1). This
scaling procedure has been successfully applied to analyse data obtained above
about 0.5K from single-particle experiments carried out with different kind of
nanoparticles.
At very low temperatures, (below about 0.5 K) strong deviations from the Neel–Brown
model have been reported in this kind of scaling when it was applied to single-particle

Advanced Nanomaterials ; H.Hofmann, Version 2011
21
experiments. The deviations consisted in a saturation of Hsw and σ (width of the
switching field distribution), and a dependence of Hsw on υ faster than the prediction
of the Neel–Brown model. All these anomalies have been attributed to the
prevalence of a nonthermal process by which the particle magnetization escapes
from the metastable state through the energy barrier by macroscopic quantum
tunnelling (MQT). The theoretical models propose that there is a crossover
temperature TB, below which quantum tunnelling dominates the reversal process,
whereas above TB, the escape rate from the metastable state is given by thermal
activation, and the Neel–Brown model is accomplished. Consequently, TB is the
temperature at which the thermal and quantum rates coincide.
1.3.4.2 Magnetism relaxation
If the total magnetization of a fine-particle system is measured with an observation
time window which for some particle sizes is comparable to their reversal time, τ, the
magnetization will evolve during the experiment, a phenomenon known as magnetic
relaxation. The study of this non-equilibrium phenomenon is a common method to
experimentally characterize the energy spectrum of the system, since it is the
macroscopic signature of the distribution of energy barriers separating local minima
which correspond to different orientations of the particle moments. Magnetic
relaxation experiments are carried out by measuring the time-dependence of the
magnetization after the system has been driven out of thermal equilibrium by the
application or removal of a magnetic field. For instance, starting from the equilibrium
state at a given field and temperature, and then removing the field, the time evolution
of the magnetization for noninteracting particles can be written as follows
⎟⎟⎠
⎞⎜⎜⎝
⎛ −= ∫
∞
)()()(
00 E
txpeEdEfMtMτ
(1. 18)
Where f (E)dE is the fraction of particles having energy barriers in between E and E +
dE, and M0 is the initial magnetization. In equation ⎟⎟⎠
⎞⎜⎜⎝
⎛ −= ∫
∞
)()()(
00 E
txpeEdEfMtMτ
(1. 18) and for the sake of simplicity, the particle moment has been assumed
to be volume independent, although, in fact, it is proportional to it. This assumption
does not significantly affect the results, providing that for a logarithmic-linear

Advanced Nanomaterials ; H.Hofmann, Version 2011
22
distribution, f (E) and Ef (E) (which is equivalent to Vf (V )) are similarly shaped
functions. Let us introduce the function p(t, T,E), which is defined by
⎥⎦
⎤⎢⎣
⎡⎟⎠⎞
⎜⎝⎛ −
⎟⎟⎠
⎞⎜⎜⎝
⎛−=
kTEtETtp expexp),,(
0τ (1. 19)
Taking into account that p(t, T,E) for a given t varies abruptly from 0 to 1, as the
energy barrier E increases, we can approximate p(t, T,E) by a step function whose
discontinuity Ec(t, T ) moves towards higher energies as time elapses. Consequently,
the integral is cut off at the lower limit by the value of Ec(t, T ) and can be written as
∫∞
≅Ec
EdEfMtM )()( 0 (1. 20)
Where Ec(t, T ) = kBT ln(t/τ0) is the only time-dependent parameter and signals the
position of the inflection point of p(t, T,E). In fact, the narrow energy range spanned
by the step at Ec(t, T ) can be understood as the experimental window of the
measurements. The experimental window can be swept over f (E) by varying the
temperature or the observation time. From equation ∫∞
≅Ec
EdEfMtM )()( 0
(1. 20), it
can be deduced that M(t) obtained after integration is a function of the parameter
Ec(t, T ), which acts as a scaling variable. The existence of this scaling variable
implies that measuring the magnetization as a function of the temperature at a given
time is equivalent to measuring the magnetization as a function of ln(t/τ0) at a given
temperature. This time–temperature correspondence is characteristic of activated
processes governed by Arrhenius law. The validity of the scaling hypothesis is only
determined by the validity of the cut-off approximation. Therefore, the scaling will be
accomplished as long as the width of p(t, T,E), which is approximately given by kBT,
is small when compared to the width of the energy barrier distribution. Although this
condition seems to be very restrictive, it is the usual situation found in experimental
observations of the magnetic relaxation in fine-particle systems.
As an example of this scaling method, Figure 1-8 shows the scaling of the relaxation
curves obtained at different temperatures for a sample consisting on Fe0.78C0.22
particles with a mean diameter of 3.6 nm, dispersed in stable dilution with a
hydrocarbon oil. In this sample, the dipolar interaction among particles was estimated

Advanced Nanomaterials ; H.Hofmann, Version 2011
23
to be very small. Figure 1-8 shows all the relaxation curves corresponding to
different temperatures collapsed into a single master curve when plotted as a
function of the scaling variable T ln(t/τ0), being τ0 = (3.5 ± 5) × 10−11 s, which is
an expected value for ferromagnetic fine particles.
Figure 1-8 : The resulting scaling for a sample composed of FeC nanoparticles dispersed in a
hydrocarbon oil is shown. Open and full circles correspond alternatively to adjoining temperatures,
which are indicated above the corresponding interval (K units). The solid line is the theoretical curve
calculated by fitting the scaling curve to equation ∫∞
≅Ec
EdEfMtM )()( 0 (1. 20) with a
logarithmic-linear distribution of energies. The values of the fitted parameters are: σ = 0.44 ± 0.05
and E0 = 287 ± 50K (position of the maximum of the energy barrier distribution). [X. Batle, A. Labarta,
Finite-size effects in fine particles: magnetic and transport properties, Journal of Physics, 2002,
ppR15-R42].
One of the most interesting aspects of these results is that, in fact, measuring the
relaxation at a given temperature is completely equivalent to measuring it at different
temperature but shifting the observation time window according to the law
T ln(t/τ0). In this sense, the method enables us to obtain the relaxation curve at a
given temperature, in a time range that is not experimentally accessible, by simply
dividing the T ln(t/τ0) axis by this temperature. For instance, in the case shown in
Figure 1-8, we can obtain the relaxation curve at the lowest measured temperature of

Advanced Nanomaterials ; H.Hofmann, Version 2011
24
1.8K at times as large as 10119 s, which is obviously an experimentally inaccessible
time. The validity of the T ln(t/τ0) scaling method to analyse the relaxation behaviour
has been proved in many systems of non or slightly interacting fine particles.
Moreover, from the T ln(t/τ0) scaling of relaxation data, insight can be gained into
the microscopic details of the energy barrier distribution producing the relaxation. If f
(E) is nearly constant in the range of energy barriers which can be overcome during
the observation time, then equation ∫∞
≅Ec
EdEfMtM )()( 0
(1. 20) can be
approximated by
⎟⎟⎠
⎞⎜⎜⎝
⎛⎟⎟⎠
⎞⎜⎜⎝
⎛−≈
00 ln)(1)(
τtETfkMtM CB (1. 21)
Where Ec is the mean energy barrier within the experimental window. From equation
⎟⎟⎠
⎞⎜⎜⎝
⎛⎟⎟⎠
⎞⎜⎜⎝
⎛−≈
00 ln)(1)(
τtETfkMtM CB
(1. 21)) we can define the viscosity parameter as
TkEft
MM
S BC )())(ln(
1
0
=∂
∂−= (1. 22)
Therefore, as Ec is varied, the magnetic viscosity maps the energy barrier distribution
at low enough temperatures for which the width of p(t, T,E) (equation
⎥⎦
⎤⎢⎣
⎡⎟⎠⎞
⎜⎝⎛ −
⎟⎟⎠
⎞⎜⎜⎝
⎛−=
kTEtETtp expexp),,(
0τ (1. 19)) function around the inflection point is small
compared to the width of the energy distribution and the scaling hypothesis is fulfilled.
As an example of the applicability of the method, in Figure 1-9, we show S/T derived
from the data of Figure 1-8 as a function of T ln(t/τ0). In Figure 1-9, the differential of
the thermoremanence relative to the saturation magnetization with respect to the
temperature is also shown, the agreement between both sets of data being very
good.

Advanced Nanomaterials ; H.Hofmann, Version 2011
25
Figure 1-9 : Numerical derivative of the data of Figure 1-8 with respect to the scaling variable (open
circles) and the logarithmic-linear distribution (dashed line) obtained by fitting the data of Figure 1-8 to
the equation ∫∞
≅Ec
EdEfMtM )()( 0 (1. 20). The differential of the thermoremanence relative to the
saturation magnetization versus the temperature is also shown in full circles for comparison. [X. Batle,
A. Labarta, Finite-size effects in fine particles: magnetic and transport properties, Journal of Physics,
2002, ppR15-R42].
If f (E) is almost constant over a certain range of energies, then S will be linear in T
over the corresponding temperature range; consequently, relaxation as a function of
time will follow a time logarithmic decay at fixed T. This behaviour is only
accomplished in a narrow region around the maximum of a bell-shaped energy
barrier distribution (see for instance, the region around the inflection point of the
master curve shown in Figure 1-8).
1.3.4.3 Effects of the interparticle interaction
We have reviewed different aspects of the magnetic relaxation of fine-particle
systems with random orientations, volume distribution and negligible magnetic
interactions. In this situation, the system is in an SPM regime, for which the time
evolution of the total magnetization is simply governed by the thermal activation over
the individual energy barriers of each particle. When interparticle interactions (for
instance, dipolar interactions) are non-negligible the behaviour of the system is
substantially more complicated and the problem becomes non-trivial, even if the
spins of the particle are assumed to be coupled to yield a super-spin moment.
The main types of magnetic interactions that can be found in fine-particle assemblies
are:
• dipole–dipole interactions, which always exit

Advanced Nanomaterials ; H.Hofmann, Version 2011
26
• exchange interactions through the surface of the particles which are in close
contact
• in granular solids, RKKY interactions through a metallic matrix when particles
are also metallic, and super exchange interactions when the matrix is
insulating.
Bearing in mind the anisotropic character of dipolar interactions, which may favour
ferromagnetic or antiferromagnetic alignments of the moments depending on
geometry, fine-particle systems have all the ingredients necessary to give rise to a
spin-glass state, namely, random distribution of easy axes and frustration of the
magnetic interactions. The complex interplay between both sources of magnetic
disorder determines the state of the assembly and its dynamical properties.
Magnetic interactions modify the energy barrier coming from the anisotropy
contributions of each particle and, in the limit of strong interactions, their effects
become dominant and individual energy barriers can no longer be considered, only
the total energy of the assembly being a relevant magnitude. In this limit, relaxation is
governed by the evolution of the system through an energy landscape with a
complex hierarchy of local minima similar to that of spin-glasses. It is worth noticing
that in contrast with the static energy barrier distribution arising only from the
anisotropy contribution, the reversal of one particle moment may change the energy
barriers of the assembly, even in the weak interaction limit. Therefore, the energy
barrier distribution may evolve as the magnetization relaxes.
Three models have been developed to introduce particle interaction:
- Shtrikmann and Wohlfarth
For a weak interaction limit, the relaxation time is
⎟⎟⎠
⎞⎜⎜⎝
⎛−
=)(
exp0
0 TTkE
BB
Bττ (1. 23)
Where TB is the blocking temperature and T0 is an effective temperature which
accounts for the interaction effects.
- Dormann et al
This model correctly reproduces the variation of the blocking temperature TB, as a
function of the observation time window of the experiment, τm, at least in a range of
time covering eight decades. The increase of TB with the strength of the dipolar

Advanced Nanomaterials ; H.Hofmann, Version 2011
27
interactions (e.g. increasing particle concentration or decreasing particle distances)
has been predicted by this model and also experimentally confirmed.
- Morup and Tronc
For the weak interaction limit, the opposite dependence of TB with the strength of the
interactions is predicted. Morup suggested that two magnetic regimes, governed by
opposite dependencies of TB, occur in interacting fine particles. At high temperatures
and/or for weak interactions, TB signals the onset of a blocked state and TB
decreases as the interactions increase. In contrast, at high temperatures and/or for
strong interactions, a transition occurs from an SPM state to a collective state which
shows most of the features of typical glassy behaviour. In this case, TB is associated
with a freezing process and it increases with the interactions.
Non-equilibrium dynamics, showing ageing effects in the relaxation of the residual
magnetization, have been observed in interacting fine-particle assemblies, but some
important differences with spin-glasses have been established. In the last few years,
several works demonstrated that for concentrated frozen ferrofluids and assemblies
of nanoparticles dispersed in a polymer, the relaxation depends on the waiting time,
tw, spent at constant temperature before the magnetic field is changed (Figure 1-10).

Advanced Nanomaterials ; H.Hofmann, Version 2011
28
Figure 1-10 : The relaxation rate S versus log10(t) at different wait times for the concentrated sample
(a) and for the most diluted sample (b). The measurements were performed on a ferrofluid consisting
of closely spherical particles of maghemite with a mean diameter of 7 nm. [X. Batle, A. Labarta, Finite-
size effects in fine particles: magnetic and transport properties, Journal of Physics, 2002, ppR15-R42].
This phenomenon is absent in the most diluted samples, confirming that it is due to
dipole–dipole interactions (Figure 1-10). Ageing effects on the magnetic relaxation
are the fingerprint of the existence of many minima in the phase space. However, a
complex hierarchy of energy minima is not an exclusive feature of spin-glasses and
ageing has also been found in other cluster-glass systems not having a true phase
transition. In fact, the non-equilibrium dynamics of interacting fine particles largely
mimics the corresponding of spin-glasses, including ‘memory experiments’ in which
ageing is studied at different heating or cooling rates and/or cycling the temperature.
The main differences between the dynamics of canonical spin-glasses and that of
fine particles are:
• the dependence of the magnetic relaxation on tw is weaker than in spin-
glasses
• in the collective state, the relaxation times are widely distributed and strongly
dependent on temperature
• large particles are blocked in all time scales acting as a temporary random
field and not taking part in the collective state of the system.
Another feature that differentiates the low-temperature collective state from the spin-
glass one is its extreme sensitivity to the application of an external magnetic field. In
particular, it has been shown that the collective state of strong interacting particles
can be erased by a field-cooling process with an applied magnetic field of moderate
strength which yields an asperomagnetic state. It has also been demonstrated that
the dynamics of these systems are strongly affected by the initial magnetic moment
configuration, in such a way that the collective state determines the dynamic
behaviour only in low-cooling-field experiments, while at high cooling fields the
dynamics are mostly dominated by the intrinsic energy barriers of the individual
particles.

Advanced Nanomaterials ; H.Hofmann, Version 2011
29
1.3.4.4 Surface effects
Surface effects result from the lack of translational symmetry at the boundaries of the
particle because of the lower coordination number there and the existence of broken
magnetic exchange bonds which lead to surface spin disorder and frustration.
Surface effects dominates the magnetic properties of the smallest particles since
decreasing the particle size increases the ratio of surface spins to the total number of
spins. For example, for fcc Co with a lattice constant of 0.355 nm, particles having
about 200 atoms will have diameters around 1.6 nm and 60% of the total spins will be
at the surface. This represents more than half of the spins. Consequently, the ideal
model of a superspin formed by all the spins of the particle pointing in the anisotropy
direction and coherently reversing due to thermal activation is no longer valid, since
misalignment of the surface spin yields strong deviations from the bulk behaviour.
This is true, even for particles with strong exchange interactions such as many
ferrimagnetic oxides with magnetically competing sublattices, since broken bonds
destabilize magnetic order giving rise to frustration which is enhanced with the
strength of the interactions. As a consequence of the combination of both finite-size
and surface effects, the profile of the magnetization is not uniform across the particle
and the magnetization of the surface layer is smaller than that corresponding to the
central spins.
Many experimental results for metallic and oxide particles indicate that the anisotropy
of fine particles increases as the volume is reduced because of the contribution of
what is known as surface anisotropy. For instance, the anisotropy per unit volume
increases by more than one order of magnitude for 1.8 nm fcc Co particles being
3×10⁷ erg cm−3 compared with the bulk value of 2.7×10⁶ erg cm−3. Even an
anisotropy value one order of magnitude larger than the preceding case has been
reported for Co particles embedded in a Cu matrix. In fact, surface anisotropy has a
crystal-field nature and it comes from the symmetry breaking at the boundaries of the
particle. The structural relaxation yielding the contraction of surface layers and the
existence of some degree of atomic disorder and vacancies induce local crystal fields
with predominant axial character normal to the surface, which may produce easy-axis
or easy-plane anisotropies. This can be justified by noting that the axis of the local
crystal field, ^n , may be evaluated from the dipole moment of the nearest-neighbour
atomic positions with respect to the position of a given surface atom as follows:

Advanced Nanomaterials ; H.Hofmann, Version 2011
30
∑ −∝nn
jiji PPn )(
^ (1. 24)
Where Pi is the position of the ith atom and the sum extends to the nearest
neighbours of this atom. Since at the surface some of the neighbours are missing, in^
is non-zero and directed approximately normal to the surface. The effect of these
local fields is obtained by adding a term of the form 2ξKS , where Sς is the component
of the spin along a vector normal to the surface and, K < 0 corresponds to the easy-
axis case and K > 0 to the easyplane one. When |K| is comparable to the
ferromagnetic exchange energies, spin configurations like those shown in Figure
1-11 are obtained. These result from the competition of surface anisotropy and
ferromagnetic alignment. Another kind of surface anisotropy was suggested that
treated acicular particles of γ -Fe2O3 as infinite cylinders possessing uniaxial
anisotropy parallel to the surface of the cylinder. In general, the surface anisotropy
makes the surface layer magnetically harder than the core of the particle.
Figure 1-11 : Surface spin arrangement of a ferromagnetic particle with a surface anisotropy of the
form 2ξKS . Both cases corresponding to K <0 (radial) and K >0 (tangential) are displayed. [X. Batle, A.
Labarta, Finite-size effects in fine particles: magnetic and transport properties, Journal of Physics,
2002, ppR15-R42].
The second contribution due to the existence of boundaries is a consequence of
strains related to lattice deformations occurring at the surface, which through
magnetostriction effects induce an additional surface anisotropy. Strain anisotropy
has been observed in thin films because of stresses induced at the interface between

Advanced Nanomaterials ; H.Hofmann, Version 2011
31
substrate and film due to non-matching lattice constants. Depending on the structural
deformations and the nature of the thin films, strain anisotropy could yield
perpendicular anisotropy to the film plane, as has been observed in as-prepared thin
films of heterogeneous Co(Fe)–Ag(Cu) alloys. However, for the majority of the
nanoparticle systems, the strain energy is weak, it being difficult to give a general
formulation, and, in particular, for free particles it is negligible.
An effective anisotropy energy per unit volume, Keff, could be obtained by adding the
core (i.e. bulk anisotropy) and surface contributions. For a spherical particle the
following phenomenological expression has been used to account for Keff:
Sbeff Kd
KK 6+= (1. 25)
Where Kb is the bulk anisotropy energy per unit volume, Ks is the surface density of
anisotropy energy and d is the diameter of the particle. It is worth noticing that for a
spherical particle and based on symmetry arguments, surface anisotropy (normal to
the surface) would average to zero. However, this is not true for a nanometric particle
with a few atomic layers. For instance, applying equation Sbeff K
dKK 6
+= (1.
25) for a 2 nm particle of fcc Co with Kb = 2.7×10⁶ erg cm−3 and Ks ≈ 1 erg cm−2,
the surface contribution to the total anisotropy, Keff , is about 3 × 10⁷ erg cm−3, which
is one order of magnitude larger than the bulk contribution, and Keff = 3.3 × 10⁷ erg
cm−3.
This example is representative of the major role of surface contribution to the total
anisotropy in fine-particle systems, for which the anisotropy energy is governed by
surface anisotropy.
1.4 Magnetoelectronics spins
Spintronics is a multidisciplinary field whose central theme is the active manipulation
of spin degrees of freedom in solid-state systems. The goal of spintronics is to
understand the interaction between the particle spin and its solid-state environments
and to make useful devices using the acquired knowledge.
In this chapter, we will focus on magnetoelectronics materials. Typically they cover
paramagnetic and ferromagnetic metals and insulators which utilize magnetorisistive

Advanced Nanomaterials ; H.Hofmann, Version 2011
32
effects, realized, e.g., as magnetic read heads in computer hard drives, nonvolative
magnetic random access.
1.4.1 Spin-polarized transport and magnetorisistive effects
Some Scientifics sought an explanation for an unusual behaviour of resistance in
ferromagnetic metals. They realized that at sufficiently low temperatures, where
magnon scattering becomes vanishingly small, electrons of majority and minority
spin, with magnetic moment parallel and antiparallel to the magnetization of a
ferromagnet, respectively, do not mix in the scattering processes. The conductivity
can then be expressed as the sum of two independent and unequal parts for two
different spin projections, the current in ferromagnets is spin polarized.
1.4.1.1 Tunneling magnetoresistance (TMR)
Tunneling measurements play a key role in work on spin-polarized transport. It is
important to study N/F/N junctions, where N was a nonmagnetic metal and F was an
Eu-based ferromagnetic semiconductor. These investigations showed that when
unpolarized current is passed across a ferromagnetic semiconductor, the current
becomes spin-polarized.
Ferromagnet / insulator / superconductor (F/I/S) and Ferromagnet / insulator /
Ferromagnet (F/I/F) junctions were studies these last years. F/I/S have proved that
the tunneling current remains spin polarized even outside of the ferromagnetic region
and was used as a detector of spin polarization of conduction electrons. By analysing
the tunnelling conductance from F/I/S to the F/I/F junctions, Jullière (1975) formulated
a model for a change of conductance between the parallel (↑↑) and antiparallel (↑↓)
magnetization in the two ferromagnetic regions F1 and F2, as depicted in Figure
1-12.

Advanced Nanomaterials ; H.Hofmann, Version 2011
33
Figure 1-12 : Schematic illustration of electron tunneling in F/I/F tunnel junctions: (a) Parallel and (b)
antiparallel orientation of magnetizations with the corresponding spinresolved density of the d states in
ferromagnetic metals that have exchange spin splitting ∆ex . Arrows in the two ferromagnetic regions
are determined by the majority-spin subband. Dashed lines depict spinconserved tunneling. [I. Zutic, J.
Fabian, S. Das Sarma, Spintronics: Fundamentals and applications, Reviews of modern physics,
volume 76, 2004, pp 323-410]
The corresponding tunneling magnetoresistance (TMR) in an F/I/F magnetic tunnel
junction (MTJ) is defined as
↑↓
↑↓↑↑
↑↑
↑↑↑↓
↑↑
−=
−=
Δ=
GGG
RRR
RRTMR (1. 26)
Where conductance G and resistance R=1/G are labeled by the relative orientations
of the magnetizations in F1 and F2 (it is possible to change the relative orientations,
between ↑↑ and ↑↓, even at small applied magnetic fields ~10 G). TMR is a particular
manifestation of a magnetoresistance that yields a change of electrical resistance in
the presence of an external magnetic field. Due to spin-orbit interaction, electrical
resistivity changes with the relative direction of the charge current (for example,
parallel or perpendicular) with respect to the direction of magnetization. Assuming
constant tunnelling matrix elements and that electrons tunnel without spin flip,
equation ↑↓
↑↓↑↑
↑↑
↑↑↑↓
↑↑
−=
−=
Δ=
GGG
RRR
RRTMR
(1. 26) yields

Advanced Nanomaterials ; H.Hofmann, Version 2011
34
21
21
12
PPPP
TMR−
= (1. 27)
Where the polarization Pi is expressed in terms of the spin-resolved density of states
for majority and minority spin in Fi.
1.4.1.2 Applications
While many existing spintronic applications are based on the GMR effects, the
discovery of large room-temperature TMR has renewed interest in the study of
magnetic tunnel junctions, which are now the basis for the several magnetic random-
access memory prototypes. Future generations of magnetic read heads are expected
to use MTJ’s instead of CIP giant magnetoresonance. To improve the switching
performance of related devices it is important to reduce the junction resistance, which
determines the RC time constant of the MTJ cell. Consequently, semiconductors,
which would provide a lower tunneling barrier than the usually employed oxides, are
being investigated both as the nonferromagnetic region in MTJ’s and as the basis for
an all-semiconductor junction that would demonstrate large TMR at low
temperatures.
1.5 Giant Magnetoresistance (GMR)
1.5.1.1 Origin of the GMR effect
For a macroscopic electrical conductor the resistance R is given by R=P/A, which is
independent of shape, cross section and above all the scattering process involved
therein. Especially, electron-electron and electron-proton scattering process bring the
out-of-equilibrium distribution of accelerated electrons back to the equilibrium
distribution thereby contribution to resistance. This usual picture loses its validity
when the dimension of the material becomes of the order of relevant collision-mean-
free path ( λ ). Now for an elastic scattering process the conductivity due to spin up
and spin down electron is given by
1 2σ σ σ= + (1. 28)
For an elastic scattering processiv
For the occurrence of the GMR effect it is crucial that the angles between the
magnetization directions of the ferromagnetic layer can be modified by the application

Advanced Nanomaterials ; H.Hofmann, Version 2011
35
of an applied magnetic field, the electron scattering probability at the interfaces or
within the bulk of the layers is spin-dependent, and in the case of parallel
magnetizations, the layer averaged electron mean-free path for (at least) one spin
direction is larger than the thickness of the non-magnetic spacer layer.
Now, each layer in a GMR- structure acts as a spin selective valve. In case of
parallel-alignment-layer the contribution towards conductance due to spin up electron
is highly leading to higher valve of total conductance. However, for antiparallel
alignments the magnetic layers results in appreciable scattering for electrons in both
spin direction and hence a lower total conductance. If the F layers are much thinner
than λ↑ the spin up conductance in the parallel magnetization state is limited by
strong spin-dependent scattering in the buffer layer and in the AF layer. The contrast
with spindown conductance can then be enhanced by increasing the F-layer
thickness. It is to be noted that only a part of F-layer which is of the order of λ↑/2 from
the interface responds to the above situation.

Advanced Nanomaterials ; H.Hofmann, Version 2011
36
(a) (b) (c)
cap layer
AF
F(pinned)NM
F(free)buffer layer
substrate
F(free)
F(pinned)NM
substrate
cap layer
AFbuffer layer
cap layer
AF
F(pinned)NM
F(free)
NM
F(pinned)
AF
buffer layer
substrate
R/R
sat (%
)
free F-layer thickness (nm)
0 20 40 60
8
6
4
2
0 12 10
8
6
4
2 0
(a) 293 K
(b) 5 K
R/R
sat (%
)
Figure 1-13 : Dependence of the MR ratio on the free magnetic layer thickness, measured at 293 K
(a) and at 5K (b), for (X/Cu/X/Fe50Mn50) spin valves, grown on 3nm Ta buffer layer on Si(100)
substracts, with X=Co (squares), X=Ni66Fe16Co18 (traingles) and (X= Ni80Fe20) (+), measured at 5K.
Layer thickness: tCu = 3nm (but 2.5 for F=(X= Ni80Fe20); tF(pinned layer)=5nm (but 6nm for F=
Ni66Fe16Co18)v.
Requirements for F/N combinations with a high GMR ratio are:

Advanced Nanomaterials ; H.Hofmann, Version 2011
37
• the F and N materials possess, for one spin direction, very similar electronic
structures, whereas for the other spin direction the electronic structures are
very dissimilar,
• the electron transmission probability (transmission without diffusive scattering)
through the F/N interfaces is large for the type of electrons for which the
electronic structure in the F and N layers are very similar,
• and the crystal structures of the F and N materials match very well.
1.5.1.2 Thermal stability
A number of factors control the use and processing of exchange-biased spin-
valve layered structures at elevated temperatures:
• Exchanging biasing field decreases with increasing temperature. For some
exchange biasing materials this effect determines the temperature range
within which sensors can be applied.
• The induced magnetocrystalline anisotropy of the free layer may be affected
by heating the material.
• As multilayers are thermodynamically metastable system the enhanced
diffusion rates during annealing will inversibly degrade the layered structure.
Diffusion may also affect the effective coupling between the layers. There are
three contributions in interlayer coupling:
• Coupling via ferromagnetic bridges between the ferromagnetic layers.
• The mangetostatic Neel-type coupling.
• Interlayer exchange coupling.
1.5.1.3 Factors determining the switching field interval
1.5.1.3.1 Induced magnetic anisotropy
This is believed to be due to the result of a very small degree of divertional pair order
of atom a in the otherwise random solid solution. The anisotropy field depends upon
the composition, the layer thickness, and the material between which the layers are
sandwiched. In case of a GMR spin valve the anisotropy effect is relevant for the
thickness below 15 nm. The effect is most likely due to a region with a decreased
degree of pair order situated in the ferromagnetic layer close to the interface with the
buffer layer.
Advanced Nanomaterials ; H.Hofmann, Version 2011
38
The result shows that addition of Co to permalloy is unfavourable as far as switching
field interval is concerned. But one of the advantages is that the range of linear
operation of GMR sensor elements is improved. Annealing the sample can affect the
anisotropy field. It is often necessary to anneal the sample after decomposition in a
magnetic field that is directly perpendicular to field direction during growth, in order to
rotate the exchange direction over an angle of 90o. This leads to cross anisotropy
configuration. Therefore it is suggestive to anneal with the field parallel to the induced
anisotropy before annealing briefly with perpendicular field. On the other hand strain
results in an additional magnetocrystalline anisotropy due to magnetostriction. So for
sensor element coefficient of magnetostriction should be small. Ni66Co18Fe16 alloy is
a good candidate for application in GMR sensor elements.
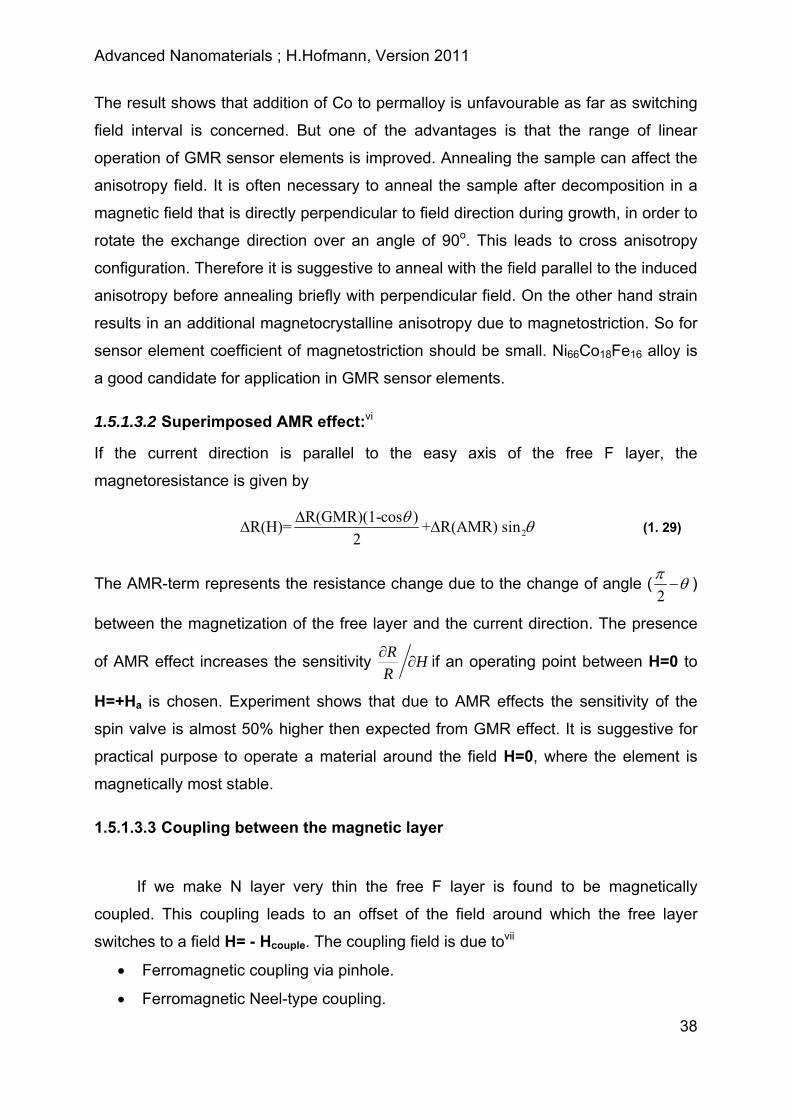
1.5.1.3.2 Superimposed AMR effect:vi
If the current direction is parallel to the easy axis of the free F layer, the
magnetoresistance is given by
2R(GMR)(1-cos )R(H)= + R(AMR) sin
2θ θΔ
Δ Δ (1. 29)
The AMR-term represents the resistance change due to the change of angle (2π θ− )
between the magnetization of the free layer and the current direction. The presence
of AMR effect increases the sensitivity R HR
∂∂ if an operating point between H=0 to
H=+Ha is chosen. Experiment shows that due to AMR effects the sensitivity of the
spin valve is almost 50% higher then expected from GMR effect. It is suggestive for
practical purpose to operate a material around the field H=0, where the element is
magnetically most stable.
1.5.1.3.3 Coupling between the magnetic layer
If we make N layer very thin the free F layer is found to be magnetically
coupled. This coupling leads to an offset of the field around which the free layer
switches to a field H= - Hcouple. The coupling field is due tovii
• Ferromagnetic coupling via pinhole.
• Ferromagnetic Neel-type coupling.

Advanced Nanomaterials ; H.Hofmann, Version 2011
39
• An oscillatory indirect exchange coupling.
All three contributions are influenced by the microstructure of the material and
hence control of the coupling field requires very good control of the deposition
condition. This issue is very relevant for sensor application. Most of the cases the
coupling field is equal or greater than the anisotropy field. Fortunately, in a sensor
element the resulting shift of the switching field is balanced by:
• Application of a bias magnetic field from a current though an integrated bias
conductor.
• The magnetostatic coupling between the pinned and the free layer which
arises as a result of the stray magnetic field origination from the magnetization
of a pinned layer, which is directly along the long axis of the stripe.
Interlayer coupling influences the switching field interval due to the following
two effects:
• The magnetization of the pinned layer is not quite fixed upon the rotation of
the free layer. This increases the switching field interval. This effect increases
upon an increases of the ratio between the coupling field and the exchange
biasing field.
• Lateral fluctuations in the coupling field increase the switching field interval.
1.5.1.3.4 Exchange biasing
The interaction energy E between the pinned F layer and the
antiferromagnetic layer is given by,
E=-KcbCosθ (1. 30)
Where θ is the angle between the biasing direction and the magnetization of
the pinned F layer. The exchange biasing field varies inversely with the thickness of
the pinned layer.
To obtain exchange biasing the AF layer thickness should generally exceed
critical valve.
In conclusion, we must say that exchange-biased spin valve layered structures
show a combination of properties that are attractive for the application in low field
sensors, such as read head in hard disk and tape recording. For a yoke-type GMR

Advanced Nanomaterials ; H.Hofmann, Version 2011
40
head an output gain of a factor 10 has been obtained compared with a barbar-pole
biased AMR head. The following factors contribute to operational gain:
• Larger MR ratio.
• Larger sheet resistance.
• Larger flux efficiency of the head, due to the small thickness of the magnetic
layer.
Future developments are expected to focus on exchange-biased spin valve
materials with a high thermal stability, on the improvement of the effective softness,
of the free magnetic layer while remaining a high GMR ratio, and on relation between
micromagnetic aspects such as domain wall nucleation and propagation and sensor
noise.
References : W. D Callister, Science et genie des matériaux, Dunod, 2003
K. J Klabunde, Nanoscale Materials in Chemistry, Wiley-Interscience, 2001
X. Batle, A. Labarta, Finite-size effects in fine particles: magnetic and transport properties, Journal of
Physics, 2002, ppR15-R42
I. Zutic, J. Fabian, S. Das Sarma, Spintronics: Fundamentals and applications, Reviews of modern
physics, volume 76, 2004, pp 323-410
i W. A. de Heer et al. Science 265 (1994)1682. ii M. Pellarin, B. Baguenard, J. L. Vialle, J. Lermé, M. Boyer, J. Millar and A. Perez, Chem. Phys. Lett.
217, 349 (1994). iii A. J. Cox, J. G. Louderback, S. E. Apsel, L. A. Bloomfield, Phys. Rev. B49, 12295 (1994). iv N. Mott. Proc. R. Soc, 156 (1936) 368. v Th. G. S. M. Rijks, Layered thin film for sensor applications: magnetoresistance & magnetic
interactions, PhD thesis, Eindhoven University of Technology (1996). vi Th. G. S. M. Rijks, R. Coehoorn & W. J. M. de Jonge, In magnetic Ultrathin films, eds. B. T. Jonker
et al., MRS Symposia Proceedings No.313 (1993) MRS, Pittsburg, pg. 283. vii J.C.S. Kools, Th. G. S. M. Rijks, A. E. M. de Veirman & R. Coehoorn, IEEE Trans. Magn. 31 (1995)
3918.


![L 28 Electricity and Magnetism [5] magnetism magnetic forces applications](https://img.pdfslide.us/doc/110x75/56649db65503460f94aa8390/l-28-electricity-and-magnetism-5-magnetism-magnetic-forces-applications.jpg)