Embed Size (px)
Citation preview
1
MAGNA3
RANGE RELIABILITYINTELLIGENC
E EFFICIENCY
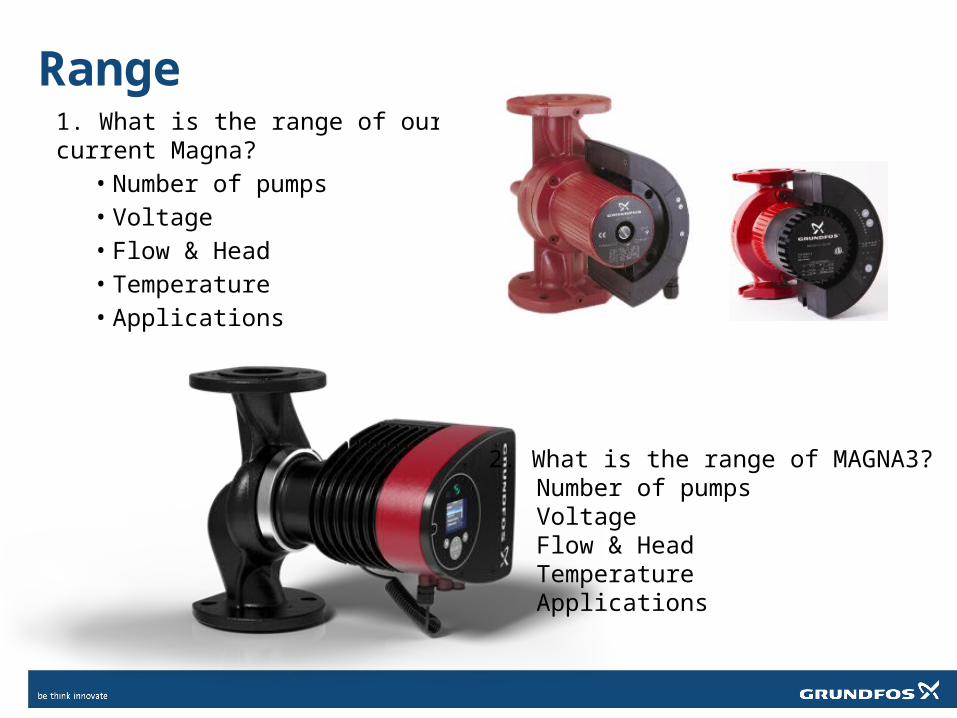
Range1. What is the range of our current Magna?
• Number of pumps• Voltage• Flow & Head• Temperature• Applications
2. What is the range of MAGNA3?Number of pumpsVoltageFlow & HeadTemperatureApplications
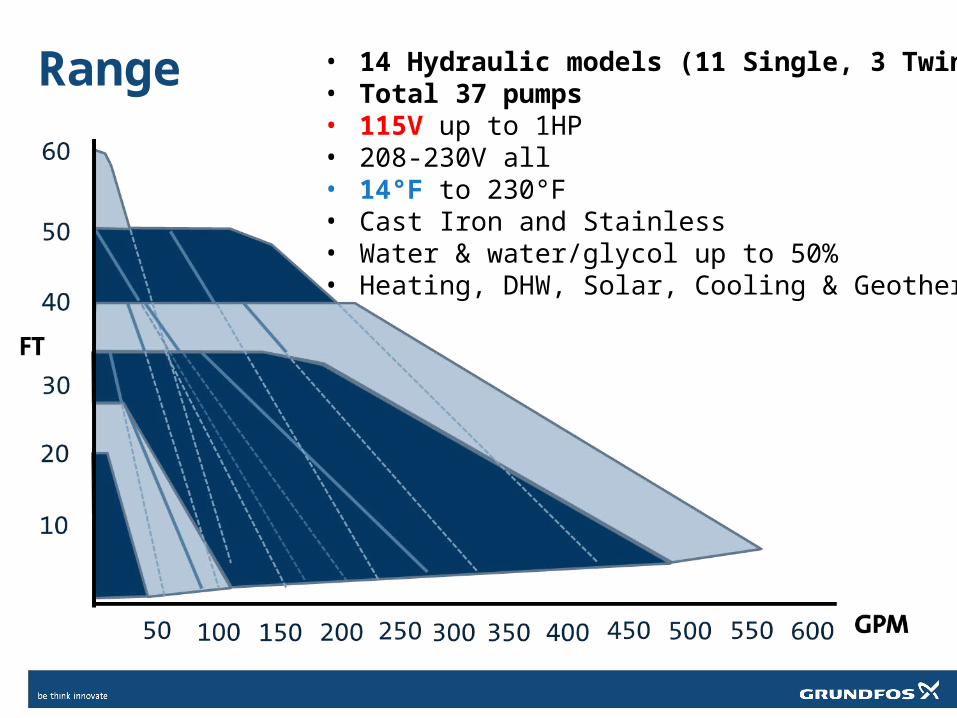
Range • 14 Hydraulic models (11 Single, 3 Twin)• Total 37 pumps• 115V up to 1HP• 208-230V all • 14°F to 230°F• Cast Iron and Stainless• Water & water/glycol up to 50%• Heating, DHW, Solar, Cooling & Geothermal
Reliability
• How long has Grundfos manufactures and sold circulators?
• How many Alphas/Magnas installed?
• What is the percentage warranty rate on Magna?
• Why so reliable?
• When was the project for Magna3 started?
• How many hours have the Magna3 been tested?
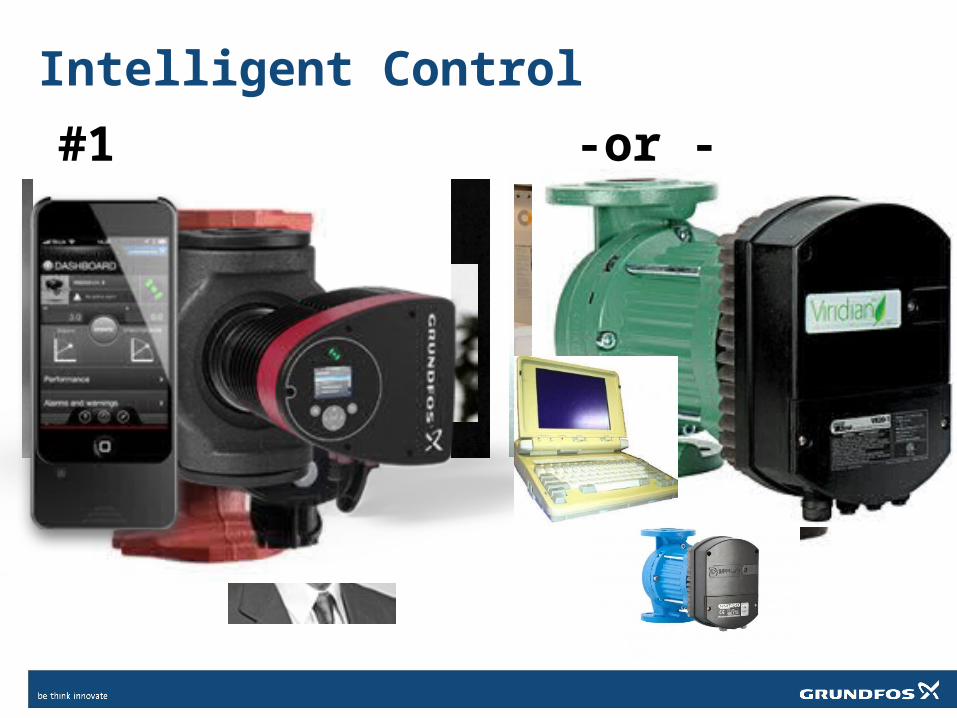
Intelligent Control
#1 -or - #2
H(ft)
P (W)
Q (GPM)
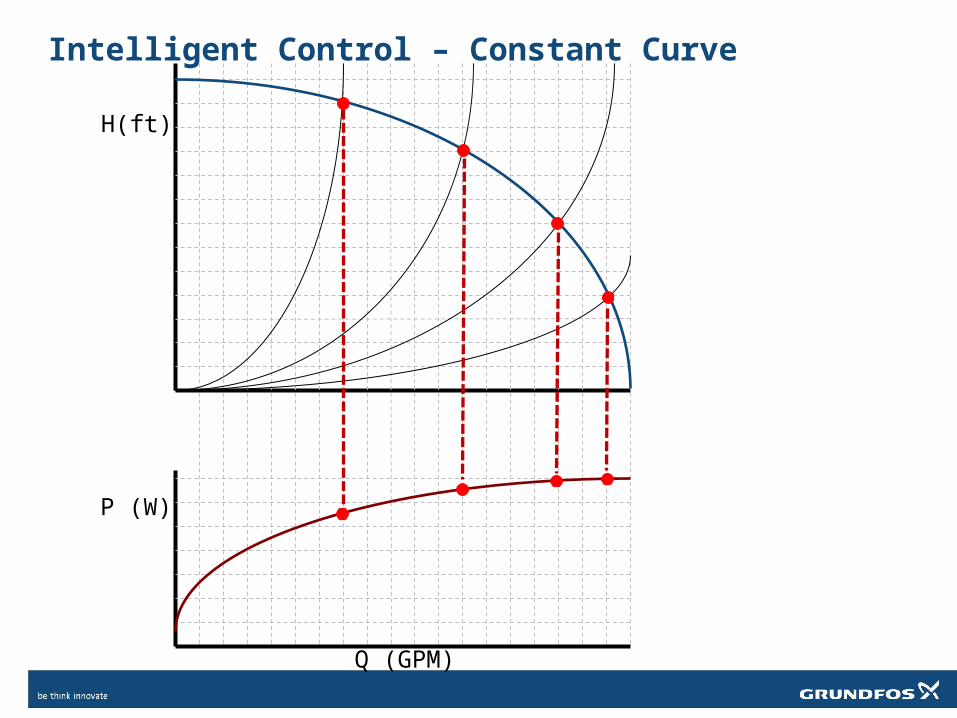
Intelligent Control – Constant Curve
H(ft)
P (W)
Q (GPM)
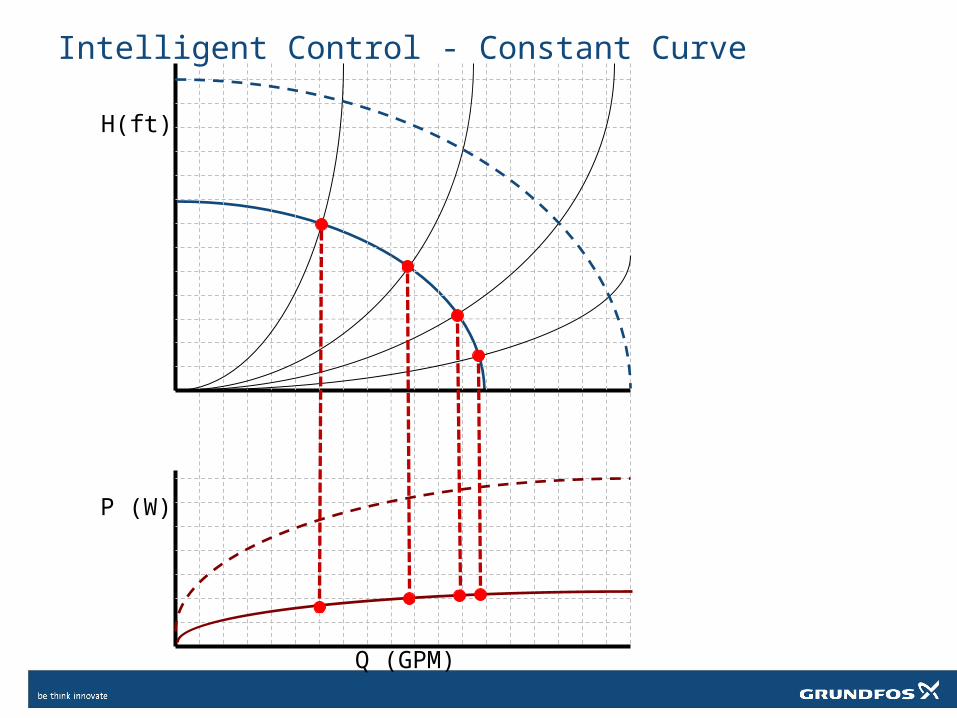
Intelligent Control - Constant Curve
H(ft)
P (W)
Q (GPM)
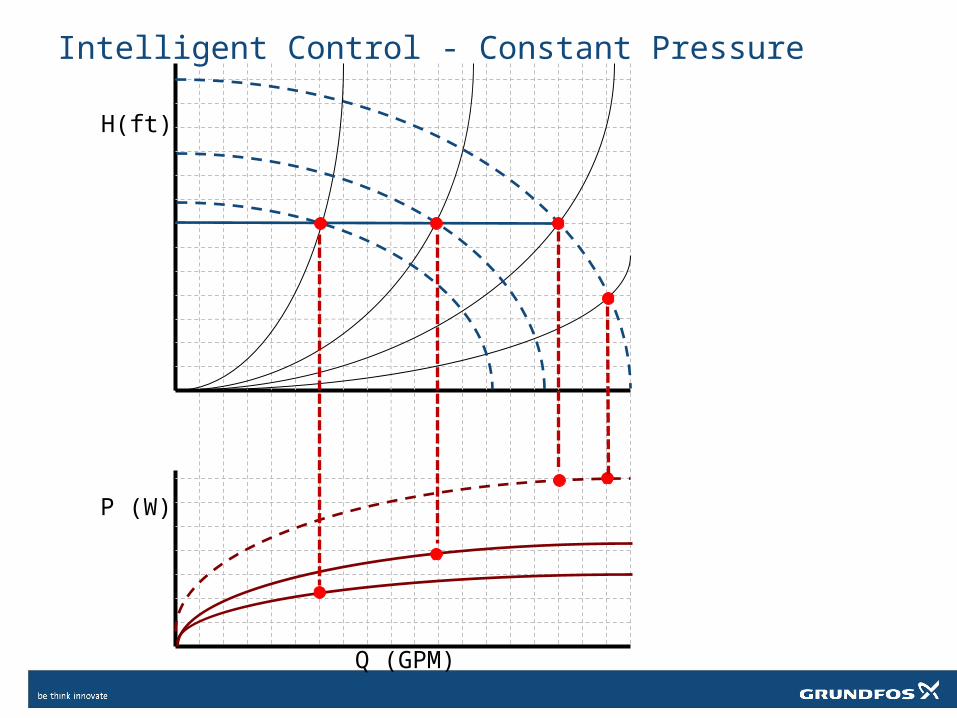
Intelligent Control - Constant Pressure
H(ft)
P (W)
Q (GPM)
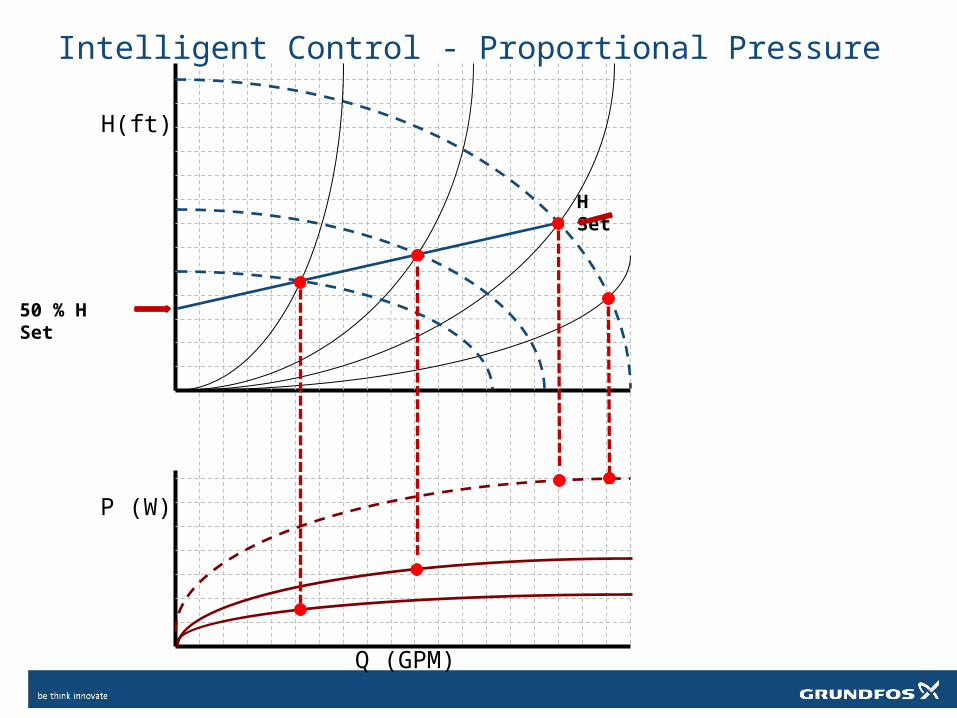
Intelligent Control - Proportional Pressure
50 % H Set
H Set
What is
H(ft)
P (W)
Q (GPM)
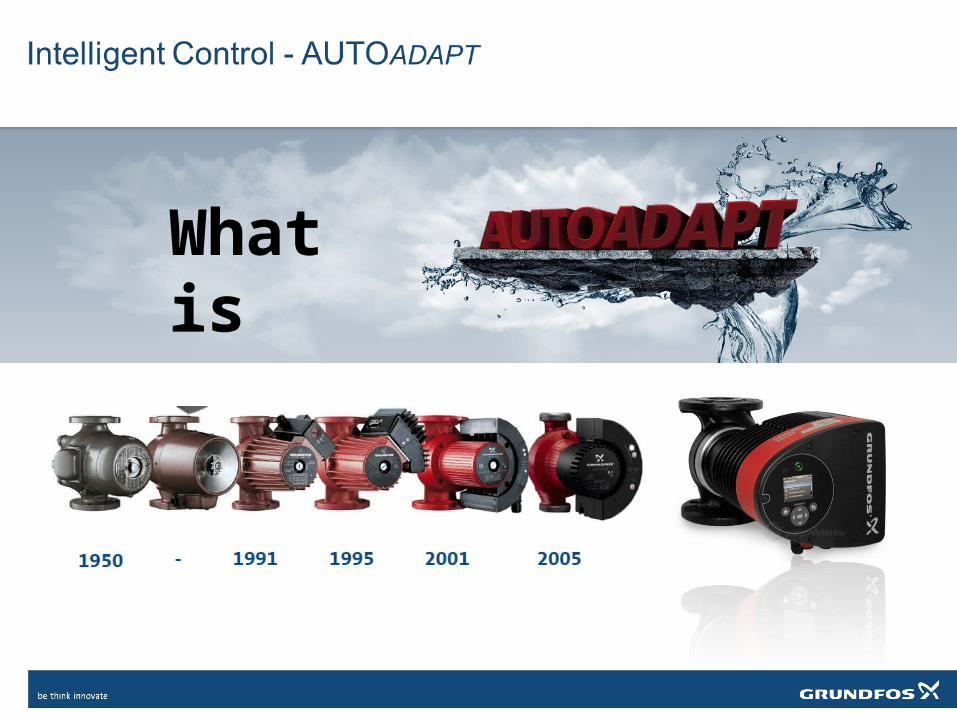
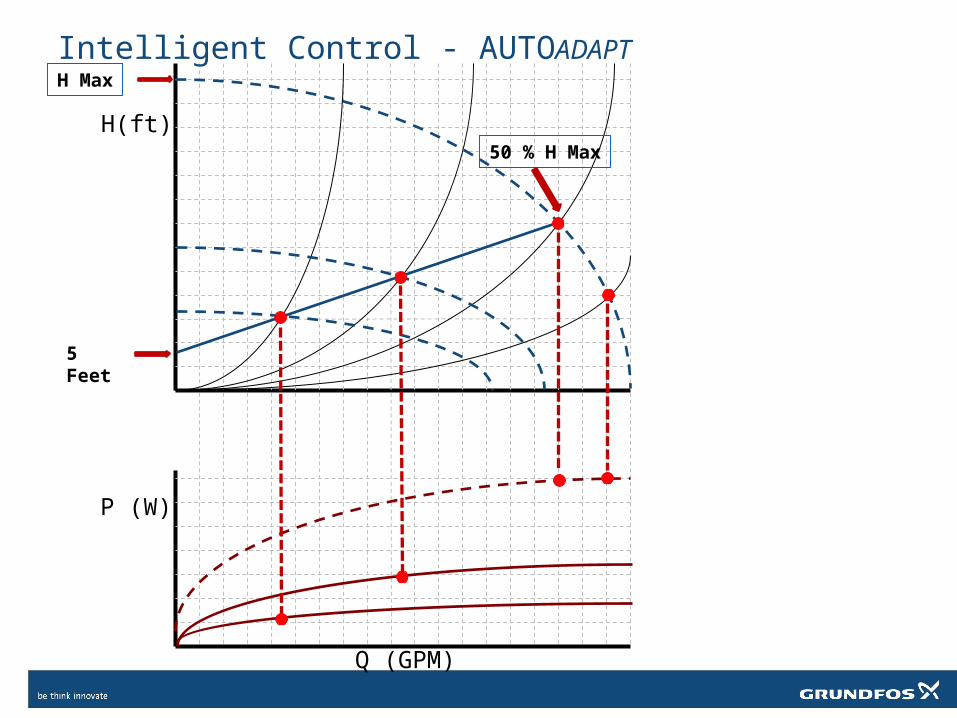
Intelligent Control - AUTOADAPT
5 Feet
50 % H Max
H Max
H(ft)
P (W)
Q (GPM)
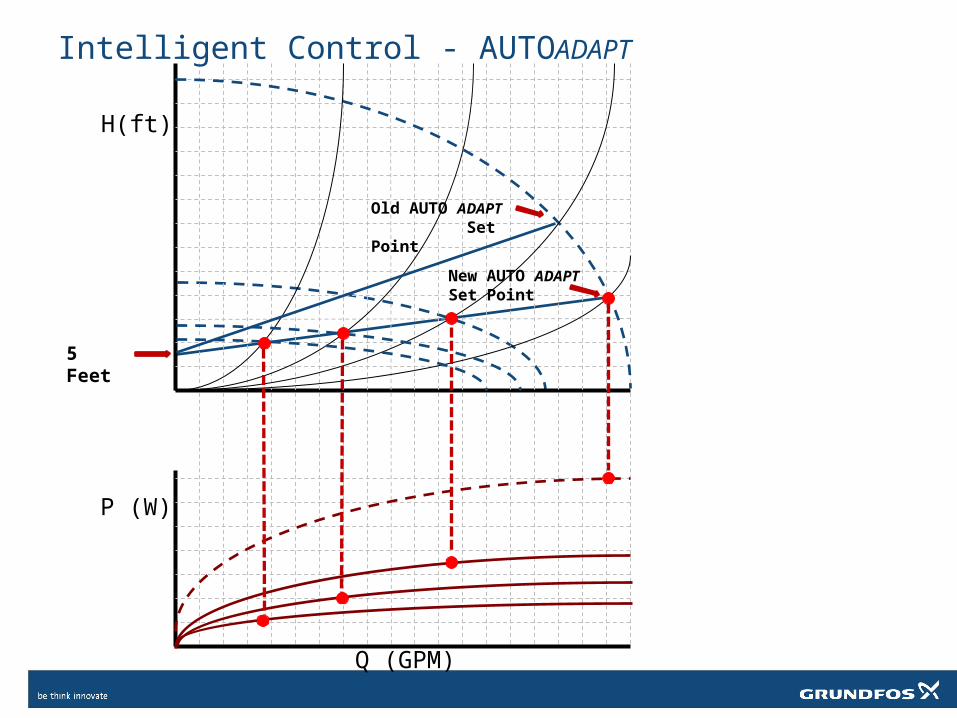
Intelligent Control - AUTOADAPT
5 Feet
Old AUTO ADAPT Set Point
New AUTO ADAPT Set Point
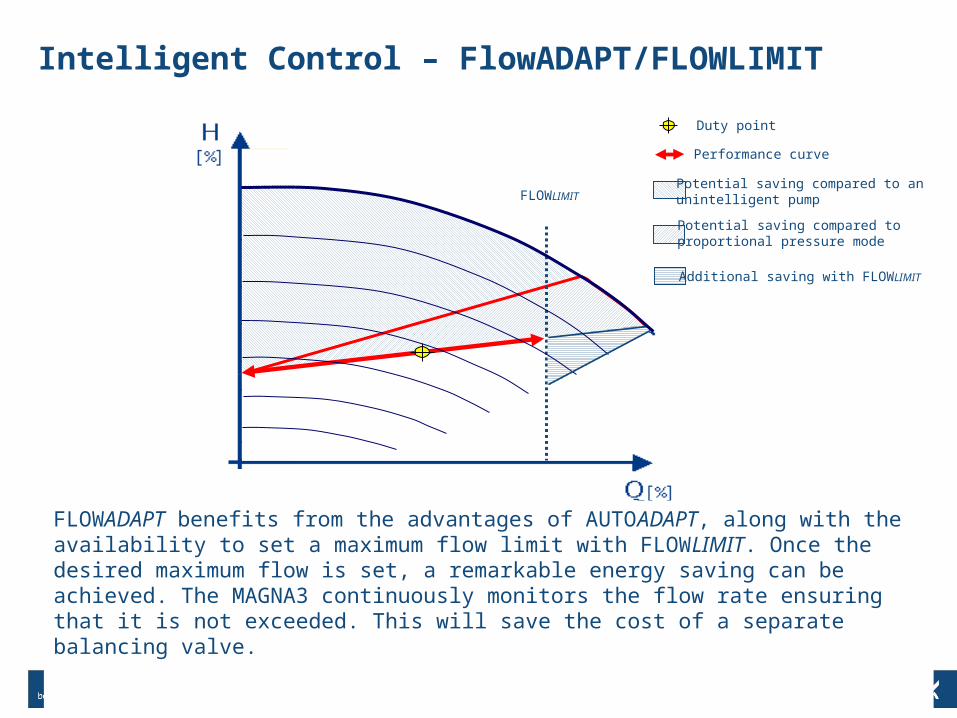
Intelligent Control – FlowADAPT/FLOWLIMIT
Flow Limit
0 25 50 75 100
FLOWLIMIT
FLOWADAPT benefits from the advantages of AUTOADAPT, along with the availability to set a maximum flow limit with FLOWLIMIT. Once the desired maximum flow is set, a remarkable energy saving can be achieved. The MAGNA3 continuously monitors the flow rate ensuring that it is not exceeded. This will save the cost of a separate balancing valve.
Potential saving compared to anunintelligent pump
Potential saving compared to proportional pressure mode
Duty point
Additional saving with FLOWLIMIT
Performance curve
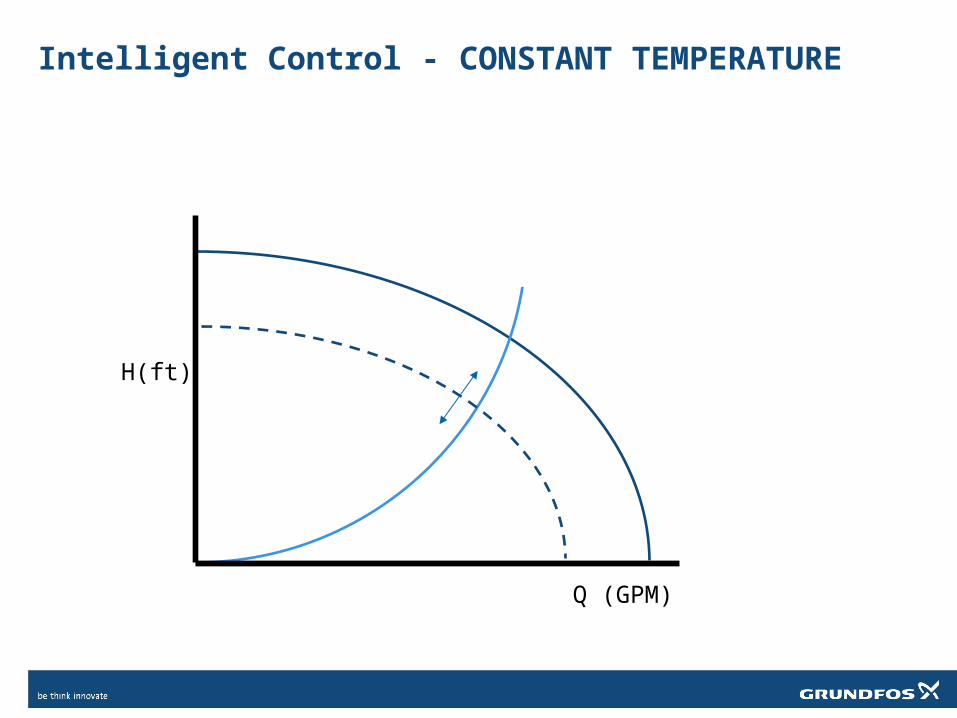
Intelligent Control - CONSTANT TEMPERATURE
H(ft)
Q (GPM)
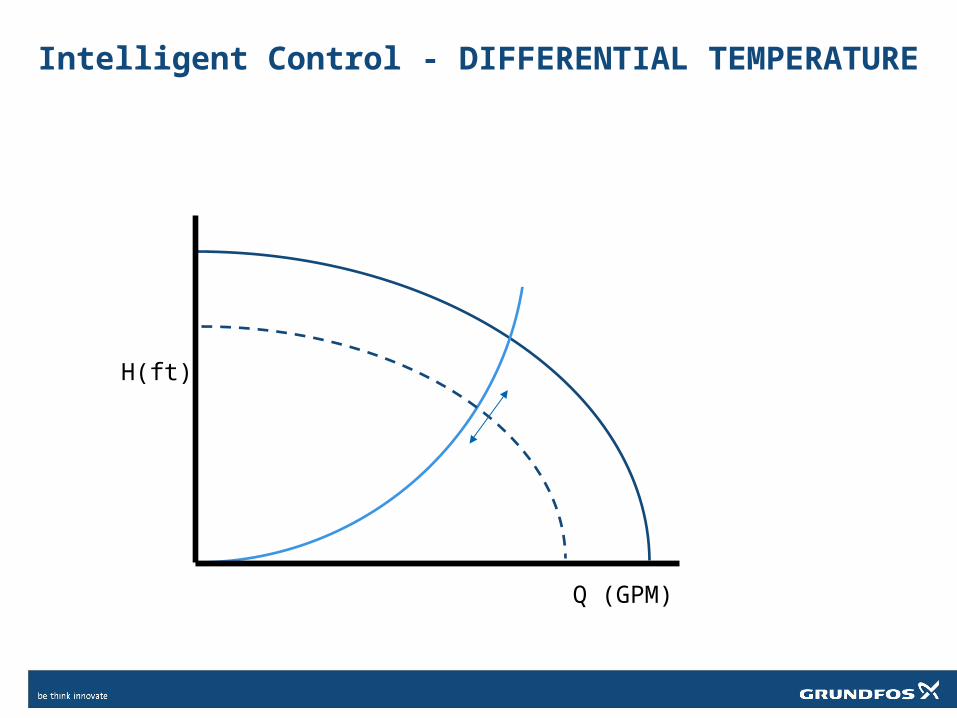
Intelligent Control - DIFFERENTIAL TEMPERATURE
H(ft)
Q (GPM)
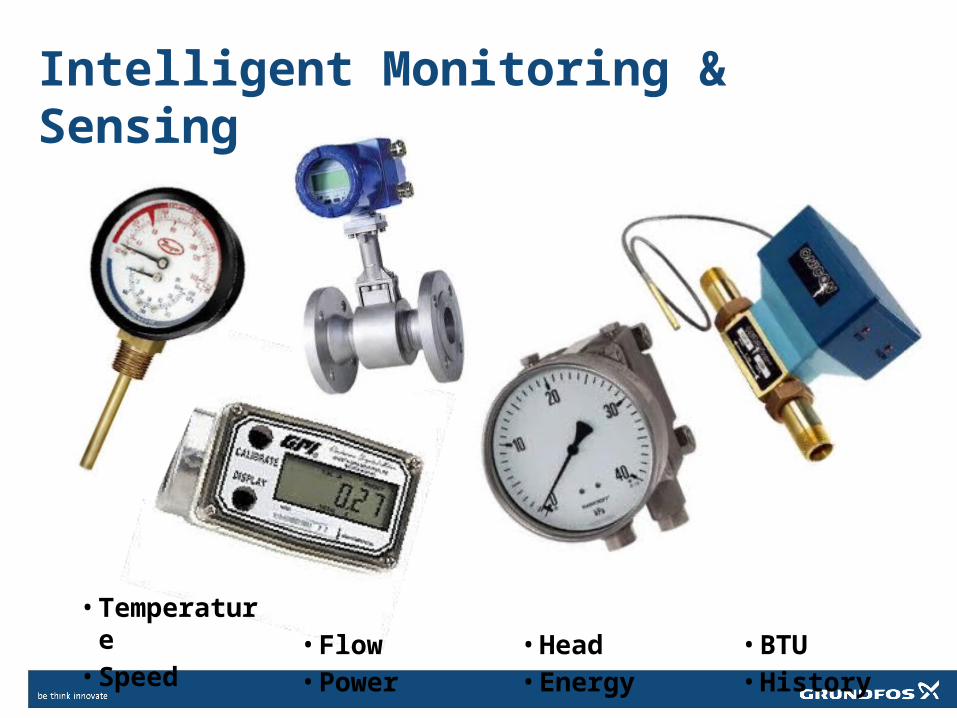
Intelligent Monitoring & Sensing
• Temperature
• Speed• Flow • Power
• Head• Energy
• BTU• History
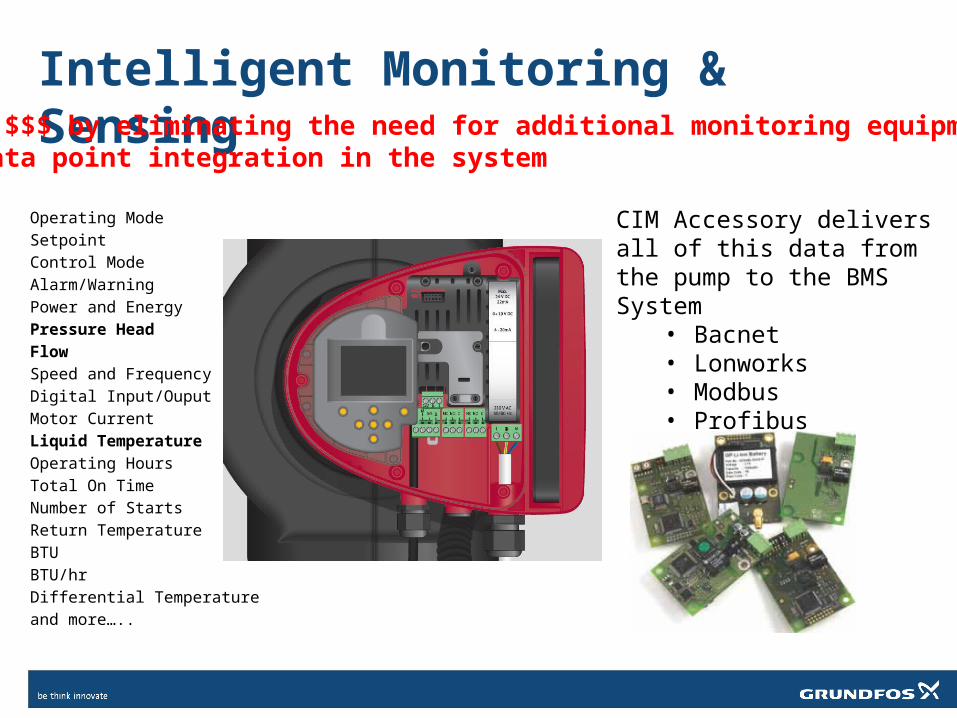
Intelligent Monitoring & Sensing
Operating ModeSetpointControl ModeAlarm/WarningPower and EnergyPressure HeadFlowSpeed and FrequencyDigital Input/OuputMotor CurrentLiquid TemperatureOperating HoursTotal On TimeNumber of StartsReturn TemperatureBTUBTU/hrDifferential Temperatureand more…..
CIM Accessory delivers all of this data from the pump to the BMS System
• Bacnet• Lonworks• Modbus• Profibus
SAVES $$$ by eliminating the need for additional monitoring equipmentand data point integration in the system
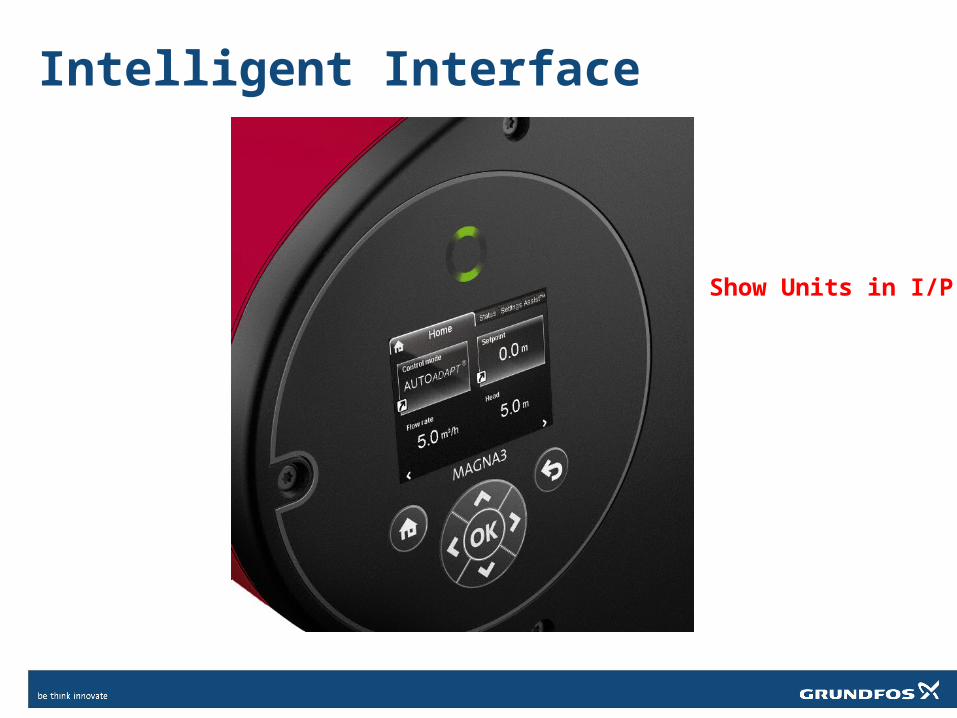
Intelligent Interface
Show Units in I/P
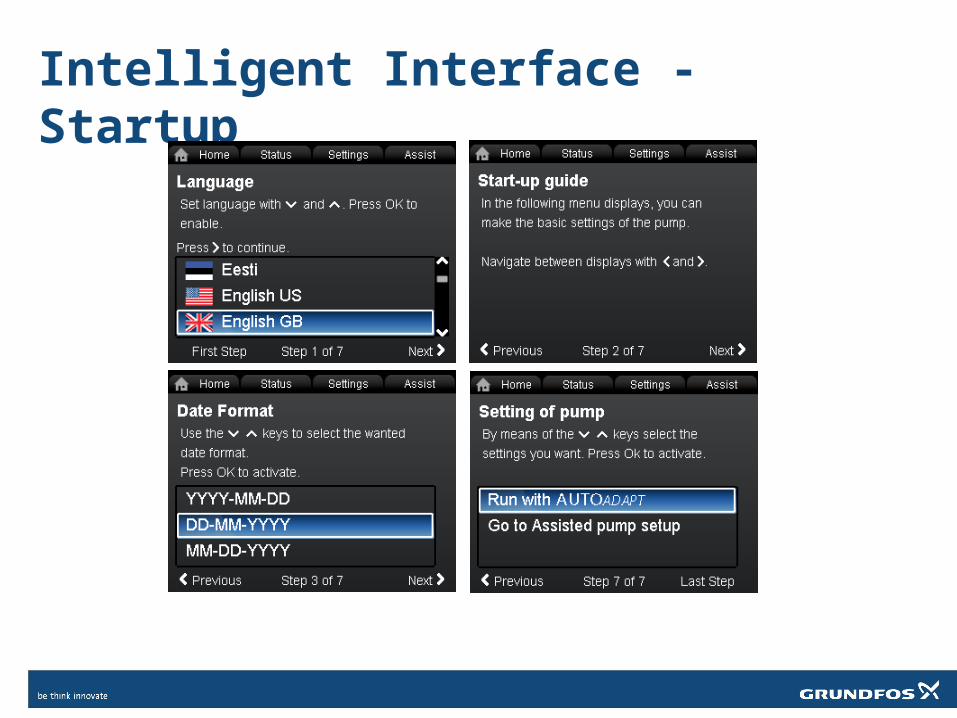
Intelligent Interface - Startup
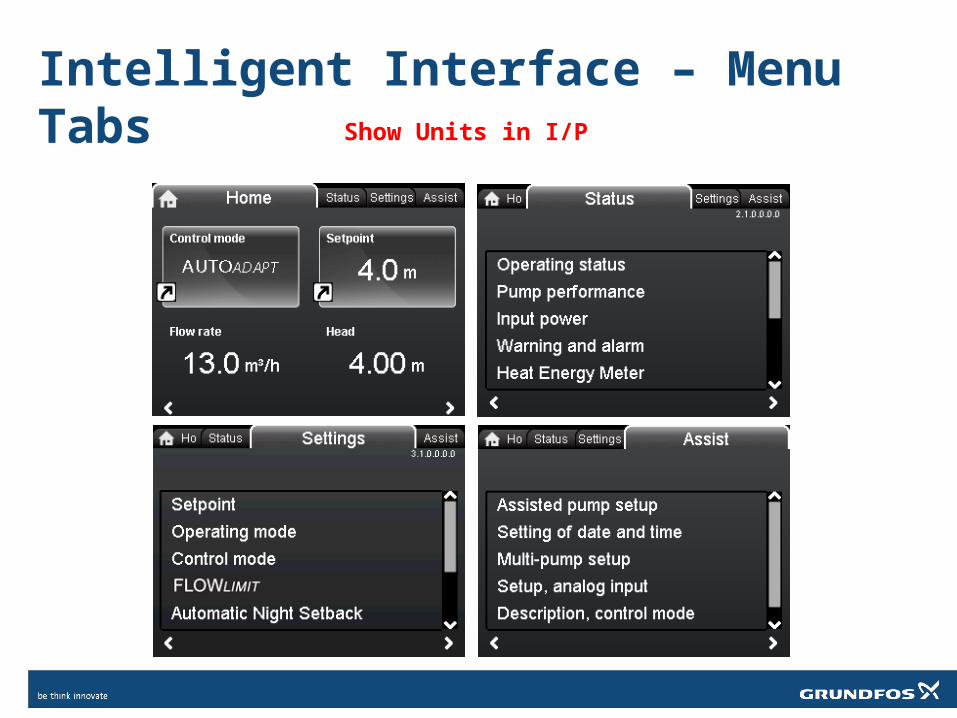
Intelligent Interface – Menu Tabs Show Units in I/P
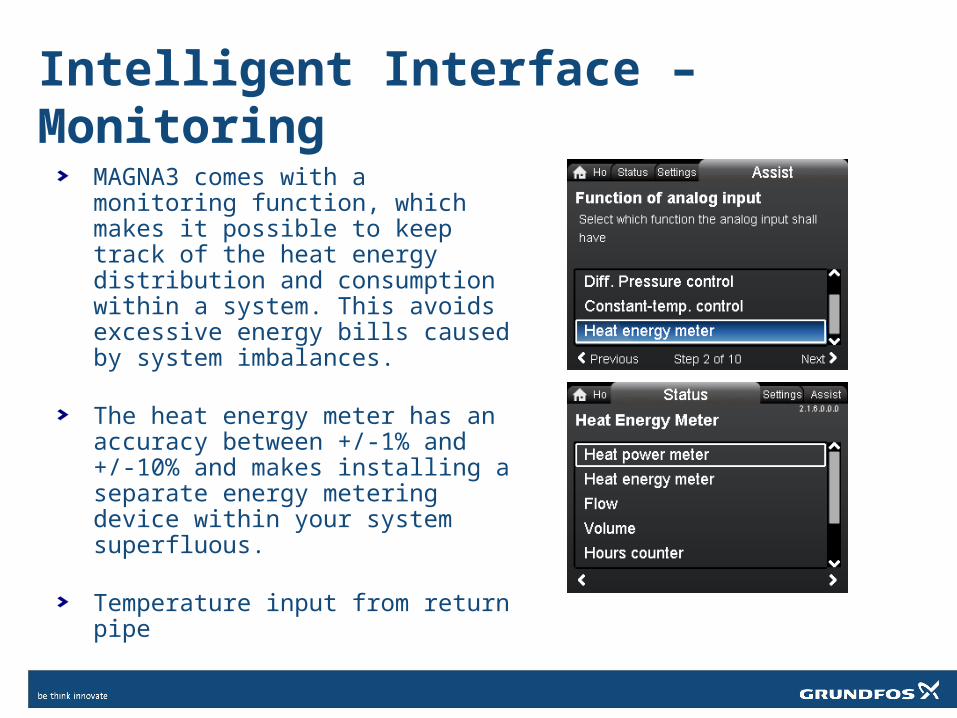
Intelligent Interface – Monitoring
MAGNA3 comes with a monitoring function, which makes it possible to keep track of the heat energy distribution and consumption within a system. This avoids excessive energy bills caused by system imbalances.
The heat energy meter has an accuracy between +/-1% and +/-10% and makes installing a separate energy metering device within your system superfluous.
Temperature input from return pipe
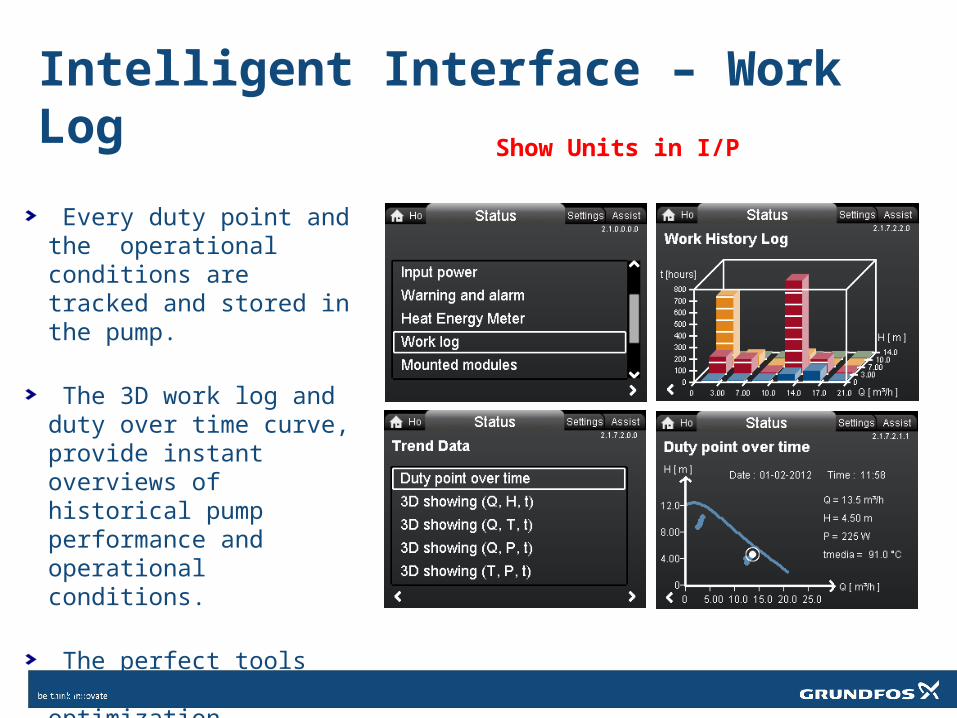
Intelligent Interface – Work Log
Every duty point and the operational conditions are tracked and stored in the pump.
The 3D work log and duty over time curve, provide instant overviews of historical pump performance and operational conditions.
The perfect tools for pump optimization, replacement and troubleshooting.
Show Units in I/P
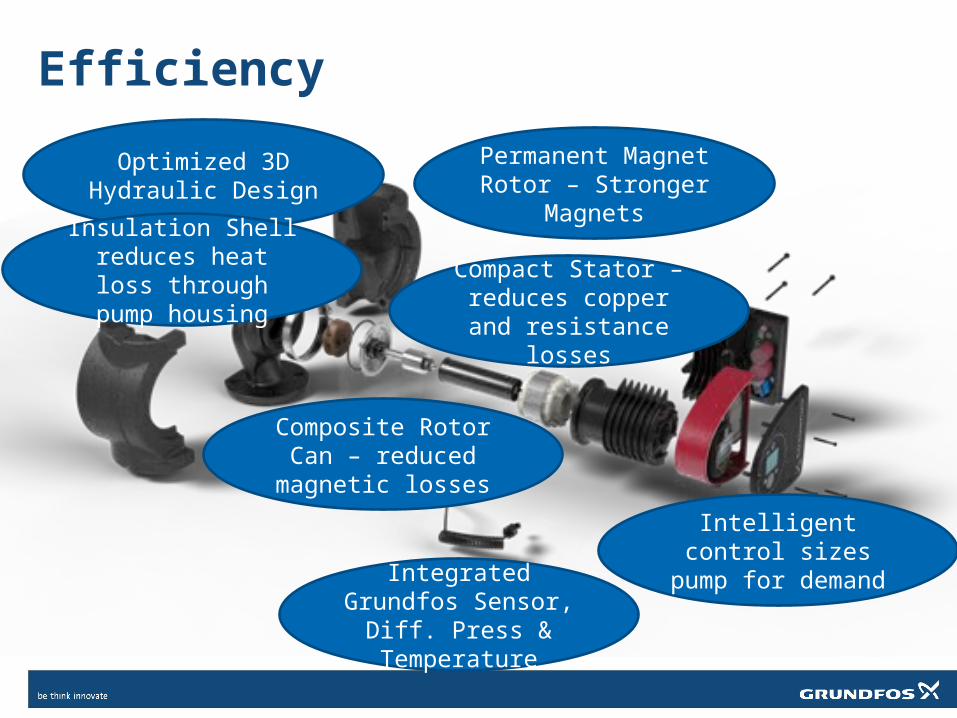
Efficiency
Integrated Grundfos Sensor,
Diff. Press & Temperature
Optimized 3D Hydraulic Design
Permanent Magnet Rotor – Stronger
Magnets
Composite Rotor Can – reduced
magnetic losses
Compact Stator – reduces copper and resistance
losses
Insulation Shell reduces heat loss
through pump housing
Intelligent control sizes pump for
demand
EEI
• What is EEI (Energy Efficiency Indicator)? • When was it adopted?• What is its future?• What does it mean to us (USA)?
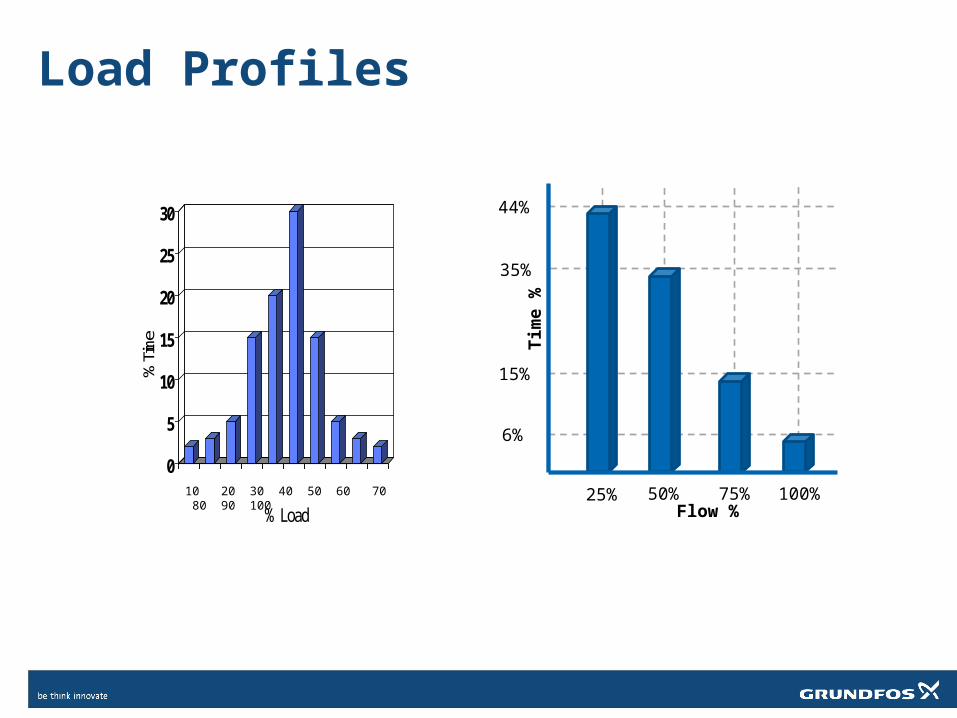
Load Profiles
Flow %Tim
e %
44%
15%
35%
6%
100%75%50%25%0-10 30-40 60-70 90-1000
5
10
15
20
25
30
0-10 30-40 60-70 90-100
% T
ime
% Load 10 20 30 40 50 60 70 80 90
100
Why VFD’s?
What percent of the operating time is the demand on a heating system……
A) 100%?B) 75%?C) 50%?D) 25%?
Why are VFD’s used?
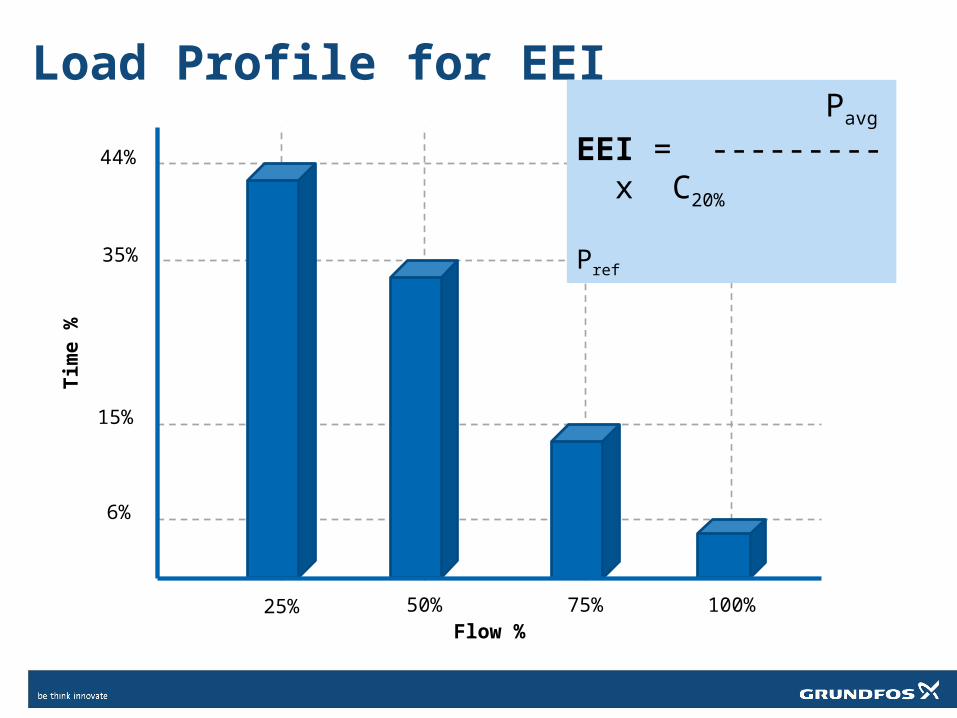
Load Profile for EEI
Flow %
Tim
e %
44%
15%
35%
6%
100%75%50%25%
Pavg
EEI = --------- x C20%
Pref
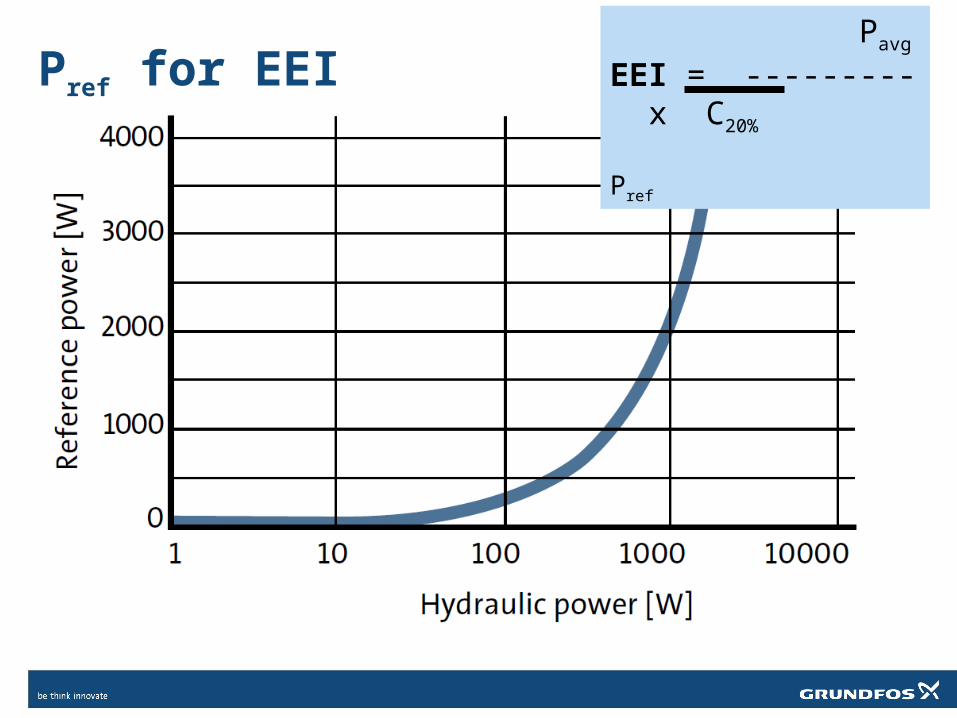
Pref for EEI Pavg
EEI = --------- x C20%
Pref
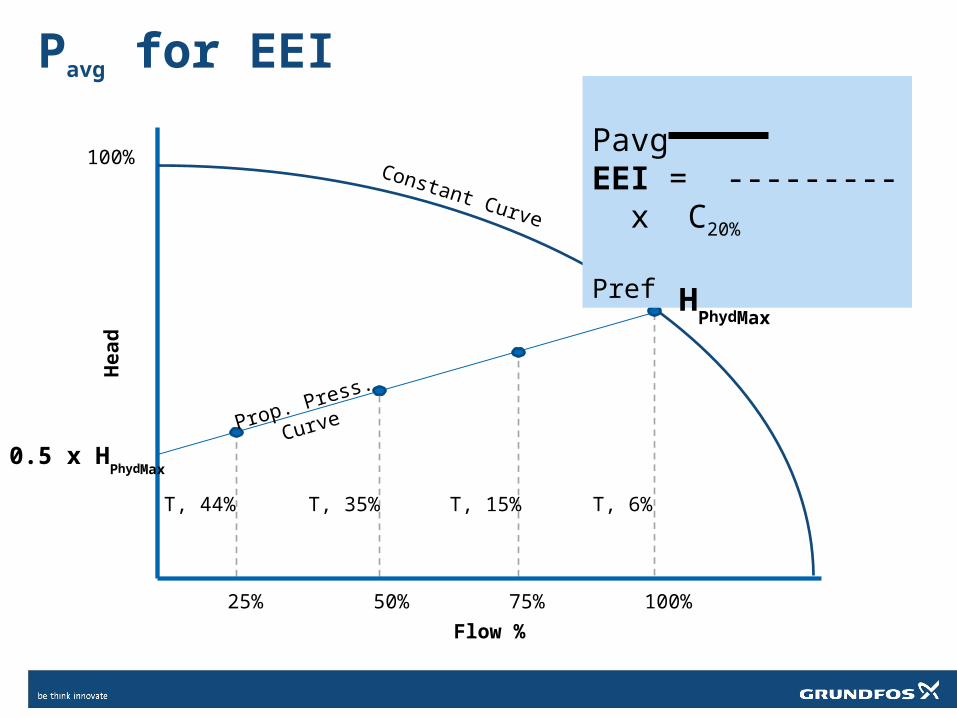
Flow %
Head
100%
100%75%50%25%
T, 44% T, 35% T, 15% T, 6%
Constant Curve
Prop. Press.
Curve
PavgEEI = --------- x C20%
Pref
Pavg for EEI
HPhydMax
0.5 x HPhydMax
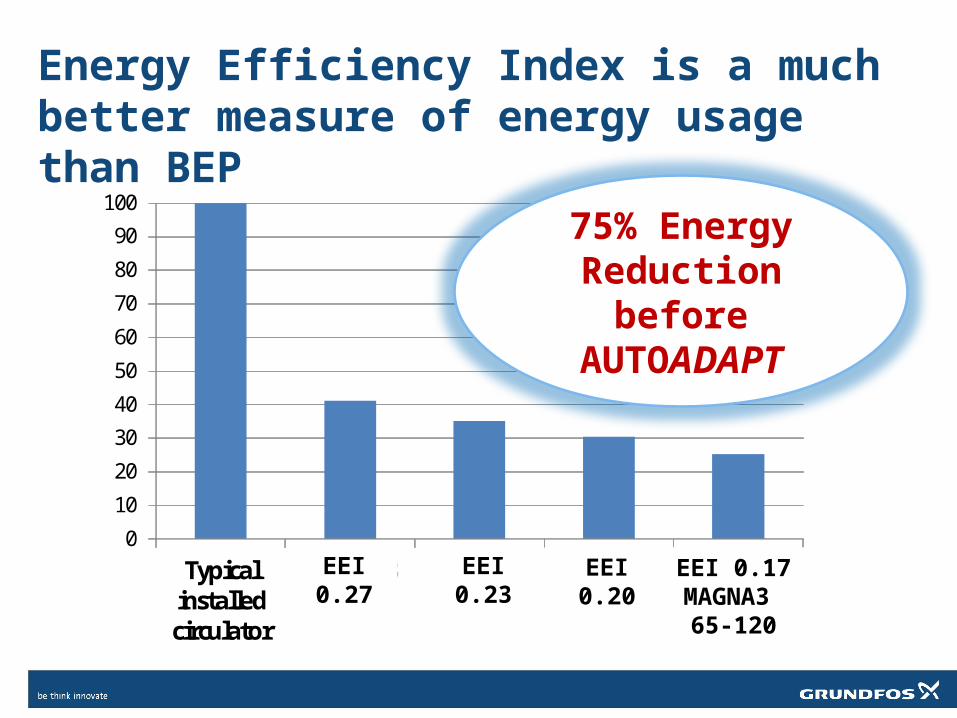
Energy Efficiency Index is a much better measure of energy usage than BEP
0
10
20
30
40
50
60
70
80
90
100
Typicalinstalledcirculator
EuP 2013 EuP 2015 Benchmark MAGNA3EEI 0.27
EEI 0.23
EEI 0.20
EEI 0.17MAGNA3 65-120
75% Energy Reduction
before AUTOADAPT


![Grundfos MAGNA3 50-60 F pump : MAGNA3 50-60 …...Printed from Grundfos Product Centre [2018.02.043] Position Qty. Description 1 MAGNA3 50-60 F Product No.: 97924281 MAGNA3 – More](https://img.pdfslide.us/doc/110x75/5e8d1f12bf688e2a3b040f6a/grundfos-magna3-50-60-f-pump-magna3-50-60-printed-from-grundfos-product-centre.jpg)


![Grundfos MAGNA3 D 100-120 F pump : MAGNA3 D 100-120 F 450 … · Printed from Grundfos Product Centre [2018.02.043] 97924530 MAGNA3 D 100-120 F 50 Hz Note! All units are in [mm] unless](https://img.pdfslide.us/doc/110x75/61185cf2979d46113d102e23/grundfos-magna3-d-100-120-f-pump-magna3-d-100-120-f-450-printed-from-grundfos.jpg)


![Grundfos MAGNA3 25-100 pump - lenntech.com · Printed from Grundfos Product Centre [2018.02.043] Position Qty. Description 1 MAGNA3 25-100 Product No.: 97924247 MAGNA3 – More than](https://img.pdfslide.us/doc/110x75/5baed8da09d3f2d16a8b7670/grundfos-magna3-25-100-pump-printed-from-grundfos-product-centre-201802043.jpg)