Embed Size (px)
Citation preview
Statistical Analysis Made Easy: A Beginner’s Tutorial on How to Use SPSS Software
STEVEN HECHT, PHD
1

Please sign in and include your name and email address in your best handwriting so that I can email you these notes!
2
Get IBM SPSS
You can rent SPSS. Different options depending on the
analysis you want to do and how long you plan to use IBM SPSS
http://www.onthehub.com/spss/
3
Before the data entry
You need a code book/scoring guide You give ID number for each case (NOT real
identification numbers of your subjects) if you use paper survey.
If you use online survey, you need something to identify your cases.
You also can use Excel to do data entry.
4
SPSS Data file (.sav) Has two ScreensData viewThe place to enter dataColumns: variablesRows: records
Variable viewThe place to enter variablesList of all variablesCharacteristics of all variables
5
Before the data entryYou need a code book/scoring
guideYou give ID number for each case
(NOT real identification numbers of your subjects) if you use paper survey.
If you use online survey, you need something to identify your cases.
You also can use Excel to do data entry.
6
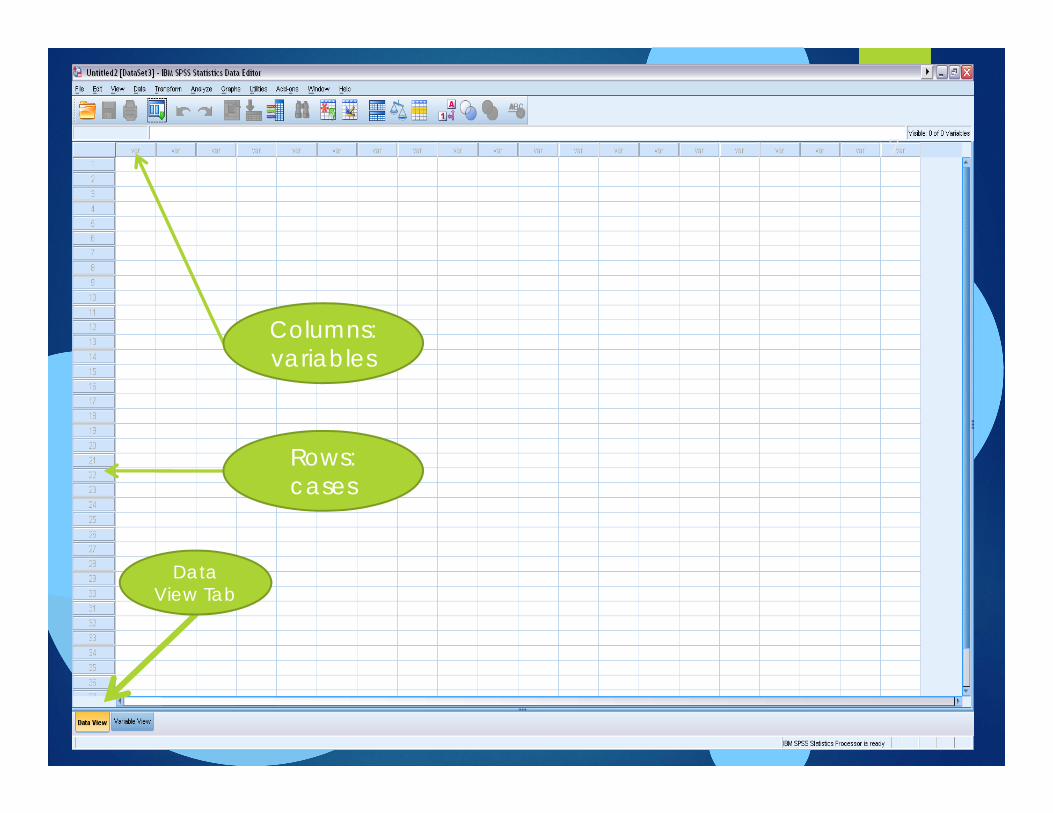
Enter data in SPSS 7
Columns:variables
Rows: cases
Data View Tab
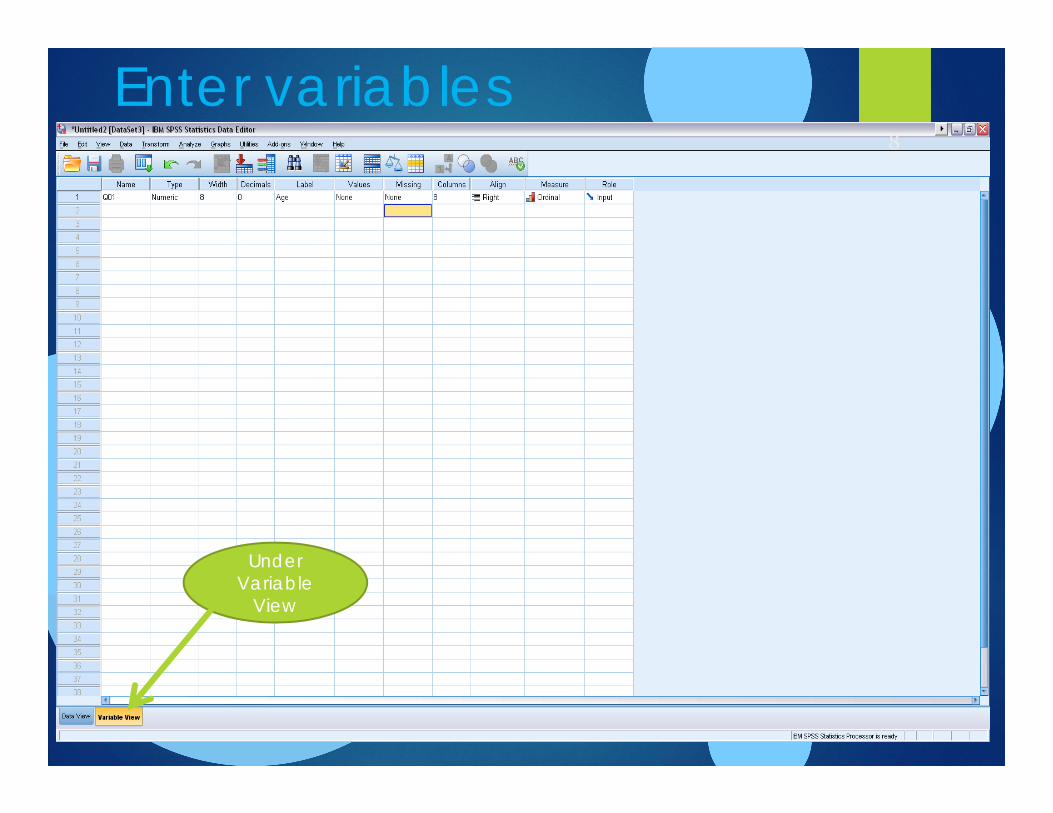
Enter variables8
Under Variable
View
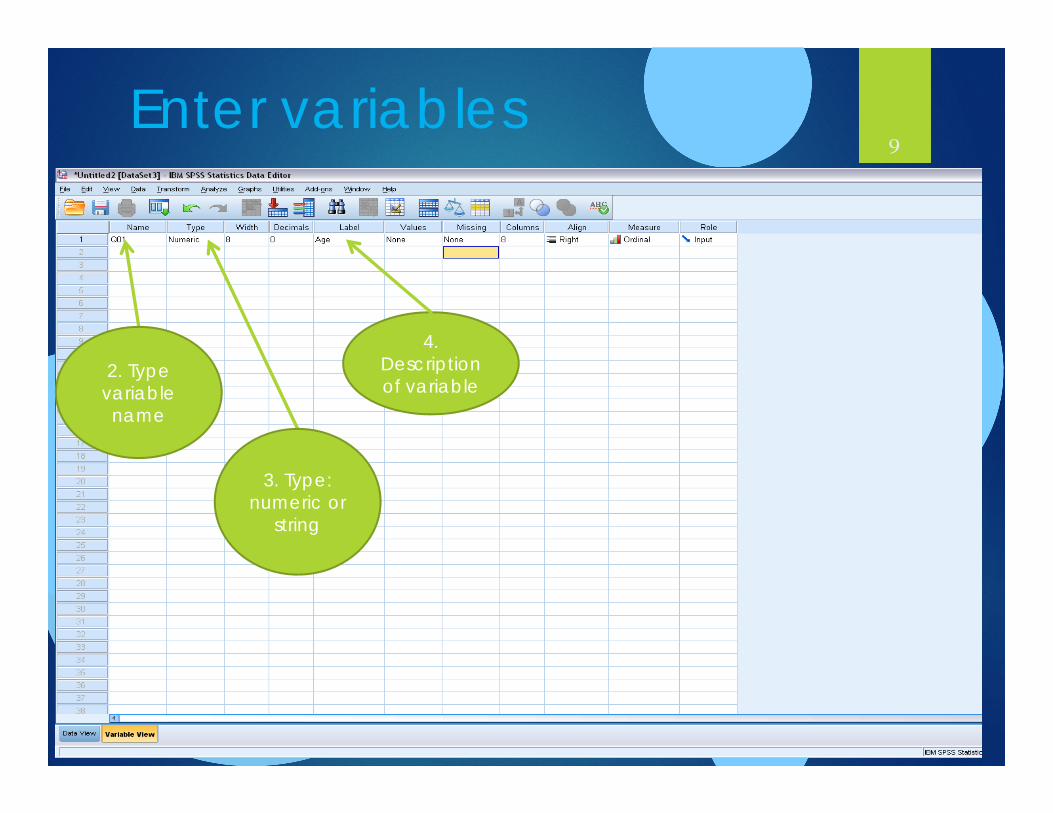
Enter variables9
2. Type variable name
3. Type: numeric or
string
4. Description of variable
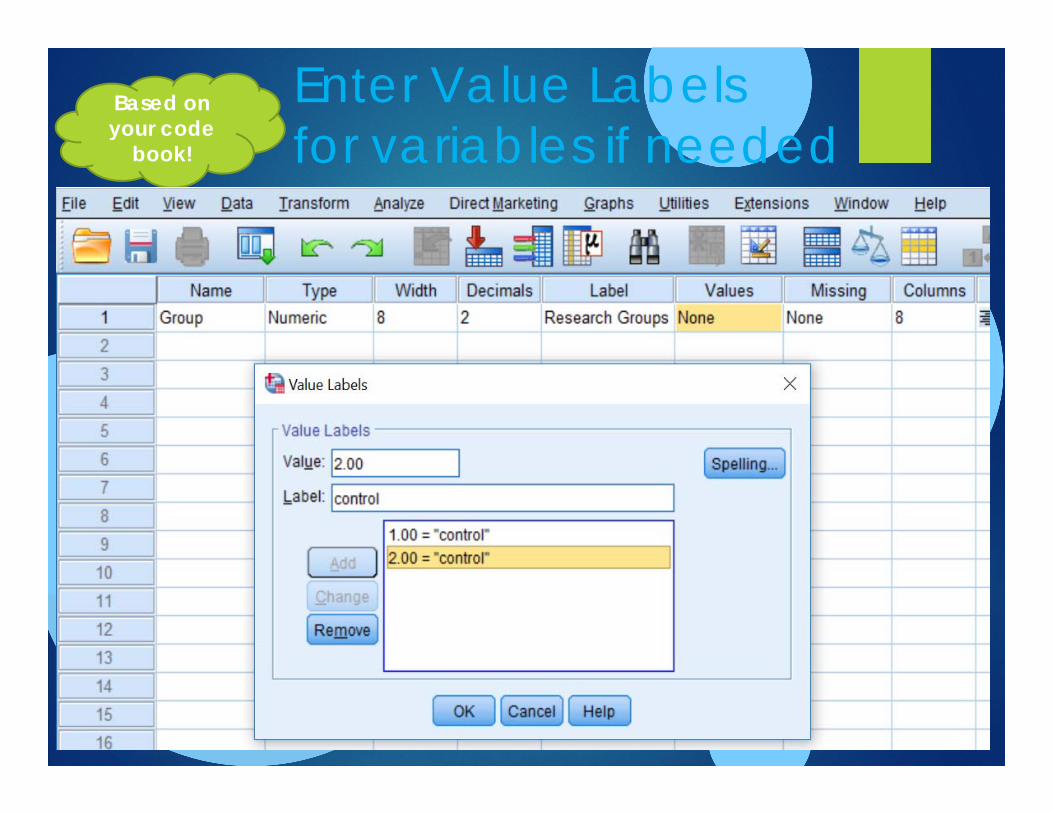
Enter Value Labels for variables if needed
Based on your code
book!
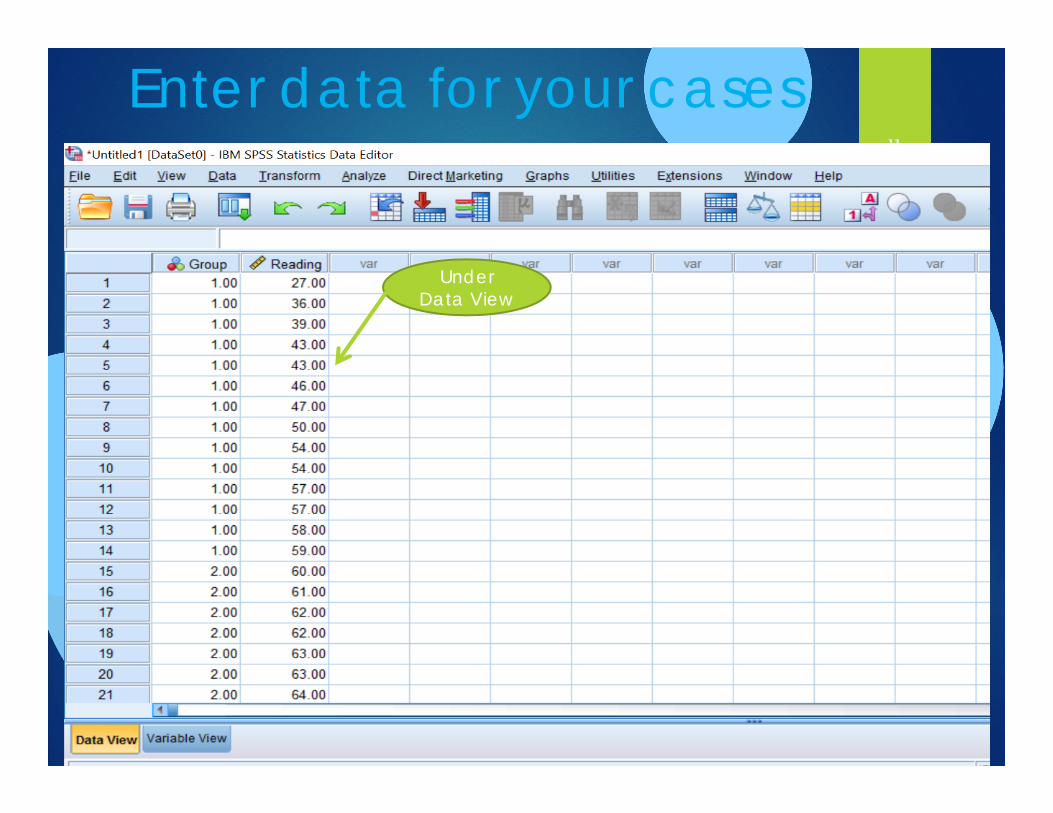
Enter data for your cases11
Under Data View
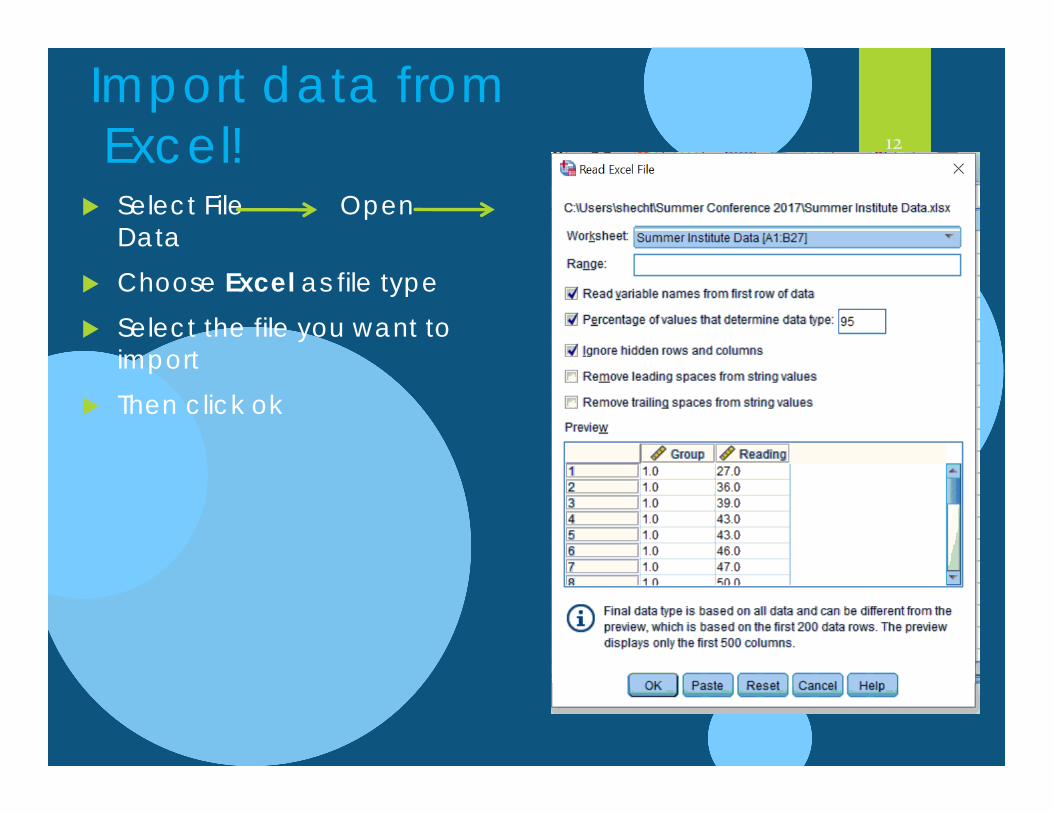
Import data fromExcel!
Select File Open Data
Choose Excel as file type Select the file you want to
import Then click ok
12
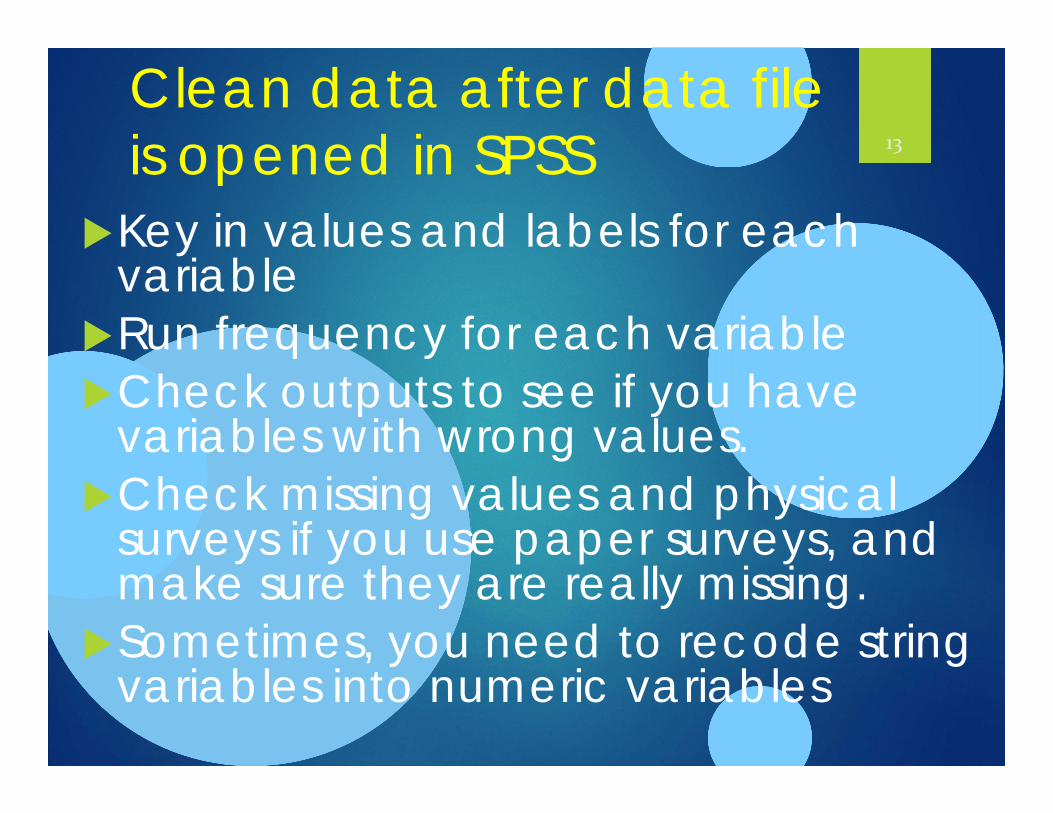
Clean data after data file is opened in SPSS
Key in values and labels for each variable
Run frequency for each variableCheck outputs to see if you have
variables with wrong values.Check missing values and physical
surveys if you use paper surveys, and make sure they are really missing.
Sometimes, you need to recode string variables into numeric variables
13
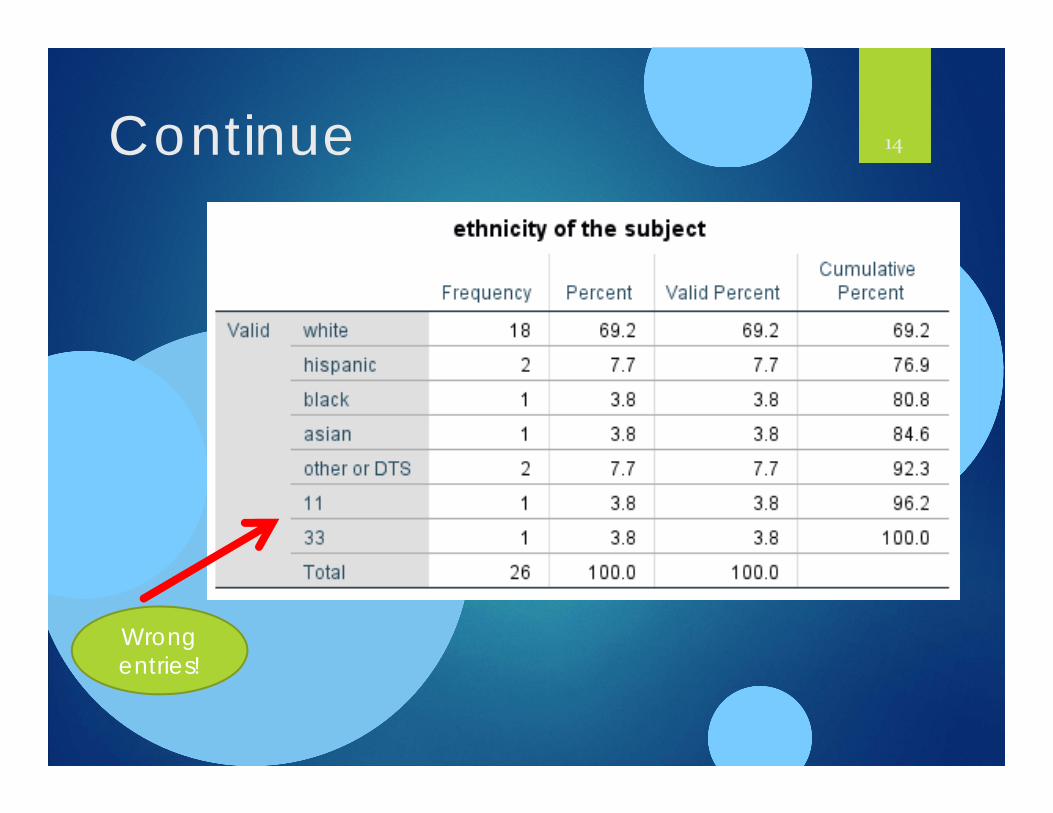
Continue 14
Wrong entries!
Sort and select cases Suppose you had a large dataset and you wanted to explore
a subsample of the data. Let’s use the divorce.sav dataset
One thing you could do is sort the cases and then look at the data.
You could decide to analyze only data from a certain group.
15
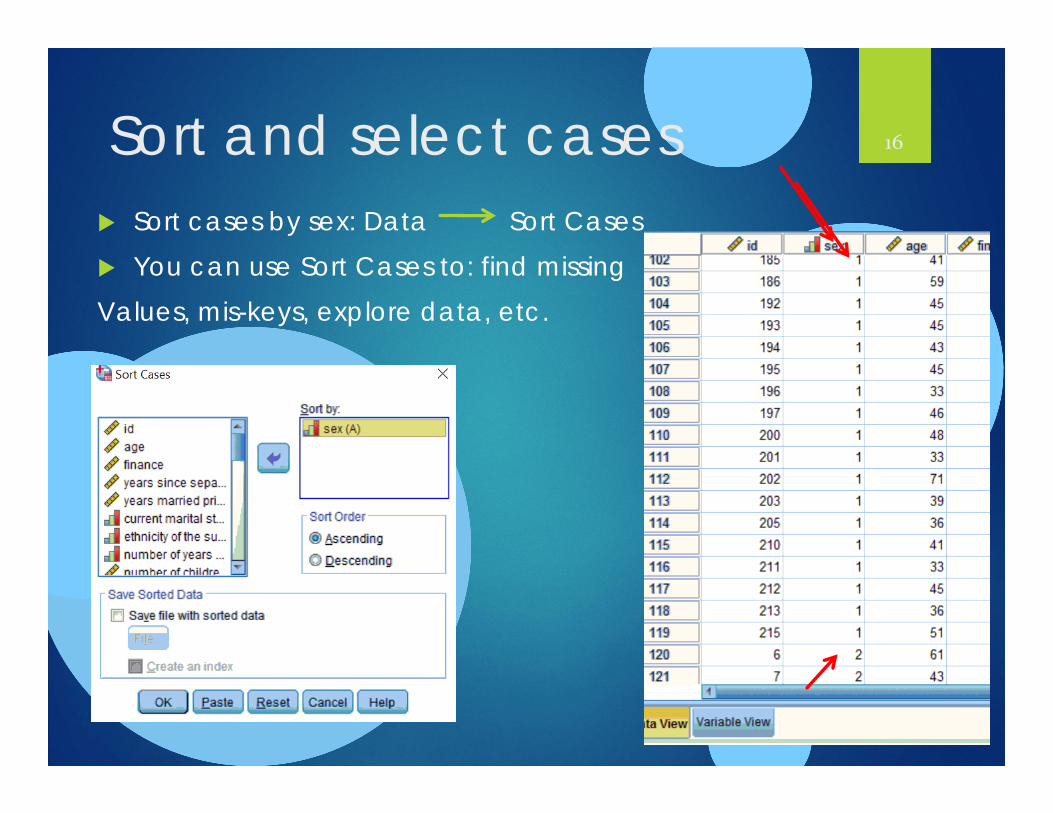
Sort and select cases Sort cases by sex: Data Sort Cases You can use Sort Cases to: find missing Values, mis-keys, explore data, etc.
16
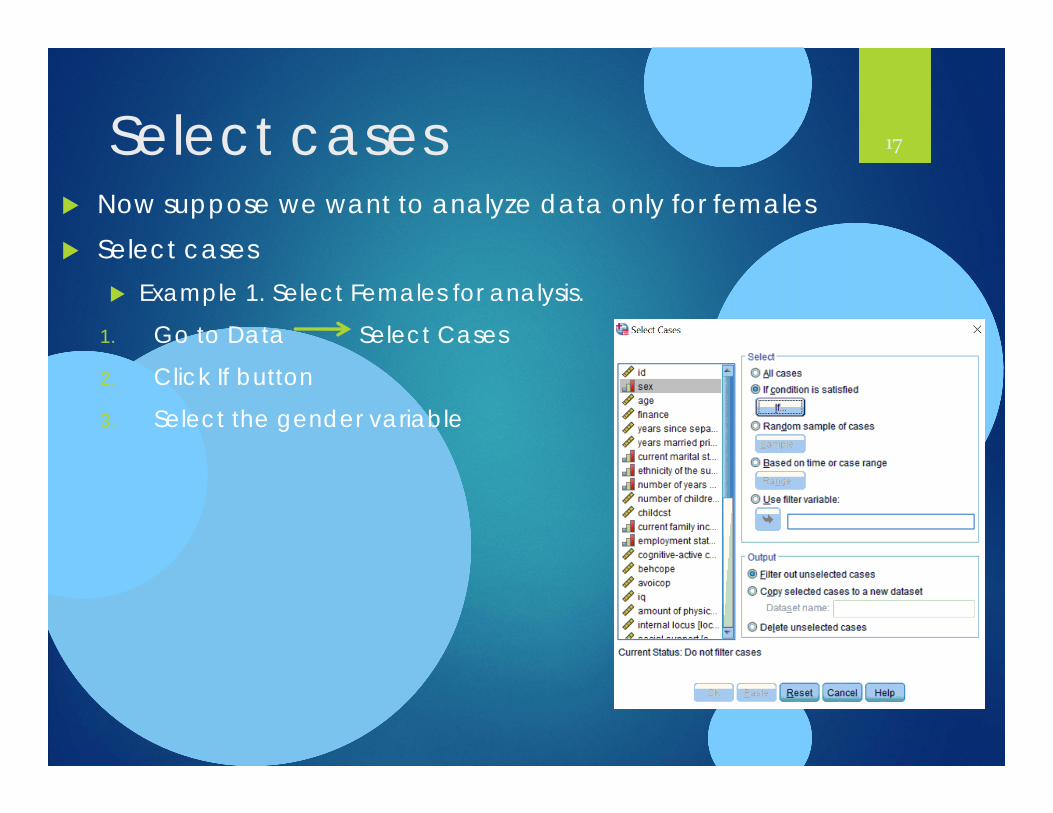
Select cases Now suppose we want to analyze data only for females Select cases
Example 1. Select Females for analysis.
1. Go to Data Select Cases
2. Click If button
3. Select the gender variable
17
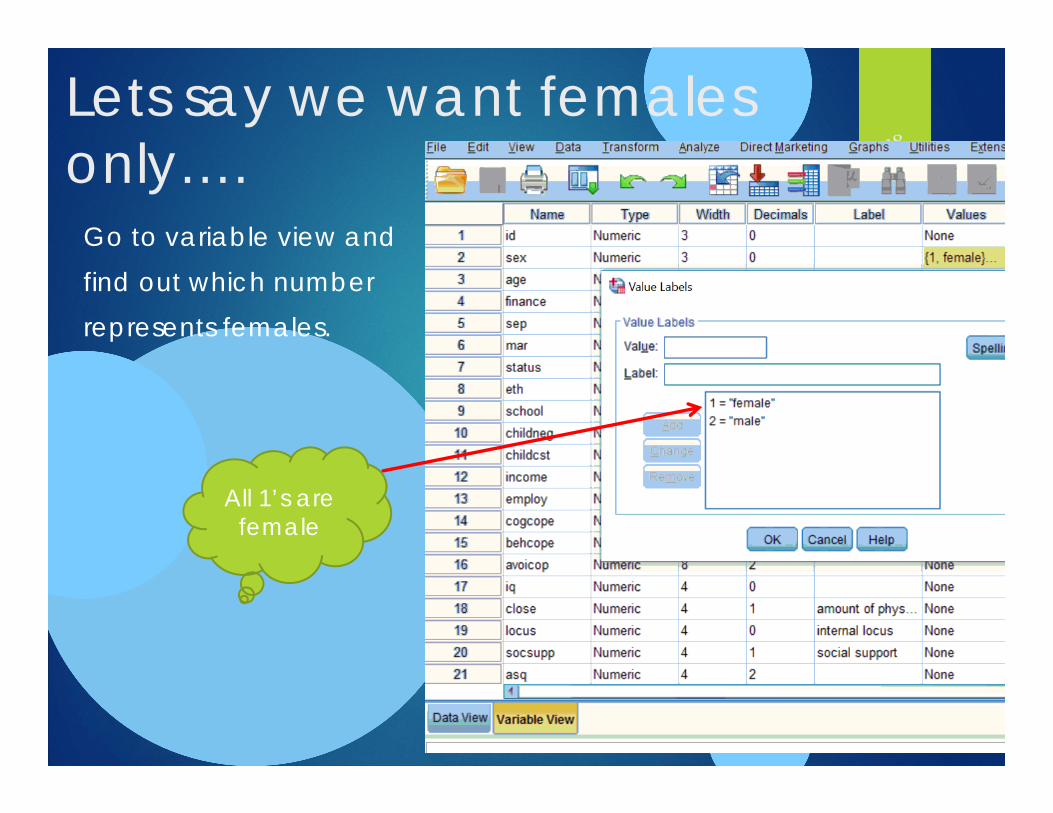
Go to variable view andfind out which number represents females.
18
All 1’s are female
Lets say we want females only….
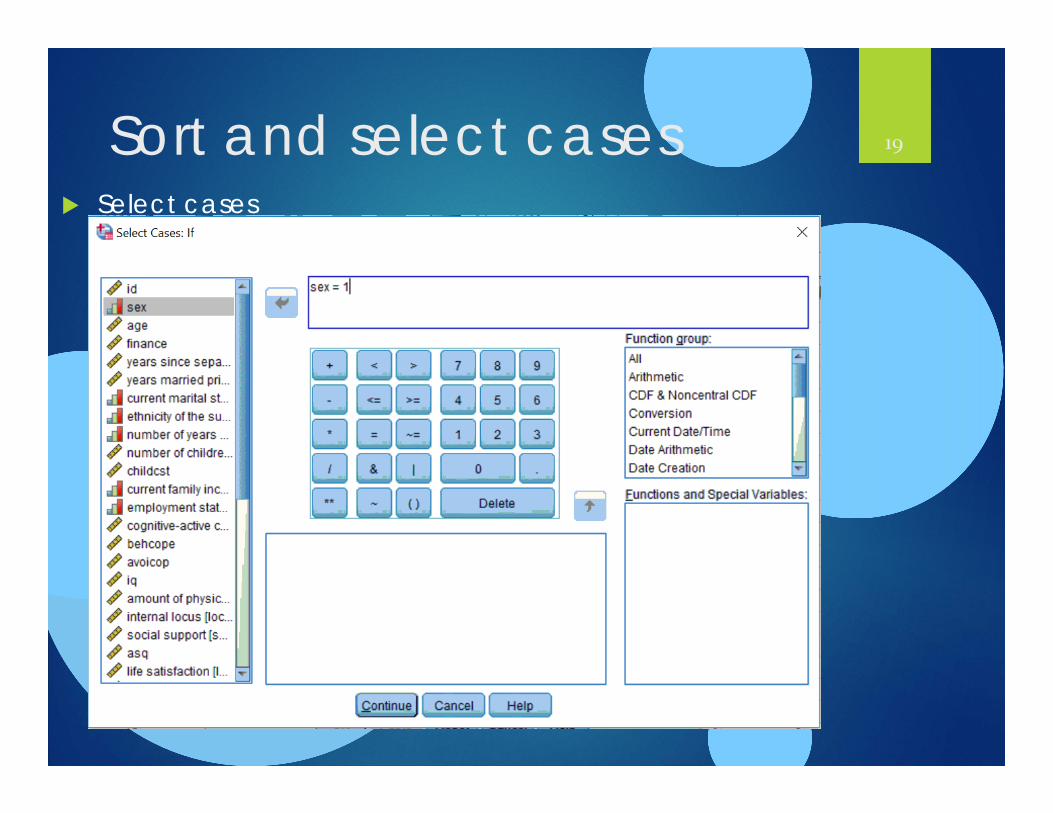
Sort and select cases Select cases
Example 1. Select Females for analysis.
1. Go to Data Select Cases
2. Click If button
3. Select the gender variable
19
Now we can examine data based on gender Descriptive statistics
Purposes:
1. Find wrong entries
2. Have basic knowledge about the sample and targeted variables in a study
3. Summarize data
Analyze Descriptive statistics Frequency
20
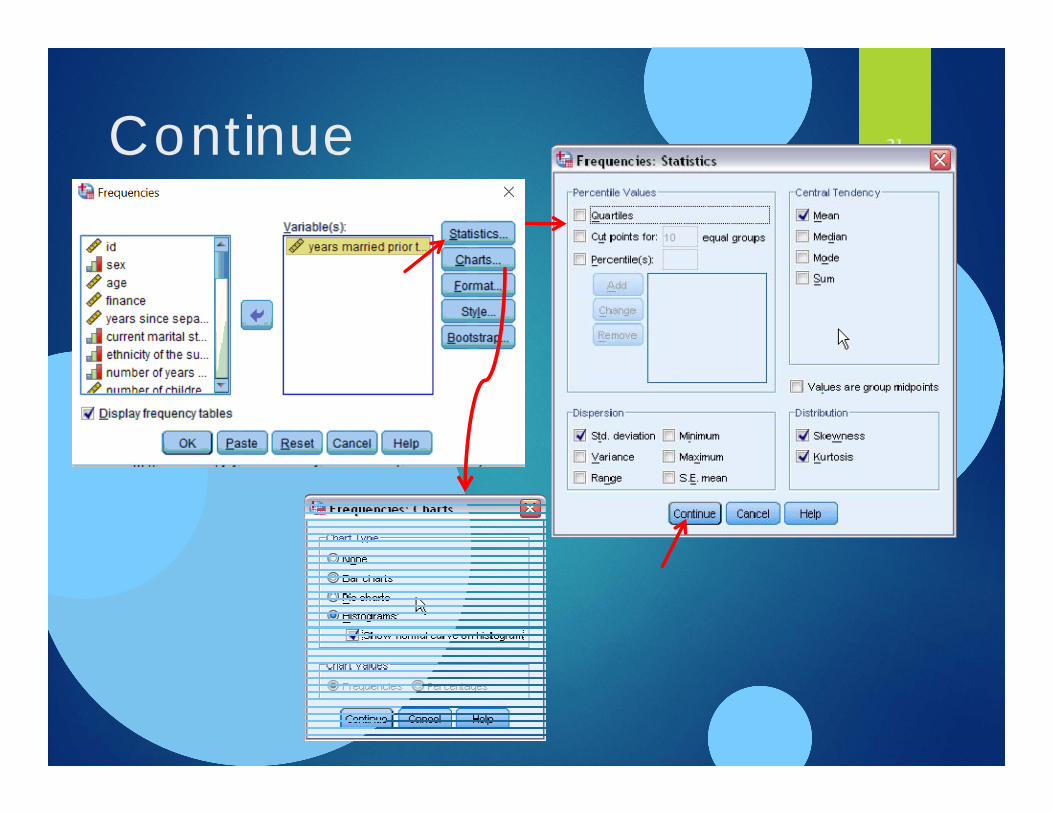
Continue 21
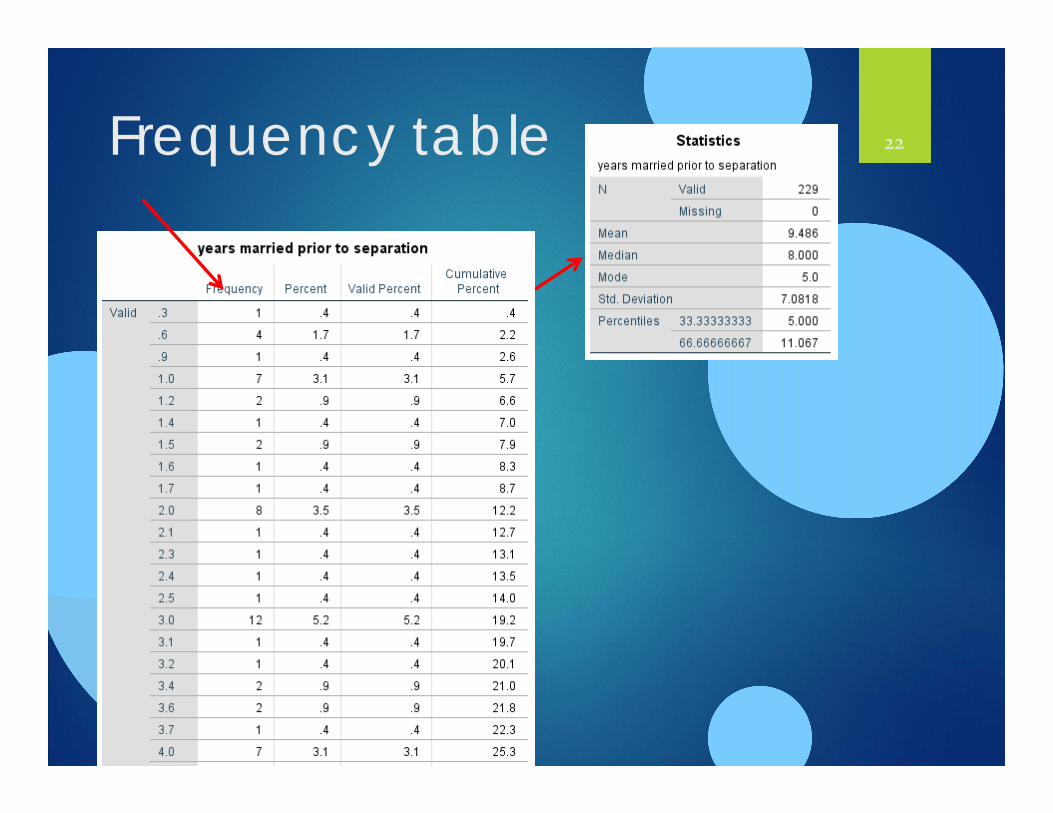
Frequency table 22
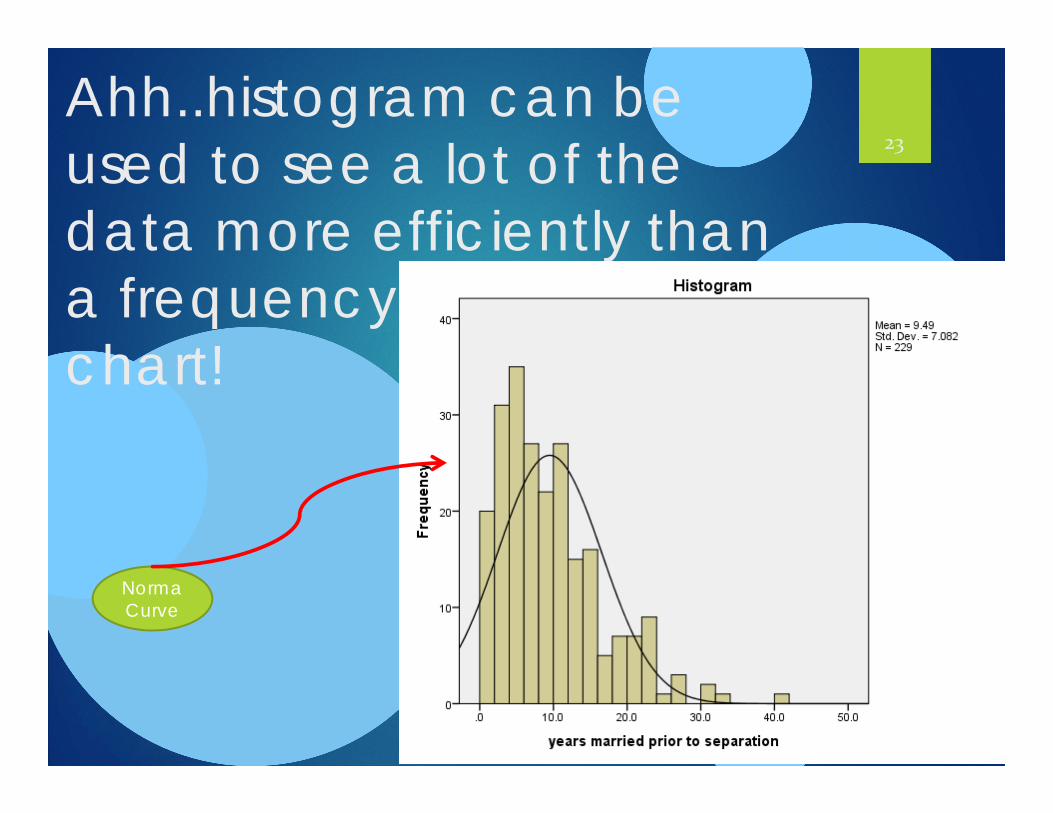
Ahh..histogram can be used to see a lot of the data more efficiently than a frequencychart!
23
NormaCurve

Any Questions?
24

Please sign in and include your name and email address in your best handwriting so that I can email you these notes!
25